The Private Sector Credit Growth, & Cytonn Weekly #46/2023
By Research Team, Nov 19, 2023
Executive Summary
Fixed Income
During the week, T-bills were oversubscribed for the third consecutive week, with the overall subscription rate coming in at 208.3%, albeit lower than the oversubscription rate of 255.6% recorded the previous week. Investors’ preference for the shorter 91-day paper persisted, with the paper receiving bids worth Kshs 37.7 bn against the offered Kshs 4.0 bn, translating to an oversubscription rate of 942.7%, higher than the oversubscription rate of 931.4% recorded the previous week. The subscription rates for the 182-day and 364-day papers decreased to 94.0% and 28.9%, from 185.9% and 55.1% respectively, recorded the previous week. The government accepted a total of Kshs 45.3 bn worth of bids out of Kshs 50.0 bn of bids received, translating to an acceptance rate of 90.7%. The yields on the government papers were on an upward trajectory, with the yields on the 364-day, 182-day and 91-day papers increasing by 2.3 bps, 2.2 bps and 7.6 bps to 15.6%, 15.4% and 15.4%, respectively;
During the week, the Energy and Petroleum Regulatory Authority (EPRA) released their monthly statement on the maximum retail fuel prices in Kenya, effective from 15th November 2023 to 14th December 2023. Notably, the price for super petrol remained unchanged from the October price and will retail at Kshs 217.4 per litre. However, fuel prices for Diesel and Kerosene decreased by 1.9% and 1.0% to Kshs 203.5 and Kshs 203.1 respectively, from Kshs 205.5 and Kshs 205.1 per litre for Diesel and Kerosene respectively;
Also during the week, The International Monetary Fund (IMF) reached a staff-level agreement with the Kenyan authorities for the sixth reviews of Kenya’s economic program supported by the IMF’s Extended Fund Facility (EFF) and Extended Credit Facility (ECF), and the first Review under the Resilience Sustainability Facility (RSF). These arrangements were initiated to support Kenya's sustained economic growth, macroeconomic stability, and efforts to address climate change impacts. Notably, the discussions took into account Kenya’s request for an augmentation under the EFF/ECF arrangement and the RSF, leading to a potential total commitment of approximately USD 4.4 bn (Kshs. 670.1 bn) over the program's duration. Following the completion of the review by the IMF Executive Board, Kenya stands to gain immediate access to USD 682.3 mn (Kshs. 103.9 bn), marking significant financial support toward the nation's economic programs;
Equities
During the week, the equities market was on an upward trajectory, with NSE 20 gaining the most by 3.7%, while NASI, NSE 25 and NSE 10 gained by 1.7%, 2.4% and 2.3% respectively, taking the YTD performance to losses of 28.9%, 24.6% and 12.1% for NASI, NSE 25, and NSE 20, respectively. The equities market performance was mainly driven by gains recorded by large-cap stocks such as Bamburi, KCB Group and cooperative Bank of 28.4%, 20.6% and 8.9% respectively. The gains were however weighed down by losses recorded by stocks such as EABL and Safaricom of 4.4% and 0.4% respectively;
During the week, Cooperative bank released its Q3’2023 financial results, with its Core Earnings per Share (EPS) increasing by 7.6% to Kshs 3.1, from Kshs 2.9 in recorded in Q3’2022;
Real Estate
During the week, the Kenya National Bureau of Statistics (KNBS) released the Leading Economic Indicators (LEI) September 2023 Report which highlighted that consumption of cement increased by 7.0% to 2.4 mn metric tonnes in Q3’2023 from 2.3 mn metric tonnes in Q2’2023;
In the commercial office sector, International Workplace Group (IWG) plc, a global provider of co-working, office and meeting spaces based in Switzerland announced it has invested USD 850,000.0 (Kshs 127.5 mn) to set up a workplace facility at Global Trade Centre (GTC) Tower, located in Westlands, Nairobi;
In regulated Real Estate Funds sector, under the Real Estate Investment Trusts (REITs) segment, Fahari I-REIT closed the week trading at an average price of Kshs 6.00 per share in the Nairobi Securities Exchange, representing a 0.3% decline from the Kshs 6.02 recorded the previous week;
On the Unquoted Securities Platform as at 27th October 2023, Acorn D-REIT and I-REIT closed the week trading at Kshs 25.3 and Kshs 21.7 per unit, a 26.6% and 8.3% gain for the D-REIT and I-REIT, respectively, from the Kshs 20.0 inception price. In addition, Cytonn High Yield Fund (CHYF) closed the week with an annualized yield of 16.4%, remaining relatively unchanged from the previous week;
Focus of the Week
In many economies, private sector credit forms a vital component due to its ability to effectively distribute resources for investment, thereby acting as a catalyst for economic expansion. Kenya is no exception to this, as improved access to private sector credit translates to real GDP growth in the country. With the government currently seeking to narrow its fiscal deficit, creating an enabling environment to spur the growth of the private sector, especially the micro, small and medium enterprises, will go a long way in boosting its revenue collection. The government can achieve this is by formulating policies to enhance the credit market as well as establishing sector-specific funds to stimulate business growth in key areas of the economy such as finance and insurance, agriculture, manufacturing, transport, and communication. The banking sector remains the largest contributor of credit to private businesses, contributing Kshs 3.6 tn as of July 2023, out of the total Kshs 4.4 tn extended to the private sector for the period, with the largest allocations to trade, manufacturing, and private households at 17.0%, 15.7%, and 14.5% respectively. In the year 2022, the domestic credit extended to the private sector by banks as a percentage of GDP stood at 31.5%, well above the Sub-Saharan Africa average of 27.4%, albeit lower than that of Mauritius and South Africa at 79.4% and 58.6% respectively. From the above statistics, it is evident that the country needs to work on improving credit access for the private sector as well as diversifying the sources of credit to avoid overreliance on the banking sector;
Investment Updates:
- Weekly Rates:
- Cytonn Money Market Fund closed the week at a yield of 14.93% p.a To invest, dial *809# or download the Cytonn App from Google Playstore here or from the Appstore here;
- Cytonn High Yield Fund closed the week at a yield of 16.41% p.a. To invest, email us at sales@cytonn.com and to withdraw the interest, dial *809# or download the Cytonn App from Google Playstore here or from the Appstore here;
- We continue to offer Wealth Management Training every Monday, from 9:00 am to 11:00 am. The training aims to grow financial literacy among the general public. To register for any of our Wealth Management Trainings, click here;
- If interested in our Private Wealth Management Training for your employees or investment group, please get in touch with us through wmt@cytonn.com;
- Cytonn Insurance Agency acts as an intermediary for those looking to secure their assets and loved ones’ future through insurance namely; Motor, Medical, Life, Property, WIBA, Credit and Fire and Burglary insurance covers. For assistance, get in touch with us through insuranceagency@cytonn.com;
- Cytonn Asset Managers Limited (CAML) continues to offer pension products to meet the needs of both individual clients who want to save for their retirement during their working years and Institutional clients that want to contribute on behalf of their employees to help them build their retirement pot. To more about our pension schemes, kindly get in touch with us through pensions@cytonn.com;
Real Estate Updates:
- For more information on Cytonn’s real estate developments, email us at sales@cytonn.com;
- Phase 3 of The Alma is now ready for occupation and the show house is open daily. To join the waiting list to rent, please email properties@cytonn.com;
- For Third Party Real Estate Consultancy Services, email us at rdo@cytonn.com;
- For recent news about the group, see our news section here;
Hospitality Updates:
- We currently have promotions for Staycations. Visit cysuites.com/offers for details or email us at sales@cysuites.com;
Money Markets, T-Bills Primary Auction:
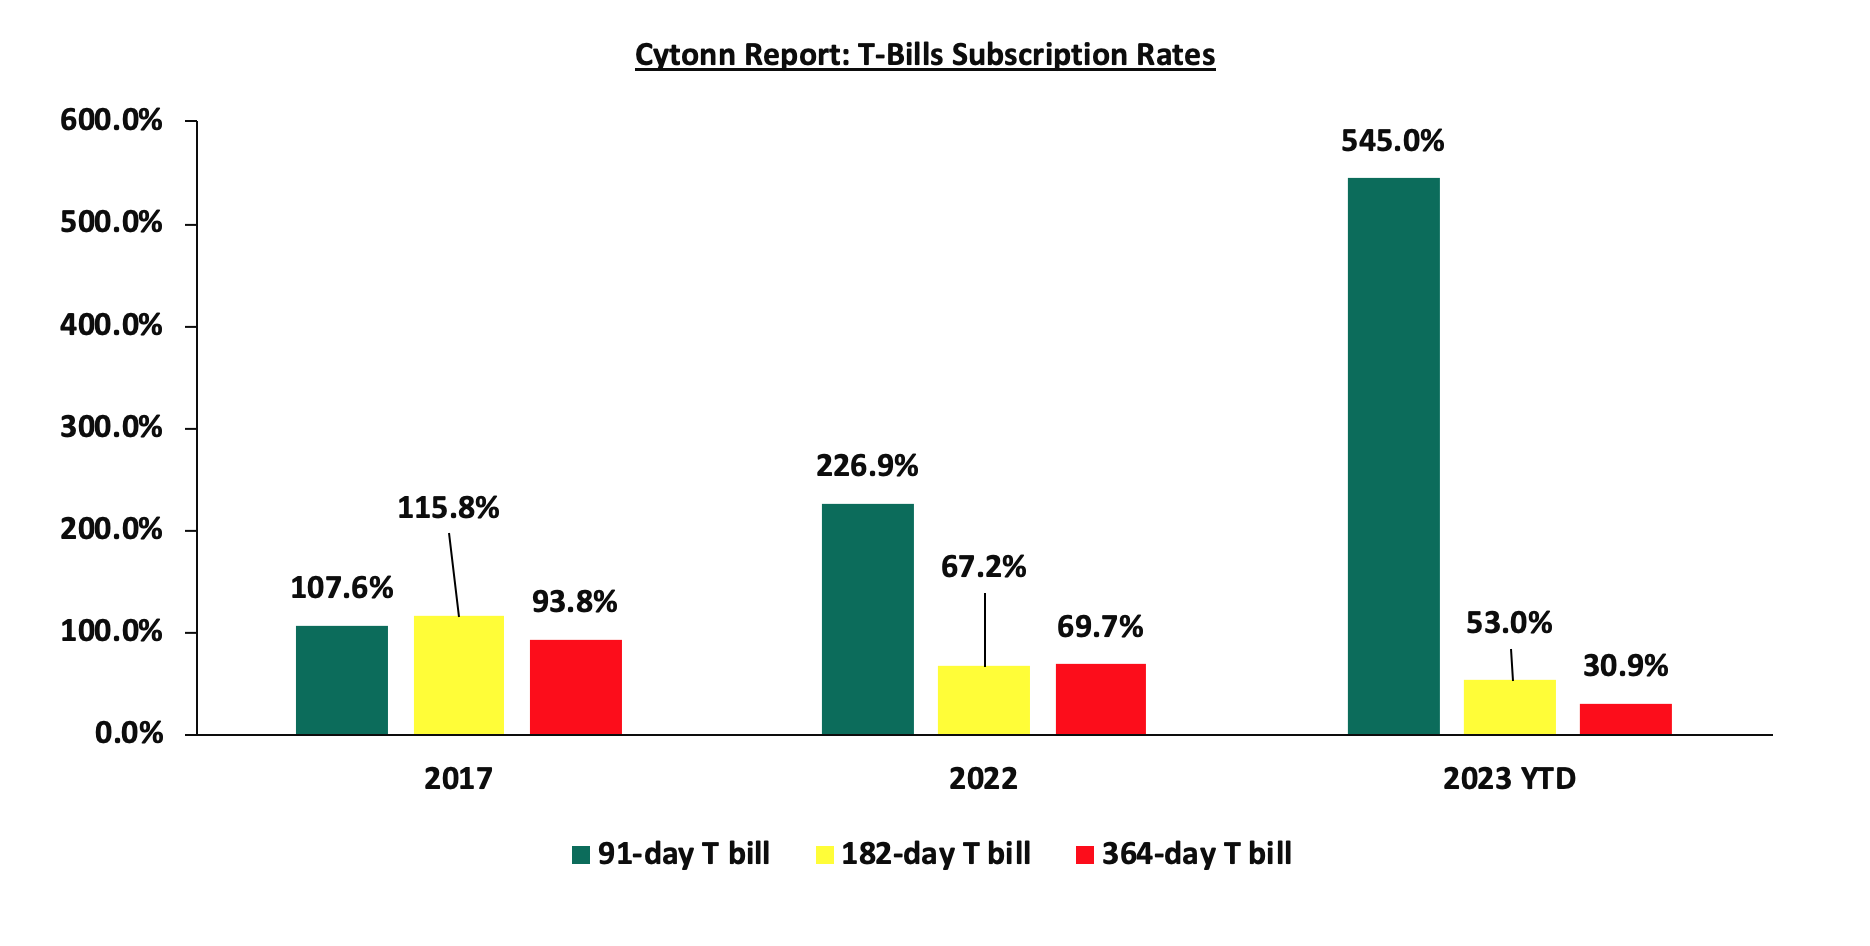
During the week, T-bills were oversubscribed for the third consecutive week, with the overall subscription rate coming in at 208.3%, albeit lower than the oversubscription rate of 255.6% recorded the previous week. Investors’ preference for the shorter 91-day paper persisted, with the paper receiving bids worth Kshs 37.7 bn against the offered Kshs 4.0 bn, translating to an oversubscription rate of 942.7%, higher than the oversubscription rate of 931.4% recorded the previous week. The subscription rates for the 182-day and 364-day papers decreased to 94.0% and 28.9%, from 185.9% and 55.1% respectively, recorded the previous week. The government accepted a total of Kshs 45.3 bn worth of bids out of Kshs 50.0 bn of bids received, translating to an acceptance rate of 90.7%. The yields on the government papers were on an upward trajectory, with the yields on the 364-day, 182-day and 91-day papers increasing by 2.3 bps, 2.2 bps and 7.6 bps to 15.6%, 15.4% and 15.4%, respectively. The chart below compares the overall average T- bills subscription rates obtained in 2017, 2022 and 2023 Year to Date (YTD):
Money Market Performance:
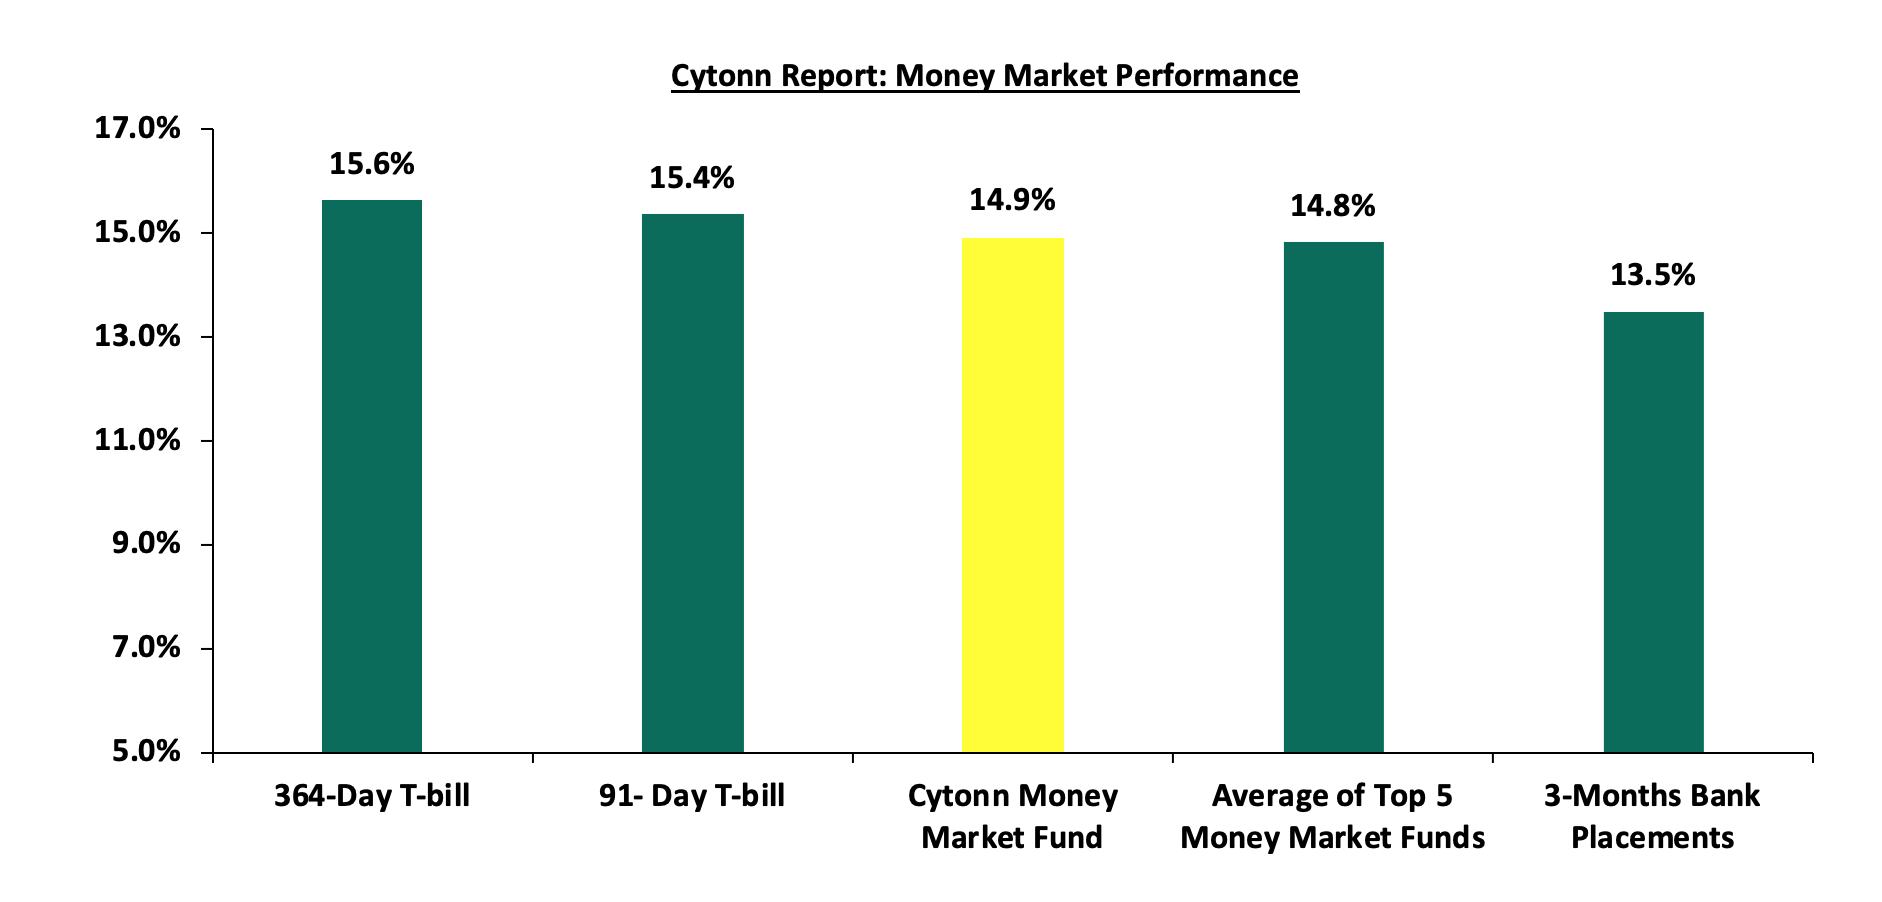
In the money markets, 3-month bank placements ended the week at 13.5% (based on what we have been offered by various banks), and the yields on the 364-day and 91-day T-bill increased by 2.3 bps and 7.6 bps to 15.6% and 15.4%, respectively. The yields of the Cytonn Money Market Fund increased by 34.0 bps to 14.9% from 14.6% recorded the previous week, and the average yields on the Top 5 Money Market Funds increased by 28.8 bps to 14.8%, from 14.5% recorded the previous week.
The table below shows the Money Market Fund Yields for Kenyan Fund Managers as published on 17th November 2023:
|
Cytonn Report: Money Market Fund Yield for Fund Managers as published on 17th November 2023 |
||
|
Rank |
Fund Manager |
Effective Annual |
|
1 |
Lofty-Corban Money Market Fund |
15.0% |
|
2 |
Cytonn Money Market Fund (Dial *809# or download Cytonn App) |
14.9% |
|
3 |
GenAfrica Money Market Fund |
14.9% |
|
4 |
Etica Money Market Fund |
14.9% |
|
5 |
Enwealth Money Market Fund |
14.5% |
|
6 |
AA Kenya Shillings Fund |
13.8% |
|
7 |
Madison Money Market Fund |
13.7% |
|
8 |
Nabo Africa Money Market Fund |
13.6% |
|
9 |
Jubilee Money Market Fund |
13.5% |
|
10 |
Kuza Money Market fund |
13.1% |
|
11 |
Co-op Money Market Fund |
13.1% |
|
12 |
Apollo Money Market Fund |
13.0% |
|
13 |
Sanlam Money Market Fund |
13.0% |
|
14 |
GenCap Hela Imara Money Market Fund |
12.8% |
|
15 |
Old Mutual Money Market Fund |
12.7% |
|
16 |
Absa Shilling Money Market Fund |
12.4% |
|
17 |
KCB Money Market Fund |
12.1% |
|
18 |
Dry Associates Money Market Fund |
11.7% |
|
19 |
CIC Money Market Fund |
11.6% |
|
20 |
Equity Money Market Fund |
11.5% |
|
21 |
ICEA Lion Money Market Fund |
11.4% |
|
22 |
Orient Kasha Money Market Fund |
11.0% |
|
23 |
Mali Money Market Fund |
10.4% |
|
24 |
British-American Money Market Fund |
9.6% |
Source: Business Daily
Liquidity:
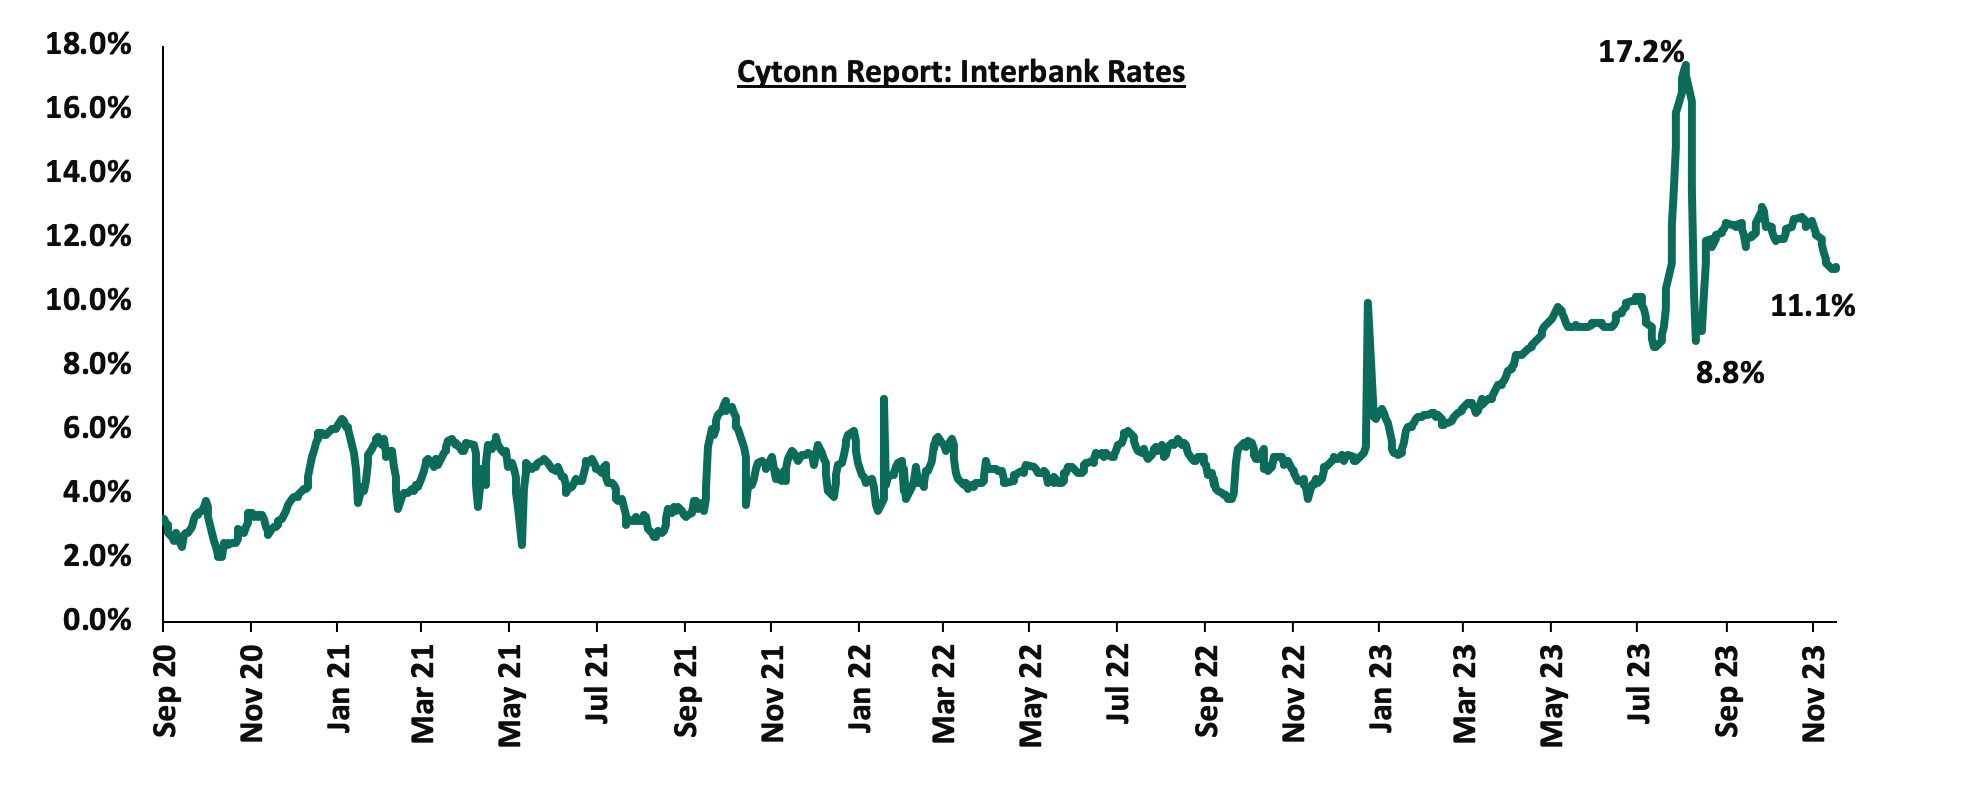
During the week, liquidity in the money markets eased, with the average interbank rate decreasing to 11.0% from 11.6% recorded the previous week, partly attributable to government payments that offset tax remittances. The average interbank volumes traded increased by 79.3% to Kshs 23.4 bn from Kshs 13.0 bn recorded the previous week. The chart below shows the interbank rates in the market over the years:
Kenya Eurobonds:
During the week, the yields on Eurobonds were on a downward trajectory, with the yield on the 10-year Eurobond issued in 2014 decreasing the most by 1.4% points to 14.1%, from 15.5% recorded the previous week. The table below shows the summary of the performance of the Kenyan Eurobonds as of 16th November 2023;
|
Cytonn Report: Kenya Eurobonds Performance |
||||||
|
|
2014 |
2018 |
2019 |
2021 |
||
|
Tenor |
10-year issue |
10-year issue |
30-year issue |
7-year issue |
12-year issue |
12-year issue |
|
Amount Issued (USD) |
2.0 bn |
1.0 bn |
1.0 bn |
0.9 bn |
1.2 bn |
1.0 bn |
|
Years to Maturity |
0.6 |
4.3 |
24.3 |
3.5 |
8.5 |
10.6 |
|
Yields at Issue |
6.6% |
7.3% |
8.3% |
7.0% |
7.9% |
6.2% |
|
02-Jan-23 |
12.9% |
10.5% |
10.9% |
10.9% |
10.8% |
9.9% |
|
01-Nov-23 |
14.6% |
13.1% |
12.0% |
13.5% |
12.5% |
11.8% |
|
9-Nov-23 |
15.5% |
12.7% |
11.7% |
13.1% |
12.0% |
11.3% |
|
10-Nov-23 |
15.7% |
12.9% |
11.8% |
13.5% |
12.2% |
11.5% |
|
13-Nov-23 |
16.0% |
13.0% |
11.9% |
13.7% |
12.3% |
11.6% |
|
14-Nov-23 |
15.6% |
12.8% |
11.8% |
13.5% |
12.2% |
11.4% |
|
15-Nov-23 |
15.6% |
12.8% |
11.8% |
13.3% |
12.2% |
11.5% |
|
16-Nov-23 |
14.1% |
12.5% |
11.6% |
12.9% |
12.0% |
11.3% |
|
Weekly Change |
(1.4%) |
(0.2%) |
(0.0%) |
(0.2%) |
0.0% |
(0.0%) |
|
MTD Change |
(0.6%) |
(0.6%) |
(0.4%) |
(0.6%) |
(0.5%) |
(0.6%) |
|
YTD Change |
(1.2%) |
(2.0%) |
(0.8%) |
(2.0%) |
(1.2%) |
(1.4%) |
Source: Central Bank of Kenya (CBK) and National Treasury
Kenya Shilling:
During the week, the Kenya Shilling depreciated against the US Dollar by 0.4% to close at Kshs 152.2, from Kshs 151.7 recorded the previous week. On a year-to-date basis, the shilling has depreciated by 23.3% against the dollar, adding to the 9.0% depreciation recorded in 2022. We expect the shilling to remain under pressure in 2023 as a result of:
- An ever-present current account deficit which came at 3.7% of GDP in Q2’2023 from 6.0% recorded in a similar period last year,
- The need for government debt servicing, continues to put pressure on forex reserves given that 67.1% of Kenya’s external debt was US Dollar denominated as of June 2023, and,
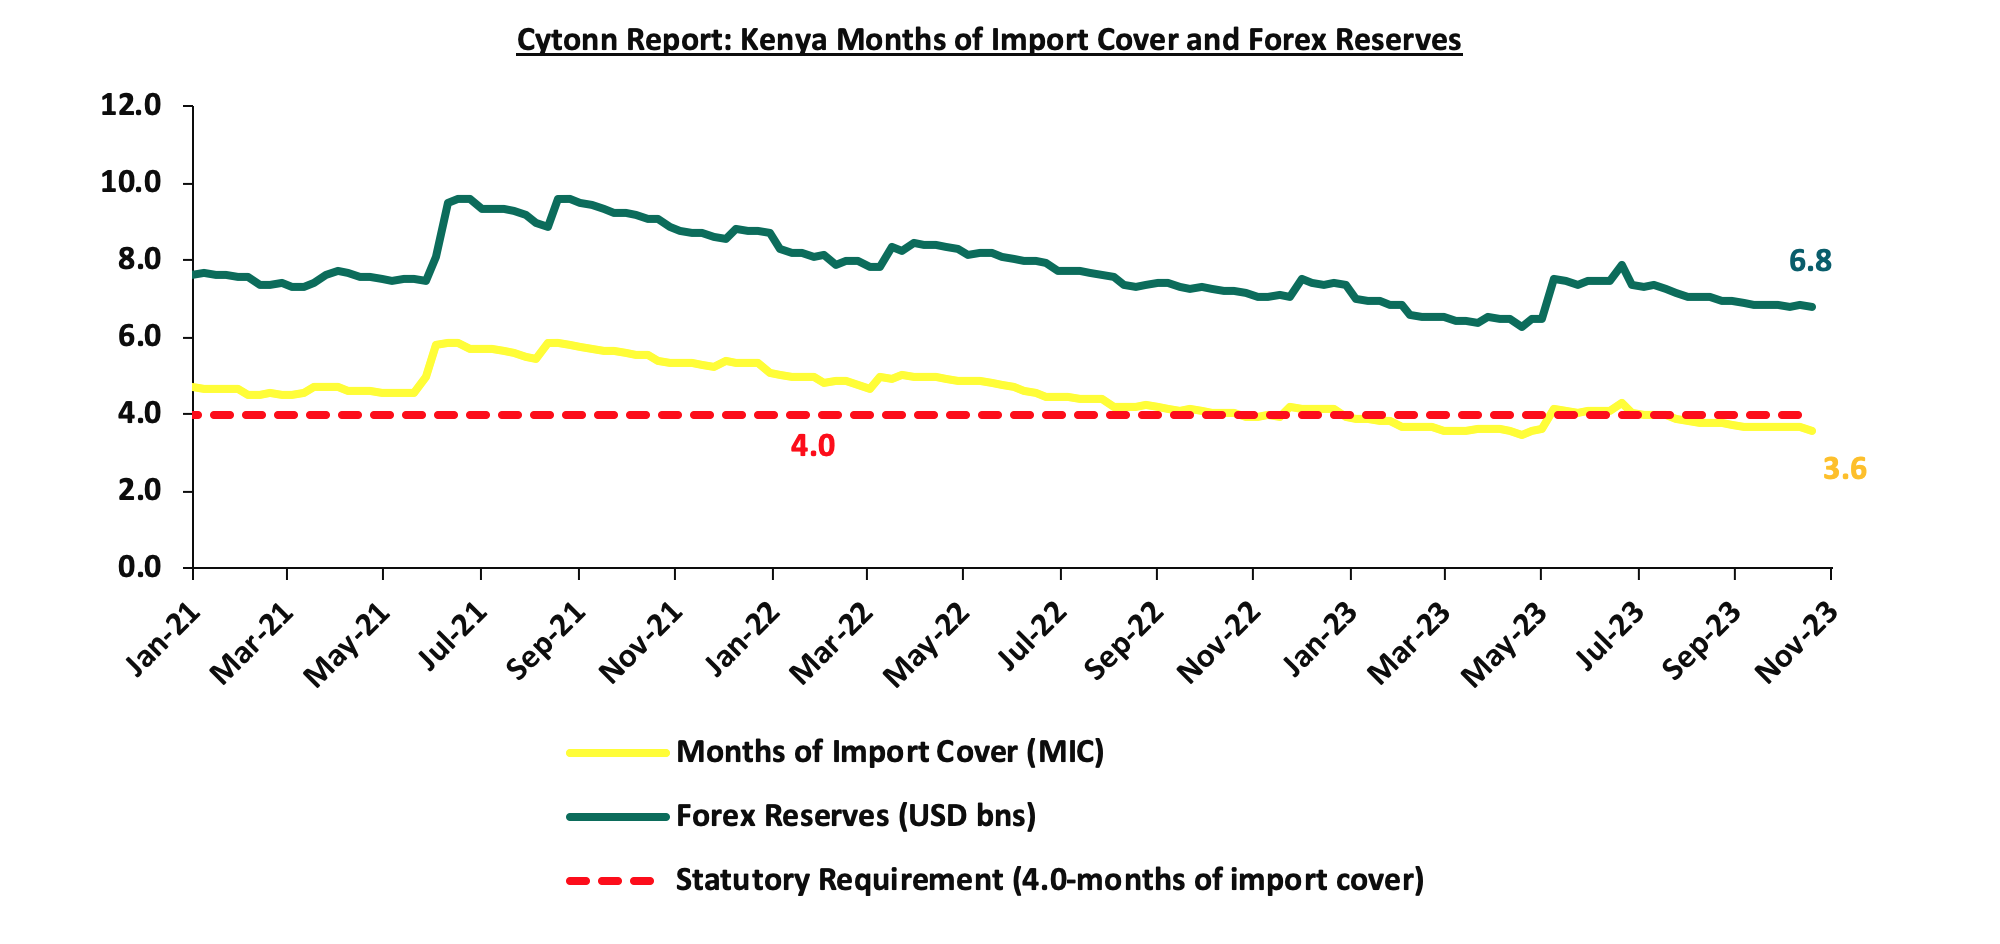
- Dwindling forex reserves currently at USD 6.8 bn (equivalent to 3.6-months of import cover), which is below the statutory requirement of maintaining at least 4.0-months of import cover.
The shilling is however expected to be supported by:
- Diaspora remittances standing at a cumulative USD 3,462.4 mn as of October 2023, 4.1%% higher than the USD 3,325.1 mn recorded over the same period in 2022, which has continued to cushion the shilling against further depreciation. In the October 2023 diaspora remittances figures, North America remained the largest source of remittances to Kenya accounting for 57.0% in the period, and,
- The tourism inflow receipts which came in at USD 268.1 bn in 2022, a significant 82.9% increase from USD 146.5 bn inflow receipts recorded in 2021.
The chart below summarizes the evolution of Kenya months of import cover over the years:
Weekly Highlights:
- Fuel Prices effective 15th November 2023 to 14th December 2023
During the week, the Energy and Petroleum Regulatory Authority (EPRA) released their monthly statement on the maximum retail fuel prices in Kenya, effective from 15th November 2023 to 14th December 2023. Notably, the price for super petrol remained unchanged from the October price and will retail at Kshs 217.4 per litre. However, fuel prices for Diesel and Kerosene decreased by 1.9% and 1.0% to Kshs 203.5 and Kshs 203.1 respectively, from Kshs 205.5 and Kshs 205.1 per litre for Diesel and Kerosene respectively.
Other key take-outs from the performance include;
- The average landing costs per cubic meter for Diesel and super petrol increased by 3.3% and 2.8% to USD 873.4 and USD 827.8 in October 2023, from USD 845.7 and USD 805.1 respectively in September 2023. The average landing costs per cubic meter for Kerosene decreased by 6.3% to USD 813.9 in October 2023, from USD 868.7 in September 2023, and,
- The Kenyan shilling depreciated against the US Dollar by 1.5% to Kshs 155.6 in October 2023, compared to the mean monthly exchange rate of Kshs 153.3 recorded in September 2023.
We note that fuel prices in the country have decreased slightly due to the government's efforts to stabilize pump prices by cushioning consumers from the spike in pump prices due to increased landed costs. The government also on September 2023 made efforts to stabilize fuel prices by extending the existing oil supply deal with the three Gulf-based companies namely; Emirates National Oil Corporation, Abu Dhabi National Oil Corporation and Saudi Aramco until December 2024. The high fuel prices in the country are mainly due to the high cost of fuel imports as a result of the sustained depreciation of the shilling against the US dollar, as well as the high taxation of petroleum products as provided in the Finance Act 2023. We project that fuel prices will drop in the coming months as a result of the continued decline in the global prices of fuel coupled with the government's plans to mitigate the cost of diesel by Kshs 19.8 per litre and Kshs 12.0 per litre for super petrol using the pump price stabilization mechanism as evidenced in the increased budgetary allocation to the State Department for Petroleum in the supplementary budget for stabilization of oil market prices.
- International Monetary Fund (IMF) Loan facility
The International Monetary Fund (IMF), visited Nairobi for the period running from October 30 – November 15, 2023, and held discussions with the Kenyan authorities for the sixth reviews of Kenya’s economic program supported by the IMF’s Extended Fund Facility (EFF) and Extended Credit Facility (ECF), and the first Review under the Resilience Sustainability Facility (RSF).
This follows the fifth reviews completed on 17th July 2023, where the EFF/ECF arrangements were extended by 10 months. The reviews proved fruitful for Kenya, with the country getting approval for USD 551.4 mn (Kshs 78.1 bn) under the RSF programme to support Kenya’s ambitious efforts to build resilience to climate change. Additionally, the Executive Board approved an immediate disbursement of USD 415.4 mn (Kshs 58.9 bn), amount inclusive of USD 110.3 mn (Kshs 15.6 bn) from an augmentation of access.
Under the sixth reviews, the IMF and the Kenyan officials reached a staff-level agreement for an augmentation of USD 938.0 mn (Kshs 142.9 bn) under the EFF/ECF arrangement. If approved by the Executive Board of IMF, the EFF/ECF arrangements, including augmentations, would provide access to a total amount of USD 3.9 bn (Kshs 594.0 bn). Under the EFF/ECF augmentations and the RSF support, the total IMF commitment under these arrangements over the duration of the program would be about USD 4.4 bn (Kshs 670.1 bn).
Upon completion of the sixth reviews by the IMF Executive Board, Kenya would have immediate access to USD 682.3 mn (Kshs 103.9 bn), including USD 619.4 mn (Kshs 94.3 bn) from the augmentation of access under the EFF/ECF arrangements and USD 59.7 mn (Kshs 9.1 bn) from the first review of RSF. This would bring total IMF financial support disbursement under the EFF/ECF to USD 2.7 bn (Kshs 416.6 bn).
While concluding the review, the IMF commended the Central Bank of Kenya’s (CBK’s) steps to modernize the monetary policy framework and improve the functioning of the fixed income market. In particular, the recent introduction of an interest rate corridor centered around the policy rate and initiatives like the DhowCSD are expected to stimulate interbank repos, potentially minimizing market fragmentation.
|
Cytonn Report: International Monetary Fund (IMF) EFF and ECF Financing Programme |
||
|
Date |
Amount Received (USD mn) |
Amount Received (Kshs bn, 1 USD= Kshs 152.1) |
|
Apr-21 |
307.5 |
46.8 |
|
Jun-21 |
407.0 |
61.9 |
|
Dec-21 |
258.1 |
39.3 |
|
Jul-22 |
235.6 |
35.8 |
|
Nov-22 |
433.0 |
65.9 |
|
Jul-23 |
415.4 |
63.2 |
|
Nov-23* |
682.3 |
103.8 |
|
Total Amount Received |
2,738.9 |
416.6 |
|
Amount Pending |
1,141.1 |
173.6 |
|
*Expected funds upon IMF management and executive board disbursement |
||
This comes as a reprieve as Kenya faces the task of repaying the 10-year Eurobond amidst a backdrop of surging yields that have effectively limited access to the market for many frontier economies. In his state of the nation address, President William Ruto committed to an early buy back of a portion of the nation’s USD 2.0 bn (Kshs 304.6 bn) Eurobond, by making a payment of USD 300.0 mn (Kshs 45.7 bn) next month. However, Fitch Ratings warned the country that it may downgrade the nation’s credit rating depending on the portion of foreign reserves it uses to settle payments. In its statement, the credit agency stated that deploying reserves to redeem the Eurobond would reduce import cover which could still contribute to a downgrade of Kenya’s rating. Consequently, the receipt of the Kshs 103.9 bn funds from the IMF would allow Kenya to pay maturing foreign debt without running down its hard currency reserves.
Rates in the Fixed Income market have been on an upward trend given the continued high demand for cash by the government and the occasional liquidity tightness in the money market. The government is 12.8% ahead of its prorated net domestic borrowing target of Kshs 117.2 bn, having a net borrowing position of Kshs 132.2 bn out of the domestic net borrowing target of Kshs 316.0 bn for the FY’2023/2024. Therefore, we expect a continued upward readjustment of the yield curve in the short and medium term, with the government looking to bridge the fiscal deficit through the domestic market. Owing to this, our view is that investors should be biased towards short-term fixed-income securities to reduce duration risk.
Market Performance:
During the week, the equities market was on an upward trajectory, with NSE 20 gaining the most by 3.7%, while NASI, NSE 25 and NSE 10 gained by 1.7%, 2.4% and 2.3% respectively, taking the YTD performance to losses of 28.9%, 24.6% and 12.1% for NASI, NSE 25, and NSE 20, respectively. The equities market performance was mainly driven by gains recorded by large-cap stocks such as Bamburi, KCB Group and cooperative Bank of 28.4%, 20.6% and 8.9% respectively. The gains were however weighed down by losses recorded by stocks such as EABL and Safaricom of 4.4% and 0.4% respectively.
During the week, equities turnover decreased by 72.3% to USD 2.9 mn, from USD 10.4 mn recorded the previous week, taking the YTD total turnover to USD 615.9 mn. Foreign investors remained net sellers for the sixth consecutive week with a net selling position of USD 0.5 mn, from a net selling position of USD 2.1 mn recorded the previous week, taking the YTD foreign net selling position to USD 288.0 mn.
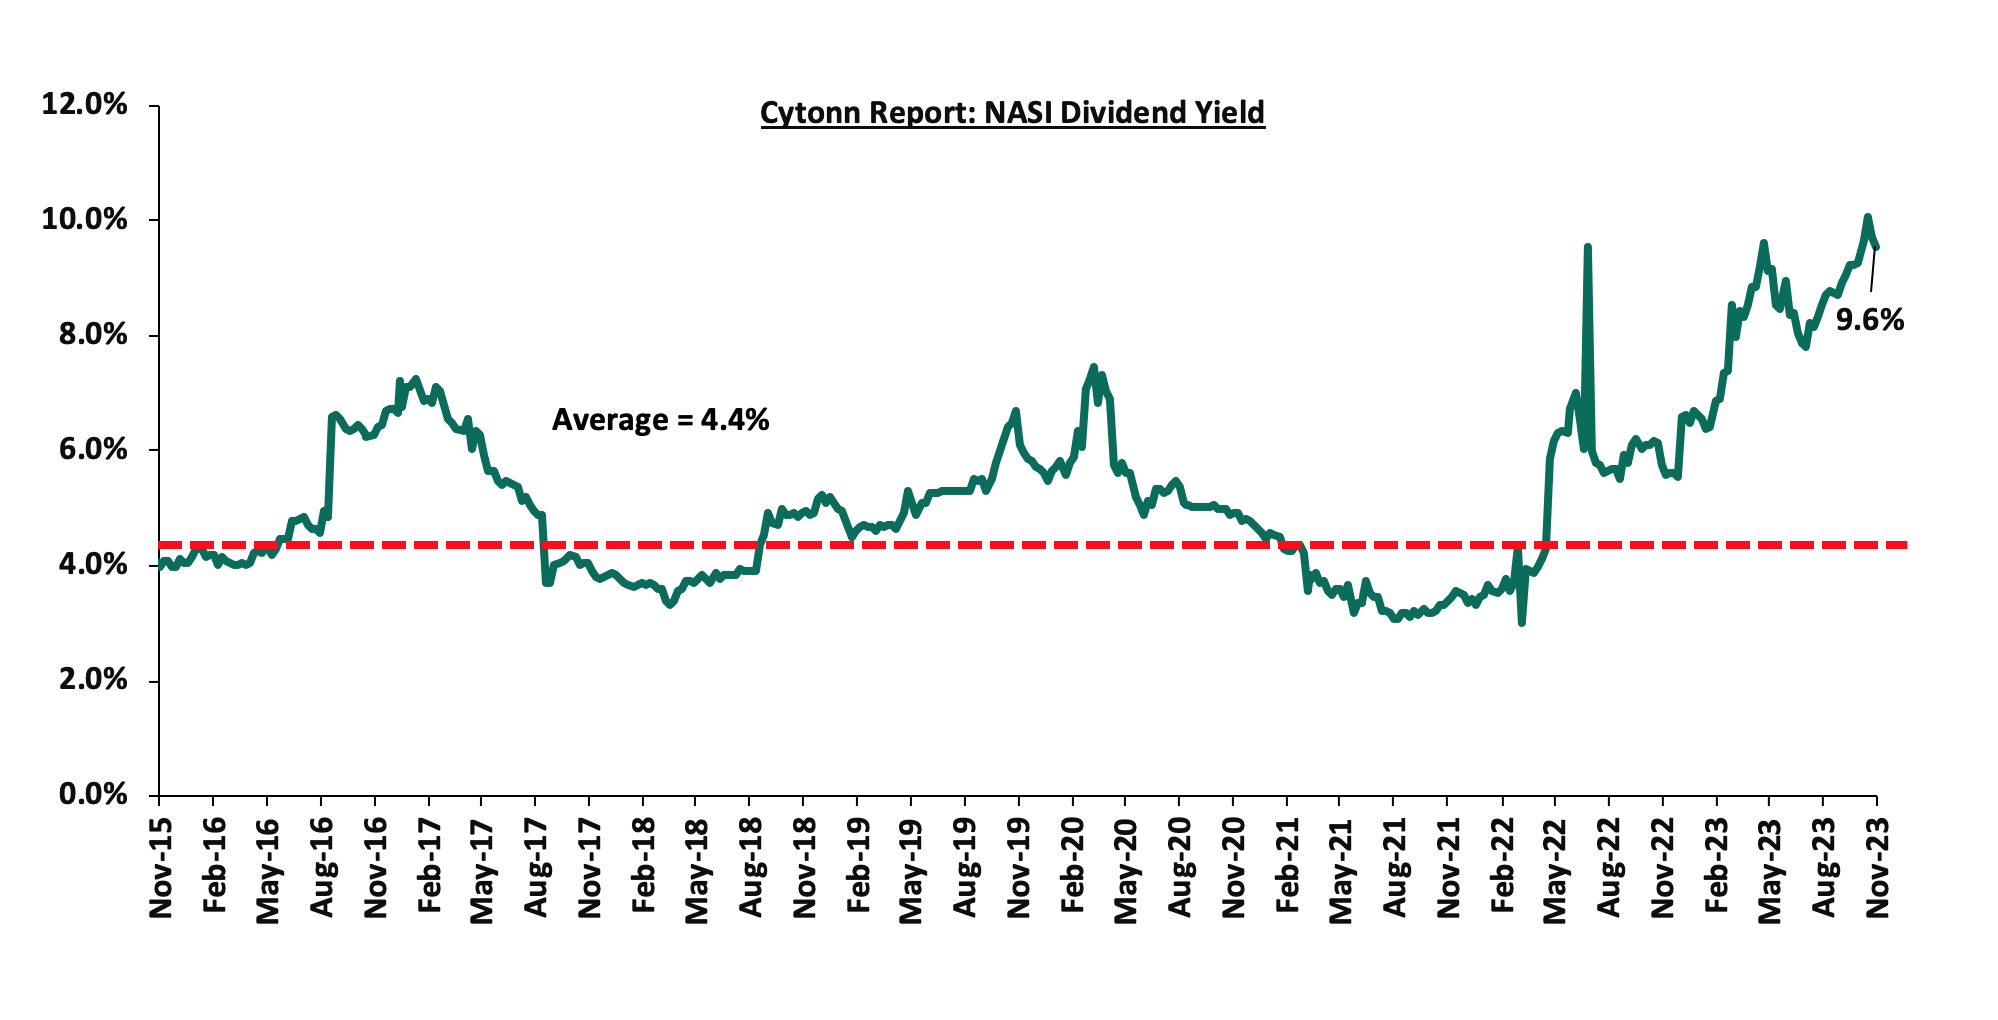
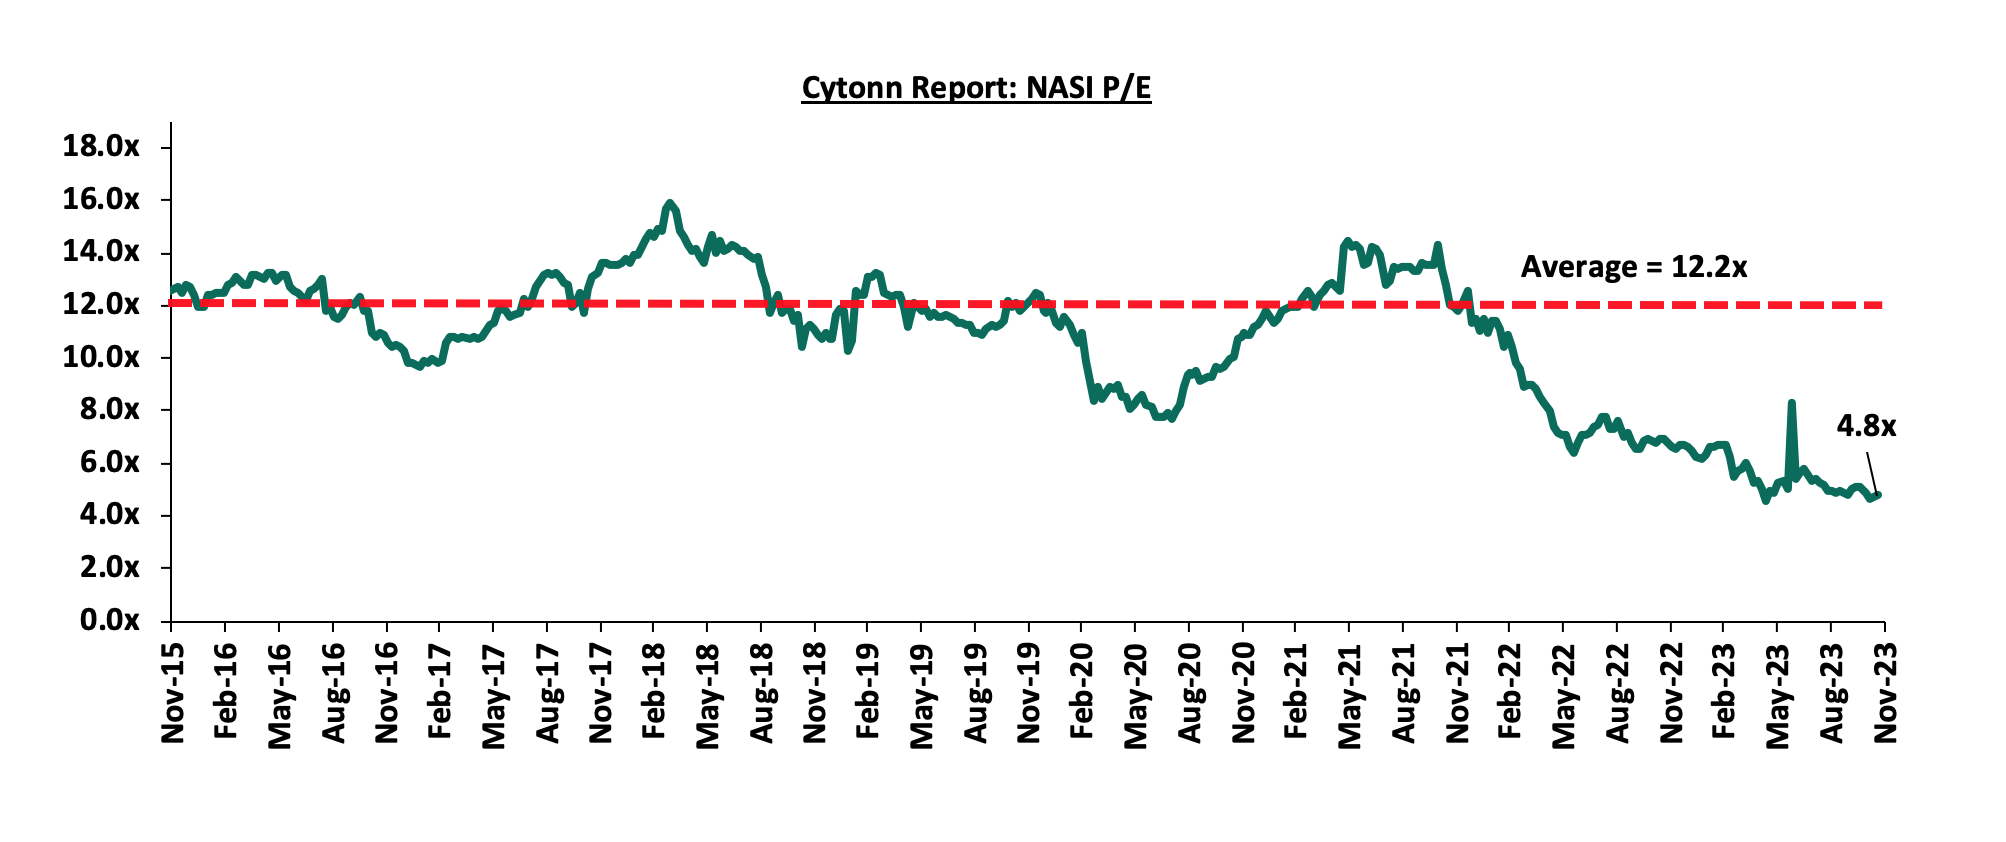
The market is currently trading at a price to earnings ratio (P/E) of 4.8x, 60.5% below the historical average of 12.2x. The dividend yield stands at 9.6%, 5.2% points above the historical average of 4.4%. Key to note, NASI’s PEG ratio currently stands at 0.6x, an indication that the market is undervalued relative to its future growth. A PEG ratio greater than 1.0x indicates the market is overvalued while a PEG ratio less than 1.0x indicates that the market is undervalued. The charts below indicate the historical P/E and dividend yields of the market;
Universe of Coverage:
|
Cytonn Report: Equities Universe of Coverage |
|||||||||
|
Company |
Price as at 10/11/2023 |
Price as at 17/11/2023 |
w/w change |
YTD Change |
Target Price* |
Dividend Yield |
Upside/ Downside** |
P/TBv Multiple |
Recommendation |
|
KCB Group*** |
16.1 |
19.4 |
20.6% |
(49.5%) |
30.7 |
10.3% |
69.0% |
0.3x |
Buy |
|
Liberty Holdings |
3.5 |
3.6 |
2.0% |
(29.2%) |
5.9 |
0.0% |
65.8% |
0.3x |
Buy |
|
Kenya Reinsurance |
1.8 |
1.7 |
(2.9%) |
(9.1%) |
2.5 |
11.8% |
59.4% |
0.1x |
Buy |
|
Sanlam |
6.8 |
6.8 |
0.0% |
(29.0%) |
10.3 |
0.0% |
51.3% |
1.9x |
Buy |
|
Jubilee Holdings |
182.0 |
183.8 |
1.0% |
(7.5%) |
260.7 |
6.5% |
48.4% |
0.3x |
Buy |
|
ABSA Bank*** |
10.8 |
11.1 |
2.8% |
(9.4%) |
14.8 |
12.2% |
46.2% |
0.9x |
Buy |
|
Diamond Trust Bank*** |
44.1 |
45.0 |
2.2% |
(9.7%) |
58.1 |
11.1% |
40.2% |
0.2x |
Buy |
|
I&M Group*** |
17.5 |
17.5 |
0.0% |
2.6% |
21.8 |
12.9% |
37.4% |
0.4x |
Buy |
|
NCBA*** |
35.0 |
35.7 |
1.9% |
(8.5%) |
43.2 |
11.9% |
33.1% |
0.7x |
Buy |
|
Co-op Bank*** |
10.7 |
11.6 |
8.9% |
(4.1%) |
13.5 |
12.9% |
29.3% |
0.5x |
Buy |
|
CIC Group |
2.0 |
2.1 |
4.5% |
9.4% |
2.5 |
6.2% |
25.8% |
0.7x |
Buy |
|
Stanbic Holdings |
100.8 |
104.3 |
3.5% |
2.2% |
118.2 |
12.1% |
25.5% |
0.7x |
Buy |
|
Standard Chartered*** |
152.8 |
156.5 |
2.5% |
7.9% |
170.9 |
14.1% |
23.3% |
1.1x |
Buy |
|
Equity Group*** |
37.3 |
38.0 |
1.9% |
(15.6%) |
42.6 |
10.5% |
22.6% |
0.8x |
Buy |
|
Britam |
4.9 |
5.0 |
1.8% |
(3.8%) |
6.0 |
0.0% |
19.4% |
0.7x |
Accumulate |
|
HF Group |
3.8 |
3.5 |
(8.2%) |
10.2% |
3.2 |
0.0% |
(7.8%) |
0.2x |
Sell |
Weekly Highlight
Earnings Release
- Cooperative Bank Q3’2023 Financial Performance
During the week, Cooperative Bank released their Q3’2023 financial results. Below is a summary of the performance
|
Balance Sheet Items |
Q3'2022 |
Q3'2023 |
y/y change |
|
Government Securities |
182.4 |
185.1 |
1.5% |
|
Net Loans and Advances |
335.2 |
378.1 |
12.8% |
|
Total Assets |
622.1 |
661.3 |
6.3% |
|
Customer Deposits |
432.0 |
432.8 |
0.2% |
|
Total Liabilities |
520.9 |
553.2 |
6.2% |
|
Shareholders Funds |
100.9 |
108.1 |
7.1% |
|
Balance Sheet Ratios |
Q3'2022 |
Q3'2023 |
y/y change |
|
Loan to Deposit Ratio |
77.6% |
87.3% |
9.8% |
|
Return on average equity |
22.5% |
22.3% |
(0.1%) |
|
Return on average assets |
3.6% |
3.6% |
0.0% |
|
Income Statement |
Q3'2022 |
Q3'2023 |
y/y change |
|
Net Interest Income |
32.0 |
32.8 |
2.5% |
|
Non-Interest Income |
20.2 |
20.6 |
2.1% |
|
Total Operating income |
52.2 |
53.4 |
2.3% |
|
Loan Loss provision |
(5.73) |
(4.21) |
(26.5%) |
|
Total Operating expenses |
(29.6) |
(29.0) |
(2.1%) |
|
Profit before tax |
22.7 |
24.7 |
8.6% |
|
Profit after tax |
17.1 |
18.4 |
7.6% |
|
Earning per share |
2.9 |
3.1 |
7.6% |
|
Income Statement Ratios |
Q3'2022 |
Q3'2023 |
Y/Y Change |
|
Yield from interest-earning assets |
11.4% |
12.2% |
0.8% |
|
Cost of funding |
3.2% |
4.2% |
1.0% |
|
Net Interest Spread |
8.2% |
8.0% |
(0.2%) |
|
Net Interest Income as % of operating income |
61.4% |
61.5% |
0.1% |
|
Non-Funded Income as a % of operating income |
38.6% |
38.5% |
(0.1%) |
|
Cost to Income |
56.8% |
54.3% |
(2.5%) |
|
CIR without provisions |
45.8% |
46.4% |
0.6% |
|
Cost to Assets |
3.84% |
3.75% |
(0.1%) |
|
Net Interest Margin |
8.5% |
8.4% |
(0.1%) |
|
Capital Adequacy Ratios |
Q3'2022 |
Q3'2023 |
% points change |
|
Core Capital/Total deposit Liabilities |
19.7% |
23.1% |
3.4% |
|
Minimum Statutory ratio |
8.0% |
8.0% |
|
|
Excess |
11.7% |
15.1% |
3.4% |
|
Core Capital/Total Risk Weighted Assets |
15.7% |
17.9% |
2.2% |
|
Minimum Statutory ratio |
10.5% |
10.5% |
|
|
Excess |
5.2% |
7.4% |
2.2% |
|
Total Capital/Total Risk Weighted Assets |
16.8% |
22.1% |
5.3% |
|
Minimum Statutory ratio |
14.5% |
14.5% |
|
|
Excess |
2.3% |
7.6% |
5.3% |
|
Liquidity Ratio |
52.1% |
50.3% |
(1.8%) |
|
Minimum Statutory ratio |
20.0% |
20.0% |
|
|
Excess |
32.1% |
30.3% |
(1.8%) |
Key Take-Outs:
- Earnings growth - Core earnings per share (EPS) grew by 7.6% to Kshs 3.1, from Kshs 2.9 in Q3’2022, driven by the 2.3% growth in total operating income to Kshs 53.4 bn, from Kshs 52.2 bn in Q3’2022,
- Improved efficiency – The bank’s total operating expenses decreased by 2.1% to Kshs 29.0 bn in Q3’2023 from Kshs 29.6 bn in Q3’2022, attributable to a 26.5% decrease in loan loss provisions to Kshs 4.2 bn, from Kshs 5.7 bn recorded in Q3’2022, coupled with a 3.5% decrease in other expenses to Kshs 12.6 bn from Kshs 13.1 bn in Q3’2022, which outpaced the slower 12.4% increase in staff costs to Kshs 12.2 bn, from Kshs 10.8 bn in Q3’2022, and,
- Asset quality Deterioration- The bank’s asset quality deteriorated as evidenced by the NPL ratio increasing to 14.9% in Q3’2023 from 14.0% in Q3’2022, attributable to 19.5% increase in Gross non-performing loans to Kshs 61.9 bn, from Kshs 51.8 bn in Q3’2022, compared to the slower 12.3% increase in gross loans to Kshs 416.6 bn, from Kshs 371.1 bn recorded in Q3’2022.
For a more detailed analysis, please see the Cooperative Bank Q3’2023 Earnings Note
We are “Neutral” on the Equities markets in the short term due to the current tough operating environment and huge foreign investor outflows, and, “Bullish” in the long term due to current cheap valuations and expected global and local economic recovery.
With the market currently being undervalued to its future growth (PEG Ratio at 0.6x), we believe that investors should reposition towards value stocks with strong earnings growth and that are trading at discounts to their intrinsic value. We expect the current high foreign investors sell-offs to continue weighing down the equities outlook in the short term.
- Industry Report
During the week, the Kenya National Bureau of Statistics (KNBS) released the Leading Economic Indicators (LEI) September 2023 Report which highlighted the performance of major economic indicators. The key highlights related to the Real Estate sector include;
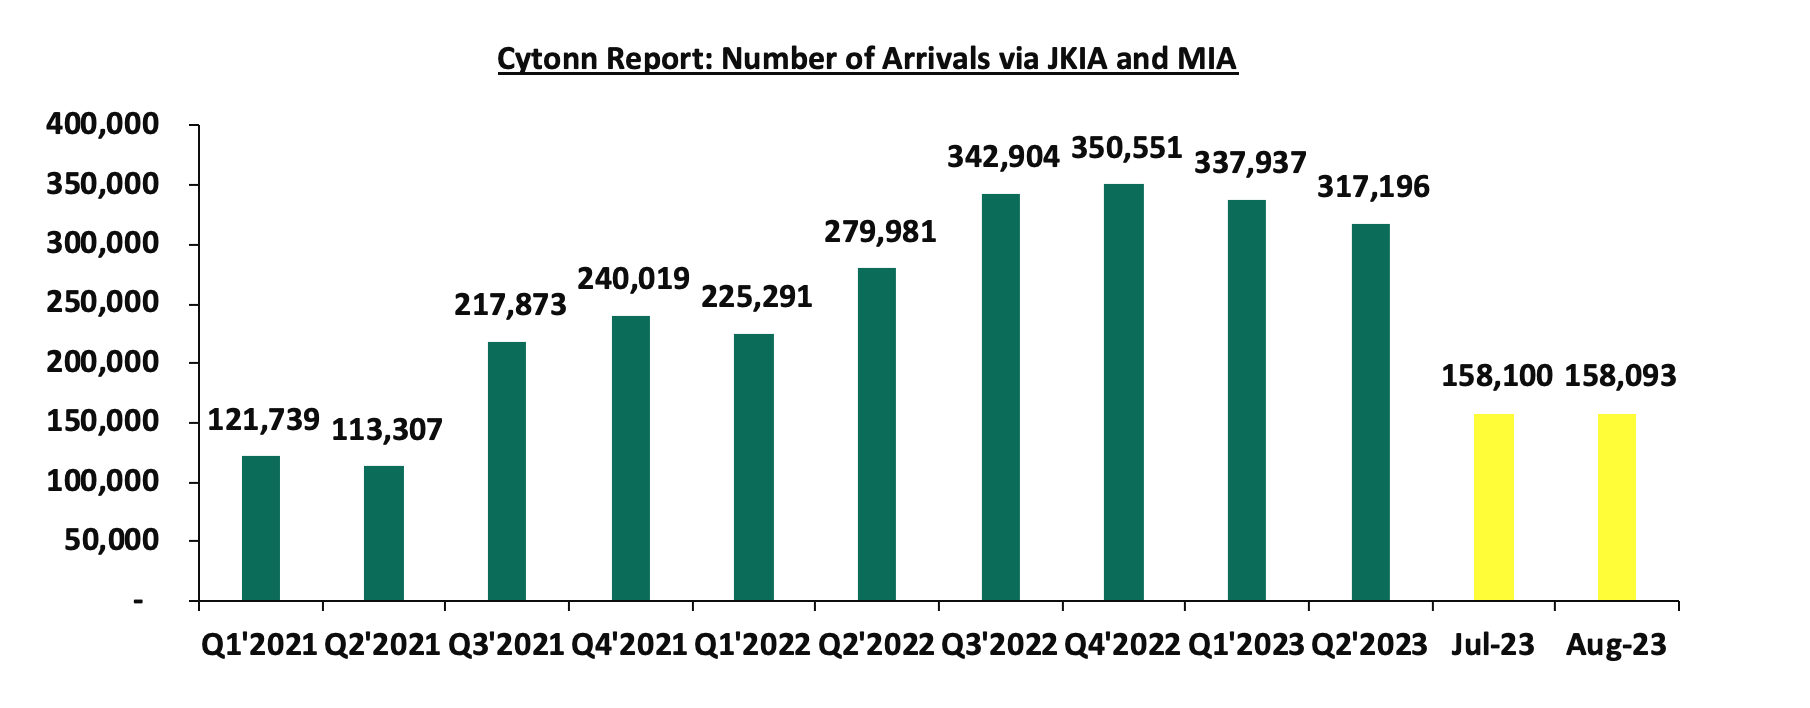
- Overall international arrivals through Jomo Kenyatta International Airport (JKIA) and Moi International Airport (MIA) declined marginally in August 2023 to 158,093 persons from 158,100 persons recorded in July 2023. On a year-on-year (y/y) basis, the performance represented a 34.0% increase to 316,193 persons recorded in the months of July and August 2023, compared to 235,982 persons recorded during a similar period in 2022. The improved performance is attributable to; i) increased international marketing of Kenya’s tourism market by the Ministry of Tourism in collaboration with the Kenya Tourism Board, through platforms such as the Magical Kenya platform, ii) the tourism board alignment of its marketing initiatives towards targeting emerging and established source markets, iii) concerted efforts to promote local and regional tourism, iv) development of niche products such as cruise tourism, adventure tourism, culture and sports tourism and, iv) an increase in corporate and business Meetings, Events, and Conferences (MICE) from both the public and private sectors. The chart below shows the number of international arrivals in Kenya between 2021 and August 2023;
Source: Kenya National Bureau of Statistics (KNBS)
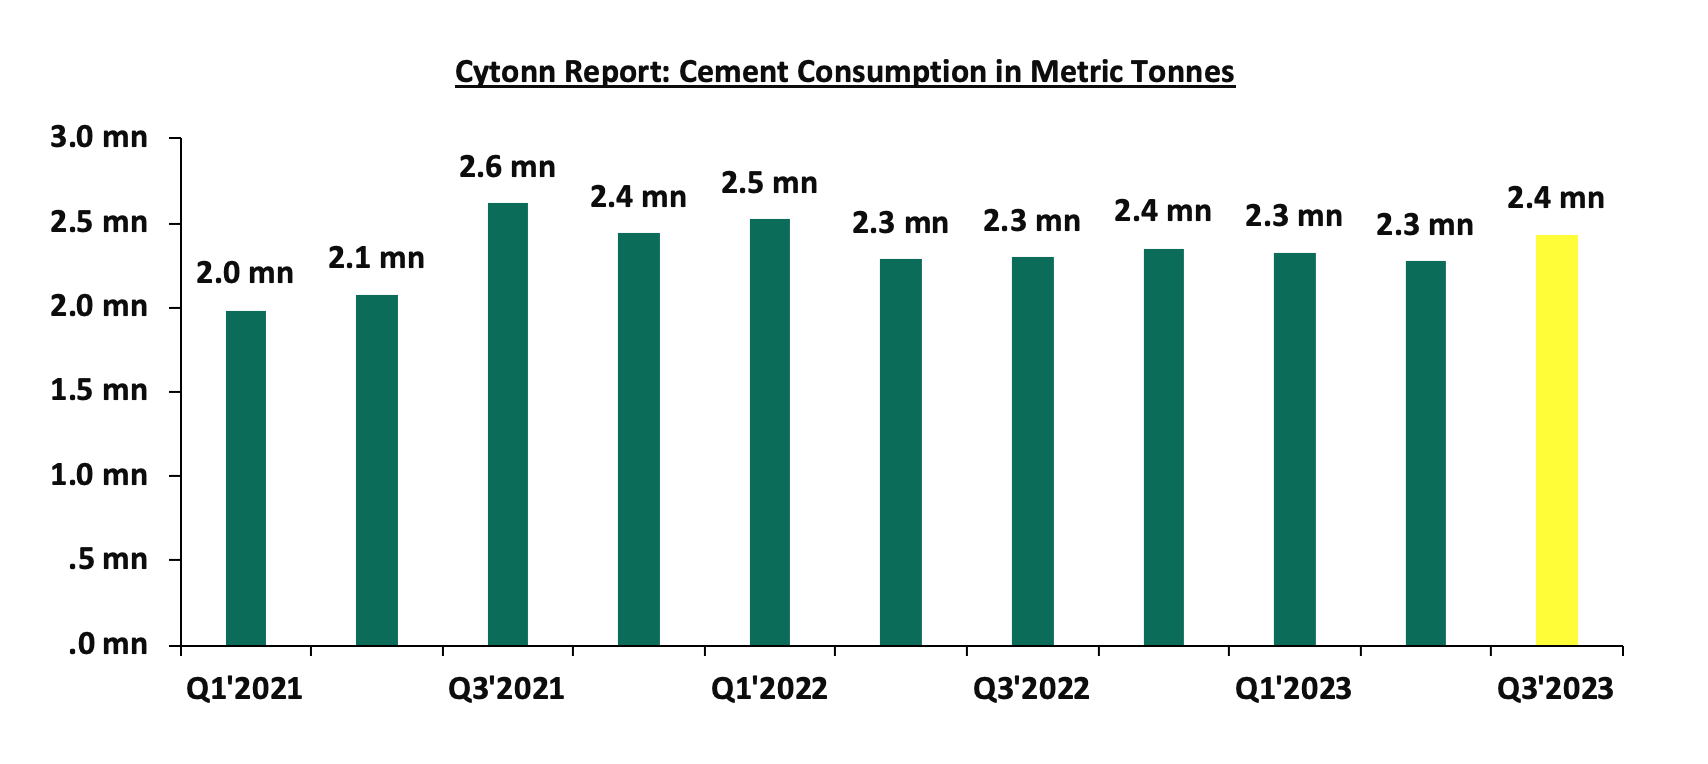
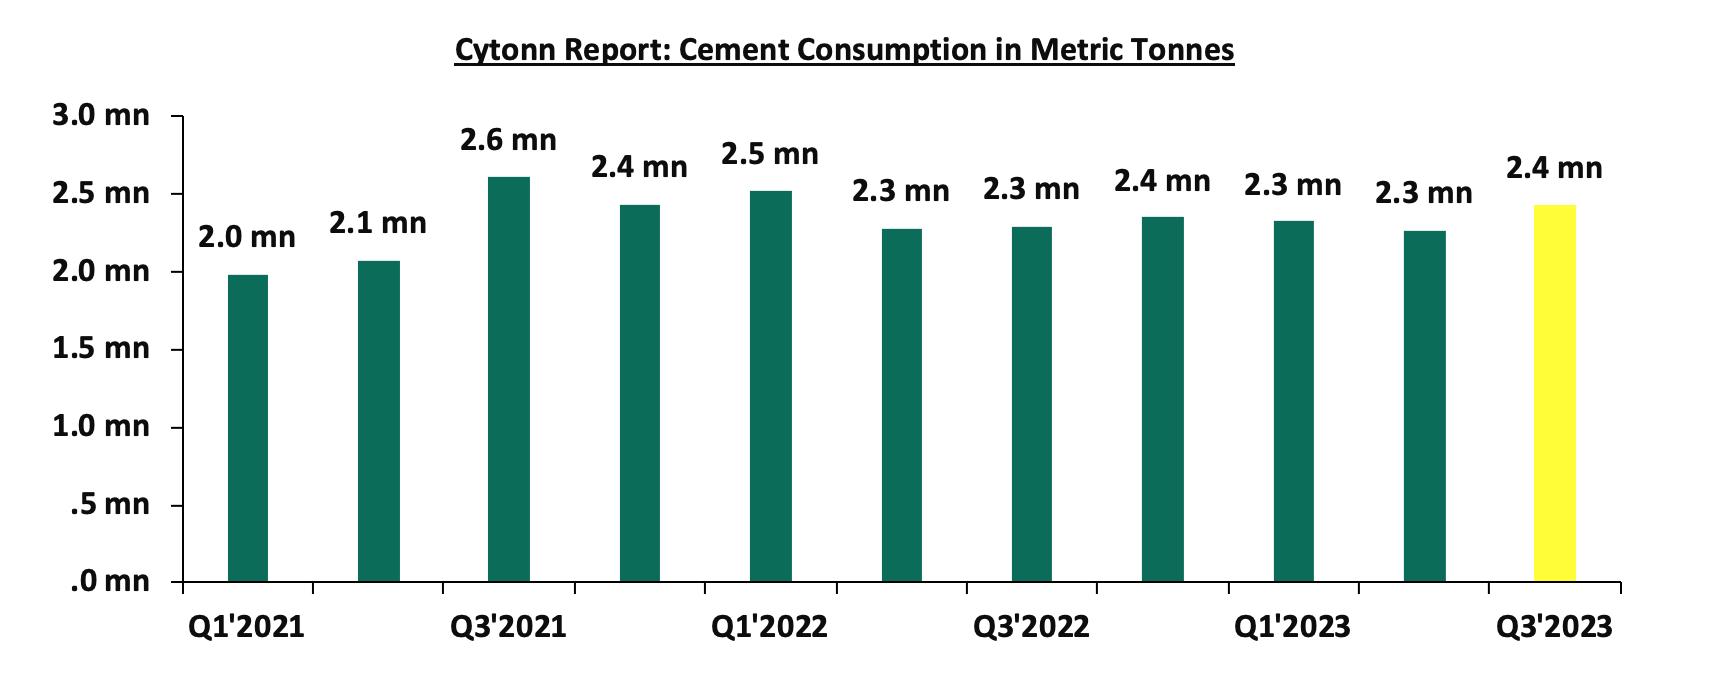
- The consumption of cement increased by 7.0% to 2.4 mn metric tonnes in Q3’2023 from 2.3 mn metric tonnes in Q2’2023. The y/y consumption also increased by 7.0% to 2.4 mn metric tonnes in Q3’2023 from 2.3 mn in Q3’2022, attributable to the increased number of approved building plans in Nairobi Metropolitan Area (NMA), which led to overall increase in demand and consumption of construction materials;
Source: Kenya National Bureau of Statistics (KNBS)
- On a quarter-on-quarter (q/q) basis, the value of building plans approved in the Nairobi Metropolitan Area increased by 141.0% to Kshs 61.1 bn in Q3’2023 from Kshs 25.3 bn in Q2’2023. The y/y value of approved building plans increased by 45.8% to Kshs 61.1 bn in Q3’2023 from Kshs 41.9 bn in Q3’2022, attributable to the clearing of the large number of pending approvals by the Nairobi County Government.
Source: Kenya National Bureau of Statistics (KNBS)
Going forward, we expect Kenya’s Real Estate sector to register positive growth and improved performance mainly driven by increasing number of visitor arrivals into the country which will enhance the performance of serviced apartments and hotels by boosting room and bed occupancies and sustained demand for Real Estate development. However, we expect increased construction costs on the back of rising inflation and stringent lending requirements to developers, with financial institutions such as banks demanding more collateral due to perceived credit risks in the Real Estate sector will hamper optimum performance of the sector. This is evidenced by a 20.9% spike in gross Non-Performing Loans (NPLs) to the Real Estate sector by banks to Kshs 96.0 bn in Q2’2023, from Kshs 79.4 bn in Q2’2022.
- Commercial Office Sector
During the week, International Workplace Group (IWG) plc, a global provider of co-working, office and meeting spaces based in Switzerland announced it has, invested USD 850,000.0 (Kshs 127.5 mn) to set up a workplace facility at Global Trade Centre (GTC) Tower, located in Westlands, Nairobi. The facility which occupies 1,761 SQM will mainly target employees hired by different firms and independent contractors, and will comprise co-working spaces, private offices, and state-of-the art meeting facilities. The move by the multinational to expand its Kenyan operations places Nairobi third in terms of IWG’s operations and presence in Africa, after South Africa and Morocco. IWG already has nine other flexible workspace operations in Nairobi under the Regus brand, which largely targets corporate teams with locations in; i) Westlands, ii) Kenyatta Avenue, iii) Vienna Court near State House, iv) Lenana Road, v) Britam Towers, and, vi) Village Market. The decision by IWG to review its office footprint in Africa aligns with the prevailing trend of hybrid and remote working strategies that have significantly influenced the commercial office market, and a growing traction in co-working spaces, both in Kenya and globally.
We expect this will in the long term assist in boosting occupancy rates in the Nairobi Metropolitan Area (NMA) by increasing the uptake rates of commercial space which have remained almost stagnant as a result of the existing oversupply estimated at 5.8 mn SQFT. However, going forward, we expect to continue witnessing more businesses scaling down their physical operations in favor of co-working spaces in efforts to reduce operational costs on the back of rising inflation.
- Regulated Real Estate Funds
- Real Estate Investments Trusts (REITs)
In the Nairobi Securities Exchange, ILAM Fahari I-REIT closed the week trading at an average price of Kshs 6.00 per share. The performance represents a 0.3% decline from Kshs 6.02 per share recorded last week, taking it to a 11.5% Year-to-Date (YTD) loss from Kshs 6.8 per share recorded on 3 January 2023. Additionally, the performance represents a 70.0% Inception-to-Date (ITD) loss from the Kshs 20.0 price. The dividend yield currently stands at 10.8%. The graph below shows Fahari I-REIT’s performance from November 2015 to 17th November 2023;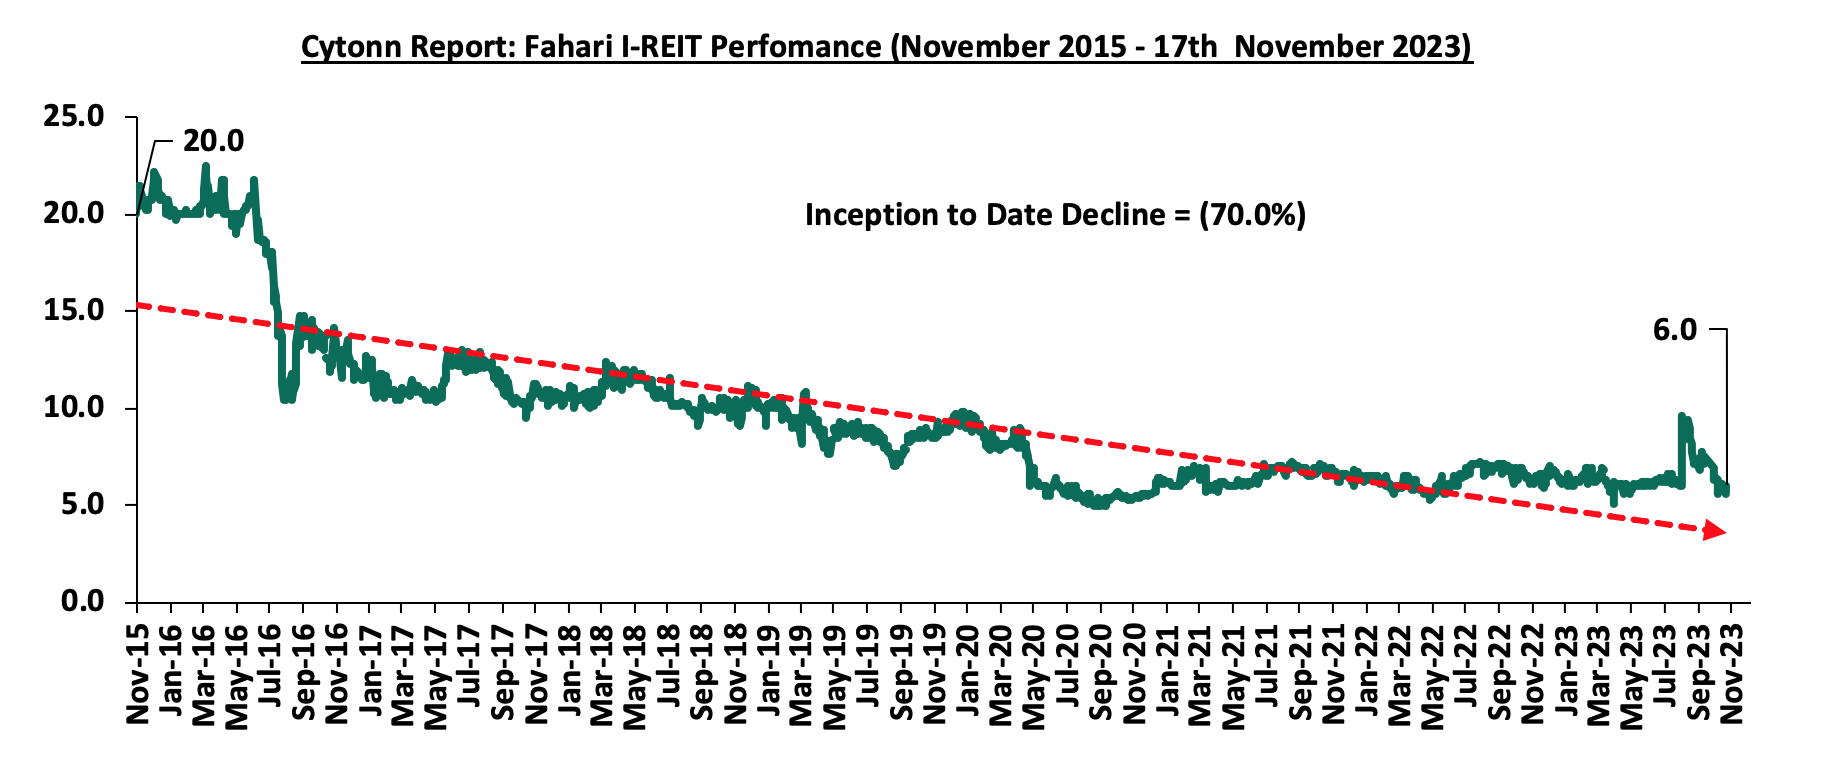
In the Unquoted Securities Platform, Acorn D-REIT and I-REIT traded at Kshs 25.3 and Kshs 21.7 per unit, respectively, as of 27th October 2023. The performance represented a 26.6% and 8.3% gain for the D-REIT and I-REIT, respectively, from the Kshs 20.0 inception price. The volumes traded for the D-REIT and I-REIT came in at 12.3 mn and 30.7 mn shares, respectively, with a turnover of Kshs 257.5 mn and Kshs 633.8 mn, respectively, since inception in February 2021.
REITs provide various benefits like tax exemptions, diversified portfolios, and stable long-term profits. However, the continuous deterioration in performance of the Kenyan REITs and restructuring of their business portfolio is on top of other general challenges such as; i) inadequate comprehension of the investment instrument among investors, ii) prolonged approval processes for REITs creation, iii) high minimum capital requirements of Kshs 100.0 mn for trustees, and, iv) minimum investment amounts set at Kshs 5.0 mn, continue to limit the performance of the Kenyan REITs market.
- Cytonn High Yield Fund (CHYF)
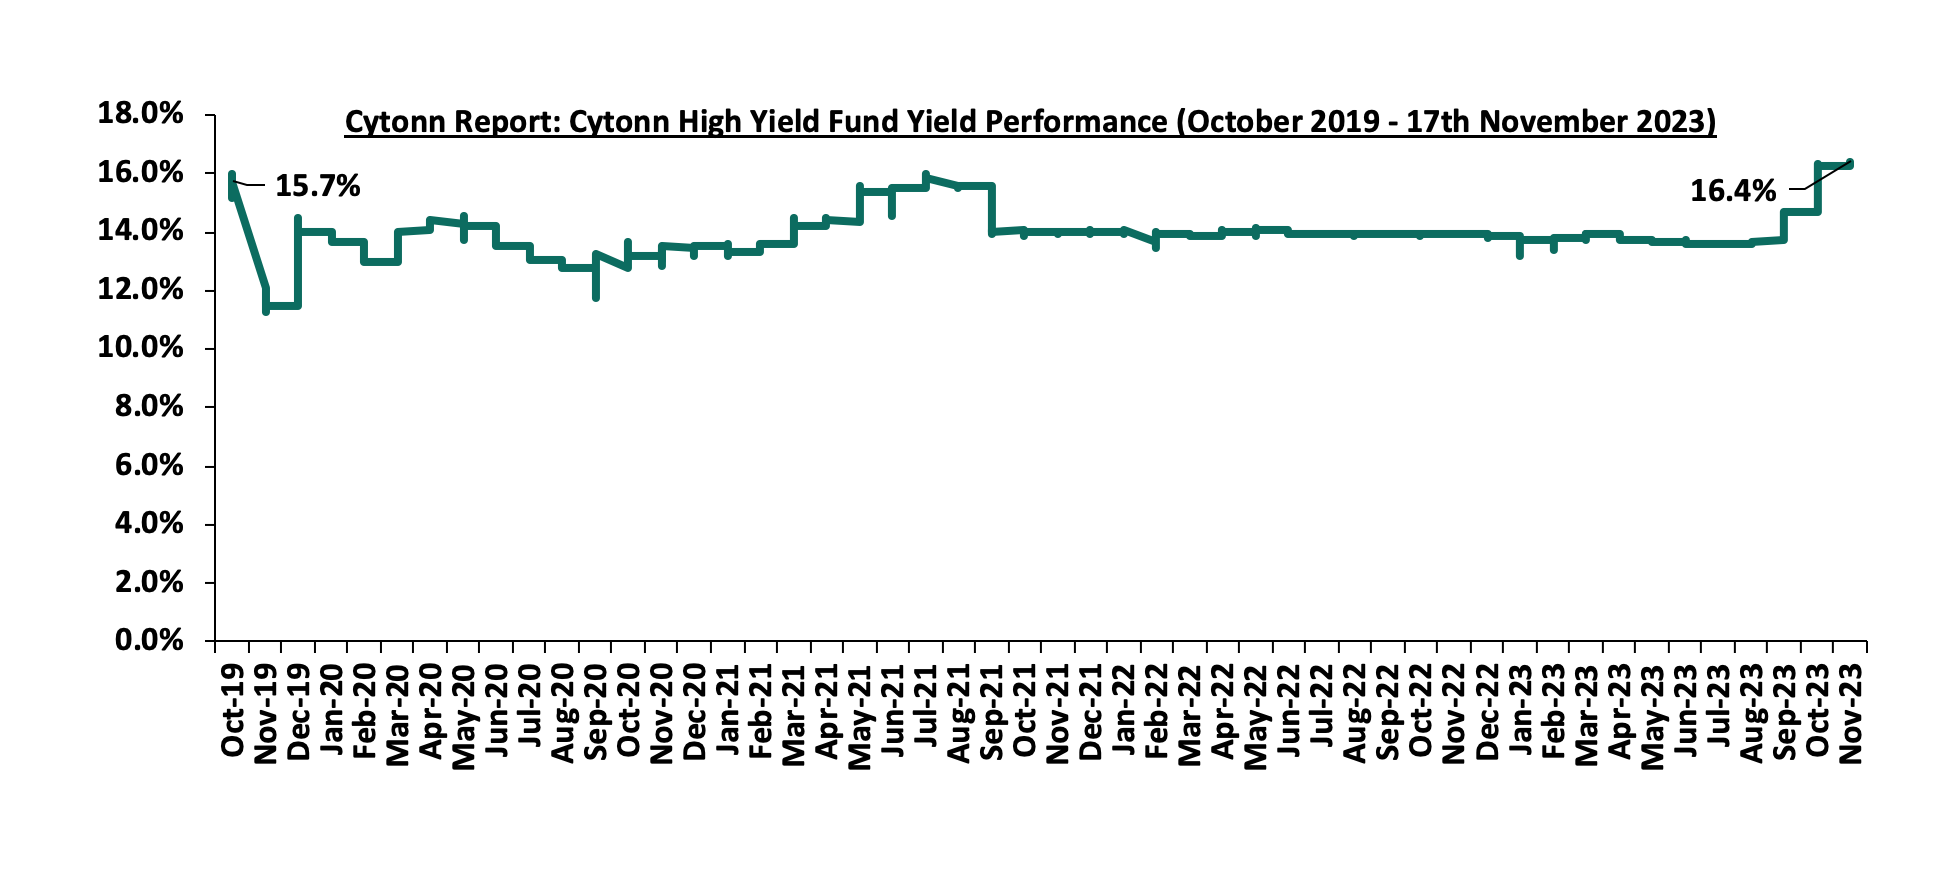
Cytonn High Yield Fund (CHYF) closed the week with an annualized yield of 16.4%, remaining relatively unchanged the previous week. The performance represented a 2.5%-points Year-to-Date (YTD) increase from 13.9% yield recorded on 1st January 2023, and 0.7%-points Inception-to-Date (ITD) increase from the 15.7% yield. The graph below shows Cytonn High Yield Fund’s performance from November 2019 to 10th November 2023;
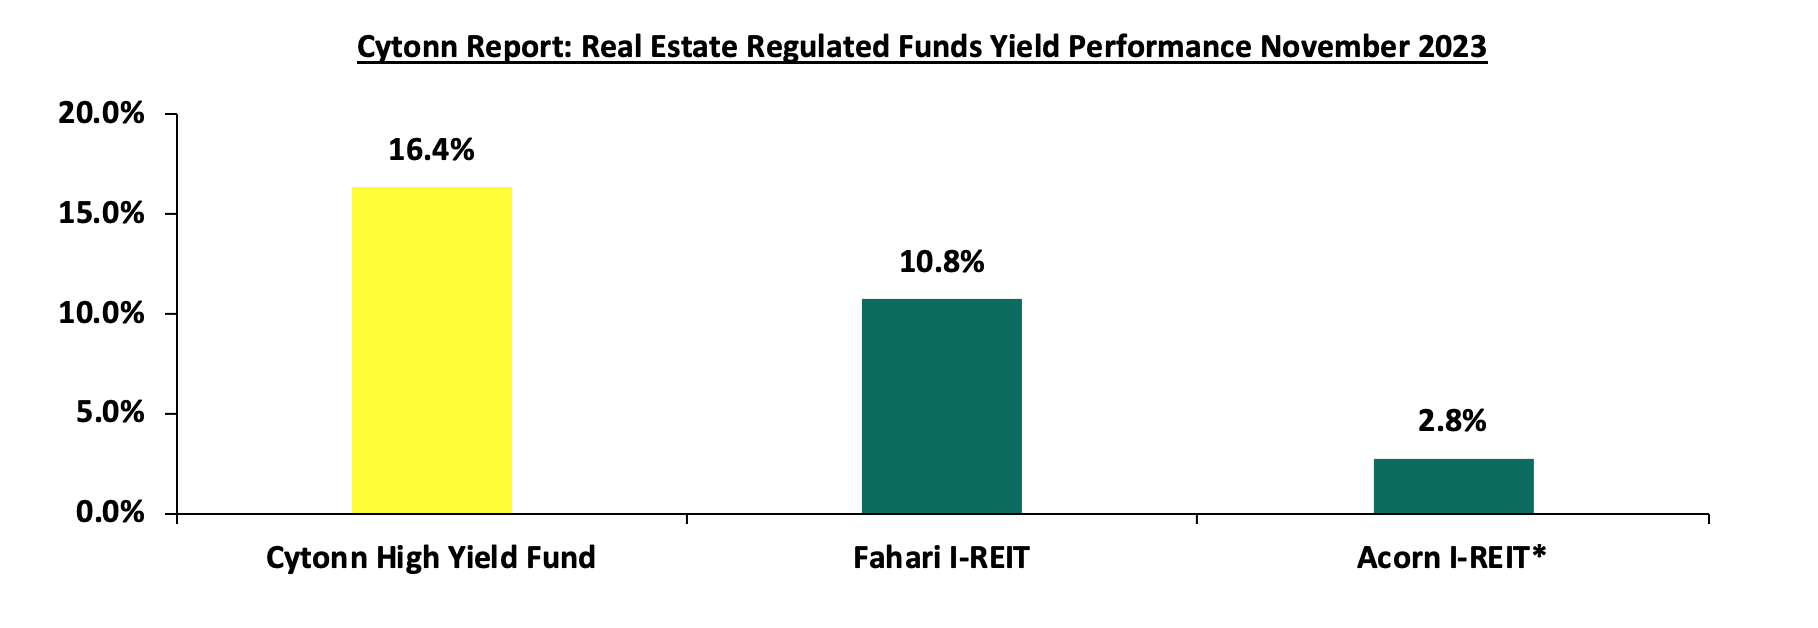
Notably, the CHYF has outperformed other regulated Real Estate funds with an annualized yield of 16.4%, as compared to Fahari I-REIT and Acorn I-REIT with yields of 10.8%, and 2.8% respectively. As such, the higher yields offered by CHYF makes the fund one of the best alternative investment resources in the Real Estate sector. The graph below shows the yield performance of the Regulated Real Estate Funds;
*H1’2023
Source: Cytonn Research
We expect the performance of Kenya’s Real Estate sector to remain on an upward trajectory, supported by factors such as; i) initiation and development of housing projects expected to boost the residential sector, ii) relatively positive demographics in the country increasing demand for housing, iii) the increasing number of visitor arrivals into the country expected to continue boosting performance of serviced apartments and hotels in the country, and, iv) increased foreign investments into the country positioning Kenya as a regional hub. However, factors such as; i) rising costs of construction, ii) limited investor knowledge in REITs, and, iii) an increase in gross non-performing loans advanced to the sector signifying elevated credit risk will continue to hinder optimal performance of the sector by limiting developments and investments.
In many economies, private sector credit forms a vital component due to its ability to effectively distribute resources for investment, thereby acting as a catalyst for economic expansion. Kenya is no exception to this, as improved access to private sector credit translates to real GDP growth in the country. With the government currently seeking to narrow its fiscal deficit, creating an enabling environment to spur the growth of the private sector, especially the micro, small and medium enterprises, will go a long way in boosting its revenue collection. The government can achieve this is by formulating policihttps://cytonnreport.com/storage/research/655b1085714a53.51513556.jpeges to enhance the credit market as well as establishing sector-specific funds to stimulate business growth in key areas of the economy such as finance and insurance, agriculture, manufacturing, transport, and communication. The banking sector remains the largest contributor of credit to private businesses, contributing Kshs 3.6 tn as of July 2023, out of the total Kshs 4.4 tn extended to the private sector for the period, with the largest allocations to trade, manufacturing, and private households at 17.0%, 15.7%, and 14.5% respectively. In the year 2022, the domestic credit extended to the private sector by banks as a percentage of GDP stood at 31.5%, well above the Sub-Saharan Africa average of 27.4%, albeit lower than that of Mauritius and South Africa at 79.4% and 58.6% respectively. From the above statistics, it is evident that the country needs to work on improving credit access for the private sector as well as diversifying the sources of credit to avoid overreliance on the banking sector;
We have been tracking the evolution of Kenya’s private sector credit growth and below are the most recent topicals we have done on the subject:
- The Hustler Fund- In December 2022, we highlighted the Financial Inclusion Fund, dubbed the “Hustler Fund” launched on 30th November 2022, aimed at improving credit access to citizens at the bottom of the pyramid who have often struggled to obtain affordable credit,
- Kenya’s Credit Reference Bureau Framework- Released in November 2022, this topical sheds more light on the Credit Reference Bureau (CRB) Framework in Kenya following the announcement by the Central Bank of Kenya that it had updated the Credit Information Sharing Framework in November 2022, which mandated the Credit Reference Bureaus (CRBs) not to use negative credit scores as the only reason to deny credit, and recommended the fast implementation of the risk based pricing model by commercial banks,
- Kenya’s Private Sector Credit Growth- In November 2022, we highlighted Kenya’s state of lending to the private sector and gave our recommendations on what can be done to improve credit access to the private sector, and,
- Kenya’s Cost of Credit- Released in January 2022, the topical shed more light on Kenya’s high cost of credit remains with the big banks charging a higher cost of credit in comparison to smaller banks owing to their strong pricing power based on a wide distribution network, multiple services and well- established brands.
In this week’s topical, we shall focus on the status of Kenya’s private sector credit growth, highlighting the evolution and current state of lending to the private sector. We will provide specific recommendations on measures that can be implemented to improve credit access to the private sector. We shall do this by looking into the following:
- Introduction,
- The evolution of Kenya’s private sector credit,
- Factors influencing private sector credit growth,
- Initiatives by the Government and Central Bank to promote the private sector in Kenya,
- Comparative analysis, and,
- Conclusion and key consideration to improving private sector credit performance in Kenya.
Section I: Introduction
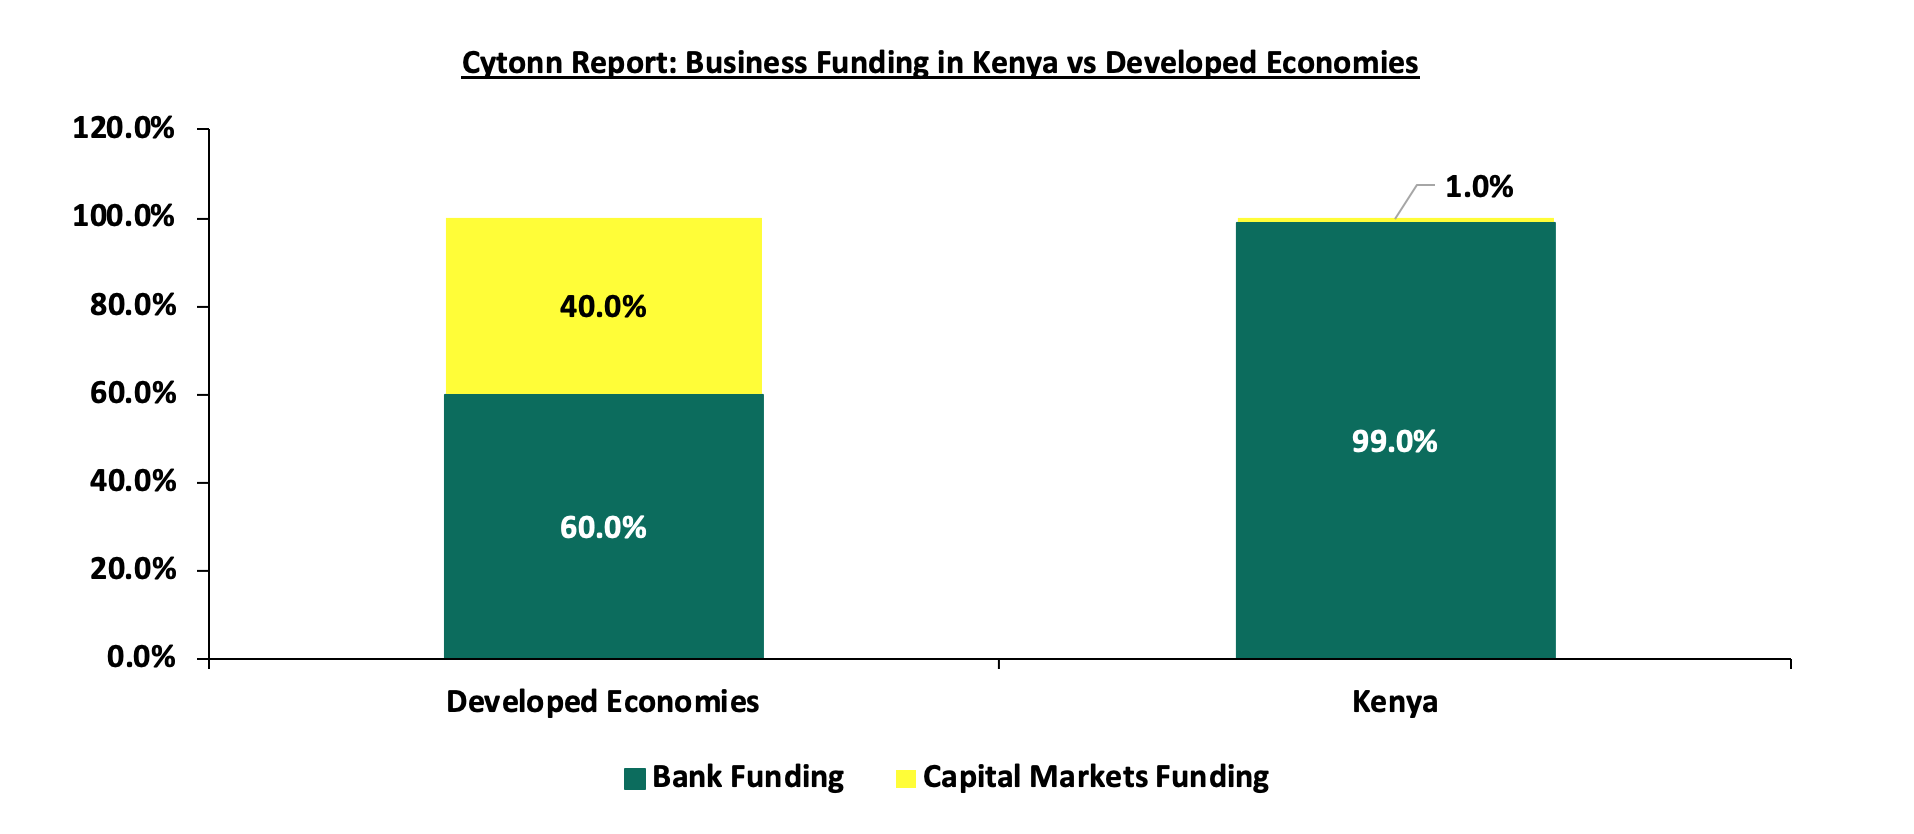
The private sector refers to the segment of the economy that is under the ownership and management of private individuals and corporations, as opposed to being governed by the state. On the other hand, private sector credit is the provision of financial resources to the private sector by entities other than central banks, in the form of loans, the purchase of non-equity securities, and trade credits or other receivables that create an obligation for repayment. In Kenya, the key players in lending to the private sector encompass commercial banks, capital markets, SACCOs, microfinance institutions, finance and leasing companies, pension funds, and insurance corporations. Despite the Kenya Financial sector being dominated by banking institutions which contribute 99.0% of the total lending, private sector credit growth remains relatively low, averaging at 10.7% for the ten years under review. Hence, in comparison to developed economies, capital markets funding in Kenya at 1.0% is underdeveloped, as the developed economies have bank and capital markets funding at 60.0% and 40.0%, respectively. The graph below shows the comparison of business funding in Kenya against developed economies;
Source: Cytonn Research
In Kenya, the private sector plays a crucial role in both economic expansion and job creation. This sector is made up of private corporations and small to medium-sized enterprises (SMEs), which make up 90.0% of all private sector businesses, and employ nearly nine out of every ten workers in the country. However, obtaining credit has been particularly difficult for the informal sector, mainly due to banks’ high-risk perception and the steep cost of credit associated with the currently available credit options.
Section II: The Evolution of Kenya’s Private Sector Credit
- Private sector credit Growth
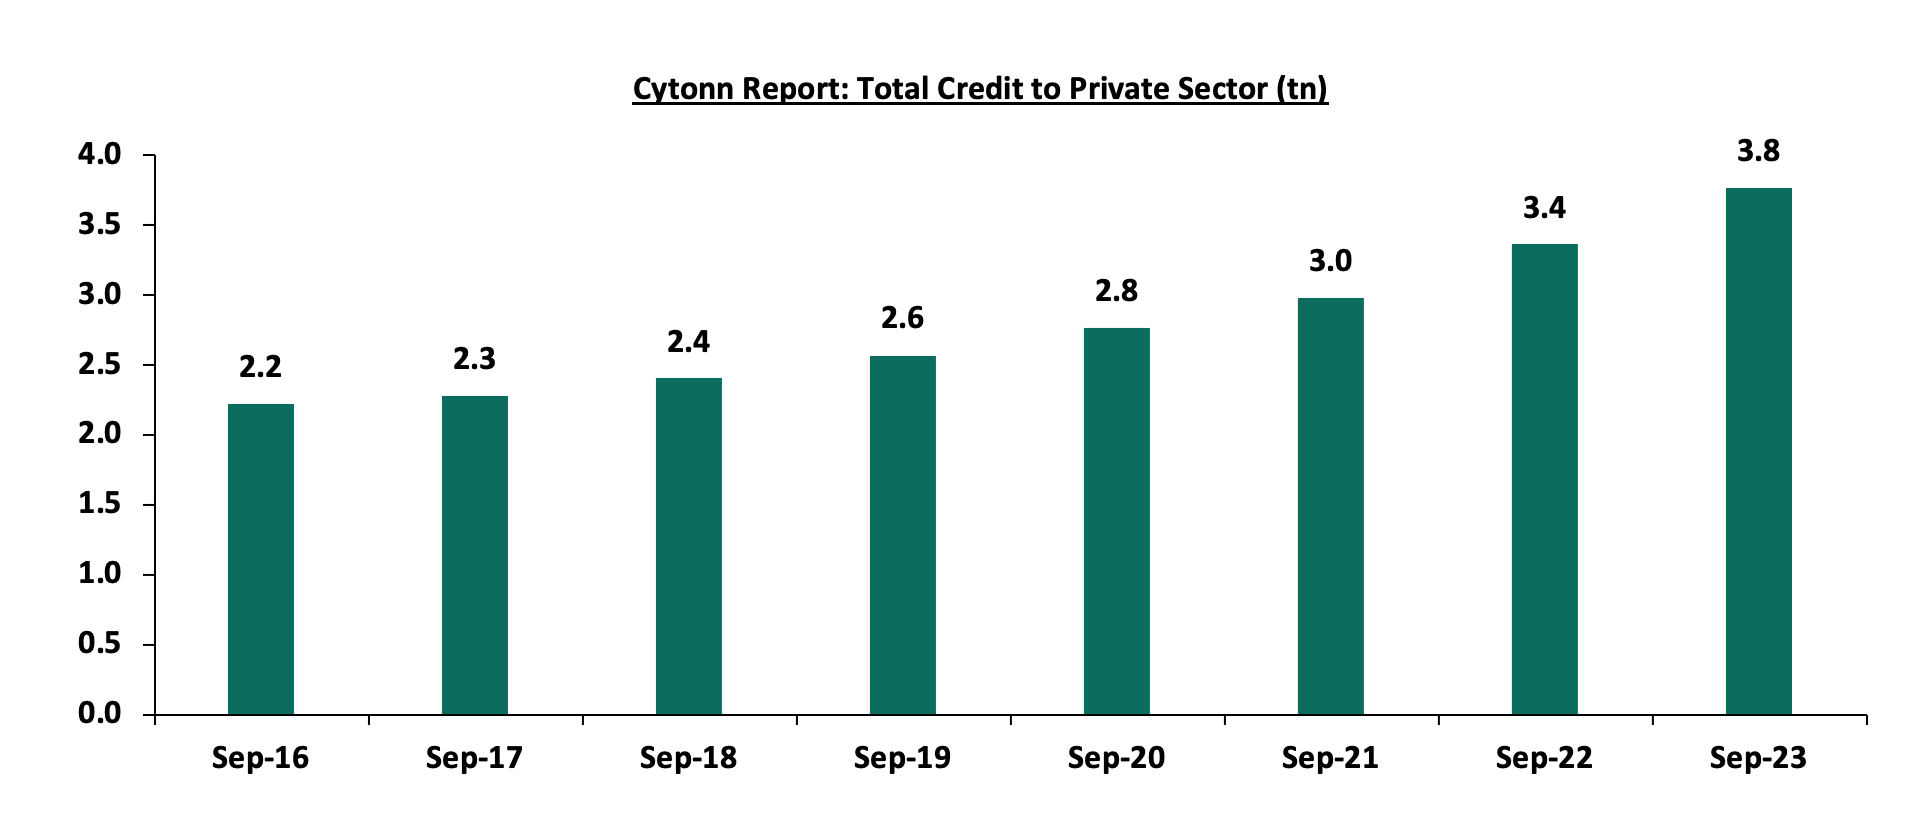
Over the period, there has been consistent growth in private sector lending, with the total credit extended to the private sector by banks increasing with an 8-year CAGR of 9.2%, to Kshs 3.8 tn in September 2023 from Kshs 2.2 tn in September 2016, in line with the relative economic growth averaging at 4.8% for the last 8 years. The graph below shows the cumulative private credit over the period under review from the banking sector;
Source: Central Bank of Kenya
Banks dominate lending in the private sector, contributing 82.9% of the total private sector lending, translating to Kshs 3.6 tn as of July 2023, with the rest of Kshs 0.8 tn, translating to 17.1% coming from SACCOs and Microfinance. Notably, the highest allocation of total private sector credit in July 2023 was to the Private households at 1154.0 bn, equivalent to 26.3% of the total credit extended to the private sector. To note, out the Kshs 0.8 tn extended to the private sector by SACCOs and Microfinance, a whole 83.4% was to the private house-holds sector, with the rest of the sectors getting very minimal allocations. From the banking sector, the trade sector had the highest allocation at Kshs 618.0 bn, equivalent to 17.0% of the total credit from the banking industry. In terms of YTD credit growth, the Finance and Insurance, as well as Agriculture sectors grew the most at 27.0% and 7.3% to Kshs 152.7 bn and Kshs 126.9 bn in July 2023, respectively, from Kshs 120.2 bn and Kshs 118.3 bn respectively in January 2023. The positive credit uptake shows the resilience of the two segments despite increased credit risk due to the deteriorated business environment following elevated inflationary pressures. The graph below shows the cumulate private sector credit over the past three years comparing banks vs SACCOs and microfinance institutions;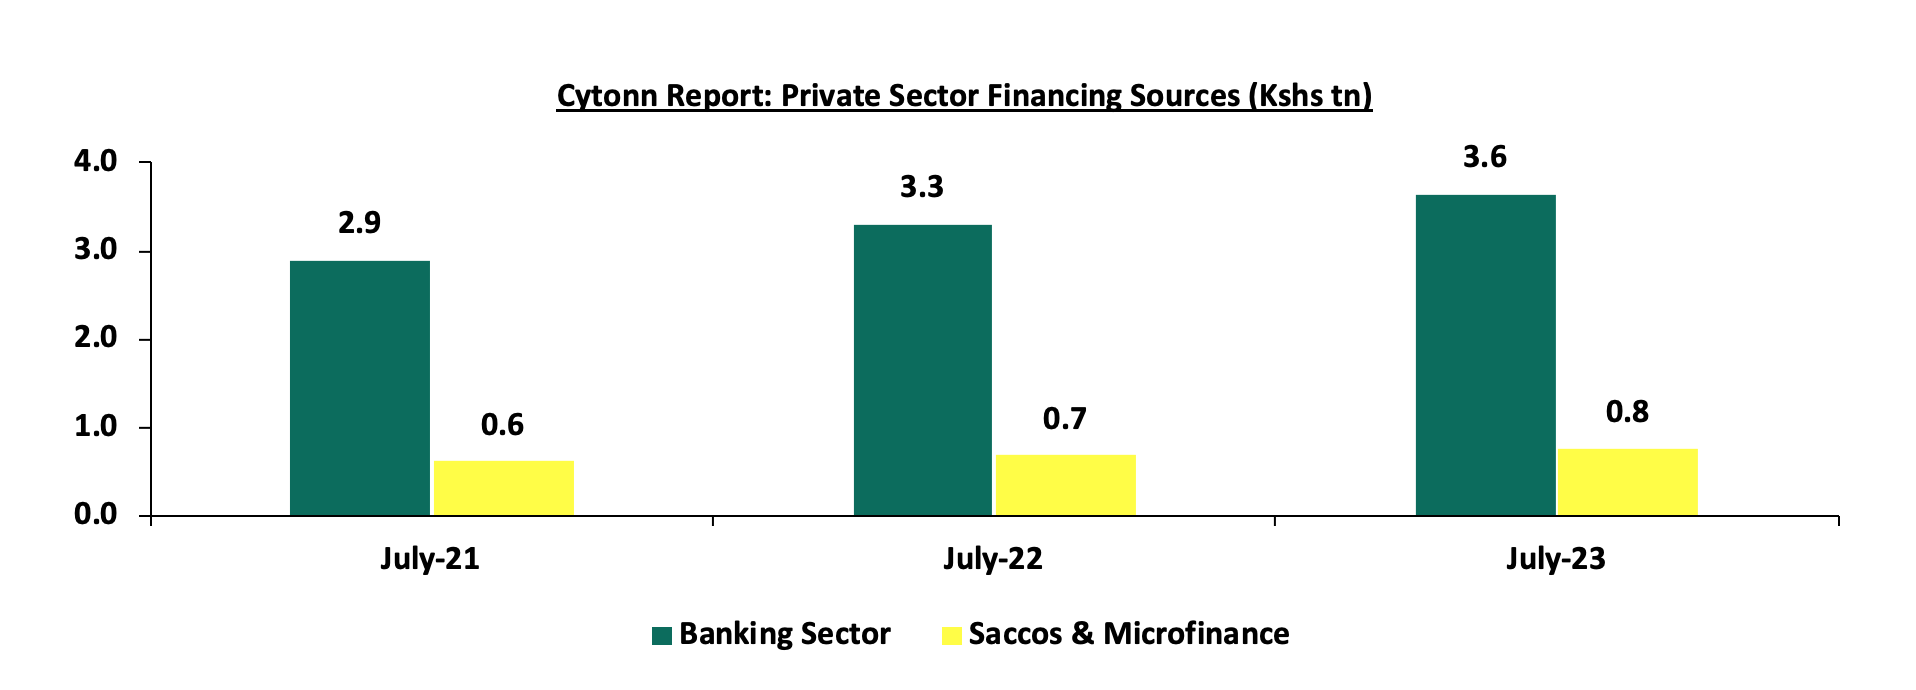
Source: Central Bank of Kenya
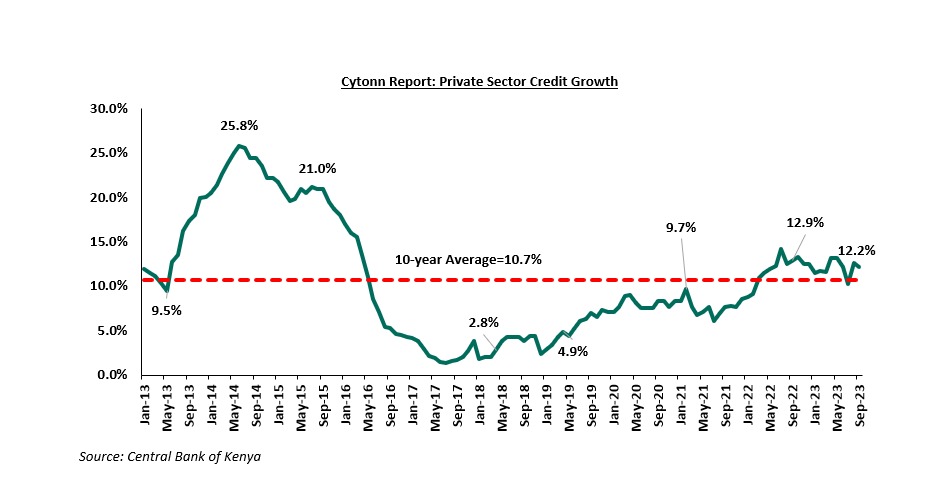
Private sector credit growth from the banking sector has been on an upward trajectory in 2023, reaching 12.2% in the 12-months to September 2023 compared to 12.9% in September 2022, attributable to increased credit demand, as most businesses try to stay afloat and cushion themselves amid a slowdown in collections and payments by customers, increased prices for raw materials mainly resulting from the depreciation of the Kenyan Shilling coupled with an increase in credit products targeting SMEs and retail segments . However, the growth slowed down to 12.2%, from the 12.9% recorded in September 2022, partly attributable to the increased lending rates that have caused banks to be more cautious in lending, to minimize the risk of default by borrowers. To note, the lending rates by banks in the 12 months leading to August 2023 averaged at 13.0%, a significant increase from the 12.2% recorded in a similar period last year. Credit growth was mainly driven by sectors such as Finance and Insurance, Agriculture, Transport and Communication and Manufacturing, which grew by 35.4%, 19.0%, 16.5% and 14.7% YoY respectively. Key to note, Real Estate as well as Building and Construction Sectors had the lowest y/y credit growth rates at 3.0% and 1.9% respectively. According to the Central Bank of Kenya, Real Estate credit uptake was relatively low with gross loans advanced to the Real Estate sector increasing by 6.0% to Kshs 495.0 bn in H1’2023, from Kshs 466.8 bn realized in H1’2022, while the Building and Construction sector recorded a 7.0% increase in gross loans to Kshs 152.0 mn in H1’2023, from Kshs 142.0 mn in H1’2022. The slow growth in the real estate sector was mainly attributed to the increased credit risk on the sector partly due to a subdued demand for property amid rising construction costs and a 20.9% increase in Non-Performing Loans (NPLs) in the Real Estate sector to Kshs 96.0 bn in H1’2023, from Kshs 79.4 bn in H1’2022. On overall, the Gross Non-Performing loans increased by 12.0%, to 576.1 bn, from 514.4 mn in H1’2022, mainly driven by the tough economic environment The table below shows the sectoral credit uptake growth on y/y and year-to-date basis from the banking sector:
|
Cytonn Report: Sectoral Credit Uptake (Kshs bn) |
|||||
|
Sector |
July-22 |
Jan-23 |
July-23 |
Last 12 Months Change (%) |
YTD change (%) |
|
Finance & insurance |
112.3 |
119.8 |
152 |
35.4% |
26.9% |
|
Agriculture |
102.5 |
113.8 |
122 |
19.0% |
7.2% |
|
Mining and quarrying |
19.9 |
22.6 |
23.2 |
16.6% |
2.7% |
|
Transport & communication |
272.5 |
301.7 |
317.4 |
16.5% |
5.2% |
|
Manufacturing |
499.1 |
523.4 |
572.5 |
14.7% |
9.4% |
|
Consumer durables |
361.2 |
381.6 |
407.7 |
12.9% |
6.8% |
|
Business services |
188.8 |
198.6 |
208.9 |
10.6% |
5.2% |
|
Trade |
575.3 |
591.4 |
618.0 |
7.4% |
4.5% |
|
Private households |
493.6 |
515 |
528 |
7.0% |
2.5% |
|
Real estate |
417.3 |
423.5 |
429.9 |
3.0% |
1.5% |
|
Building and construction |
134.1 |
132.4 |
136.7 |
1.9% |
3.2% |
|
Other activities |
127.2 |
121.9 |
127.8 |
0.5% |
4.8% |
|
Total credit growth |
3303.8 |
3445.7 |
3644.1 |
10.3% |
5.8% |
Source: Central Bank of Kenya
The Kenyan private sector credit growth remains subdued even after the removal of interest rates cap in November 2019 with average growth rate coming in at 9.7% since the removal compared to the growth rate of 10.7% for the 10-year period. While the capping of interest rates was implemented to control lending rates to the sector, there was a contraction on the supply side of credit as banks had lower profit margins attributable to a tougher lending environment. Despite the expansion in private sector credit uptake, the current growth rate of 12.2% in September 2023 is still below the historical credit growth levels. The chart below shows the movement of the private sector credit growth:
Section III: Factors Influencing Private Sector Credit Growth
Private sector credit uptake is influenced by a number of factors which include;
- Interest rates – The level of interest rates set by central banks and financial institutions significantly influences the credit market. For instance, the implementation of the Banking (Amendment) Act, in 2016 introduced interest capping following concerns raised by the public regarding the high cost of credit in Kenya, which was viewed as a hindrance to credit access by a large segment of the population. The cap, which restricted banks from charging interest rates exceeding 4.0% points above the Central Bank Rate (CBR), led to a low credit growth averaging at 3.7% for the capping period (August 2016-November 2019) as banks became more cautious in extending credit, particularly to riskier borrowers and for loans with smaller profit margins. However, on the demand side, high interest rates increase the cost of borrowing as well as the debt servicing costs which limits the ability to take additional credit. The average lending rate as at August 2023 stood at 13.8%, a 0.3%-points increase from 13.5% in July 2023. Notably, the move by the central bank to raise the CBR by 100 bps to 10.5% in June 2023 has continued to tighten liquidity within the economy forcing commercial banks to adjust their lending rates upwards as a response to the increased cost of funds for banks,
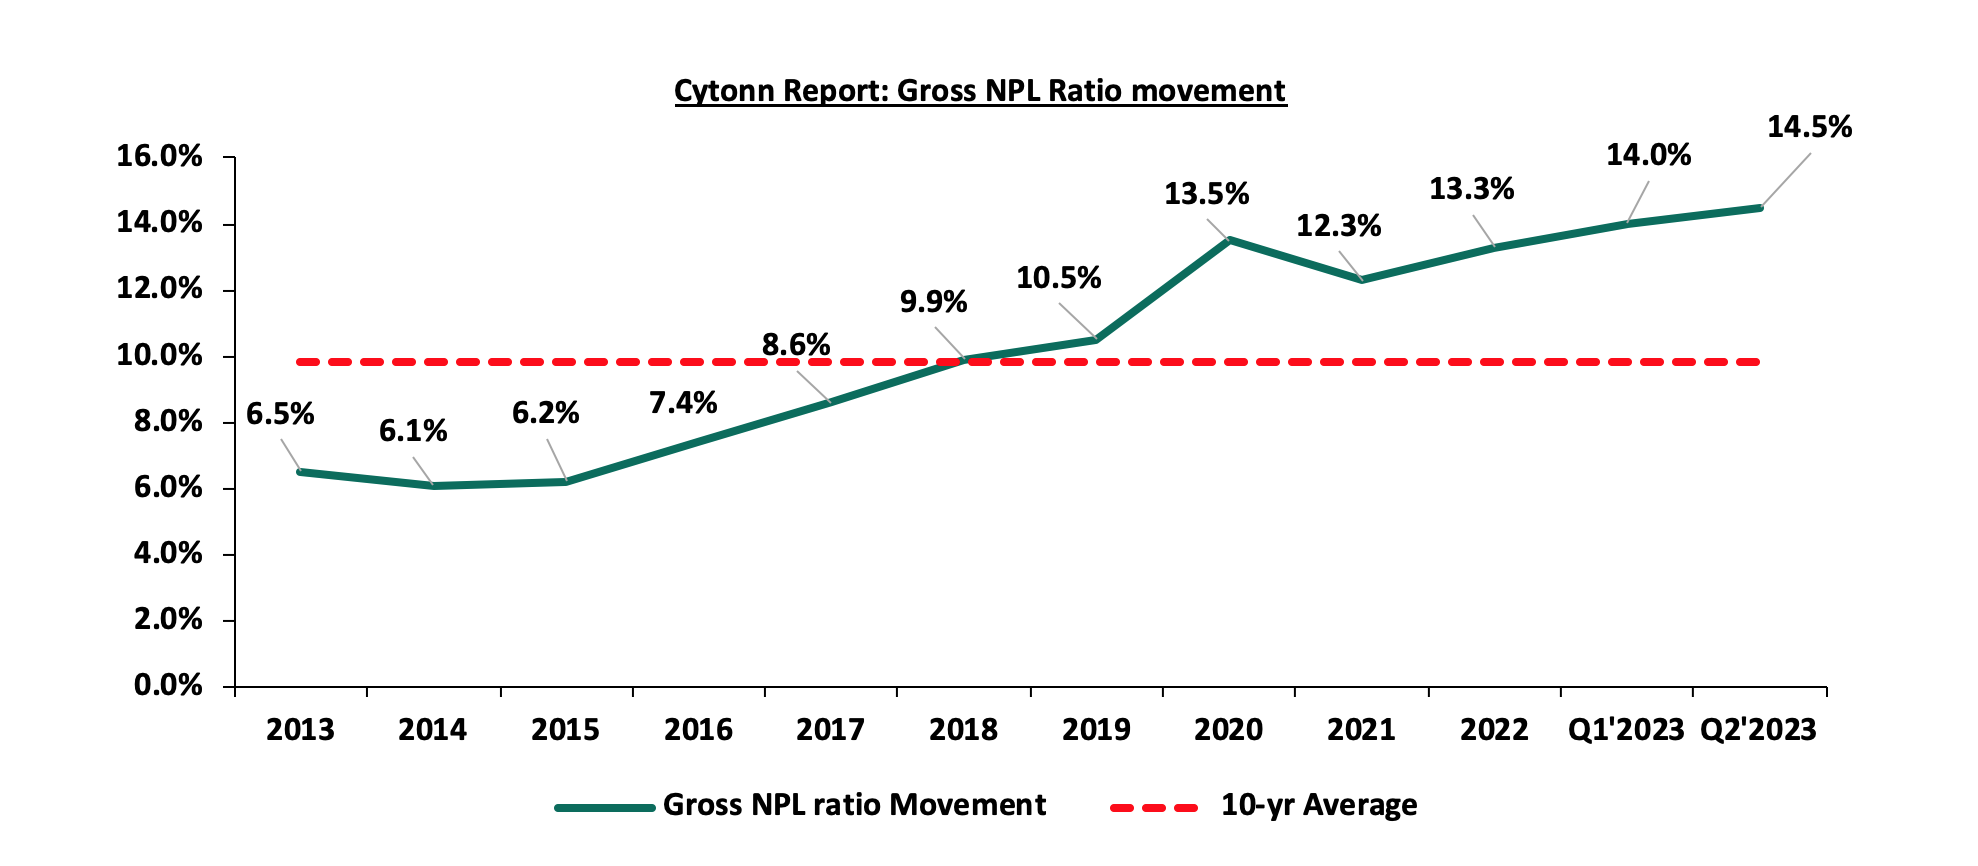
- Elevated credit risk which contributes to high risk premiums – The high-risk perception prompts lenders to incorporate risk premiums into the interest rates they charge on loans resulting in higher borrowing costs for individuals and businesses seeking credit. The risk premium acts as a cushion for lenders against potential losses, reflecting the level of uncertainty and perceived risk associated with the borrower. Additionally, according to the Central Bank of Kenya (CBK), Credit risk remained elevated with Gross Non-Performing Loans (NPLs) to Gross Loans Ratio standing at 14.5% at the end of Q2’2023, a 0.5% points increase from 14.0% recorded at the end of Q1’2023. The graph below shows the movement for the years under review;
- Government domestic borrowing - Commercial banks have continued to hold the highest proportion of Government domestic debt, coming at 44.2% as at November 2023. This is mainly attributable to banks preference to lend to the government, which is considered a risk-free investment, effectively crowding out the private sector, which is considered riskier. Though the holding of domestic debt by commercial banks has declined from a high of 55.4% in the last 10 years, this continues to inhibit credit sector credit growth. The table below shows the holders of domestic public debt for the last 10 years;
Cytonn Report: Domestic Public Debt by Holder (Percent)
Nov-13
Nov-14
Nov-15
Nov-16
Nov-17
Nov-18
Nov-19
Nov-20
Nov-21
Nov-22
Nov- 23
Banking Institutions
48.6%
52.9%
55.4%
53.4%
55.2%
54.9%
54.2%
54.3%
50.3%
47.1%
44.2%
Insurance companies
10.3%
10.1%
8.7%
7.2%
6.2%
6.1%
6.5%
6.3%
6.7%
7.4%
7.2%
Parastatals
3.6%
2.9%
4.6%
5.7%
6.5%
7.4%
6.8%
5.6%
5.4%
6.2%
5.8%
Pension funds
25.9%
24.8%
25.3%
27.3%
27.7%
27.1%
28.1%
28.8%
31.5%
33.0%
30.4%
Other investors
11.5%
9.3%
6.0%
6.4%
4.4%
4.5%
4.4%
54.2%
6.1%
6.4%
12.5%
- Technological advancements - Technological advancements such as Fintech Solutions and mobile banking systems has expanded digital lending with Mobile money platforms providing convenient access to credit, especially for individuals without traditional banking relationships, contributing to a more inclusive credit environment. Notably, in march this year, the Central Bank of Kenya announced the licensing of additional 10 Digital Credit Providers (DCPs) bringing the number of licensed DCPs to 32 following the licensing of 22 DCPs announced in January 2023. This move underscores the commitment of the government to foster a dynamic and competitive digital lending landscape, reinforcing the role of technology in shaping the future of credit accessibility in Kenya,
- Elevated inflation rates - Inflation not only erodes the purchasing power of money but also has a direct impact on interest rates. Central banks, in response to high inflation, may implement measures such as raising the benchmark interest rate which influences the overall cost of borrowing for businesses and individuals. For instance, Following the heightened inflation rate of 7.9% as of June 2023, the central Bank of Kenya revised the Central Bank Rate (CBR) to 10.5%. This adjustment has had a direct impact on interest rates set by commercial banks for loans, leading to an increase in the cost of borrowing. Moreover, the rise in inflation rate to 6.9% in October 2023, from 6.8% in September 2023, driven by high food and fuel prices in the country has negatively impacted on consumption levels leading to reduced sales. This is evidenced by the decline in the Purchasing Managers Index (PMI) to 46.2% in October 2023 from 47.8% in September 2023 depicting deterioration of the business environment which negatively impacts the credit demand by the private sector,
- Over-reliance on the banking sector - Historically, banks have held a dominant position in facilitating credit to the private sector contributing 9% as of July 2023. This over-reliance has led to limited diversification of funding sources for businesses. Exploring alternative credit channels, such as capital markets and non-banking financial institutions, is essential for building a more resilient and diverse credit ecosystem, reducing the systemic risks associated with overdependence on the banking sector. As such, the government should implement strategies to improve other sectors such as leasing, venture capital funds, development finance institutions and bonds and equity markets in order to create an environment that encourages a balanced and inclusive approach to credit facilitation, and,
- High cost of credit – There are other associated overhead costs incurred during borrowing such as bank fees, legal fees and government levies, valuation fees and insurance that are borne by the borrower, in addition to the interest charged on loans. The overhead costs increase the cost of credit, hence limits demand for credit by the private sector.
Section IV: Initiatives by the Government and Central Bank to Promote Private Sector Credit Growth
Based on the importance on private sector contribution to GDP, the Central Bank of Kenya (CBK), in collaboration with other stakeholders, has implemented various measures ranging from licensing of new products, technological innovations and public education to promote credit growth in Kenya. Some of the initiatives include;
- Licensing of Innovative Financial Products - By permitting the introduction of novel lending solutions, investment tools, and other financial products, the central bank has been instrumental in expanding the range of credit options available to businesses and individuals. Notably, in March 2023, the Central Bank of Kenya Licensed an additional 10 Digital Credit Providers (DCPs) bringing the number of licensed DCPs to 32 following the licensing of 22 DCPs announced in January 2023. This move directly aligns with the commitment of the Central Bank of Kenya (CBK) to strategically promote credit access to the private sector by enabling and expanding digital credit options,
- Diversifying Funding Strategies – Through incorporating alternative borrowing strategies, the government aims to reduce its reliance on domestic credit from commercial banks, and as a result, enhancing the ease of credit access to the private sector. Sourcing of alternative funding by the government mitigates the pressure on the local credit market, creating room for private sector entities to secure loans more easily. Notably, Eurobonds, as a form of commercial borrowing, have been a significant component of the government's debt strategy. However, by exploring concessional options, the government not only broadens its funding sources but also ensures a balance that is more conducive to a sustained economic growth,
- Boosting Liquidity in the Banking sector- In March 2022, the CBK reviewed the Cash Reserve Ratio to 4.25 %, from the existed 5.25%. This adjustment resulted in the release of an additional Kshs 35.2 bn in liquidity to commercial banks hence effectively providing commercial banks with more financial flexibility to extend credit to businesses and individuals in the private sector,
- Empowering MSMEs through the Credit Guarantee Scheme (CGS) Regulation 2020 – MSMES, being one of the largest sector in private sector play a vital role in the enhancing economic growth of the Country. The implementation of the Credit Guarantee Scheme (CGS) Regulation in 2020, facilitated 2,609 business access loans to MSMEs totalling Kshs 4.1 bn as of August 2022 surpassing its initial capital of Kshs 3.0 bn. Key to note, 60.0% of the beneficiaries were small enterprises, while micro and medium enterprises accounted for 25.0% and 15.0% respectively,
- Implementation of the Financial Inclusion Fund - The Financial Inclusion Fund, commonly known as Hustler Fund, is a government special sponsored Fund targeting Kenyans of low income to access credit conveniently through their phones. The government launched the Hustler Fund on November 2022 with the main objective of the fund being to make credit affordable to the majority of citizens who have been out of the formal credit cycle for a long duration. The introduction of the Hustler Fund aligns with the government’s commitment to fostering financial inclusion and broadening the reach of credit facilities in the country, and,
- Other government special Funds - The government under the Public Finance Management Regulations rolled out various loan facilities targeting women, youths and persons living with disabilities (PWDs) such as the Youth Development Fund, Uwezo Fund and Women Enterprise Fund in increasing credit to special groups people. These initiatives align with the broader narrative of enhancing private sector credit growth by addressing specific barriers faced by the marginalized or underserved segments of the population.
Additionally, the banking system has put in place measures to aid private sector credit growth such as;
- Tailoring Credit with Risk-Based Pricing – The Central Bank of Kenya approved risk-pricing models for 22 out of the 38 commercial banks as a measure of tailoring loans to a customer’s financial profile while helping banks and other lenders to manage their risk exposure. The initiative has continued to increase credit accessibility to the private sector based on an individual financial profile in terms of borrowing and repayment history, and,
- Digital Transformation – Most Kenyan banks have embraced digital technologies, streamlining and expediting the loan application and approval processes. The implementation of user-friendly mobile and online platforms facilitates quicker access to credit, enhancing the efficiency of transactions for businesses and individuals. Banks such as KCB and NCBA partnered with Safaricom to offer the overdraft credit facility of Fuliza towards increasing credit lending to SMEs. Additionally, KCB has the VOOMA app specifically targeting lending to small and medium enterprises.
Section V: Comparative Analysis
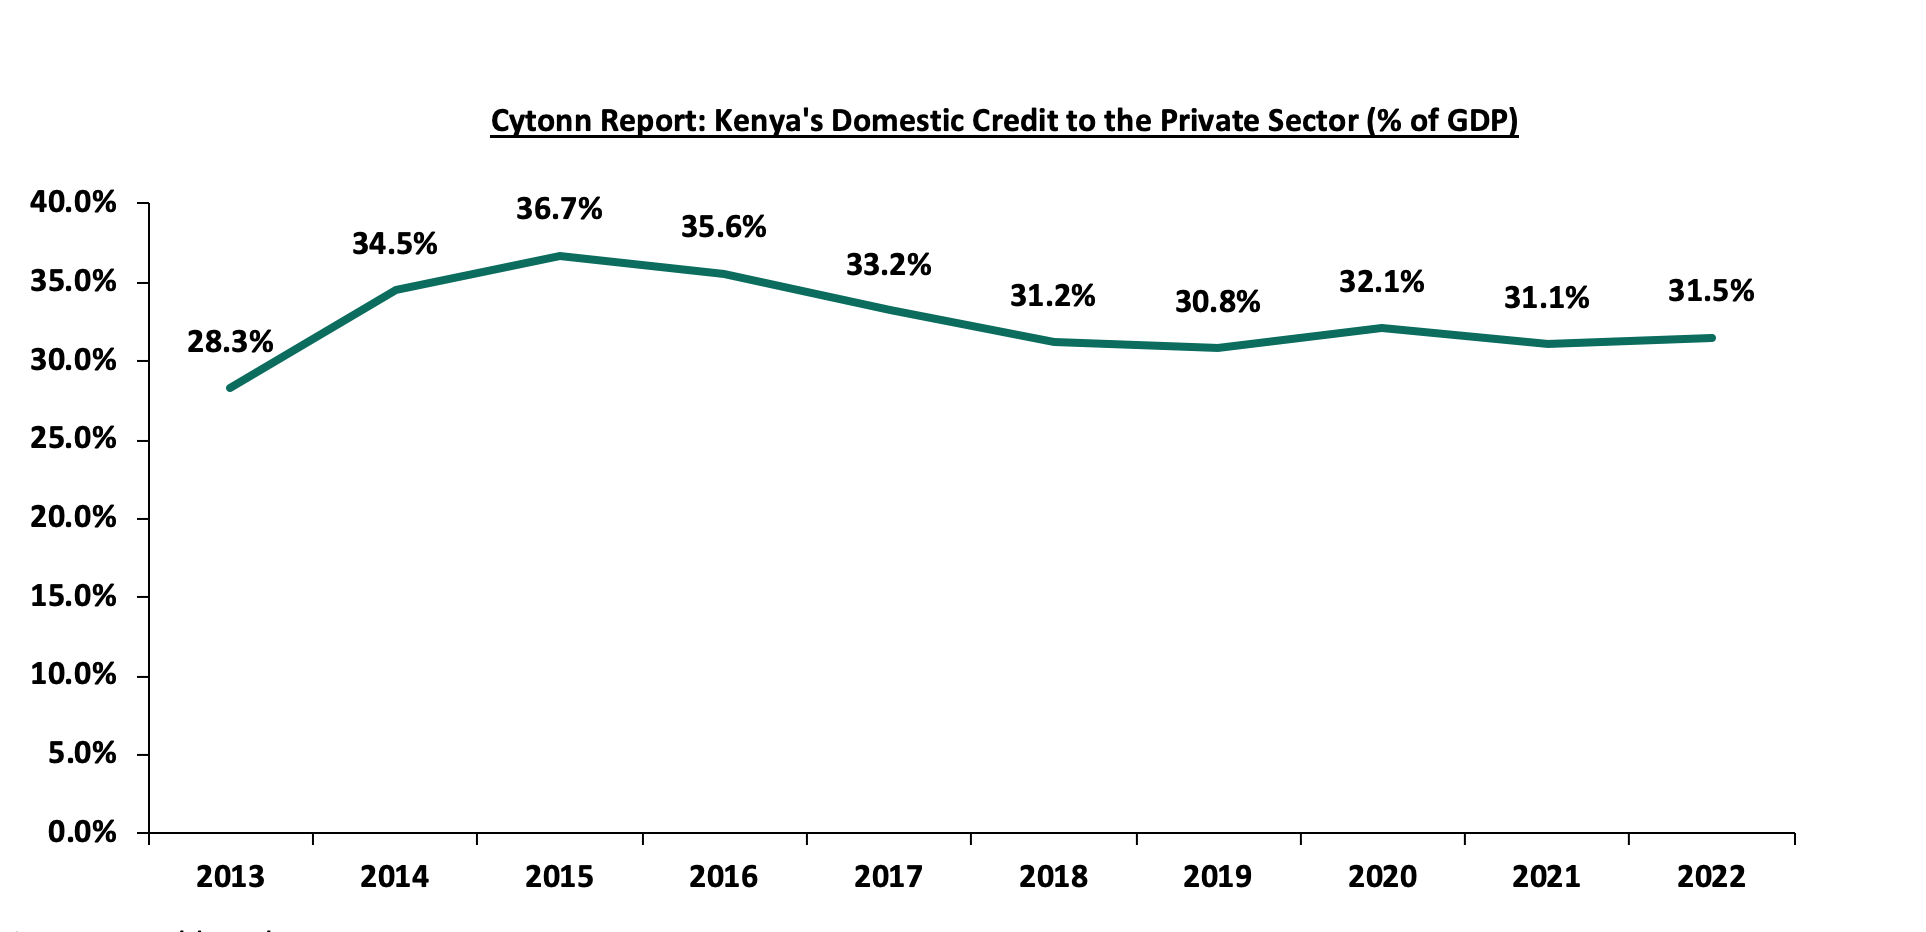
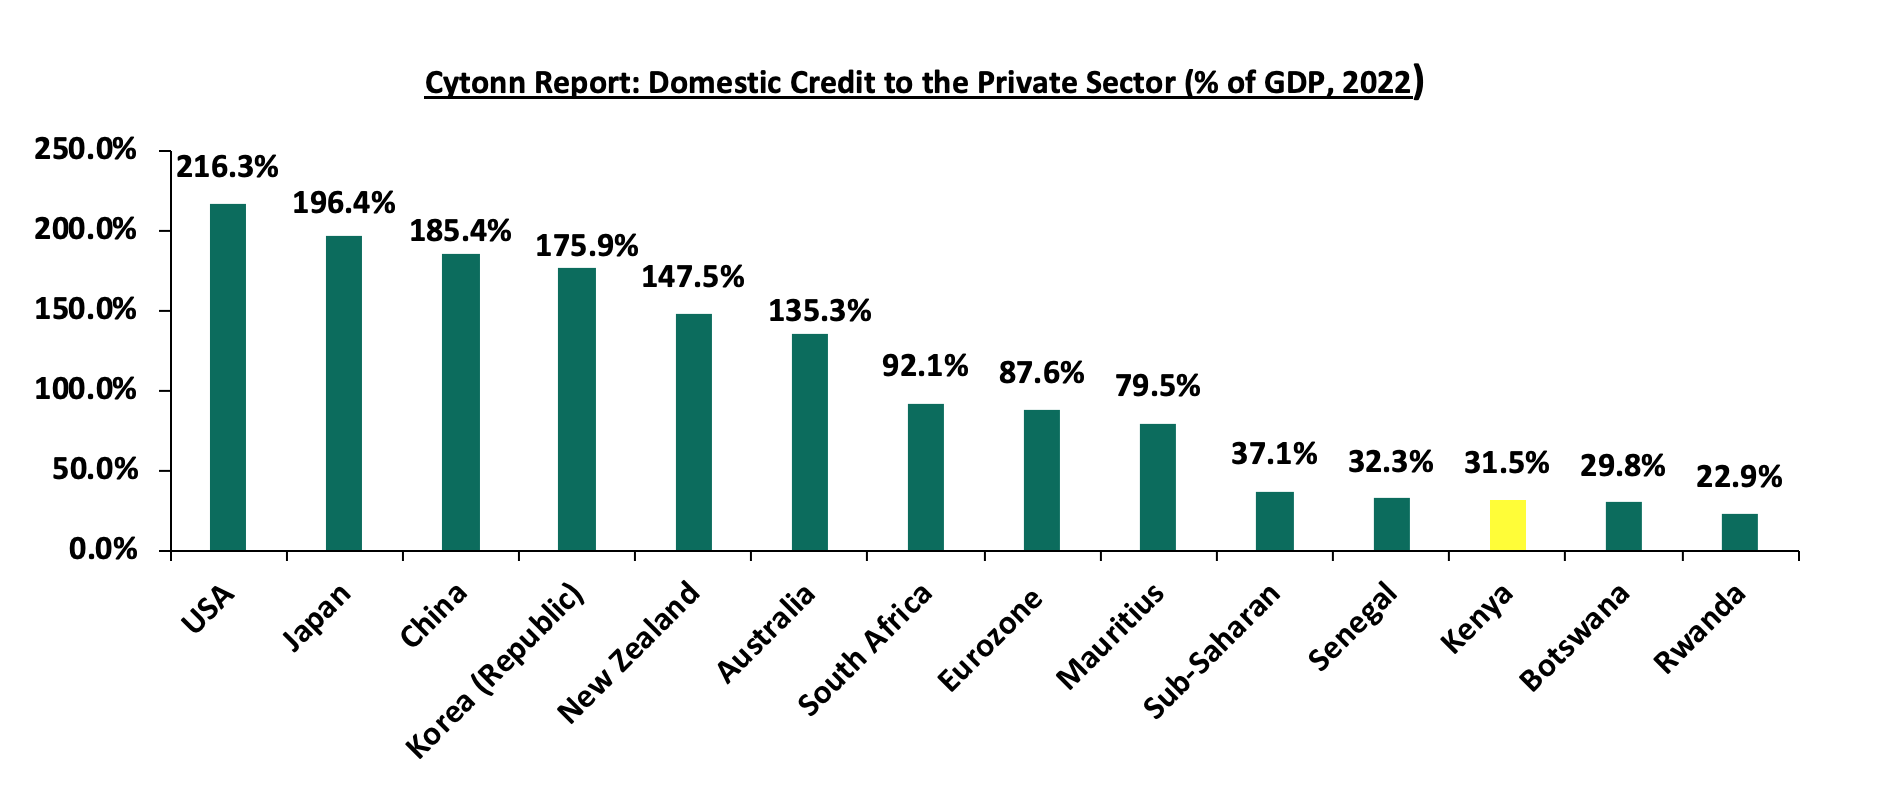
According to the World Bank, Kenya’s domestic credit extended to the private sector outperformed majority of the Sub-Saharan countries. The Kenya’s domestic credit extended to private sectors as a percentage of the GDP came in at 31.5%, 5.6% points lower than the average Sub-Saharan domestic credit to private sectors lending which stood at 37.1% in the same period. Although Kenya outperformed majority of Sub-Saharan countries in credit extended to the private sector, the country still underperformed against developed economies. The graph below shows domestic credit extended to the private sector over the years and a comparison of Kenya’s performance against selected economies;
Source: World Bank
Source: World Bank
Different developed countries have adopted different measures in enhancing private sector credit growth. Some of the successful measures include:
- Project Finance Structuring – a financing option structured around a project’s own operating cash flow and assets alleviating investments risks and raise finance at a low cost. China used the measure in 1997 to launch a local contract undertaken by Plantation Timber Products (Hubei) Ltd amounting to USD 57.0 mn greenfield project in installing modern medium-density fibreboard plants in interior China. Due to the limited-recourse financing nature of the project, IFC sourced for USD 26.0 mn in syndicated loans, at a time when foreign commercial banks remained cautious about project financing in China's interior provinces, and,
- Universal supervisory body to monitor fund disbursements – The UK has a universal monitoring organization, the British Business Bank (BBB), in charge of monitoring all fund operations of government fund initiatives such as Enterprise Finance Guarantee Scheme (EFGS), the British Growth Fund (BGF), the Funding for Lending Scheme (FLS) and the Start Up Loans Scheme (SLS). The measure helps in promoting accountability and transparency of funds disbursements.
Hustler Fund
Hustler fund is an initiative introduced by the new government to increase credit accessibility and availability to the private sector, formally launched on 30th November 2022. The fund’s objective is to extend funding to borrowers with a special attention towards low-income earners with focus on MSMEs at lower, one-digit interest rates. In addition, for all cash borrowed, 5.0% goes to mandatory savings, where 30.0% goes to short-term savings, accessible after one year, while the rest of 70.0% goes long-term savings. As of November 2023, the fund had disbursed a total of Kshs 36.9 bn to over 8.0 mn individual borrowers, whose average repayment rate stood at 73.0%, while the savings account amounted to Kshs 1.8 bn. Additionally, out of the 50,000 groups opted into the fund, 20,000 groups have benefited a total of Kshs 164.0 mn, with the Vikundi savings account amounting to Kshs 8.2 mn as of November, 2023.
Section VI: Conclusion and Key Considerations
The private sector is a significant contributor to the Kenyan GDP. However, credit availability remains a major hindrance for the sector’s growth. To offset the downside, the government of Kenya needs to adopt or emulate the funding model used by the developed economies in creating an enabling environment for two or more players to compete within the Kenyan credit market. Currently, the credit market is dominated by the banking industry while the Capital markets only contribute about 1.0% of funding to all businesses. Additionally, the government needs to adopt a consumer-centred approach for borrowing to encourage private sector credit demand. We believe that additional measures need to be implemented in order to promote private sector credit growth. Below are some of the initiatives that the government can adopt;
- Policy reforms- Through implementing policies that enhance the ease of doing businesses, reducing bureaucratic hurdles, and creating a favourable regulatory environment can encourage banks and other lending institutions to extend credit to the private sector,
- Enhance financial literacy to the public – The government needs to come up with ways of promoting financial literacy among the population and businesses can increase awareness of available credit options as well as improve creditworthiness, making it easier for businesses to access credit,
- Establish a regulatory framework to enhance consumer protection by enforcing consumer-centred financial laws, ensuring financial products are transparent and competitive, as well as handling of consumers complains and issues,
- Develop the capital markets to offer alternative sources of borrowing – The capital market in Kenya is under-developed as it contributes minimal funding to businesses in Kenya. Deeping the capital markets framework will unlock a key financing avenue that businesses can tap into. Further, the government, in conjunction, with the financial sector regulators need to come up with a sound legal framework to promote transparency of the corporate bond market bonds, as well as investor education on key legislations that apply to the specific bond market,
- Enhancing oversight on fund initiatives to promote transparency - The government needs to come up with measures or an independent institution that will oversee the running of funds such as the Hustler Fund, Uwezo Fund and Youth Development Fund in terms of timely publication of updates on amounts disbursed, disclosure of beneficiaries already covered and requirement regulations. The strategy will help in building confidence with the public, as well as preserving tax payers’ money, and,
- Adoption of concessionary loans - Allow the banking sector to provide concessionary loans to small and medium enterprises with focus on the Agricultural sector as it is the leading contributor to the GDP and accounts for 70.0% of employment of the rural population.
In conclusion, the trajectory of private sector growth in Kenya reflects a promising landscape marked by resilience, innovation, and a proactive policy environment. As the nation continues to navigate economic challenges, the private sector stands as a pivotal force, driving employment, fostering entrepreneurship, and contributing significantly to GDP. However, sustainable growth requires ongoing collaboration between the government, businesses, and stakeholders to address barriers, enhance infrastructure, and cultivate a conducive business environment. With strategic initiatives and a commitment to fostering inclusive growth, Kenya's private sector is poised to play a pivotal role in shaping the nation's economic success. we are of the opinion that the initiatives already put in place by the government to promote access to credit by the private sector coupled with creating an enabling operating business environment for alternative credit sources will come in handy in promoting credit growth in the private sector. We expect sustained growth in the lending to the private sector on the back of the existing policies aimed at enhancing credit uptake which in turn will contribute to country’s economic growth.
Disclaimer: The views expressed in this publication are those of the writers where particulars are not warranted. This publication, which is in compliance with Section 2 of the Capital Markets Authority Act Cap 485A, is meant for general information only and is not a warranty, representation, advice or solicitation of any nature. Readers are advised in all circumstances to seek the advice of a registered investment advisor.

