The State of Credit Availability in Kenya’s Private Sector, & Cytonn Weekly #39/2024
By Research Team, Sep 29, 2024
Executive Summary
Fixed Income
During the week, T-bills were undersubscribed, with the overall undersubscription rate coming in at 87.2%, a reversal from the oversubscription rate of 126.4% recorded the previous week. Investors’ preference for the shorter 91-day paper persisted, with the paper receiving bids worth Kshs 6.9 bn against the offered Kshs 4.0 bn, translating to an oversubscription rate of 173.0%, albeit lower than the oversubscription rate of 283.9% recorded the previous week. The subscription rates for the 182-day and 364-day papers decreased to 54.4% and 85.7% respectively from the 84.1% and 105.8% respectively recorded the previous week. The government accepted a total of Kshs 12.5 bn worth of bids out of Kshs 20.9 bn bids received, translating to an acceptance rate of 59.6%. The yields on the government papers were on a downward trajectory, with the yields on the 364-day, 182-day, and 91-day papers decreasing by 1.3 bps, 2.7 bps, and 2.8 bps to remain relatively unchanged from the 16.8%, 16.6%, and 15.8% respectively recorded the previous week;
In the primary bond market, the government is looking to raise Kshs 30.0 bn through the two reopened ten-year fixed coupon bonds FXD1/2016/10 and FXD1/2022/010 with the tenor to maturity of 1.8 years and 7.6 years respectively, and fixed coupon rates of 15.0% and 13.5% respectively. Our expected bidding ranges for the reopened bonds are 17.0%-17.3% and 16.9%-17.2% respectively;
We are projecting the y/y inflation rate for September 2024 to come in at the range of 4.1% - 4.4% mainly on the back of reduced electricity prices and stable fuel prices;
Equities
During the week, the equities market recorded a mixed performance, with NSE 10, NSE 25, and NASI gaining by 1.6%, 1.3%, and 0.7% respectively while NSE 20 declined by 0.7%, taking the YTD performance to gains of 23.4%, 21.6%, 17.8%, and 16.5% for NSE 10, NSE 25, NSE 20, and NASI respectively. The equities market performance was driven by gains recorded by large-cap stocks such as DTB-K, NCBA, and Equity Group of 5.5%, 3.9%, and 3.5% respectively. The performance was, however, weighed down by losses recorded by large-cap stocks such as Bamburi, ABSA, and BAT of 27.3%, 1.4%, and 0.9% respectively;
Real Estate
During the week, the Kenya Mortgage Refinance Company (KMRC) broadened its refinancing services to include non-shareholders, such as SACCOs and microfinance institutions. This is a strategic move to improve access to affordable mortgages, particularly for low and middle-income earners, a key target of Kenya's affordable housing agenda;
During the week, the Kenya Ports Authority (KPA) announced plans to construct a multi-storeyed office tower away from Mombasa port in a bid to ease congestion, improve security, and rent out offices and conference rooms to earn additional revenue. The complex will comprise approximately 40,000 SQM of office space for KPA staff, four times the space they are using now;
On the Unquoted Securities Platform, Acorn D-REIT and I-REIT traded at Kshs 25.4 and Kshs 22.2 per unit, respectively, as per the last updated data on 27th September 2024. The performance represented a 27.0% and 11.0% gain for the D-REIT and I-REIT, respectively, from the Kshs 20.0 inception price Additionally, ILAM Fahari I-REIT traded at Kshs 11.0 per share as of 27th September, 2024, representing a 45.0% loss from the Kshs 20.0 inception price;
Focus of the Week
The private sector in Kenya plays a crucial role in the country's economic development, as improved access to private sector credit translates to real GDP growth in the country. Access to credit is essential for businesses to grow, innovate, and remain competitive; and understanding the current state of credit availability in Kenya's private sector is vital for identifying the gaps and opportunities for improvement. According to the latest data from the Central Bank of Kenya (CBK), credit extended to the private sector in Kenya registered a minimal 4.0% growth as of June 2024, highlighting a slower pace of growth and underscoring the need for policy measures to stimulate lending and support business expansion. With the government currently seeking to reduce its fiscal deficit, creating an enabling environment to stimulate private sector growth, particularly for micro, small, and medium enterprises (MSMEs), will be instrumental in boosting revenue collection. This can be achieved through policy reforms aimed at enhancing the credit market, alongside the establishment of sector-specific funds designed to fuel business expansion in key sectors such as finance, agriculture, manufacturing, and transport. Kenya's private sector credit availability lags behind that of developed economies, with a heavy reliance on commercial banks, and limited access to alternative funding sources such as venture capital, equity financing, or government-backed credit programs. The banking sector remains the largest contributor of credit to businesses, accounting for 81.9% of the total Kshs 4.6 tn of credit extended to the sector, while the remaining portion is provided by other sources such as microfinance institutions and SACCOs. Key to note, the private sector credit from the banking sector stood at Kshs 3.8 tn as of May 2024, with the largest allocations to trade, manufacturing, and private households at 16.9%, 15.3%, and 14.9% respectively;
Investment Updates:
- Weekly Rates:
- Cytonn Money Market Fund closed the week at a yield of 18.15% p.a. To invest, dial *809# or download the Cytonn App from Google Play store here or from the Appstore here;
- We continue to offer Wealth Management Training every Monday, from 10:00 am to 12:00 pm. The training aims to grow financial literacy among the general public. To register for any of our Wealth Management Trainings, click here;
- If interested in our Private Wealth Management Training for your employees or investment group, please get in touch with us through wmt@cytonn.com;
- Cytonn Insurance Agency acts as an intermediary for those looking to secure their assets and loved ones’ future through insurance namely; Motor, Medical, Life, Property, WIBA, Credit and Fire and Burglary insurance covers. For assistance, get in touch with us through insuranceagency@cytonn.com;
- Cytonn Asset Managers Limited (CAML) continues to offer pension products to meet the needs of both individual clients who want to save for their retirement during their working years and Institutional clients that want to contribute on behalf of their employees to help them build their retirement pot. To more about our pension schemes, kindly get in touch with us through pensions@cytonn.com;
Real Estate Updates:
- For more information on Cytonn’s real estate developments, email us at sales@cytonn.com;
- Phase 3 of The Alma is now ready for occupation and the show house is open daily. To join the waiting list to rent, please email properties@cytonn.com;
- For Third Party Real Estate Consultancy Services, email us at rdo@cytonn.com;
- For recent news about the group, see our news section here;
Hospitality Updates:
- We currently have promotions for Staycations. Visit cysuites.com/offers for details or email us at sales@cysuites.com;
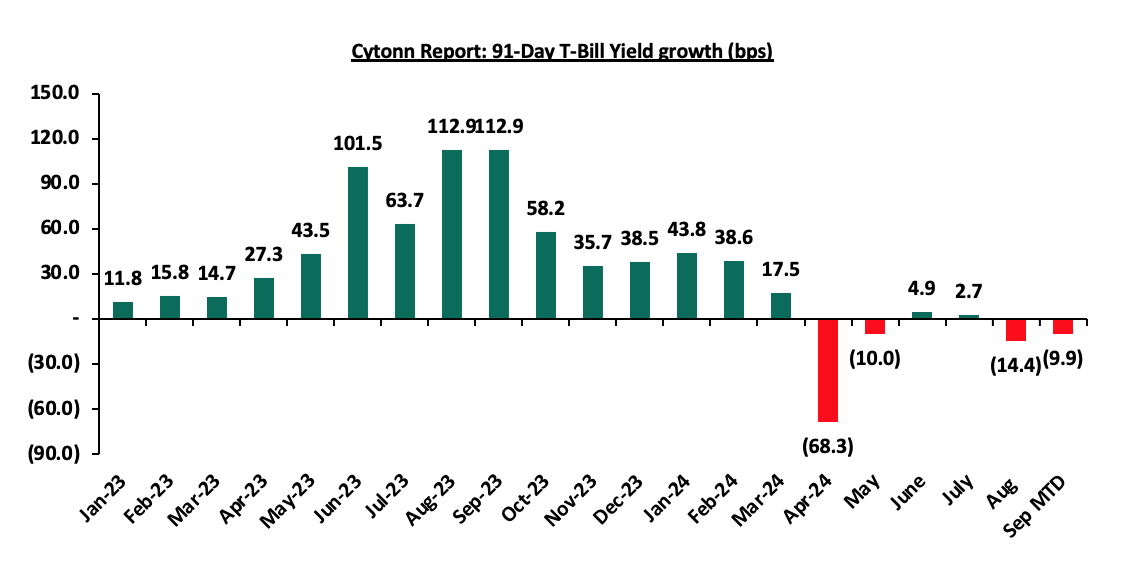
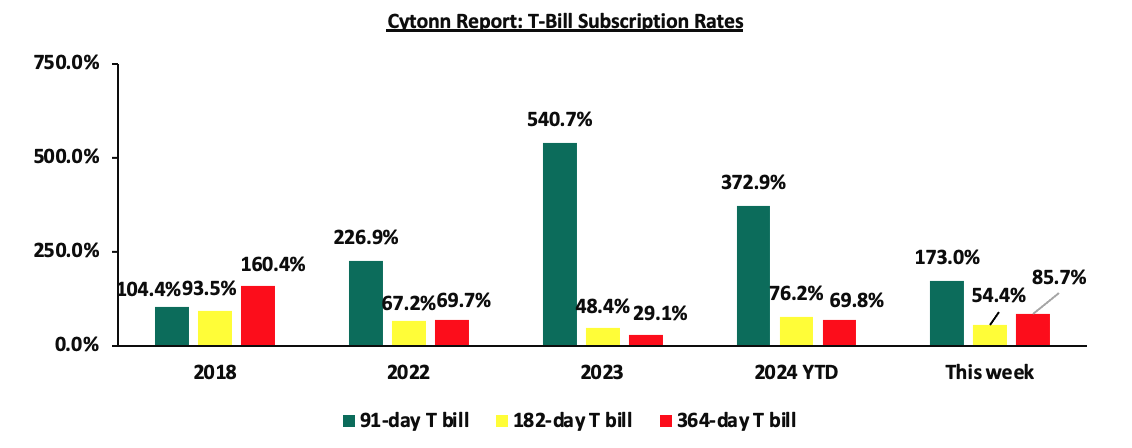
During the week, T-bills were undersubscribed, with the overall undersubscription rate coming in at 87.2%, a reversal from the oversubscription rate of 126.4% recorded the previous week. Investors’ preference for the shorter 91-day paper persisted, with the paper receiving bids worth Kshs 6.9 bn against the offered Kshs 4.0 bn, translating to an oversubscription rate of 173.0%, albeit lower than the oversubscription rate of 283.9% recorded the previous week. The subscription rates for the 182-day and 364-day papers decreased to 54.4% and 85.7% respectively from the 84.1% and 105.8% respectively recorded the previous week. The government accepted a total of Kshs 12.5 bn worth of bids out of Kshs 20.9 bn bids received, translating to an acceptance rate of 59.6%. The yields on the government papers were on a downward trajectory, with the yields on the 364-day, 182-day, and 91-day papers decreasing by 1.3 bps, 2.7 bps and 2.8 bps to remain relatively unchanged from the 16.8%, 16.6% and 15.8% respectively recorded the previous week. The chart below shows the yield growth rate for the 91-day paper over the period:
The chart below compares the overall average T-bill subscription rates obtained in 2018, 2022, 2023, and 2024 Year-to-date (YTD):
Money Market Performance:
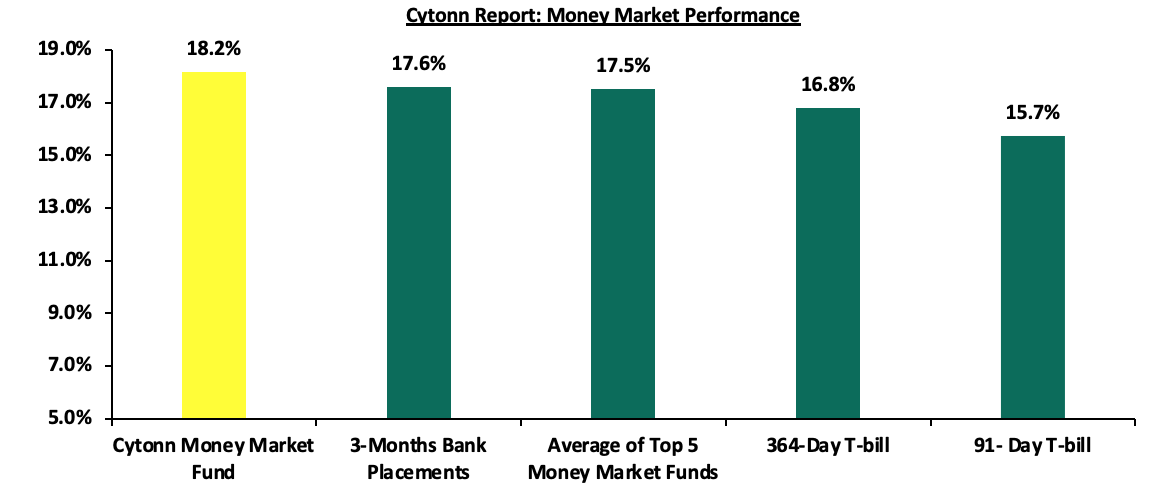
In the money markets, 3-month bank placements ended the week at 17.6% (based on what we have been offered by various banks), and the yields on the government papers were on a downward trajectory, with the yields on the 364-day and 91-day papers decreasing by 1.3 bps and 2.8 bps respectively, to remain relatively unchanged from the 16.8% and 15.8% recorded the previous week. The yields on the Cytonn Money Market Fund decreased marginally by 3.0 bps to close the week at 18.2% relatively unchanged from the previous week, while the average yields on the Top 5 Money Market Funds decreased by 7.0 bps to 17.5% from the 17.6% recorded the previous week.
The table below shows the Money Market Fund Yields for Kenyan Fund Managers as published on 27th September 2024:
|
Cytonn Report: Money Market Fund Yield for Fund Managers as published on 27th September 2024 |
||
|
Rank |
Fund Manager |
Effective Annual Rate |
|
1 |
Cytonn Money Market Fund (Dial *809# or download the Cytonn App) |
18.2% |
|
2 |
Lofty-Corban Money Market Fund |
18.1% |
|
3 |
Etica Money Market Fund |
17.4% |
|
4 |
Arvocap Money Market Fund |
17.1% |
|
5 |
Kuza Money Market fund |
16.9% |
|
6 |
GenAfrica Money Market Fund |
16.5% |
|
7 |
Nabo Africa Money Market Fund |
16.1% |
|
8 |
Jubilee Money Market Fund |
16.0% |
|
9 |
Enwealth Money Market Fund |
16.0% |
|
10 |
Madison Money Market Fund |
15.7% |
|
11 |
KCB Money Market Fund |
15.3% |
|
12 |
Co-op Money Market Fund |
15.3% |
|
13 |
Mali Money Market Fund |
15.2% |
|
14 |
Genghis Money Market Fund |
15.2% |
|
15 |
Sanlam Money Market Fund |
15.1% |
|
16 |
Apollo Money Market Fund |
15.1% |
|
17 |
Absa Shilling Money Market Fund |
15.0% |
|
18 |
Orient Kasha Money Market Fund |
15.0% |
|
19 |
AA Kenya Shillings Fund |
14.7% |
|
20 |
Stanbic Money Market Fund |
14.5% |
|
21 |
Mayfair Money Market Fund |
14.3% |
|
22 |
Old Mutual Money Market Fund |
14.0% |
|
23 |
Dry Associates Money Market Fund |
13.9% |
|
24 |
ICEA Lion Money Market Fund |
13.8% |
|
25 |
CIC Money Market Fund |
13.7% |
|
26 |
British-American Money Market Fund |
13.2% |
|
27 |
Equity Money Market Fund |
12.6% |
Source: Business Daily
Liquidity:
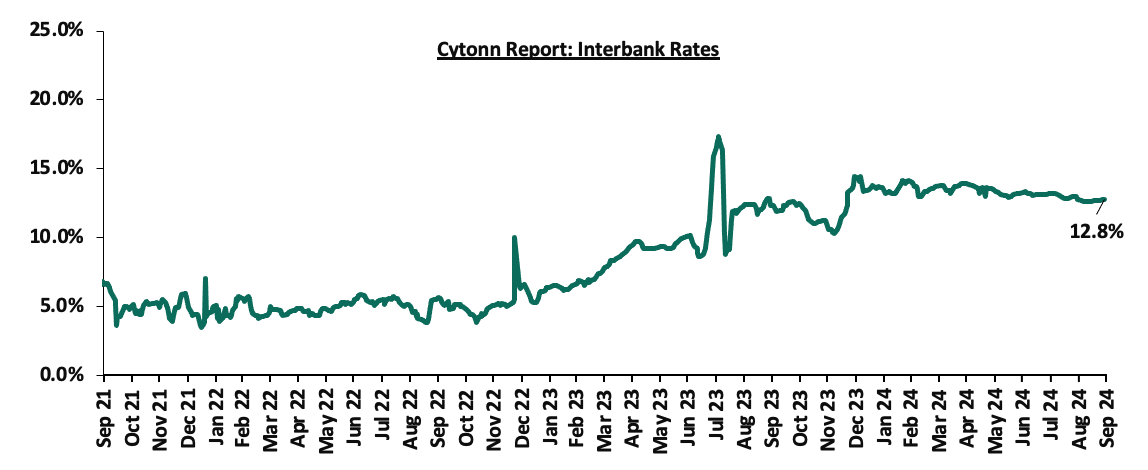
During the week, liquidity in the money markets tightened, with the average interbank rate increasing marginally by 5.2 bps, to remain relatively unchanged from the 12.7% recorded the previous week, partly attributable to tax remittances that offset government payments. The average interbank volumes traded decreased by 27.0% to Kshs 18.1 bn from Kshs 24.8 bn recorded the previous week. The chart below shows the interbank rates in the market over the years:
Kenya Eurobonds:
During the week, the yields on Eurobonds were on a downward trajectory, with the yields on the 7-year Eurobond issued in 2018 decreasing the most by 83.7 bps to 8.3% from 9.1% recorded the previous week. The table below shows the summary of the performance of the Kenyan Eurobonds as of 26th September 2024;
|
Cytonn Report: Kenya Eurobonds Performance |
||||||
|
|
2018 |
2019 |
2021 |
2024 |
||
|
Tenor |
10-year issue |
30-year issue |
7-year issue |
12-year issue |
13-year issue |
7-year issue |
|
Amount Issued (USD) |
1.0 bn |
1.0 bn |
0.9 bn |
1.2 bn |
1.0 bn |
1.5 bn |
|
Years to Maturity |
3.4 |
23.4 |
2.6 |
7.7 |
9.7 |
6.4 |
|
Yields at Issue |
7.3% |
8.3% |
7.0% |
7.9% |
6.2% |
10.4% |
|
01-Jan-24 |
9.8% |
10.2% |
10.1% |
9.9% |
9.5% |
|
|
02-Sep-24 |
10.2% |
10.7% |
9.9% |
10.4% |
10.3% |
10.5% |
|
19-Sep-24 |
9.3% |
10.4% |
9.1% |
10.0% |
9.9% |
10.1% |
|
20-Sep-24 |
9.4% |
10.4% |
9.4% |
10.1% |
10.0% |
10.1% |
|
23-Sep-24 |
9.4% |
10.4% |
9.4% |
10.1% |
10.0% |
10.2% |
|
24-Sep-24 |
9.1% |
10.2% |
9.1% |
9.9% |
9.7% |
9.9% |
|
25-Sep-24 |
8.7% |
10.0% |
8.6% |
9.6% |
9.4% |
9.6% |
|
26-Sep-24 |
8.5% |
9.9% |
8.3% |
9.4% |
9.4% |
9.4% |
|
Weekly Change |
(0.7%) |
(0.5%) |
(0.8%) |
(0.5%) |
(0.5%) |
(0.6%) |
|
MTD Change |
(1.7%) |
(0.9%) |
(1.6%) |
(1.0%) |
(1.0%) |
(1.1%) |
|
YTD Change |
(1.3%) |
(0.3%) |
(1.9%) |
(0.5%) |
(0.1%) |
- |
Source: Central Bank of Kenya (CBK) and National Treasury
Kenya Shilling:
During the week, the Kenya Shilling depreciated marginally against the US Dollar by 1.2 bps, to remain relatively unchanged at the Kshs 129.2 recorded the previous week. On a year-to-date basis, the shilling has appreciated by 17.7% against the dollar, a contrast to the 26.8% depreciation recorded in 2023.
We expect the shilling to be supported by:
- Diaspora remittances standing at a cumulative USD 4,645.0 mn in the 12 months to August 2024, 12.7% higher than the USD 4,120.0 mn recorded over the same period in 2023, which has continued to cushion the shilling against further depreciation. In the August 2024 diaspora remittances figures, North America remained the largest source of remittances to Kenya accounting for 56.0% in the period, and,
- The tourism inflow receipts which came in at USD 352.5 bn in 2023, a 31.5% increase from USD 268.1 bn inflow receipts recorded in 2022, and owing to tourist arrivals that improved by 27.2% in the 12 months to June 2024, from the arrivals recorded during a similar period in 2023.
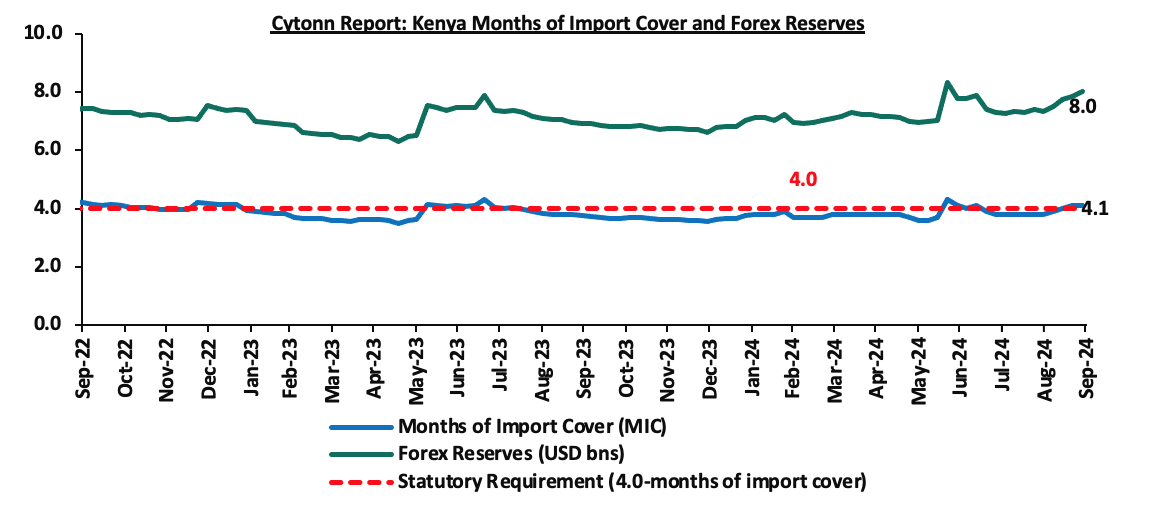
- Improved forex reserves currently at USD 8.0bn (equivalent to 4.1-months of import cover), which is above the statutory requirement of maintaining at least 4.0-months of import cover, but lower than the EAC region’s convergence criteria of 4.5-months of import cover.
The shilling is however expected to remain under pressure in 2024 as a result of:
- An ever-present current account deficit which came at 3.2% of GDP in Q1’2024 from 3.0% recorded in Q1’2023, and,
- The need for government debt servicing, continues to put pressure on forex reserves given that 67.9% of Kenya’s external debt is US Dollar-denominated as of March 2024.
Key to note, Kenya’s forex reserves increased by 2.1% during the week to close the week at USD 8.0 bn from the USD 7.9 bn recorded the previous week, equivalent to 4.1 months of import cover unchanged from the 4.1 months recorded last week, and above to the statutory requirement of maintaining at least 4.0-months of import cover. The chart below summarizes the evolution of Kenya's months of import cover over the years:
Weekly Highlights:
- September Inflation projection
We are projecting the y/y inflation rate for September 2024 to come in at the range of 4.1% - 4.4% mainly on the back of:
- Reduction in electricity prices – In September 2024, electricity costs per kWh decreased to Kshs 28.6 from Kshs 28.8 last month, on the back of decreased fuel cost charge (FCC) and Foreign Exchange Rate Fluctuation Adjustment (FERFA). With electricity being one of the major inputs of inflation, this increase is expected to increase production costs for businesses as well as increase electricity costs for households and thus tightening inflation, and,
- Stable Fuel Prices in September – In their last fuel release, EPRA announced that the maximum allowed price for Super Petrol and Diesel remained unchanged from the prices announced for the month of August, while the maximum price allowed for Kerosene decreased by Kshs 3.4 per litre. Consequently, Super Petrol and Diesel continued to retail at Kshs 188.8 and Kshs 171.6 per litre respectively, while Kerosene retailed at Kshs 158.4 per litre from Kshs 161.8 in August. This followed the government's efforts to stabilize pump prices through the petroleum pump price stabilization mechanism which expended Kshs 9.9 bn in the FY’2023/24 to cushion the increases applied to the petroleum pump prices. This stability in fuel prices is likely to provide a stabilizing effect on consumer purchasing power as well as business operational costs, since fuel is a major input cost for businesses.
We, however, expect that the effect on inflation will be weighed down by:
- The decrease in the Central Bank Rate (CBR) by 25.0 bps to 12.75% from 13.00% – Earlier this year, the monetary policy committee noted that, there was need to tighten the monetary policy following the sustained depreciation of the Kenyan shilling as well as the heightened inflationary pressures which came in at 6.9% in the month of January, 0.3% points increase from the 6.6% in December and remaining within the upper bound of the inflation target range of 2.5% to 7.5%. In line with this, the committee increased the CBR by 50 bps to 13.00% from 12.50% in February. Additionally, the monetary policy committee decided to maintain the CBR at 13.00% in the April and June meetings to give the new rate time to take further effect in the economy. On 6th August 2024, the MPC lowered the CBR by 25.0 bps to 12.75% from 13.00% rate noting that its previous measures have successfully reduced overall inflation to below the mid-point of the target range of 2.5% - 7.5%, stabilized the exchange rate, and anchored inflationary expectations. This reduction in the CBR is likely to increase the money supply and lower borrowing costs, which may cause a slight rise in inflation rates as the effects of the CBR gradually take hold in the broader economy, and,
- Slight depreciation of the Kenya Shilling against the US Dollar – The Kenya Shilling has recorded a marginal 1.7 bps month-to-date decline as of 28th August 2024 to remain relatively unchanged at Kshs 129.2, and a 17.7% year-to-date gain from the Kshs 157.0 recorded at the beginning of the year. This depreciation in the exchange rate, though slight, could increase inflationary pressures.
Going forward, we expect inflationary pressures to remain anchored in the short term, remaining in the CBK’s target range of 2.5%-7.5% aided by the stable fuel prices, decreased energy costs and stability in the exchange rate. However, risks remain, particularly from the potential for increased demand-driven inflation due to accommodative monetary policy. The decision to lower the CBR to 12.75% during the latest MPC meeting will likely increase money supply, in turn possibly increasing inflation, especially with further cuts expected in the coming meetings. The CBK’s ability to balance growth and inflation through close monitoring of both inflation and exchange rate stability will be key to maintaining inflation within the target range.
Rates in the Fixed Income market have been on an upward trend given the continued high demand for cash by the government and the occasional liquidity tightness in the money market. The government is 121.2% ahead of its prorated net domestic borrowing target of Kshs 102.1bn, having a net borrowing position of Kshs 225.9 bn. However, we expect a downward readjustment of the yield curve in the short and medium term, with the government looking to increase its external borrowing to maintain the fiscal surplus, hence alleviating pressure in the domestic market. As such, we expect the yield curve to normalize in the medium to long-term and hence investors are expected to shift towards the long-term papers to lock in the high returns.
Market Performance:
During the week, the equities market recorded a mixed performance, with NSE 10, NSE 25, and NASI gaining by 1.6%, 1.3%, and 0.7% respectively while NSE 20 declined by 0.7%, taking the YTD performance to gains of 23.4%, 21.6%, 17.8%, and 16.5% for NSE 10, NSE 25, NSE 20, and NASI respectively. The equities market performance was driven by gains recorded by large-cap stocks such as DTB-K, NCBA, and Equity Group of 5.5%, 3.9%, and 3.5% respectively. The performance was, however, weighed down by losses recorded by large-cap stocks such as Bamburi, ABSA, and BAT of 27.3%, 1.4%, and 0.9% respectively.
During the week, equities turnover decreased by 25.8% to USD 8.1 mn from USD 10.9 mn recorded the previous week, taking the YTD total turnover to USD 482.4 mn. Foreign investors remained net buyers for the third consecutive week with a net buying position of USD 1.2 mn, from a net buying position of USD 0.1 mn recorded the previous week, taking the YTD foreign net buying to USD 2.2 mn.
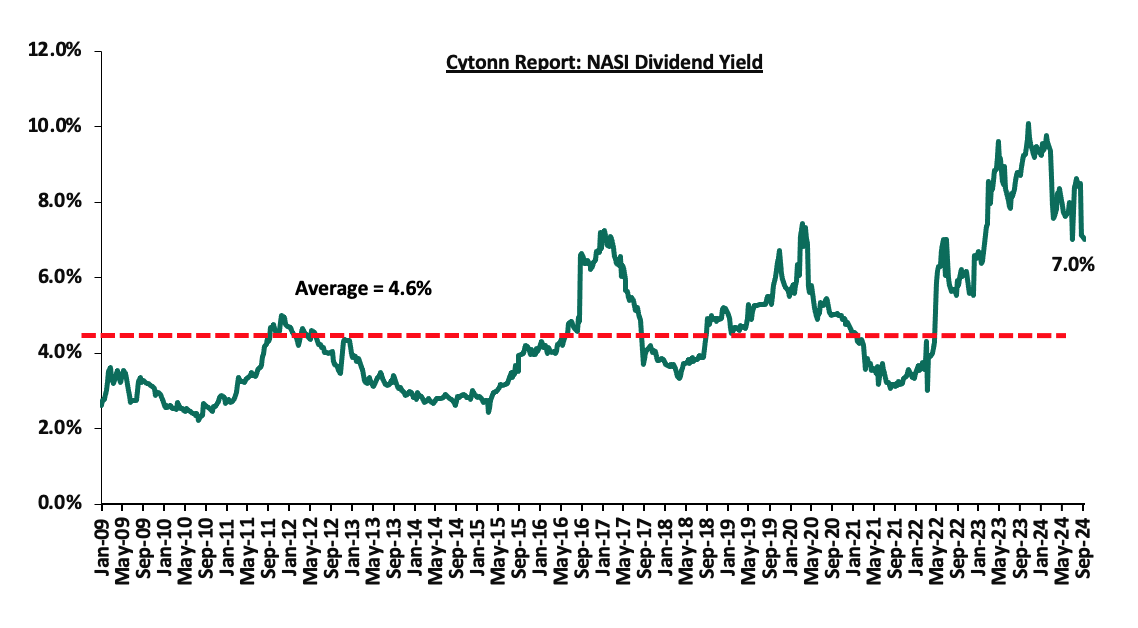
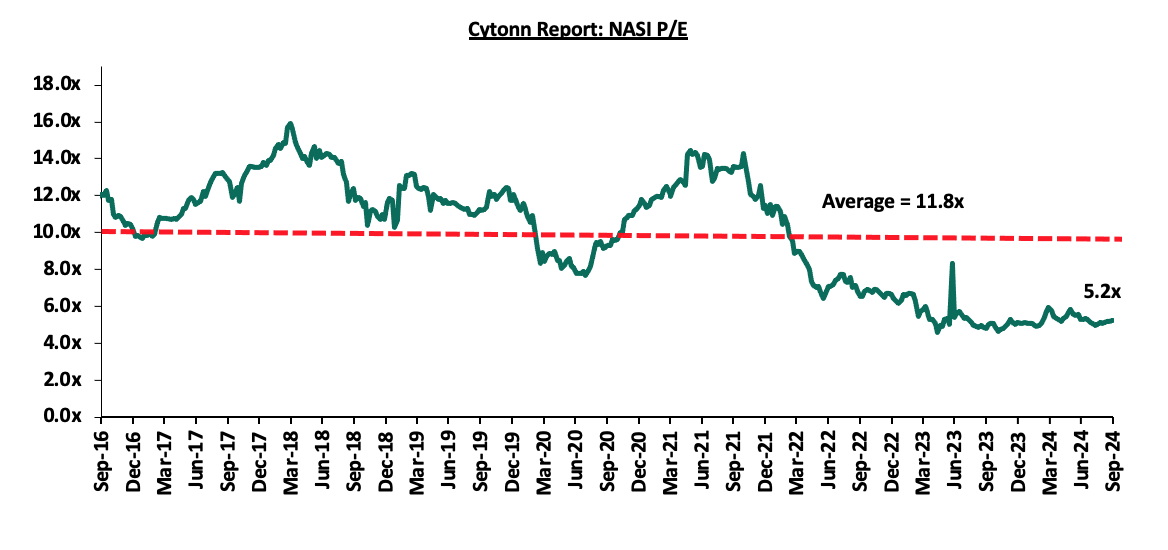
The market is currently trading at a price-to-earnings ratio (P/E) of 5.2x, 55.5% below the historical average of 11.8x. The dividend yield stands at 7.0%, 2.4% points above the historical average of 4.6%. Key to note, NASI’s PEG ratio currently stands at 0.7x, an indication that the market is undervalued relative to its future growth. A PEG ratio greater than 1.0x indicates the market is overvalued while a PEG ratio less than 1.0x indicates that the market is undervalued. The charts below indicate the historical P/E and dividend yields of the market;
Universe of Coverage:
|
Cytonn Report: Equities Universe of Coverage |
||||||||||
|
Company |
Price as at 20/09/2027 |
Price as at 27/09/2024 |
w/w change |
YTD Change |
Year Open 2024 |
Target Price* |
Dividend Yield |
Upside/ Downside** |
P/TBv Multiple |
Average |
|
Jubilee Holdings |
160.0 |
172.0 |
7.5% |
(7.0%) |
185.0 |
260.7 |
8.3% |
59.9% |
0.3x |
Buy |
|
Equity Group |
42.0 |
43.5 |
3.5% |
27.0% |
34.2 |
60.2 |
9.2% |
47.8% |
0.9x |
Buy |
|
Diamond Trust Bank |
46.7 |
49.3 |
5.5% |
10.1% |
44.8 |
65.2 |
10.2% |
42.5% |
0.2x |
Buy |
|
Co-op Bank |
13.3 |
13.3 |
0.0% |
16.7% |
11.4 |
17.2 |
11.3% |
41.1% |
0.6x |
Buy |
|
NCBA |
41.0 |
42.6 |
3.9% |
9.7% |
38.9 |
55.2 |
11.2% |
40.7% |
0.8x |
Buy |
|
CIC Group |
2.1 |
2.1 |
0.0% |
(8.7%) |
2.3 |
2.8 |
6.2% |
40.2% |
0.7x |
Buy |
|
Stanbic Holdings |
116.0 |
118.5 |
2.2% |
11.8% |
106.0 |
145.3 |
13.0% |
35.6% |
0.8x |
Buy |
|
ABSA Bank |
14.3 |
14.1 |
(1.4%) |
22.1% |
11.6 |
17.3 |
11.0% |
33.7% |
1.1x |
Buy |
|
KCB Group |
33.9 |
35.0 |
3.4% |
59.5% |
22.0 |
46.7 |
0.0% |
33.3% |
0.5x |
Buy |
|
Britam |
5.8 |
6.0 |
3.4% |
16.7% |
5.1 |
7.5 |
0.0% |
25.0% |
0.8x |
Buy |
|
I&M Group |
23.6 |
23.6 |
0.2% |
35.2% |
17.5 |
26.5 |
10.8% |
23.1% |
0.5x |
Buy |
|
Target Price as per Cytonn Analyst estimates **Upside/ (Downside) is adjusted for Dividend Yield Dividend Yield is calculated using FY’2023 Dividends |
||||||||||
We are “Neutral” on the Equities markets in the short term due to the current tough operating environment and huge foreign investor outflows, and, “Bullish” in the long term due to current cheap valuations and expected global and local economic recovery. With the market currently being undervalued for its future growth (PEG Ratio at 0.7x), we believe that investors should reposition towards value stocks with strong earnings growth and that are trading at discounts to their intrinsic value. We expect the current high foreign investors’ sell-offs to continue weighing down the equities outlook in the short term.
- Residential Sector
During the week, the Kenya Mortgage Refinance Company (KMRC) broadened its refinancing services to include non-shareholders, such as SACCOs and microfinance institutions. This is a strategic move to improve access to affordable mortgages, particularly for low- and middle-income earners, a key target of Kenya's affordable housing agenda.
Initially, KMRC provided refinancing only to its shareholder banks and institutions. By expanding this access, smaller financial institutions can now offer their clients long-term, lower-interest mortgages, a service previously limited to larger commercial banks. KMRC offers these loans at an interest rate of 5.0%, allowing lenders to pass on the benefit to end consumers, who can access mortgages at rates as low as 9.0%.
Within the year, KMRC has implemented a number of measures to increase mortgage uptake. These measures include increasing the monthly income of eligible borrowers from Kshs 150,000 to Kshs 200,000 and also increasing the maximum amount that can be accessible from Kshs 8.0 mn and Kshs 6.0 mn for the Nairobi Metropolitan Area and the rest of the country, respectively, to Kshs 10.5 mn.
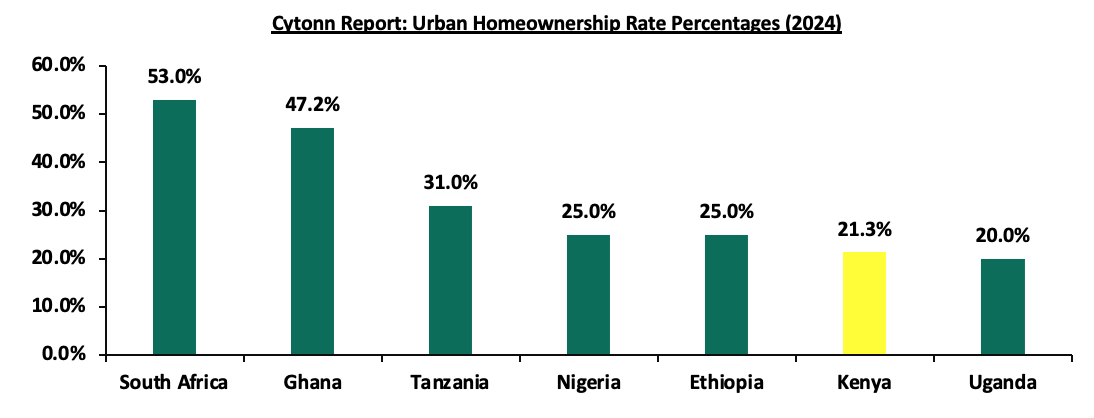
We expect this step to greatly boost home ownership, especially in a market where mortgage uptake remains low due to high interest rates and short repayment terms. The expansion supports and boosts the government’s affordable housing plan, which targets constructing 250,000 housing units annually. The inclusion of more lenders will make affordable mortgage financing more widely accessible, contributing to increased homeownership rates across the country which currently stands at 21.3% in urban areas, which remains significantly low compared to other countries like South Africa (53.0%) and Ghana (47.2%) as shown in the chart below.
Source: Cytonn Research
This figure highlights the need for more affordable housing initiatives, as the country continues to face a housing deficit of approximately 2.0 mn units. The low homeownership rate is attributed to factors such as high property prices, limited access to affordable financing, and rapid urbanization. Programs like the government's Affordable Housing initiative are working to address this deficit and improve homeownership rates by offering subsidized housing options to lower-middle and middle-income earners.
- Commercial Sector
During the week, the Kenya Ports Authority (KPA) announced plans to construct a multi-storeyed office tower away from the Mombasa port in a bid to ease congestion, improve security, and create new revenue streams by renting out offices and conference rooms. The proposed tower will still be located in Mombasa near the port. The proposed complex will comprise approximately 40,000 SQM of office space for KPA staff, four times the space they are using now. It will also feature 10,000 SQM of lettable office space, 4,000 SQM for commercial suites, and 10,000 SQM dedicated to a conference facility. Additionally, the building will accommodate about 1,200 parking spaces and include a helipad. Below is the space utilization for the proposed tower;
|
Cytonn Report: KPA Proposed Tower Space Distribution |
|
|
Use |
Plinth Area (SQM) |
|
Lettable office space |
10,000 |
|
Lettable commercial Suites |
4,000 |
|
Conventional and conferencing facility |
10,000 |
|
Parking Space |
16,000 |
|
Total |
40,000 |
Source: Cytonn Research
The relocation will also allow the current office space being utilized of about 10,000 SQM, to be used for container handling and storage and therefore ease congestion at the port. The new complex will be on a parcel of land that currently has mixed-use facilities supporting infrastructure for KPA. Moreover, KPA aims to increase its financial base by targeting new customers for rentals, including shipping lines, importers, exporters, and shipping agencies. The relocation will limit access to the port to essential service and operational personnel, making it easier to control and manage security.
The new office building is part of KPA's larger plan to modernize and streamline operations across its facilities. By reducing congestion, KPA expects to cut down on the time it takes to process goods, which has been a significant challenge due to the high volumes of cargo handled at the Mombasa port. Additionally, these efforts are likely to improve the Authority's financial position by increasing the capacity to handle more ships and cargo, thus attracting more business and boosting revenue.
With these developments, KPA is positioning itself to handle future increases in cargo traffic, particularly from regional partners like Ethiopia and South Sudan, which have shown interest in using Kenya’s port infrastructure. These improvements come at a critical time as the country seeks to establish Mombasa as a premier port in the region, capable of competing with other major African hubs.
The Kenya Ports Authority's (KPA) new office complex and broader decongestion strategy for the Mombasa port are expected to have a positive ripple effect on the real estate sector. By moving administrative offices away from the port, the surrounding areas in Mombasa are likely to experience increased demand for both commercial and residential real estate. With better port efficiency, more businesses, especially in logistics, warehousing, and import/export industries, will be attracted to the region, boosting demand for office spaces and warehousing facilities.
Additionally, enhanced port operations can lead to job creation, attracting a higher population to Mombasa, which would drive up demand for housing. The improvement of infrastructure around the port and the influx of businesses could lead to the development of residential estates targeting middle-income earners, fueling the growth of the housing market. Moreover, the relocation of offices might spur urban development in previously underdeveloped areas, increasing land and property values.
- Real Estate Investments Trusts (REITs)
- REIT Weekly Performance
On the Unquoted Securities Platform, Acorn D-REIT and I-REIT traded at Kshs 25.4 and Kshs 22.2 per unit, respectively, as per the last updated data on 27th September 2024. The performance represented a 27.0% and 11.0% gain for the D-REIT and I-REIT, respectively, from the Kshs 20.0 inception price. The volumes traded for the D-REIT and I-REIT came in at Kshs 12.3 mn and Kshs 31.6 mn shares, respectively, with a turnover of Kshs 311.5 mn and Kshs 702.7 mn, respectively, since inception in February 2021. Additionally, ILAM Fahari I-REIT traded at Kshs 11.0 per share as of 27th September, 2024, representing a 45.0% loss from the Kshs 20.0 inception price. The volume traded to date came in at 138,600 for the I-REIT, with a turnover of Kshs 1.5 mn since inception in November 2015.
REITs offer various benefits, such as tax exemptions, diversified portfolios, and stable long-term profits. However, the ongoing decline in the performance of Kenyan REITs and the restructuring of their business portfolios are hindering significant previous investments. Additional general challenges include; i) insufficient understanding of the investment instrument among investors, ii) lengthy approval processes for REIT creation, iii) high minimum capital requirements of Kshs 100.0 mn for trustees, and iv) minimum investment amounts set at Kshs 5.0 mn for the Investment REITs, all of which continue to limit the performance of the Kenyan REITs market.
We expect the performance of Kenya’s real estate sector to be sustained by: i) Favorable demographics in the country, leading to higher demand for housing and Real Estate, and iii) ongoing residential developments under the Affordable Housing Agenda, aiming to reduce the housing deficit in the country iv) increased recognition of Nairobi as a shopping hub boosting the retail sector, v) increased infrastructural development in the country opening up satellite towns for more investment opportunities giving rise to need of commercial spaces for business and offices.
The private sector in Kenya plays a crucial role in the country's economic development, as improved access to private sector credit translates to real GDP growth in the country. Access to credit is essential for businesses to grow, innovate, and remain competitive; and understanding the current state of credit availability in Kenya's private sector is vital for identifying the gaps and opportunities for improvement. According to the latest data from the Central Bank of Kenya (CBK), credit extended to the private sector in Kenya registered a minimal 4.0% growth as of June 2024, highlighting a slower pace of growth and underscoring the need for policy measures to stimulate lending and support business expansion. With the government currently seeking to reduce its fiscal deficit, creating an enabling environment to stimulate private sector growth, particularly for micro, small, and medium enterprises (MSMEs), will be instrumental in boosting revenue collection. This can be achieved through policy reforms aimed at enhancing the credit market, alongside the establishment of sector-specific funds designed to fuel business expansion in key sectors such as finance, agriculture, manufacturing, and transport. Kenya's private sector credit availability lags behind that of developed economies, with a heavy reliance on commercial banks, and limited access to alternative funding sources such as venture capital, equity financing, or government-backed credit programs. The banking sector remains the largest contributor of credit to businesses, accounting for 81.9% of the total Kshs 4.6 tn of credit extended to the sector, while the remaining portion is provided by other sources such as microfinance institutions and SACCOs.
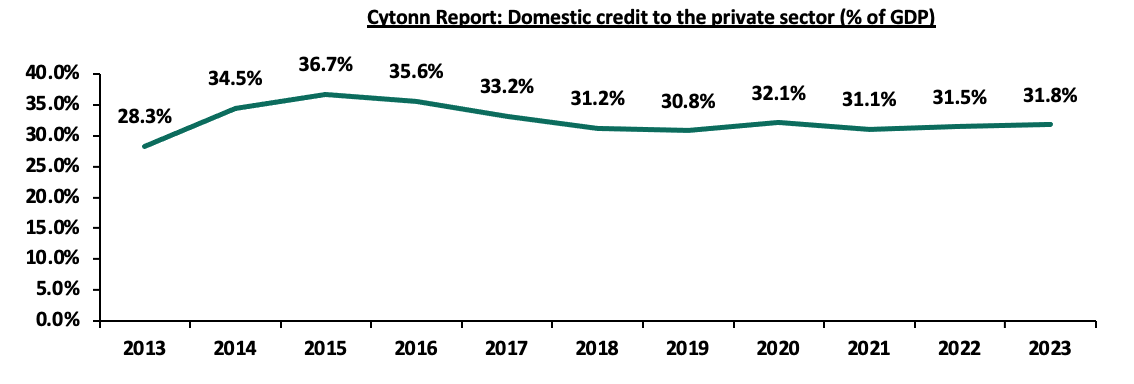
Key to note, the private sector credit from the banking sector stood at Kshs 3.8 tn as of May 2024, with the largest allocations to trade, manufacturing, and private households at 16.9%, 15.3%, and 14.9% respectively. Additionally, total credit to the private sector stood at Kshs 4.6 tn as of May 2024, with the largest allocation to private households accounting for Kshs 1.3 tn, equivalent to 27.1%. In 2023, Kenya’s domestic credit to the private sector by banks to GDP ratio stood at 31.8%, indicating Kenya must enhance credit access for the private sector while also broadening the range of available credit sources to reduce its heavy dependence on the banking sector. Diversifying credit options will strengthen the support for businesses and improve overall financial resilience.
We have been tracking the evolution of Kenya’s private sector credit growth and below are the most recent topicals we have done on the subject:
- The Private Sector Credit Growth - In November 2023, we highlighted Kenya’s state of lending to the private sector and gave our recommendations on what can be done to improve credit access to the private sector,
- The Hustler Fund- In December 2022, we highlighted the Financial Inclusion Fund, dubbed the “Hustler Fund” launched on 30th November 2022, aimed at improving credit access to citizens at the bottom of the pyramid who have often struggled to obtain affordable credit,
- Kenya’s Credit Reference Bureau Framework- Released in November 2022, this topical sheds more light on the Credit Reference Bureau (CRB) Framework in Kenya following the announcement by the Central Bank of Kenya that it had updated the Credit Information Sharing Framework in November 2022, which mandated the Credit Reference Bureaus (CRBs) not to use negative credit scores as the only reason to deny credit, and recommended the fast implementation of the risk based pricing model by commercial banks, and,
- Kenya’s Private Sector Credit Growth- In November 2022, we highlighted Kenya’s state of lending to the private sector and gave our recommendations on what can be done to improve credit access to the private sector.
In this week’s topical, we shall focus on the state of credit availability in Kenya’s private sector, highlighting the evolution and current state of lending to the private sector. We will provide specific recommendations on measures that can be implemented to improve credit access to the private sector. We shall do this by looking into the following:
- Introduction,
- Overview of Kenya’s Private sector credit,
- Factors Driving Private Sector Lending Growth in Kenya,
- Role of Government and its Impact on Private Sector Credit Availability,
- Comparative analysis, and,
- Conclusion and Key consideration to improving private sector credit performance in Kenya
Section I: Introduction
The private sector represents the portion of the economy owned and managed by individuals, partnerships, and corporations, as opposed to being controlled by the government. Private sector credit refers to financial resources provided to these businesses by entities other than central banks, such as loans, trade credits, and the purchase of non-equity securities, which create repayment obligations. In Kenya, commercial banks, capital markets, SACCOs, microfinance institutions, and insurance companies are the key providers of credit to the private sector.
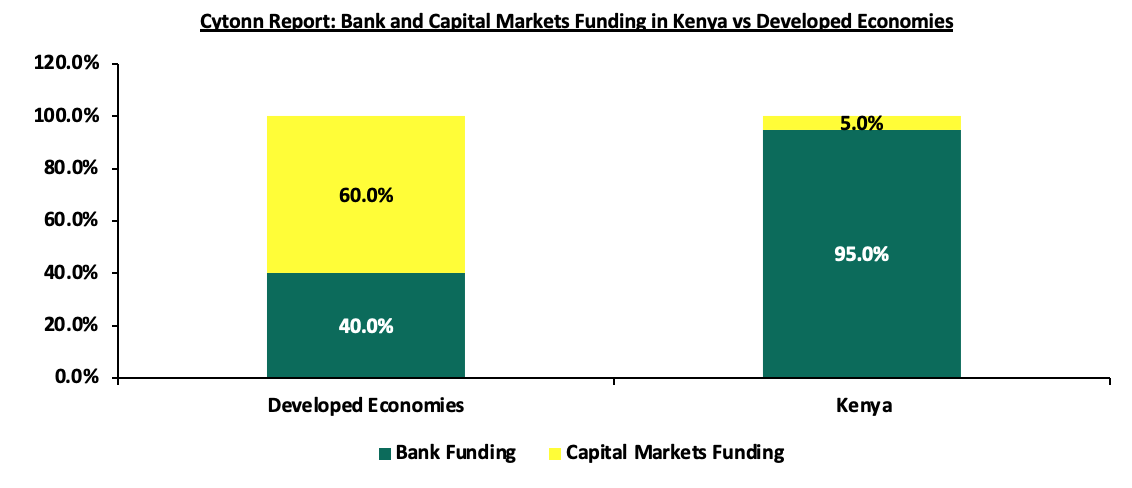
Kenya’s private sector, which is a major driver of economic growth and job creation, consists largely of small and medium-sized enterprises (SMEs), representing 90.0% of all private sector businesses, and employing nearly 88.0% of the workforce. However, accessing credit has proven challenging, particularly for SMEs and informal enterprises, due to the high-risk perceptions held by banks and the elevated costs of available credit options. This has created barriers for many businesses, hindering their potential for growth and competitiveness. While in more developed economies, only 40.0% of business financing comes from banks and a significant 60.0% is sourced from capital markets, the scenario in Kenya is quite different. According to the World Bank, Kenyan businesses depend on banks for 95.0% of their funding, with only a negligible 5.0% raised from capital markets, highlighting the limited role of alternative financing options.
Source: World Bank
Section II: Overview of Kenya’s Private Sector Credit
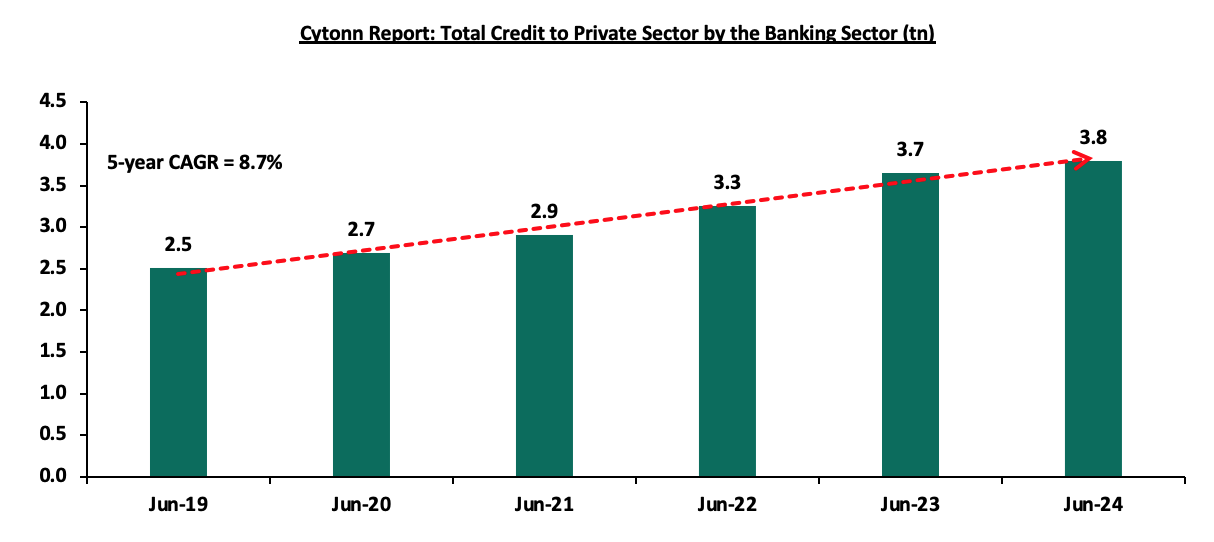
Over the last five years, there has been consistent growth in private sector lending, with the total credit extended to the private sector by banks increasing with a 5-year CAGR of 8.7%, to Kshs 3.8 tn in June 2024 from Kshs 2.5 tn in June 2019. The graph below shows the cumulative private credit over the period under review from the banking sector;
Source: Central Bank of Kenya
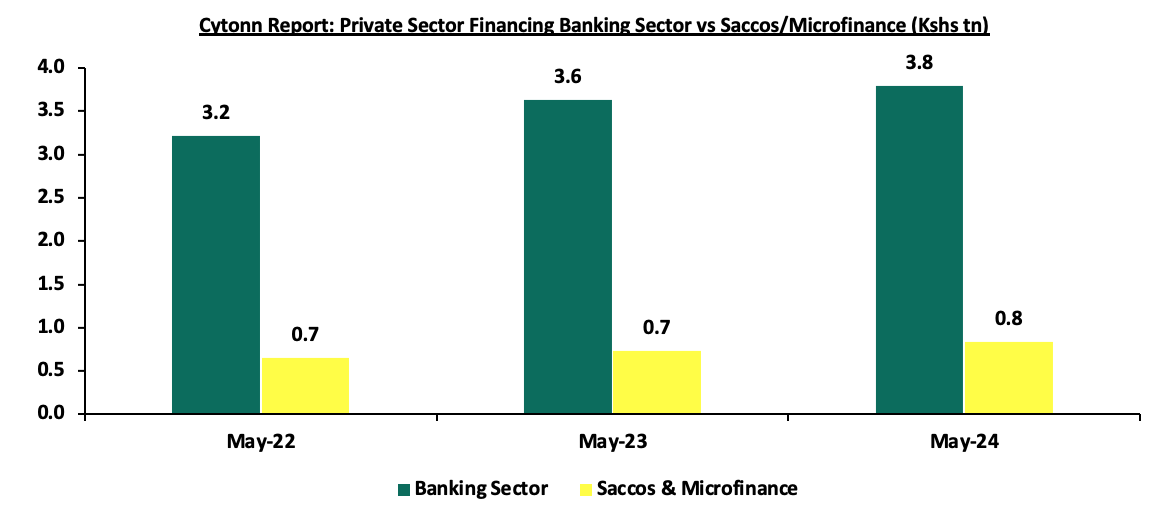
The Banking sector dominates lending in the private sector, contributing 81.9% of the total private sector lending, translating to Kshs 3.8 tn as of May 2024, with the rest of Kshs 0.8 tn, translating to 18.1% coming from SACCOs and Microfinance. To note, the percentage of credit by the SACCOs and Microfinance is slowly increasing, having increased by 1.3% points from 16.8% in a similar period in 2023. Notably, the highest allocation of total private sector credit in May 2024 was to the Private households at Kshs 1,255.1 bn, equivalent to 27.1% of the total credit extended to the private sector of Kshs 4,633.2 bn. From the banking sector, the trade sector had the highest allocation at Kshs 642.8 bn, equivalent to 16.9% of the total credit from the banking industry, followed by manufacturing and private households accounting for 15.3% and 14.9% respectively of the total credit from the banking sector. In terms of year-on-year credit growth, the Mining and Quarrying, as well as Agriculture sectors grew the most at 47.2% and 9.9% to Kshs 35.6 bn and Kshs 132.6 bn in May 2024, respectively, from Kshs 24.2 bn and Kshs 120.6 bn respectively in May 2023. The positive credit uptake shows the resilience of the two segments supported by an improved business environment following an ease in inflationary pressures during the period. The graph below shows the cumulate private sector credit over the past three years comparing banks vs SACCOs and Microfinance;
Source: Central Bank of Kenya
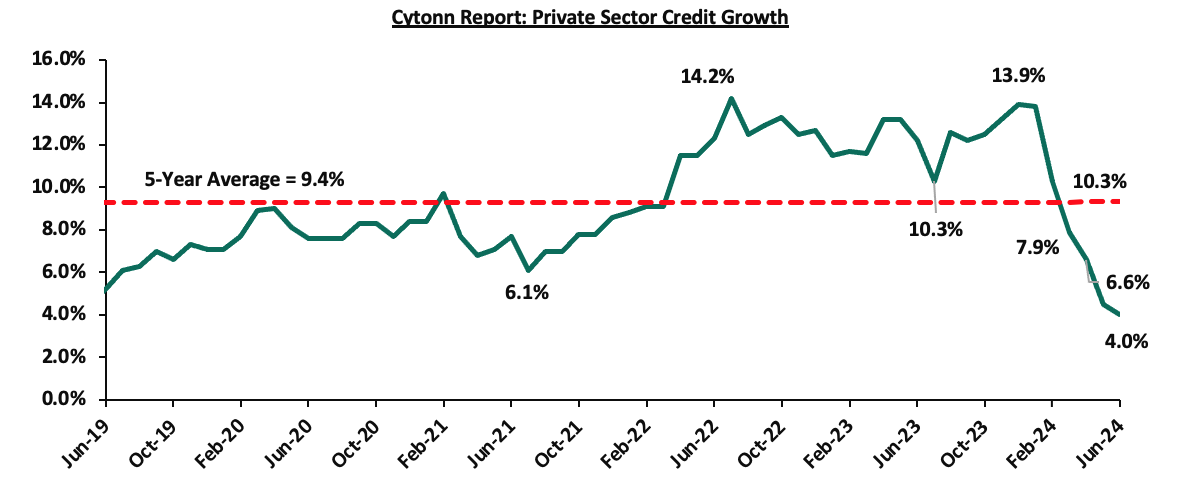
Private sector credit growth from the banking sector has been on a downward trajectory in 2024, reaching 4.0% in June 2024 compared to 12.2% in June 2023, marking the slowest pace of private sector credit growth in percentage terms since February 2019, when a 3.4% growth was recorded. This is attributable to reduced borrowing capacity by businesses and households as a result of higher interest rates and the effect of a stronger Kenyan shilling on foreign currency loans. The Central Bank of Kenya (CBK) implemented a tightened monetary policy to curb inflation and stabilize the currency, raising the CBR by 50.0 bps in February 2024 to 13.00% from 12.50% and maintaining the rate at 13.00% in its April and June meetings, which led to higher interest rates. Higher rates meant borrowing became more expensive for businesses and households, reducing demand for loans. Additionally, following the year-to-date appreciation of the Shilling, the valuation of foreign currency denominated loans reduced, hence the reflection on the low credit growth during the period. In June 2024, local currency loans increased by 10.2%, while foreign currency loans, which make up around 26.0% of total loans, decreased by 13.3%. Credit growth was mainly driven by sectors such as Mining and Quarrying, Agriculture, Private Households, and Real Estate which grew by 47.2%, 9.9%, 7.6%, and 7.3% YoY respectively. Key to note, Building and Construction, as well as the Finance and Insurance Sectors recorded y/y declines in credit uptake rates at 4.0% and 0.1% respectively. Credit growth was mainly driven by sectors such as Mining and Quarrying, Agriculture, Private Households, and Real Estate, which grew by 47.2%, 9.9%, 7.6%, and 7.3% YoY, respectively. Key to note, Building and Construction, as well as the Finance and Insurance sectors, recorded y/y declines in credit uptake rates at 4.0% and 0.1%, respectively. A continued rise in overall gross non-performing loans has contributed to the cautious approach by lenders in certain sectors. Elevated gross NPL levels have increased the risk profile for banks, with overall gross non-performing loans reaching Kshs 663.8 bn in May 2024, a 12.0% increase from Kshs 592.6 bn in May 2023. The table below shows the sectoral credit uptake growth on y/y and year-to-date basis from the banking sector:
|
Cytonn Report: Sectoral Credit Uptake (Kshs bn) |
|||||
|
|
May-23 |
Jan-24 |
May-24 |
Last 12 Months Change (%) |
YTD change (%) |
|
Mining and quarrying |
24.2 |
24.4 |
35.6 |
47.1% |
45.9% |
|
Agriculture |
120.6 |
150.9 |
132.6 |
10.0% |
(12.1%) |
|
Private households |
526 |
552.8 |
566.2 |
7.6% |
2.4% |
|
Real estate |
421.3 |
457.5 |
452.1 |
7.3% |
(1.2%) |
|
Other activities |
118.3 |
141.1 |
126.9 |
7.3% |
(10.1%) |
|
Consumer durables |
394.6 |
417.1 |
417.3 |
5.8% |
0.0% |
|
Transport & communication |
330.8 |
352 |
345.2 |
4.4% |
(1.9%) |
|
Trade |
625.8 |
667.6 |
642.8 |
2.7% |
(3.7%) |
|
Manufacturing |
571.6 |
644.1 |
580.5 |
1.6% |
(9.9%) |
|
Business services |
209.1 |
217.5 |
211 |
0.9% |
(3.0%) |
|
Finance & insurance |
151.2 |
159.1 |
151.1 |
(0.1%) |
(5.0%) |
|
Building and construction |
139.4 |
136.4 |
133.8 |
(4.0%) |
(1.9%) |
|
Total credit growth |
3633.1 |
3920.4 |
3795.0 |
4.5% |
(3.2%) |
Source: Central Bank of Kenya
The Kenyan private sector credit growth remains subdued even after the removal of the interest rates cap in November 2019. While the capping of interest rates was implemented to control lending rates to the sector, there was a contraction on the supply side of credit as banks had lower profit margins attributable to a tougher lending environment. However, with expectations for the shilling to remain strong and inflationary pressures in check, the private sector credit growth is expected to improve by the end of 2024. Additionally, the CBK's decision to lower the central bank rate by 25 basis points, to 12.75%, from 13.00% during its August meeting, along with the anticipated gradual easing of monetary policy, is likely to boost private sector borrowing. Both businesses and households are expected to take advantage of the cheaper credit, which would result in an increase in private sector credit growth, helping to reverse some of the slowdown experienced in the first half of the year. The chart below shows the movement of the private sector credit growth:
Source: Central Bank of Kenya
Section III: Factors Driving Private Sector Lending Growth in Kenya
Private sector credit uptake is influenced by a number of factors which include;
- Interest rates – The level of interest rates set by central banks and financial institutions significantly influences the credit market. For instance, the implementation of the Banking (Amendment) Act, in 2016 introduced interest capping following concerns raised by the public regarding the high cost of credit in Kenya, which was viewed as a hindrance to credit access by a large segment of the population. The cap, which restricted banks from charging interest rates exceeding 4.0% points above the Central Bank Rate (CBR), led to a low credit growth averaging at 3.7% for the capping period (August 2016-November 2019) as banks became more cautious in extending credit, particularly to riskier borrowers and for loans with smaller profit margins. However, on the demand side, high interest rates increase the cost of borrowing as well as the debt servicing costs which limits the ability to take additional credit. The average lending rate as at July 2024 stood at 16.8%, a 0.1% points decrease from 16.9% in June 2024. Notably, the move by the central bank to raise the CBR by 50.0 bps to 13.00% in February 2024 and maintaining the rate in its two subsequent meetings tightened liquidity within the economy forcing commercial banks to adjust their lending rates upwards as a response to the increased cost of funds for banks in the first half of the year. However, with the CBR being lowered in August by 25.0 bps to 12.75%, and with further gradual cuts expected, this dynamic is likely to shift,
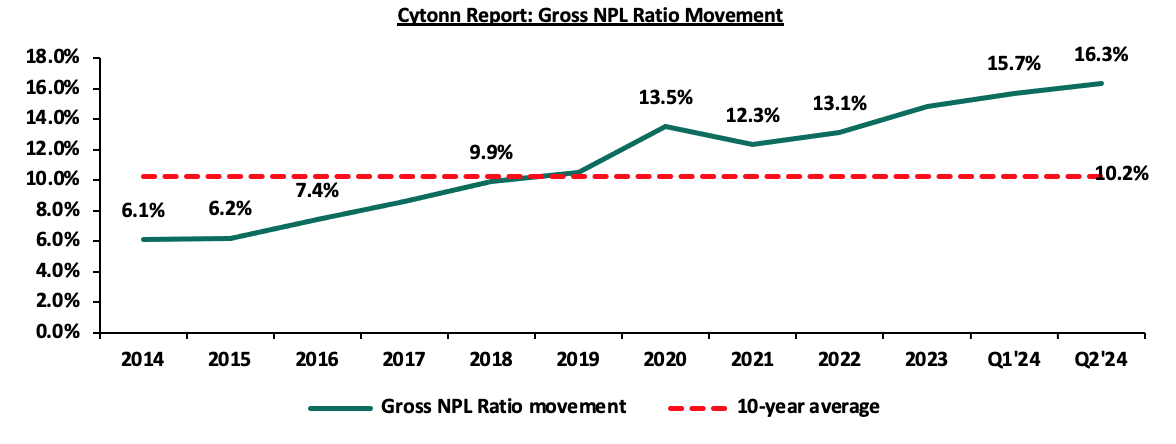
- Elevated Credit Risk which contributes to high risk premiums – The high-risk perception prompts lenders to incorporate risk premiums into the interest rates they charge on loans resulting in higher borrowing costs for individuals and businesses seeking credit. The risk premium acts as a cushion for lenders against potential losses, reflecting the level of uncertainty and perceived risk associated with the borrower. Additionally, according to the Central Bank of Kenya (CBK), credit risk remained elevated with Gross Non-Performing Loans (NPLs) to Gross Loans Ratio standing at 16.3% at the end of Q2’2023, a 0.6% points increase from 15.7% recorded at the end of Q1’2023. The graph below shows the movement for the years under review;
Source: Central Bank of Kenya
- Government domestic borrowing - Commercial banks have continued to hold the highest proportion of Government domestic debt, coming at 45.0% as at September 2024. This is mainly attributable to banks’ preference to lend to the government, which is considered a risk-free investment, effectively crowding out the private sector, which is considered riskier. Though the holding of domestic debt by commercial banks has declined from a high of 54.3% in the last 5 years, this continues to inhibit credit sector credit growth. The table below shows the holders of domestic public debt for the last 5 years;
|
Cytonn Report: Domestic Credit by Holders |
|||||||
|
|
Dec-18 |
Dec-19 |
Dec-20 |
Dec-21 |
Dec-22 |
Dec-23 |
Sep-24 |
|
Banking Institutions |
54.2% |
54.3% |
52.8% |
50.2% |
46.8% |
46.1% |
45.0% |
|
Insurance companies |
6.5% |
6.4% |
6.4% |
6.8% |
7.4% |
7.2% |
7.2% |
|
Parastatals |
6.7% |
6.5% |
5.7% |
5.6% |
6.1% |
5.5% |
5.3% |
|
Pension funds |
28.2% |
28.6% |
30.3% |
31.3% |
33.3% |
29.9% |
29.1% |
|
Other investors |
4.4% |
4.2% |
4.7% |
6.0% |
6.4% |
11.3% |
13.4% |
Source: Central Bank of Kenya
- Technological Advancements - Technological advancements such as Fintech Solutions and mobile banking systems have expanded digital lending with Mobile money platforms providing convenient access to credit, especially for individuals without traditional banking relationships, contributing to a more inclusive credit environment, reinforcing the role of technology in shaping the future of credit accessibility in Kenya. As digital financial services continue to evolve, more businesses and individuals can access the credit they need to grow, contributing to the overall economic development of the country,
- Inflation rates - High inflation prompted the Central Bank of Kenya to adopt a tight monetary policy, increasing borrowing costs for businesses and households. With higher lending rates, the cost of accessing credit rose, discouraging many from taking on new loans. Consequently, private sector credit growth slowed, particularly in sectors like manufacturing and trade, which struggled to finance operations and investments due to higher debt servicing costs. However, the Monetary Policy Committee's measures successfully reduced overall inflation to within the target range of 2.5% - 7.5%, bringing it down to 4.4% in August 2024, compared to 6.9% at the beginning of the year. Additionally, the Purchasing Managers Index (PMI) improved to 50.6% in August 2024, up from 49.8% in January 2024, indicating a better business environment. These anchored inflationary expectations are likely to create a more favourable environment for private sector credit growth, encouraging businesses and households to seek loans again as they anticipate lower interest,
- Over-reliance on the banking sector - Historically, banks have held a dominant position in facilitating credit to the private sector contributing 81.9% as of May 2024. This over-reliance has led to limited diversification of funding sources for businesses. Exploring alternative credit channels, such as capital markets and non-banking financial institutions, is essential for building a more resilient and diverse credit ecosystem, reducing the systemic risks associated with overdependence on the banking sector. As such, the government should implement strategies to improve other sectors such as leasing, venture capital funds, development finance institutions, and bonds and equity markets in order to create an environment that encourages a balanced and inclusive approach to credit facilitation, and,
- High cost of credit – There are other associated overhead costs incurred during borrowing such as bank fees, legal fees and government levies, valuation fees, and insurance that are borne by the borrower, in addition to the interest charged on loans. The overhead costs increase the cost of credit, hence limiting the demand for credit by the private sector.
Section IV: Role of Government and its Impact on Private Sector Credit Availability
- Impact of the Government on the Private Sector
The government of Kenya plays a crucial role in shaping the environment for private sector credit availability. The following are some of the ways in which the Kenyan Government impacts the flow of credit to the private sector;
- Government's Fiscal Policy and Debt Management
The government’s fiscal policy, particularly its domestic borrowing practices, has a profound effect on private sector credit availability. Heavy government borrowing from the domestic market competes with private sector borrowers for available credit, leading to a crowding-out effect. This occurs when increased government borrowing reduces the funds available for businesses, thereby driving up interest rates and limiting access to affordable credit. As a result, private sector investments are constrained, and financial market stability may be threatened.
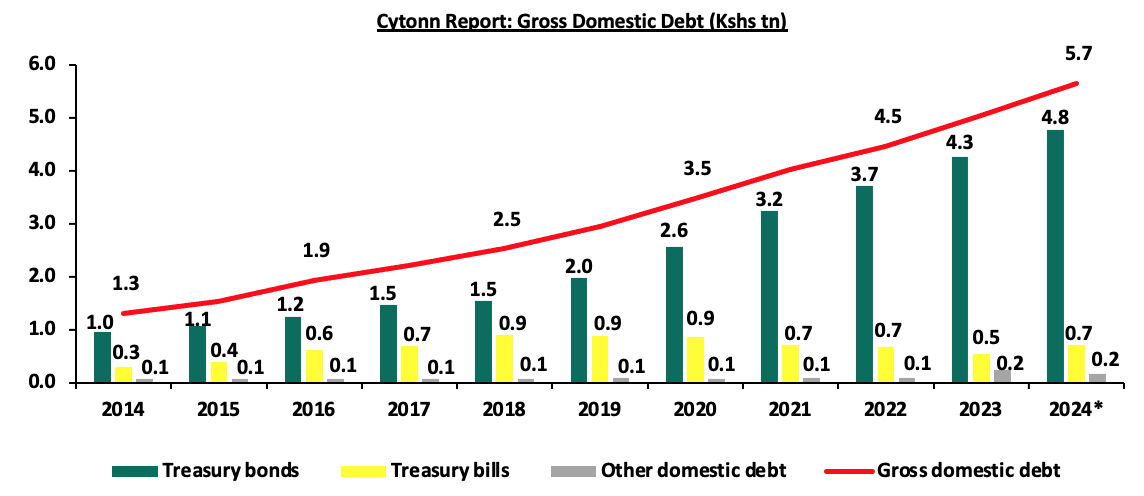
According to the Central Bank of Kenya (CBK), gross government domestic debt has grown at a 10-year Compounded Annual Growth Rate (CAGR) of 14.0%, reaching Kshs 5.7 tn in 2024 from Kshs 1.3 tn in 2014. The chart below shows the steady growth of gross domestic debt over this period;
Source: Central Bank of Kenya (CBK)
*data as of 27th September, 2024
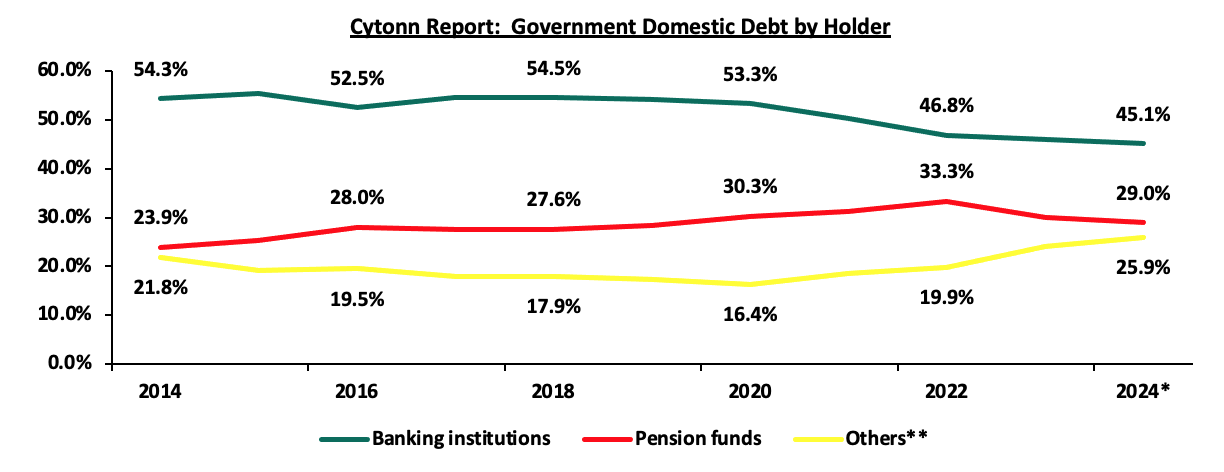
Additionally, during the same period, commercial banks held an average of 51.5% of this domestic debt, heightening the risk of crowding out the private sector, as banks prefer lending to the government over private businesses. The chart below highlights the distribution of government debt holdings across various institutions;
Source: Central Bank of Kenya (CBK)
*data as of 25th September, 2024
**Others include insurance companies, parastatals and retail holders
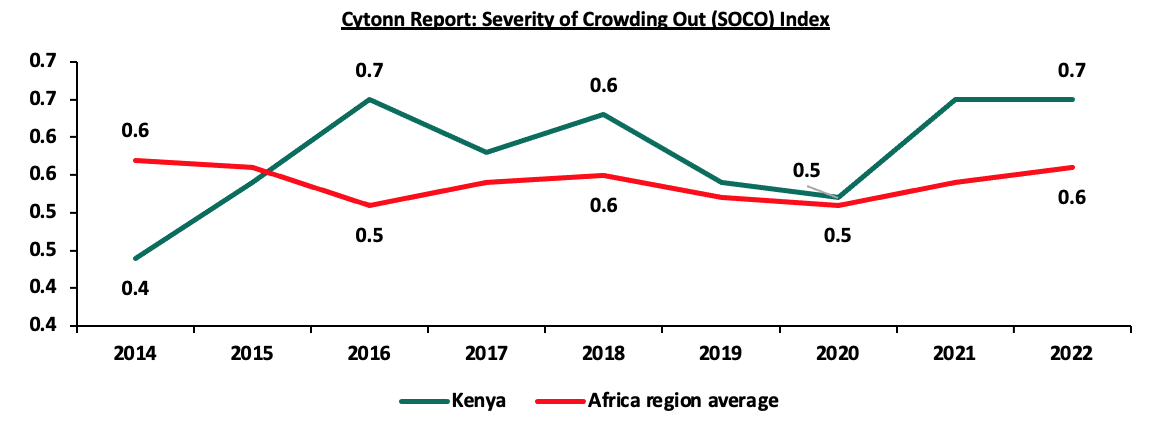
According to the Kenyan Bankers Association (KBA), in the short run, government domestic borrowing negatively and significantly affects gross fixed capital formation and hence investment in the private sector. Furthermore, the European Investment Bank (EIB) noted that Kenya was one of the countries in Africa in which the severity of crowding out was particularly high, having a Severity of Crowding Out (SOCO) index score of 0.7 in 2022 up from 0.4 in 2014. Key to note, a SOCO index score of 0 indicates low severity while a SOCO index of 1 indicates high severity. The chart below shows Kenya’s SOCO index scores over the years;
Source: European Investment Bank (EIB)
- Regulatory Framework
The regulatory framework plays a crucial role in shaping credit availability. The CBK, through capital adequacy requirements and liquidity management rules, ensures that banks have enough funds to support private sector lending while maintaining stability. For instance, the recent proposal by the National Treasury to review the minimum core capital requirement for commercial banks to Kshs 10.0 bn, up from the current Kshs 1.0 bn, is expected to strengthen the resilience of banks, enabling them to better absorb risks and extend more credit to the private sector. However, this could also reduce competition if smaller banks struggle to meet the new requirement, potentially limiting credit options for some businesses in the short term.
Additionally, the integration of Credit Reference Bureaus (CRBs) has allowed lenders to assess the creditworthiness of businesses and individuals, improving access to credit while managing risk exposure. By tailoring credit assessments to individual borrower profiles, the regulatory framework promotes a more informed lending environment, benefiting both banks and the private sector.
- Monetary Policy
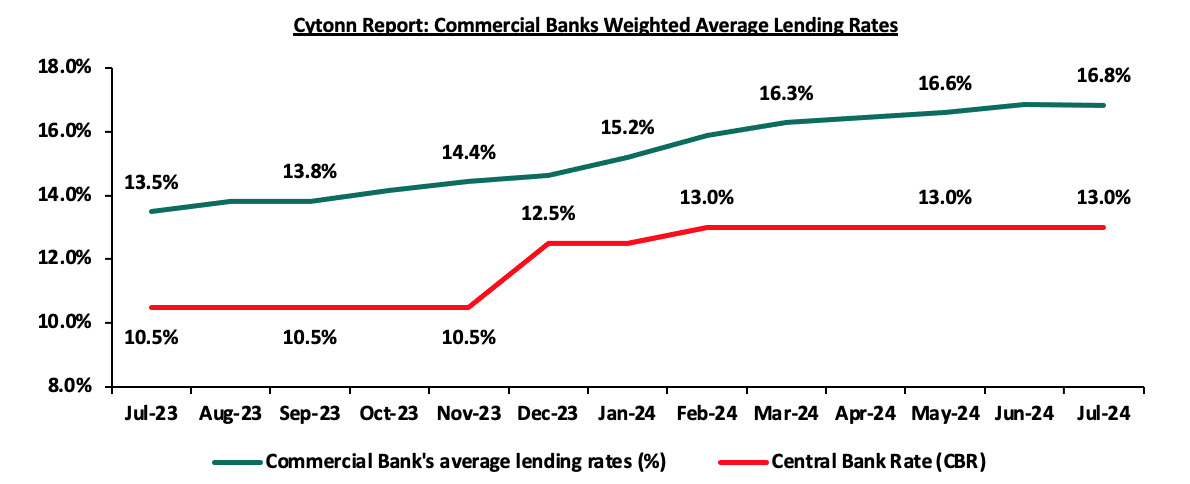
The Central Bank of Kenya’s monetary policy, particularly its Central Bank Rate (CBR), directly influences borrowing costs. The relationship between the Central Bank Rate (CBR) and the commercial bank's lending rates is crucial in understanding credit accessibility in Kenya's private sector. The CBR, set by the Central Bank of Kenya, acts as a benchmark for determining the cost of borrowing in the market, and fluctuations in this rate tend to influence the interest rates that commercial banks apply on loans.
The Central Bank Rate (CBR) remained steady at 10.5% from July 2023 through November 2023. However, in December 2023, the CBR was adjusted upward by 200 basis points to 12.5%, indicating a tightening of monetary policy. By February 2024, the CBR further increased by 50 basis points to 13.0%, a rate it maintained through July 2024. Simultaneously, from July 2023 to July 2024, the average lending rates by commercial banks showed a consistent upward trend, to 16.8% by July 2024 from 13.5% recorded in July 2023. This increase in lending rates reflects the rising cost of credit over the year. As the CBR increased, commercial banks adjusted their lending rates upwards, leading to higher borrowing costs for the private sector. This rise in interest rates has had a direct impact on the private sector's ability to access credit, as higher costs may discourage businesses from taking out new loans for expansion or operations. The chart below shows the trend in commercial banks weighted average lending rates between July 2023 and July 2024;
Source: Central Bank of Kenya (CBK)
The steady increase in lending rates, coupled with the rise in the CBR, posed challenges for private sector credit growth. Higher borrowing costs constrained investment and expansion activities within the private sector, particularly for small and medium-sized enterprises (SMEs), which are more sensitive to interest rate changes. However, in a move signaling a gradual easing of monetary policy, the Central Bank of Kenya lowered the Central Bank Rate (CBR) by 25 basis points to 12.75%. from 13.00% This reduction in the CBR is expected to support credit growth and ease financial pressures on borrowers, providing much-needed relief to businesses in the private sector.
- Initiatives placed by the government and CBK to promote private sector credit growth
Based on the importance on private sector contribution to GDP, the Central Bank of Kenya (CBK), in collaboration with other stakeholders, has implemented various measures ranging from licensing of new products, technological innovations, and public education to promote credit growth in Kenya. Some of the initiatives include;
- Licensing of Innovative Financial Products - By permitting the introduction of novel lending solutions, investment tools, and other financial products, the central bank has been instrumental in expanding the range of credit options available to businesses and individuals. Notably, in June 2024, the Central Bank of Kenya licensed an additional 7 Digital Credit Providers (DCPs) bringing the number of licensed DCPs to 58 following the licensing of 19 DCPs announced in March 2024. This move directly aligns with the commitment of the Central Bank of Kenya (CBK) to strategically promote credit access to the private sector by enabling and expanding digital credit options,
- Diversifying Funding Strategies – Through incorporating alternative borrowing strategies, the government aims to reduce its reliance on domestic credit from commercial banks, and as a result, enhance the ease of credit access to the private sector. Sourcing of alternative funding by the government mitigates the pressure on the local credit market, creating room for private sector entities to secure loans more easily. Notably, Eurobonds, as a form of commercial borrowing, have been a significant component of the government's debt strategy. However, by exploring concessional options, the government not only broadens its funding sources but also ensures a balance that is more conducive to sustained economic growth,
- Boosting Liquidity in the Banking sector- In March 2022, the CBK reviewed the Cash Reserve Ratio to 4.25 %, from the existing 5.25%. This adjustment resulted in the release of an additional Kshs 35.2 bn in liquidity to commercial banks hence effectively providing commercial banks with more financial flexibility to extend credit to businesses and individuals in the private sector,
- Empowering MSMEs through the Credit Guarantee Scheme (CGS) Regulation 2020 – MSMES, being one of the largest sectors in the private sector plays a vital role in the enhancing economic growth of the Country. The implementation of the Credit Guarantee Scheme (CGS) Regulation in 2020, facilitated 2,609 business access loans to MSMEs totalling Kshs 4.1 bn as of August 2022 surpassing its initial capital of Kshs 3.0 bn. Key to note, 60.0% of the beneficiaries were small enterprises, while micro and medium enterprises accounted for 25.0% and 15.0% respectively. Additionally, in celebration of the Hustler Fund's second anniversary, the government launched a new product for Small and Medium Enterprises (SMEs), targeting 2.0 n beneficiaries with strong credit histories. The initiative aims to boost financial inclusion by providing tailored credit solutions to help SMEs grow and integrate into the formal banking sector. Complementing the Credit Guarantee Scheme, this product is expected to further support MSME growth and financial inclusion,
- Implementation of the Financial Inclusion Fund - The Financial Inclusion Fund, commonly known as the Hustler Fund, is a government-sponsored initiative aimed at providing low-income Kenyans with convenient access to credit through their phones. Launched in November 2022, the primary objective of the Hustler Fund is to make credit affordable to a significant portion of the population that has long been excluded from formal credit systems. The introduction of the Hustler Fund underscores the government's commitment to enhancing financial inclusion and expanding access to credit,
As of September 2024, the Hustler Fund has disbursed Kshs 57.0 bn to Kenyans, with at least 2.0 mn customers now engaging as regular daily borrowers. Additionally, the Fund has successfully mobilized Kshs 3.2 bn in savings, contributing to the government’s goal of promoting a savings culture among citizens, and, - Other government special Funds - The government under the Public Finance Management Regulations rolled out various loan facilities targeting women, youths, and persons living with disabilities (PWDs) such as the Youth Development Fund, Uwezo Fund, and Women Enterprise Fund in increasing credit to special groups people. These initiatives align with the broader narrative of enhancing private sector credit growth by addressing specific barriers faced by the marginalized or underserved segments of the population.
Additionally, the banking system has put in place measures to aid private sector credit growth such as;
- Tailoring Credit with Risk-Based Pricing – The Central Bank of Kenya approved risk-pricing models for 33 out of the 38 commercial banks as a measure of tailoring loans to a customer’s financial profile while helping banks and other lenders manage their risk exposure. The initiative has continued to increase credit accessibility to the private sector based on an individual financial profile in terms of borrowing and repayment history, and,
- Digital Transformation – Most Kenyan banks have embraced digital technologies, streamlining and expediting the loan application and approval processes. The implementation of user-friendly mobile and online platforms facilitates quicker access to credit, enhancing the efficiency of transactions for businesses and individuals. Banks such as KCB and NCBA partnered with Safaricom to offer the overdraft credit facility of Fuliza in increasing credit lending to SMEs. Additionally, KCB has the VOOMA app specifically targeting lending to small and medium enterprises.
Section V: Comparative Analysis
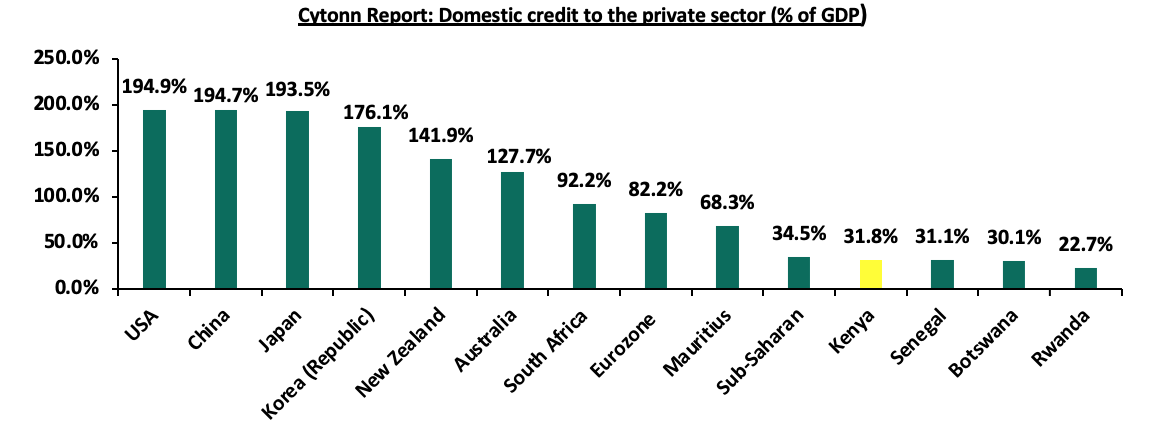
According to the World Bank, Kenya’s domestic credit extended to the private sector outperformed the majority of Sub-Saharan countries. Kenya’s domestic credit extended to private sectors as a percentage of the GDP came in at 31.8%, 2.7% points lower than the average Sub-Saharan domestic credit to private sector lending which stood at 34.5% in the same period. Although Kenya outperformed the majority of Sub-Saharan countries in credit extended to the private sector, the country still underperformed against developed economies. The graphs below show domestic credit extended to the private sector over the years and a comparison of Kenya’s performance against selected economies;
Source: World Bank
Source: World Bank
Different developed countries have adopted different measures to enhance private sector credit growth. Some of the successful measures include:
- Project Finance Structuring – A financing model centered on a project's operating cash flow and assets helps mitigate investment risks and enables raising funds at a lower cost. In 1997, China employed this approach to support a local contract by Plantation Timber Products (Hubei) Ltd, which involved a USD 57.0 mn greenfield project for the installation of modern medium-density fibreboard plants in interior China. Because the project utilized limited-recourse financing, the IFC secured USD 26.0 mn in syndicated loans at a time when foreign commercial banks were still cautious about funding projects in China's interior regions, and,
- Universal supervisory body to monitor fund disbursements – The UK has a central oversight body, the British Business Bank (BBB), responsible for supervising all government fund initiatives, including the Enterprise Finance Guarantee Scheme (EFGS), the British Growth Fund (BGF), the Funding for Lending Scheme (FLS), and the Start Up Loans Scheme (SLS). This system ensures accountability and transparency in the disbursement of funds.
Section VI: Conclusion and Key Considerations
The private sector is a significant contributor to the Kenyan GDP. However, credit availability remains a major hindrance to the sector’s growth. To offset the downside, the government of Kenya needs to adopt or emulate the funding model used by the developed economies in creating an enabling environment for two or more players to compete within the Kenyan credit market. We believe that additional measures need to be implemented in order to promote private sector credit growth. Below are some of the initiatives that the government can adopt;
- Policy reforms- Through implementing policies that enhance the ease of doing business, reducing bureaucratic hurdles, and creating a favourable regulatory environment can encourage banks and other lending institutions to extend credit to the private sector,
- Enhance financial literacy to the public – The government needs to come up with ways of promoting financial literacy among the population and businesses can increase awareness of available credit options as well as improve creditworthiness, making it easier for businesses to access credit,
- Establish a regulatory framework to enhance consumer protection by enforcing consumer-centered financial laws, ensuring financial products are transparent and competitive, as well as handling of consumer complaints and issues,
- Develop the capital markets to offer alternative sources of borrowing – The capital market in Kenya is under-developed as it contributes minimal funding to businesses in Kenya. Deeping the capital markets framework will unlock a key financing avenue that businesses can tap into. Further, the government, in conjunction, with the financial sector regulators needs to come up with a sound legal framework to promote transparency of the corporate bond market bonds, as well as investor education on key legislations that apply to the specific bond market,
- Enhancing oversight on fund initiatives to promote transparency - The government needs to come up with measures or an independent institution that will oversee the running of funds such as the Hustler Fund, Uwezo Fund, and Youth Development Fund in terms of timely publication of updates on amounts disbursed, disclosure of beneficiaries already covered and requirement regulations. The strategy will help in building confidence with the public, as well as preserving taxpayers’ money, and,
- Diversify Funding Sources Beyond Banks: To reduce the overreliance on banks for credit, it is essential to develop and expand access to capital markets. Encouraging businesses and individuals to explore alternative financing options, such as corporate bonds, venture capital, and equity financing, will improve financial flexibility and foster economic resilience.
Recently, private sector credit growth in Kenya has been slow, and not at the rate that would significantly benefit the economy. It is our view that a properly working system that promotes private sector credit would be instrumental in addressing some of the economic challenges that the country faces and help in addressing issues of unemployment. Private sector credit would also foster entrepreneurship and significantly contribute to GDP. One of the glaring shortages we see is the overreliance on banks for credit, which limits financial flexibility and access in various ways. It is our opinion that stimulating our capital markets would be crucial in sustaining the growth of private-sector credit and consequently, Kenya’s GDP growth. Going forward, following the Monetary policy cut in August and the expected cut in the next meeting, we expect sustained growth in lending to the private sector on the back of lower interest rates which will make borrowing cheaper for businesses and households. It may, however, be hindered by the government’s desperate borrowing in the domestic market which may continue the crowding out effect, where banks or financial institutions prefer to give credit to the government rather than the private sector.
Disclaimer: The views expressed in this publication are those of the writers where particulars are not warranted. This publication, which is in compliance with Section 2 of the Capital Markets Authority Act Cap 485A, is meant for general information only and is not a warranty, representation, advice or solicitation of any nature. Readers are advised in all circumstances to seek the advice of a registered investment advisor

