Unit Trust Funds (UTFs) Performance, FY’2022, & Cytonn Monthly – April 2023
By Cytonn Research, Apr 30, 2023
Executive Summary
Fixed Income
During the month of April 2023, T-bills were oversubscribed, with the overall average subscription rate coming in at 109.6%, albeit lower than 113.9% recorded in the month of March 2023. The average subscription rate for the 91-day paper increased to 534.4% from 354.6% recorded in March 2023, while subscription rates for the 364-day and 182-day papers decreased to 27.3% and 21.9%, from 43.7% and 87.7%, respectively, recorded in March 2023. The average yields on the government papers were on an upward trajectory, with the average yields on the 364-day, 182-day and 91-day papers increasing by 16.2 bps, 16.5 bps and 27.3 bps to 10.9%, 10.4% and 10.0%, from 10.8%, 10.3% and 9.8%, respectively, recorded in March 2023. For the month of April, the government accepted a total of Kshs 101.0 bn of the Kshs 105.2 bn worth of bids received, translating to an acceptance rate of 96.0%;
Additionally, in April 2023, bonds were undersubscribed, with the overall subscription rate coming in at 26.7%, down from 103.5% recorded in March 2023. The re-opened bond FXD2/2018/10 received bids worth Kshs 3.6 bn against the offered Kshs 20.0 bn, translating to an undersubscription rate of 17.9% with the government accepting bids worth Kshs 3.4 bn translating to an acceptance rate of 94.1%. The tap sale of IFB1/2023/017 received bids worth Kshs 5.1 bn against the offered Kshs 10.0 bn, translating to an undersubscription rate of 51.2% while the re-opened bond FXD1/2022/03 received bids worth Kshs 7.3 bn against the offered 30.0 bn translating to an undersubscription rate of 24.4%;
During the week, T-bills were undersubscribed for the first time in four weeks, with the overall subscription rate coming in at 37.5%, down from the 146.5% recorded the previous week. Investor’s preference for the shorter 91-day paper persisted as they sought to avoid duration risk, with the paper receiving bids worth Kshs 6.7 bn against the offered Kshs 4.0 bn, translating to an oversubscription rate of 167.2%, albeit lower than 799.6% recorded the previous week. The subscription rate for the 364-day paper increased to 14.4% from 10.2% recorded the previous week, while the subscription rate for 182-day paper decreased to 8.7%, from 21.5% recorded the previous week. The government accepted bids worth Kshs 8.9 bn out of the Kshs 9.0 bn total bids received, translating to an acceptance rate of 99.4%. The yields on the government papers were on an upward trajectory, with the yields on the 364-day paper, 182-day and 91-day papers increasing by 6.5 bps, 3.4 bps and 11.6 bps to 11.1%, 10.5% and 10.3%, respectively;
In the primary bond market, the government is seeking to raise additional Kshs 20.0 bn for budgetary support by issuing a new 3-year bond, FXD1/2023/003. The minimum bidding amount is Kshs 50,000.0 while the discount/interest will be subjected to a 15.0% withholding tax. The coupon rate will be market determined and the period of sale runs from 26 April 2023 to 9 May 2023. We anticipate the bond to be oversubscribed given its short-term duration, however we expect investors to bid at higher rates given the country’s debt sustainability concerns. Our recommended bidding range for the bond is 13.2%-13.7% based on bonds of similar tenor trading range;
Additionally, during the week, the Kenya National Bureau of Statistics (KNBS) released the y/y inflation for April 2023, which eased significantly to 7.9%, from 9.2% recorded in March 2023. This was in line but below our expectations of an ease within a range of 8.7-9.1%;
Equities
During the month of April, the equities market was on a downward trajectory, with NASI, NSE 20 and NSE 25 declining by 4.5%, 2.7% and 3.7%. respectively. The equities market performance was driven by losses recorded by large cap stocks such as Bamburi, Standard Chartered Bank of Kenya (SCBK), Safaricom, KCB Group and EABL of 14.3%, 12.4%, 8.8%, 7.5% and 6.6%, respectively. The losses were however mitigated by gains recorded by large cap stocks such as NCBA Group, Diamond Trust Bank Kenya (DTB-K) and BAT of 7.6%, 6.8% and 1.3% respectively.
During the week, the equities market was on a downward trajectory, with NASI, NSE 20 and NSE 25 declining by 0.2%, 1.0% and 0.5%, respectively, taking the YTD performance to losses of 15.5%, 5.8%, and 9.0% for NASI, NSE 20, and NSE 25, respectively. The equities market performance was mainly driven by losses recorded by large cap stocks such as Bamburi and Standard Chartered Bank of Kenya (SCBK) of 14.3% and 12.4%, respectively. The losses were however mitigated by gains recorded by other large cap stocks such as Diamond Trust Bank Kenya (DTB-K) and Co-operative Bank each of 1.9%, while Equity Group and NCBA Group gained by 1.4% and 1.3%, respectively.
Real Estate
During the week, chain store Quickmart Supermarket opened a new outlet located along Links road in Nyali, Mombasa, bringing the retailer’s number of operating outlets countrywide to 58. In Regulated Real Estate Funds, under the Real Estate Investment Trusts (REITs) segment, Fahari I-REIT closed the week trading at an average price of Kshs 6.1 per share, representing a 0.8% gain from Kshs 6.0 per share recorded the previous week. On the Unquoted Securities Platform as at 28 April 2023, Acorn D-REIT and I-REIT closed the week trading at Kshs 23.9 and Kshs 20.9 per unit, respectively, a 19.4% and 4.4% gain for the D-REIT and I-REIT, respectively, from the Kshs 20.0 inception price. In addition, Cytonn High Yield Fund (CHYF) closed the week with an annualized yield of 13.7%, remaining relatively unchanged from what was recorded the previous week;
Focus of the Week
Following the release of the Capital Markets Authority (CMA) Quarterly Statistical Bulletin-Q1’20223 we examine the performance of Unit Trust Funds for the period ending 31 December 2022. During the period of review, Unit Trusts Funds’ Assets under Management (AUM) grew by 3.3% to Kshs 161.0 bn as at the end of FY’2022, from Kshs 155.9 bn recorded in Q3’2022. Similarly, on Year on Year basis, the AUM grew by 19.6 %, from 134.7 bn at the end of FY’2021. Additionally, as at the end of FY’2022, there were 34 approved Collective Investment Schemes, making up 150 funds in total;
Investment Updates:
- Weekly Rates:
- Cytonn Money Market Fund closed the week at a yield of 11.01%. To invest, dial *809# or download the Cytonn App from Google Playstore here or from the Appstore here;
- Cytonn High Yield Fund closed the week at a yield of 13.71% p.a. To invest, email us at sales@cytonn.com and to withdraw the interest, dial *809# or download the Cytonn App from Google Playstore here or from the Appstore here;
- We continue to offer Wealth Management Training every Wednesday and every third Saturday of the month, from 9:00 am to 11:00 am, through our Cytonn Foundation. The training aims to grow financial literacy among the general public. To register for any of our Wealth Management Trainings, click here;
- If interested in our Private Wealth Management Training for your employees or investment group, please get in touch with us through wmt@cytonn.com;
- Cytonn Insurance Agency acts as an intermediary for those looking to secure their assets and loved ones’ future through insurance namely; Motor, Medical, Life, Property, WIBA, Credit and Fire and Burglary insurance covers. For assistance, get in touch with us through insuranceagency@cytonn.com;
- Cytonn Asset Managers Limited (CAML) continues to offer pension products to meet the needs of both individual clients who want to save for their retirement during their working years and Institutional clients that want to contribute on behalf of their employees to help them build their retirement pot. To more about our pension schemes, kindly get in touch with us through pensions@cytonn.com;
Real Estate Updates:
- For an exclusive tour of Cytonn’s Real Estate developments, visit: Sharp Investor's Tour, and for more information, email us at sales@cytonn.com;
- Phase 3 of The Alma is now ready for occupation and the show house is open daily. To join the waiting list to rent, please email properties@cytonn.com;
- For Third Party Real Estate Consultancy Services, email us at rdo@cytonn.com;
- For recent news about the group, see our news section here;
Hospitality Updates:
- We currently have promotions for Staycations. Visit cysuites.com/offers for details or email us at sales@cysuites.com;
Money Markets, T-Bills Primary Auction:
During the month of April 2023, T-bills were oversubscribed, with the overall average subscription rate coming in at 109.6%, albeit lower than 113.9% recorded in the month of March 2023. The average subscription rate for the 91-day paper increased to 534.4% from 354.6% recorded in March 2023, while subscription rates for the 364-day and 182-day papers decreased to 27.3% and 21.9%, from 43.7% and 87.7%, respectively, recorded in March 2023. The average yields on the government papers were on an upward trajectory, with the average yields on the 364-day, 182-day and 91-day papers increasing by 16.2 bps, 16.5 bps and 27.3 bps to 10.9%, 10.4% and 10.0%, from 10.8%, 10.3% and 9.8%, respectively, recorded in March 2023. For the month of April, the government accepted a total of Kshs 101.0 bn of the Kshs 105.2 bn worth of bids received, translating to an acceptance rate of 96.0%.
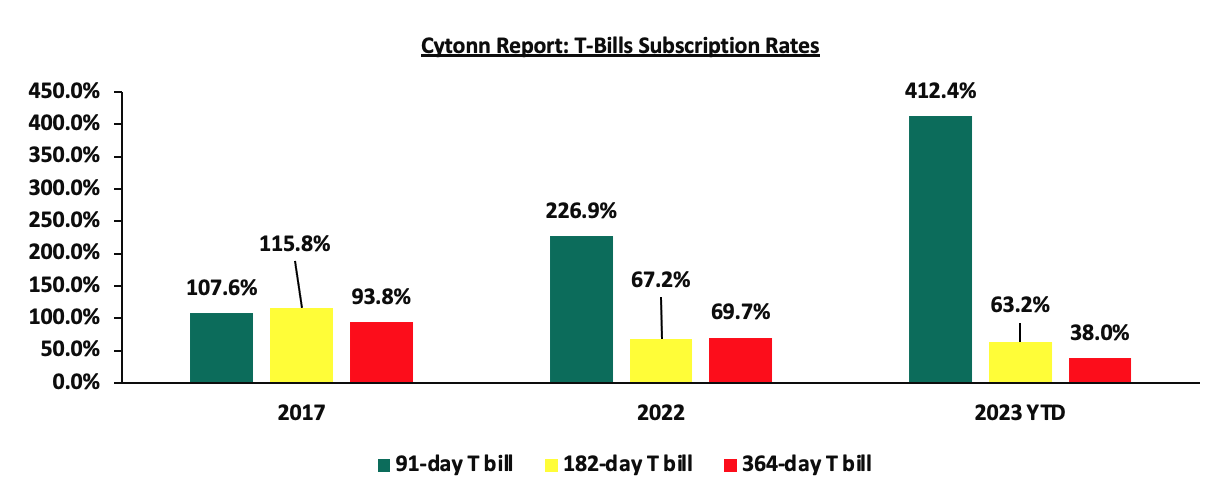
During the week, T-bills were undersubscribed for the first time in four weeks, with the overall subscription rate coming in at 37.5%, down from the 146.5% recorded the previous week. Investor’s preference for the shorter 91-day paper persisted as they sought to avoid duration risk, with the paper receiving bids worth Kshs 6.7 bn against the offered Kshs 4.0 bn, translating to an oversubscription rate of 167.2%, albeit lower than 799.6% recorded the previous week. The subscription rate for the 364-day paper increased to 14.4% from 10.2% recorded the previous week, while the subscription rate for 182-day paper decreased to 8.7%, from 21.5% recorded the previous week. The government accepted bids worth Kshs 8.9 bn out of the Kshs 9.0 bn total bids received, translating to an acceptance rate of 99.4%. The yields on the government papers were on an upward trajectory, with the yields on the 364-day paper, 182-day and 91-day papers increasing by 6.5 bps, 3.4 bps and 11.6 bps to 11.1%, 10.5% and 10.3%, respectively. The chart below compares the overall average T- bills subscription rates obtained in 2017, 2022 and 2023 Year to Date (YTD):
The April 2023 bonds were undersubscribed, with the overall subscription rate coming in at 26.7% down from 103.5%, recorded in March 2023. The re-opened bond FXD2/2018/10 received bids worth Kshs 3.6 bn against the offered Kshs 20.0 bn, translating to an undersubscription rate of 17.9% with the government accepting bids worth Kshs 3.4 bn, translating to an acceptance rate of 94.1%. The tap sale of IFB1/2023/017 received bids worth Kshs 5.1 bn against the offered Kshs 10.0 bn, translating to an undersubscription rate of 51.2%, with the government accepting bids worth Kshs 5.1 bn translating to an acceptance rate of 100.0%. The re-opened bond FXD1/2022/03 received bids worth Kshs 7.3 bn against the offered 30.0 bn translating to an undersubscription rate of 24.4%, with the government accepting bids worth Kshs 1.8 bn translating to an acceptance rate of 24.0%. The table below provides more details on the bonds issued during the month of April 2023:
|
Cytonn Report: Treasury Bonds Issued in April 2023 |
|||||||||
|
Issue Date |
Bond Auctioned |
Effective Tenor to Maturity (Years) |
Coupon |
Amount offered (Kshs bn) |
Actual Amount Raised/Accepted (Kshs bn) |
Total bids received (Subscription) |
Average Accepted Yield |
Subscription Rate |
Acceptance Rate |
|
05/04/2023 |
FXD2/2018/10 (Re-opened) |
5.7 |
12.5% |
20.0 |
3.4 |
3.6 |
14.4% |
17.9% |
94.1% |
|
17/04/2023 |
IFB1/2023/017-Tapsale |
17.0 |
14.4% |
10.0 |
5.1 |
5.1 |
14.4% |
51.2% |
100.0% |
|
24/04/2023 |
FXD1/2022/03-Re-opened |
2.1 |
11.8% |
30.0 |
1.8 |
7.3 |
14.4% |
24.4% |
24.0% |
|
April 2023 Average |
|
8.3 |
12.9% |
60.0 |
10.2 |
16.0 |
14.4% |
26.7% |
63.9% |
|
March 2023 Average |
|
17.0 |
14.4% |
70.0 |
63.6 |
72.5 |
14.4% |
103.5% |
87.7% |
Source: Central Bank of Kenya (CBK)
In the primary bond market, the government is seeking to raise additional Kshs 20.0 bn for budgetary support by issuing a new 3-year bond FXD1/2023/003. The minimum bidding amount is Kshs 50,000.0 while the discount/interest will be subjected to a 15.0% withholding tax. The coupon rate will be market determined and the period of sale runs from 26 April 2023 to 9 May 2023. We anticipate the bond to be oversubscribed given its short-term duration, however we expect investors to bid at higher rates given the country’s debt sustainability concerns. Our recommended bidding range for the bond is 13.2%-13.7% based on bonds of similar tenor trading range.
Secondary Bond Market:
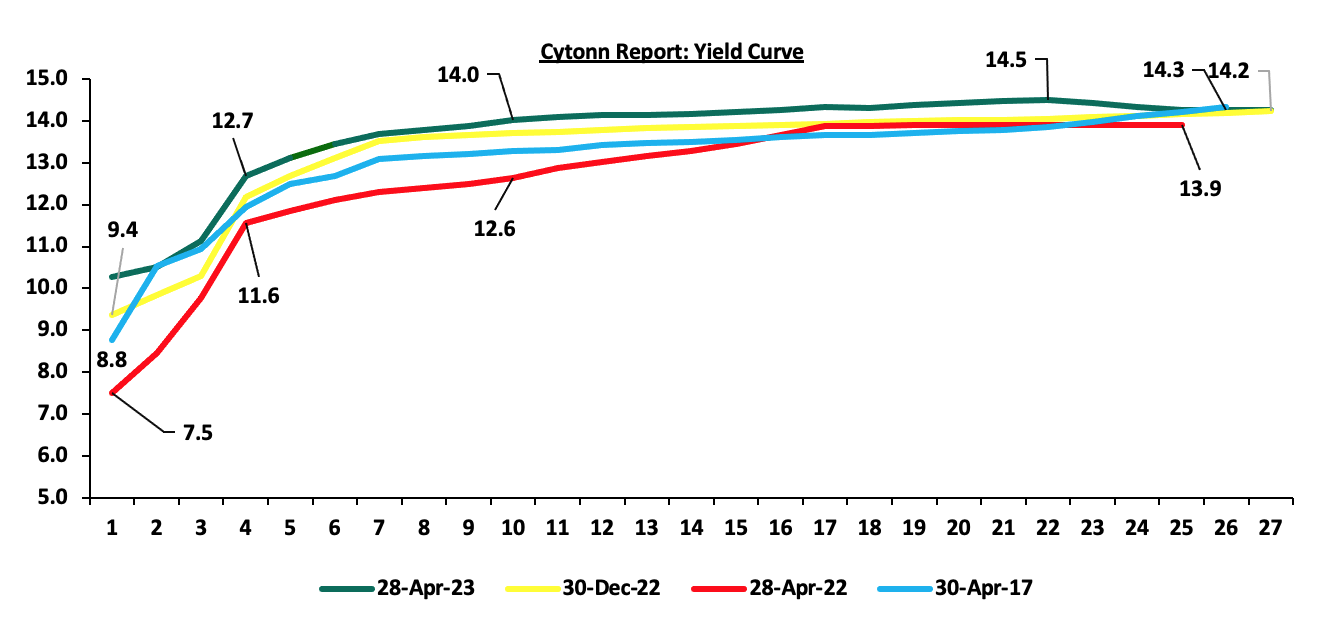
The yields on the government securities were on an upward trajectory during the month compared to the same period in 2022 as a result of the elevated inflationary pressures leading to investors attaching higher risk premiums. The chart below shows the yield curve movement during the period:
The secondary bond turnover decreased by 45.1% to Kshs 38.7 bn, from Kshs 70.5 bn recorded in March 2023, pointing towards decreased activities by commercial banks in the secondary bonds market. On a year on year basis, the bonds turnover declined by 45.4% from Kshs 70.9 bn worth of treasury bonds transacted over a similar period last year.
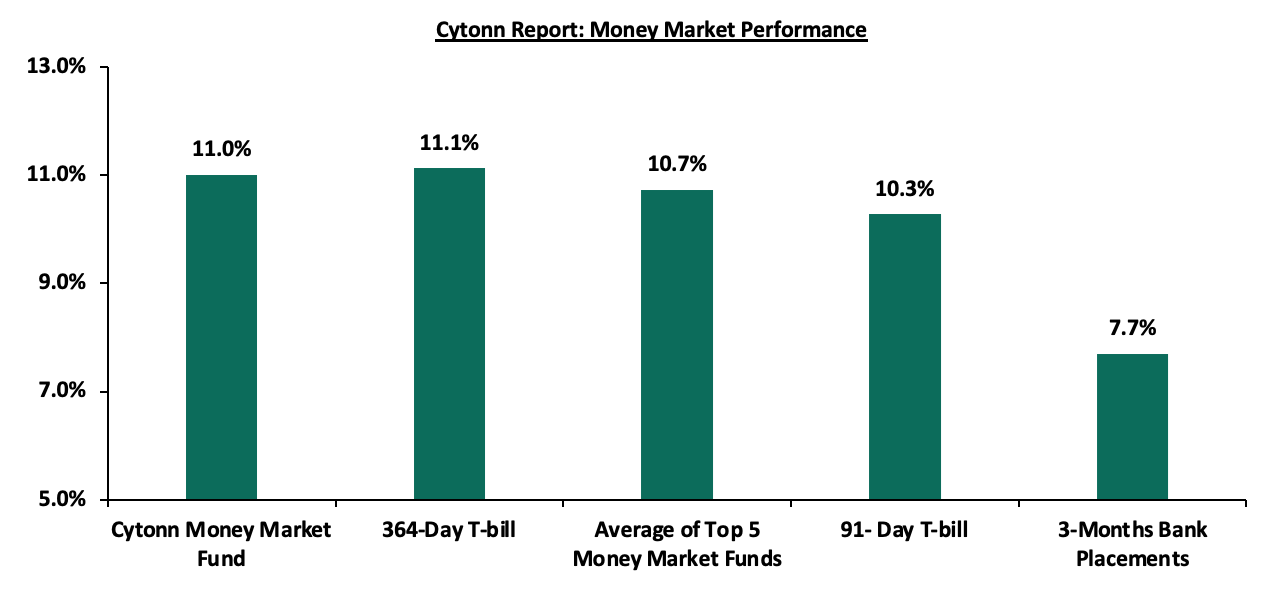
In the money markets, 3-month bank placements ended the week at 7.7% (based on what we have been offered by various banks), while the yield on the 364-day and 91-day T-bill increased by 6.5 bps and 11.6 bps to 11.1% and 10.3%, respectively. The yields of Cytonn Money Market Fund decreased by 2.0 bps to remain relatively at 11.0%, while the average yields on the Top 5 Money Market Funds remained unchanged at 10.7% from what was recorded the previous week.
The table below shows the Money Market Fund Yields for Kenyan Fund Managers as published on 28 April 2023:
|
Cytonn Report: Money Market Fund Yield for Fund Managers as published on 28 April 2023 |
||
|
Rank |
Fund Manager |
Effective Annual Rate |
|
1 |
Cytonn Money Market Fund (dial *809# or download Cytonn App) |
11.0% |
|
2 |
Etica Money Market Fund |
10.8% |
|
3 |
Madison Money Market Fund |
10.7% |
|
4 |
Apollo Money Market Fund |
10.7% |
|
5 |
Dry Associates Money Market Fund |
10.6% |
|
6 |
Jubilee Money Market Fund |
10.5% |
|
7 |
Kuza Money Market fund |
10.4% |
|
8 |
AA Kenya Shillings Fund |
10.0% |
|
9 |
GenAfrica Money Market Fund |
10.0% |
|
10 |
NCBA Money Market Fund |
9.9% |
|
11 |
Zimele Money Market Fund |
9.9% |
|
12 |
Nabo Africa Money Market Fund |
9.9% |
|
13 |
Enwealth Money Market Fund |
9.9% |
|
14 |
Old Mutual Money Market Fund |
9.8% |
|
15 |
Sanlam Money Market Fund |
9.8% |
|
16 |
Co-op Money Market Fund |
9.7% |
|
17 |
KCB Money Market Fund |
9.6% |
|
18 |
CIC Money Market Fund |
9.5% |
|
19 |
GenCap Hela Imara Money Market Fund |
9.4% |
|
20 |
British-American Money Market Fund |
9.4% |
|
21 |
Orient Kasha Money Market Fund |
9.4% |
|
22 |
ICEA Lion Money Market Fund |
9.1% |
|
23 |
Absa Shilling Money Market Fund |
8.3% |
|
24 |
Mali Money Market Fund |
8.2% |
|
25 |
Equity Money Market Fund |
6.8% |
Source: Business Daily
Liquidity:
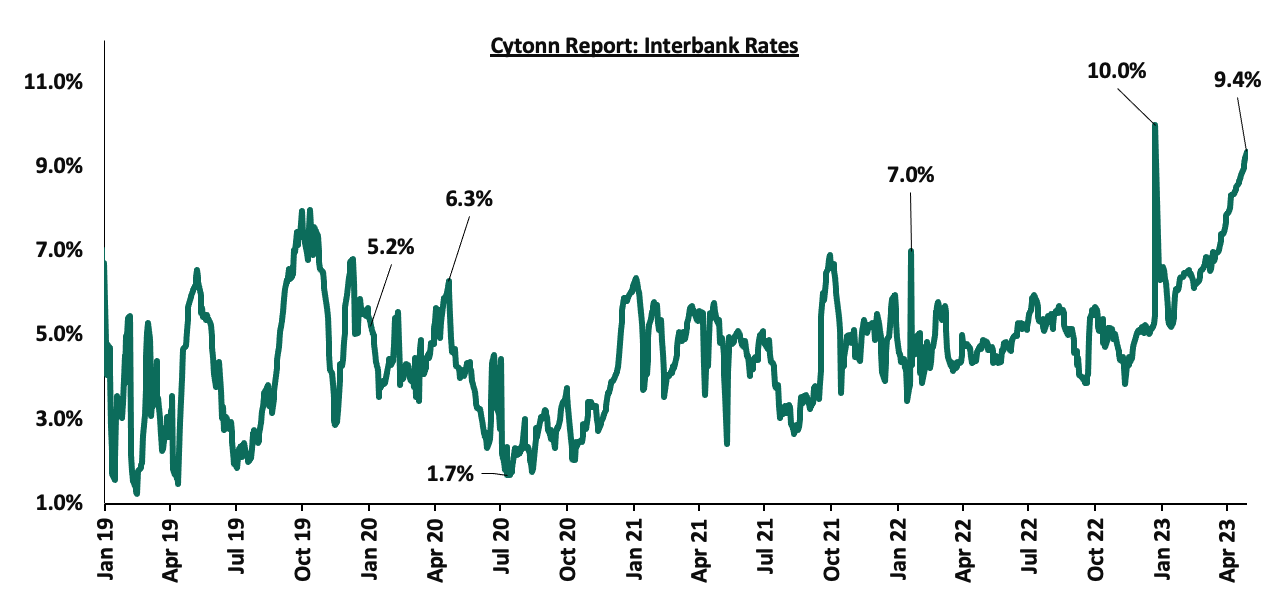
Liquidity in the money markets tightened in the month of April 2023, with the average interbank rate increasing to 8.6%, from 7.0%, recorded in March 2023. Also, during the week, liquidity in the money markets tightened, with the average interbank rate increasing to 9.2%, from 8.7% recorded the previous week, partly attributable to tax remittances that offset government payments. The average interbank volumes traded declined by 37.2% to Kshs 17.1 bn, from Kshs 27.2 bn recorded the previous week. The chart below shows the interbank rates in the market over the years:
Kenya Eurobonds:
During the month, the yields on the Eurobonds were on an upward trajectory with the yield on the 10-year Eurobond issued in 2014 recording the largest gain, having gained by 5.8% points to 20.0% from 14.2%, recorded in March 2023, partly attributable to increased perceived risks in the economy amid the country’s dwindling forex reserves raising concerns on the country’s ability to meet its debt obligations. Additionally, the continued currency depreciation and the elevated inflationary pressures are affecting investors’ sentiments hence the need to cushion against possible losses.
During the week, the yields on Eurobonds were also on an upward trajectory with the yield on the 10-year Eurobond issued in 2014 recorded the largest gain having gained by 4.5% points to 20.0% from 15.5%, recorded the previous week. The table below shows the summary of the performance of the Kenyan Eurobonds as of 27 April 2023;
|
Cytonn Report: Kenya Eurobonds Performance |
||||||
|
|
2014 |
2018 |
2019 |
2021 |
||
|
Date |
10-year issue |
10-year issue |
30-year issue |
7-year issue |
12-year issue |
12-year issue |
|
Amount Issued (USD bn) |
2.0 |
1.0 |
1.0 |
2.1* |
1.0 |
|
|
Years to Maturity |
1.2 |
4.8 |
24.9 |
4.1 |
9.1 |
11.2 |
|
Yields at Issue |
6.6% |
7.3% |
8.3% |
7.0% |
7.9% |
6.2% |
|
02-Jan-23 |
12.9% |
10.5% |
10.9% |
10.9% |
10.8% |
9.9% |
|
31-Mar-23 |
14.2% |
12.3% |
11.6% |
13.4% |
11.7% |
11.3% |
|
19-Apr-23 |
15.5% |
13.0% |
12.0% |
13.9% |
12.4% |
11.8% |
|
20-Apr-23 |
16.9% |
13.6% |
12.4% |
14.6% |
12.8% |
12.3% |
|
21-Apr-23 |
18.0% |
14.0% |
12.7% |
15.3% |
13.3% |
13.0% |
|
24-Apr-23 |
20.3% |
14.8% |
13.1% |
16.2% |
13.6% |
13.0% |
|
25-Apr-23 |
19.8% |
14.5% |
12.9% |
15.8% |
13.4% |
12.7% |
|
26-Apr-23 |
19.9% |
14.1% |
12.7% |
15.4% |
13.2% |
12.4% |
|
27-Apr-23 |
20.0% |
14.1% |
12.7% |
15.4% |
13.2% |
12.4% |
|
Weekly Change |
4.5% |
1.1% |
0.7% |
1.5% |
0.8% |
0.6% |
|
MTM change |
5.8% |
1.8% |
1.1% |
2.0% |
1.5% |
1.1% |
|
YTD Change |
7.1% |
3.6% |
1.8% |
4.5% |
2.4% |
2.5% |
*2019 aggregate amount issued for the two issues was USD 2.1 bn
Source: Central Bank of Kenya (CBK)
Kenya Shilling:
During the month, the Kenya Shilling depreciated by 2.7% against the US Dollar, to close the month at Kshs 135.9, from Kshs 132.3 recorded at the end of March 2023, partly attributable to the increased dollar demand from importers, especially oil and energy sectors against a slower supply of hard currency.
Also, during the week, the Kenya Shilling depreciated by 0.5% against the US dollar to close the week at Kshs 135.9, from Kshs 135.2 recorded the previous week, partly attributable to increased dollar demand from importers, especially oil and energy sectors against a slower supply of hard currency. On a year to date basis, the shilling has depreciated by 10.1% against the dollar, adding to the 9.0% depreciation recorded in 2022. We expect the shilling to remain under pressure in 2023 as a result of:
- High global crude oil prices on the back of persistent supply chain bottlenecks coupled with high demand,
- An ever-present current account deficit estimated at 4.9% of GDP in twelve months to January 2023, from 5.6% recorded in a similar period last year,
- The need for Government debt servicing which continues to put pressure on forex reserves given that 68.1% of Kenya’s External debt was US Dollar denominated as of December 2022, and,
- A continued interest rate hikes in the USA and the Euro Area with the Fed and European Central Bank increasing their benchmark rates to 4.75%-5.00% and 3.50% respectively in March 2023, which has strengthened the dollar and sterling pound against other currencies following capital outflows from other global emerging markets
The shilling is however expected to be supported by:
- Diaspora remittances standing at a cumulative USD 1,015.5 mn in 2023 as of March 2023, albeit 0.8% lower than the USD 1,023.8 mn recorded over the same period in 2022, and,
- The tourism inflow receipts that came in at USD 268.1 bn in 2022, a significant 82.9% increase from USD 146.5 bn inflow receipts recorded in 2021.
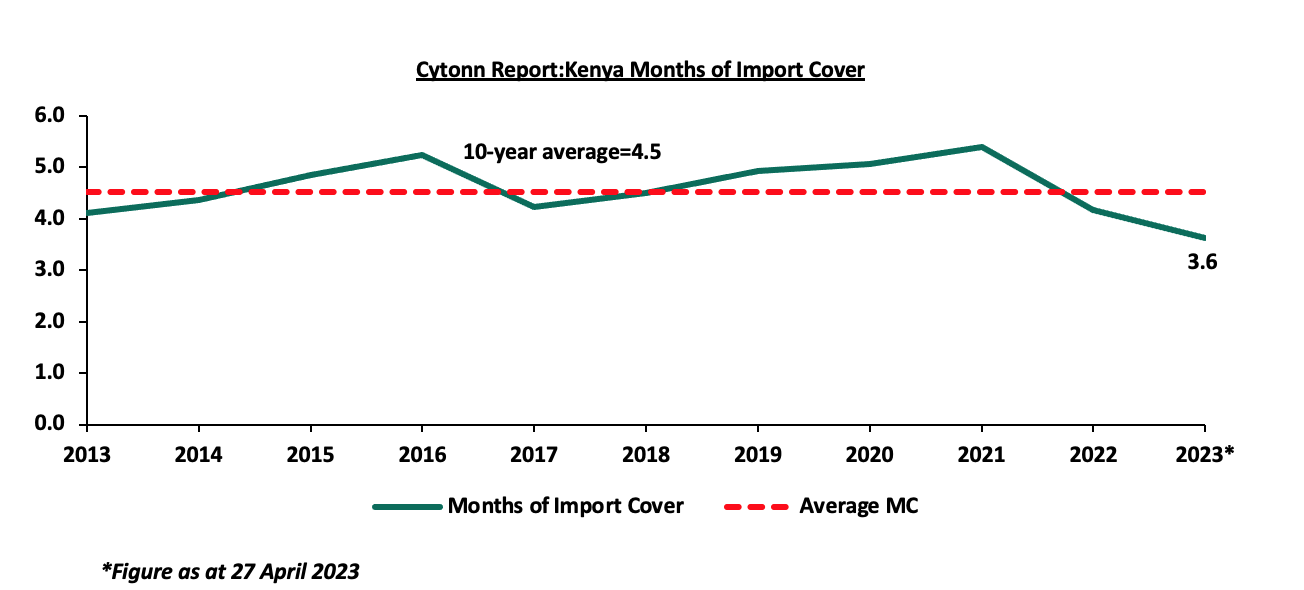
Key to note, Kenya’s forex reserves declined by 0.3% during the week to remain relatively unchanged at USD 6.5 bn as at 27 April 2023. As such, the country’s months of import cover also remained unchanged at 3.6 months, similar to what was recorded the previous week, and remained below the statutory requirement of maintaining at least 4.0-months of import cover. The chart below summarizes the evolution of Kenya months of import cover over the last 10 years:
Weekly Highlights:
- April 2023 Inflation
The y/y inflation in April 2023 eased significantly to 7.9%, a ten-month low, from the 9.2% recorded in March 2023. This was in line but below our expectations, of an ease within a range of 8.7%-9.1%. The headline inflation in April 2023 was majorly driven by an increase in prices of commodities in the following categories, food and non-alcoholic beverages; housing, water, electricity, gas and other fuels; and transport. The table below shows a summary of both the year on year and month on month commodity indices performance:
|
Cytonn Report: Major Inflation Changes – April 2023 |
|||
|
Broad Commodity Group |
Price change m/m (March-2023/April-2023) |
Price change y/y (April-2022/April-2023) |
Reason |
|
Food and Non-Alcoholic Beverages |
0.1% |
10.1% |
The m/m increase was mainly driven by increase in price commodities such as potatoes, beans, Mangoes, onions, sugar, maize grain and beef. The increase was, however, mitigated by drop in prices of commodities such as spinach, kales, tomatoes, cabbages, cooking fat |
|
Housing, Water, Electricity, Gas and Other Fuel |
2.7% |
9.6% |
The m/m change was mainly due to increase in price of 50 kilowatts and 200 kilowatts of electricity and 2-bedroom monthly house rent |
|
Transport cost |
0.2% |
9.8% |
The m/m change was driven by increase in prices of petrol in the period between March 15 and April 14 2023, while prices of diesel and kerosene remained unchanged in during the period |
|
Overall Inflation |
0.5% |
7.9% |
The m/m was mainly driven by 2.7% increase in prices of food and non-alcoholic Beverages |
Source: Kenya National Bureau of Statistics (KNBS)
The overall easing of the headline inflation in April comes on the back of the rainy season that has eased food prices and the monetary policy committee raising the Central Bank Rate by 75.0 bps to 9.5% in March 2023 from 8.75% in January 2023, a move aimed to anchor inflation which has now remained above the Central Bank of Kenya upper bound of 7.5% in the past 11 months. The chart below shows the inflation rates for the past 5 years:
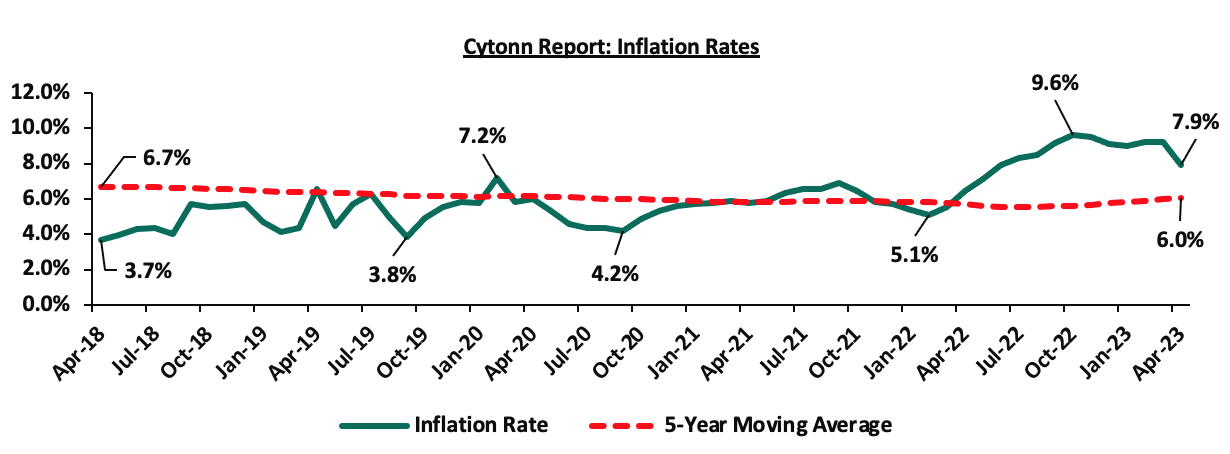
Inflationary pressures in the country are expected to slow further in the near term, aided by continued rain and duty-free imports of staples such as maize, rice, cooking oil and sugar. Furthermore, the recent announcement by the government that it intends to exempt cooking gas from the 8.0% value added tax through the Finance Bill 2023, which will be tabled in Parliament before June 2023, is expected to cushion consumer against high prices of cooking gas, as cooking gas is a major input under the Housing, Water, Electricity, Gas and Other Fuel index. Notably, the high commodity prices in the country are also attributed to the high cost of production and importation due to the depreciation of the Kenya shilling, which has made imports expensive. As a result, manufactures pass on the cost to consumers through hikes in commodity prices. However, given that fuel and electricity are major input in most businesses, we are adamant that the country’s elevated fuel prices, as well as increased electricity tariffs, are expected to impede the eventual ease of the inflation rate within the CBK’s target range.
Monthly Highlights:
- Stanbic bank released its monthly Purchasing Manager’s Index (PMI), highlighting that the index for the month of March 2023 came in at 49.2, from 46.6 in recorded in February 2023, pointing towards more information, please see our Cytonn weekly #14/2023,
- The National Treasury gazetted the revenue and net expenditures for the first nine months of FY’2022/2023, ending 31 March 2023. Total revenue collected as at the end of March 2023 amounted to Kshs 1,444.7 bn, equivalent to 65.9% of the revised estimates of Kshs 2,192.0 bn for FY’2022/2023 and is 87.9% of the prorated estimates of Kshs 1,644.0 bn. For more information, please see our Cytonn weekly #15/2023, and,
- The Energy and Petroleum Regulatory Authority (EPRA) released their monthly statement on the maximum retail fuel prices in Kenya effective 15 April 2023 to 14 May 2023. Notably, fuel prices remained unchanged for the month at Kshs 179.3, Kshs 162.0 and Kshs 145.9 per liter of Super Petrol, Diesel and Kerosene, respectively. For more information, please see our Cytonn weekly #15/2023,
Rates in the Fixed Income market have been on upward trend given the continued government’s demand for cash and the highly tightened liquidity in the money market. The government is 2.9% ahead of its prorated borrowing target of Kshs 355.0 bn having borrowed Kshs 365.3 bn of the revised domestic borrowing target of Kshs 425.1 bn for the FY’2022/2023. We believe that the projected budget deficit of 5.7% is relatively ambitious given the downside risks and deteriorating business environment occasioned by high inflationary pressures. Further, revenue collections are lagging behind, with total revenue as at March 2023 coming in at Kshs 1.4 tn in the FY’2022/2023, equivalent to 65.9% of its revised target of Kshs 2.2 tn and 87.9% of the prorated target of Kshs 1.6 tn. Therefore, we expect a continued upward readjustment of the yield curve in the short and medium term, with the government looking to bridge the fiscal deficit through the domestic market. Owing to this, our view is that investors should be biased towards short-term fixed-income securities to reduce duration risk.
Market Performance:
During the month of April, the equities market was on a downward trajectory, with NASI, NSE 20 and NSE 25 declining by 4.5%, 2.7% and 3.7%. respectively. The equities market performance was driven by losses recorded by large cap stocks such as Bamburi, Standard Chartered Bank of Kenya (SCBK), Safaricom, KCB Group and EABL of 14.3%, 12.4%, 8.8%, 7.5% and 6.6%, respectively. The losses were however mitigated by gains recorded by large cap stocks such as NCBA Group, Diamond Trust Bank Kenya (DTB-K) and BAT of 7.6%, 6.8% and 1.3% respectively.
During the week, the equities market was on a downward trajectory, with NASI, NSE 20 and NSE 25 declining by 0.2%, 1.0% and 0.5%, respectively, taking the YTD performance to losses of 15.5%, 5.8%, and 9.0% for NASI, NSE 20, and NSE 25, respectively. The equities market performance was mainly driven by losses recorded by large cap stocks such as Bamburi and Standard Chartered Bank of Kenya (SCBK) of 14.3% and 12.4%, respectively. The losses were however mitigated by gains recorded by other large cap stocks such as Diamond Trust Bank Kenya (DTB-K) and Co-operative Bank each of 1.9%, while Equity Group and NCBA Group gained by 1.4% and 1.3%, respectively.
Equities turnover declined by 87.4% in the month of April to USD 31.4 mn, from USD 248.7 mn recorded in March 2023. Foreign investors remained net sellers, with a net selling position of USD 2.1 mn, compared to March’s net selling position of USD 15.0 mn.
During the week, equities turnover increased by 62.6% to USD 7.6 mn, from USD 4.7 mn recorded the previous week taking the YTD turnover to USD 379.8 mn. Foreign investors remained net sellers, with a net selling position of USD 1.3 mn, from a net selling position of USD 1.0 mn recorded the previous week, taking the YTD net selling position to USD 43.1 mn.
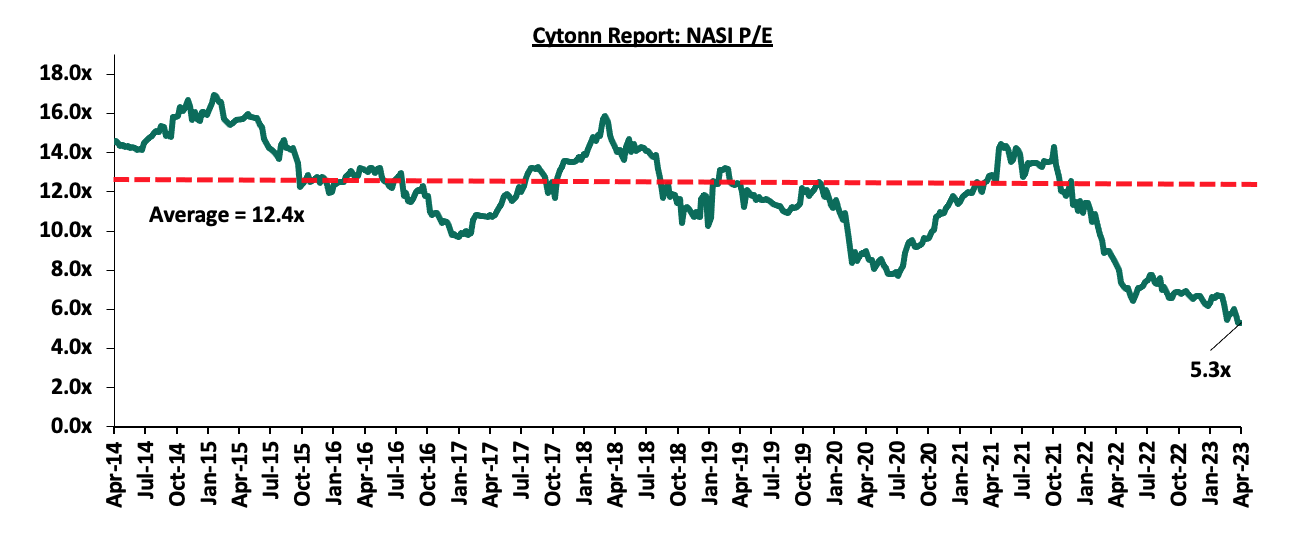
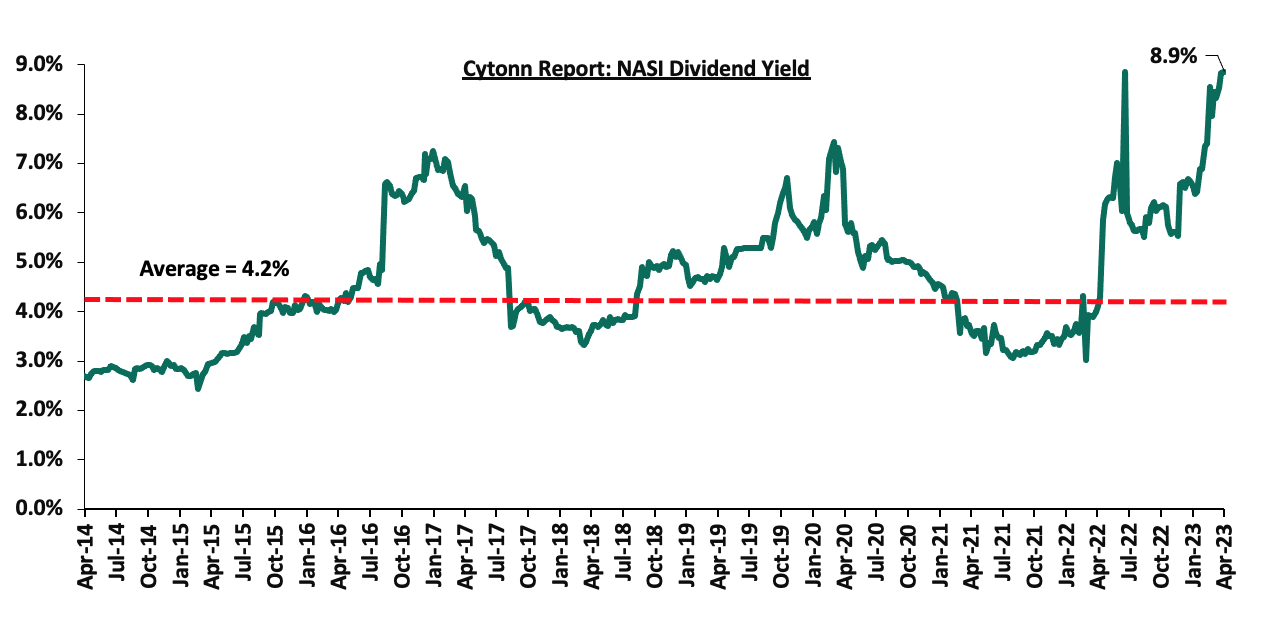
The market is currently trading at a price to earnings ratio (P/E) of 5.3x, 57.2% below the historical average of 12.4x, and a dividend yield of 8.9%, 4.7% points above the historical average of 4.2%. Key to note, NASI’s PEG ratio currently stands at 0.7x, an indication that the market is undervalued relative to its future growth. A PEG ratio greater than 1.0x indicates the market may be overvalued while a PEG ratio less than 1.0x indicates that the market is undervalued. The charts below indicate the historical P/E and dividend yields of the market;
Monthly highlights:
- Following the release of the FY’2022 results by Kenyan listed banks, the Cytonn Financial Services Research Team undertook an analysis on the financial performance of the listed banks and identified the key factors that shaped the performance of the sector. The Core Earnings per Share (EPS) for the listed banks recorded a weighted growth of 26.6% in FY’2022, compared to a weighted growth of 82.9% recorded in FY’2021. Additionally, the listed banks’ Asset Quality improved with weighted average NPL ratio declining by 0.6% points to 11.7% in FY’2022, from 12.3% in FY’2021. We however note that despite this improvement in the asset quality, the NPL ratio remains higher than the 10-year average of 8.8%. For more information, please see our Cytonn Weekly #16/2023.
Universe of coverage:
|
Cytonn Report: Universe of Coverage as of 28 April 2023 |
|||||||||||
|
Company |
Price as at 20/04/2023 |
Price as at 28/04/2024 |
w/w change |
m/m change |
YTD Change |
Year Open 2023 |
Target Price* |
Dividend Yield |
Upside/ Downside** |
P/TBv Multiple |
Recommendation |
|
Jubilee Holdings |
189.3 |
180.0 |
(4.9%) |
1.7% |
(9.4%) |
198.8 |
305.9 |
6.7% |
76.6% |
0.3x |
Buy |
|
Liberty Holdings |
4.0 |
4.0 |
0.5% |
(17.3%) |
(21.0%) |
5.0 |
6.8 |
0.0% |
69.6% |
0.3x |
Buy |
|
Britam |
4.3 |
4.3 |
(1.2%) |
(7.7%) |
(17.5%) |
5.2 |
7.1 |
0.0% |
66.0% |
0.7x |
Buy |
|
I&M Group*** |
20.3 |
17.3 |
(14.6%) |
(17.0%) |
1.5% |
17.1 |
24.5 |
13.0% |
54.6% |
0.4x |
Buy |
|
Sanlam |
7.8 |
8.1 |
3.6% |
(1.2%) |
(15.2%) |
9.6 |
11.9 |
0.0% |
46.7% |
0.8x |
Buy |
|
Standard Chartered*** |
170.0 |
149.0 |
(12.4%) |
(12.4%) |
2.8% |
145.0 |
195.4 |
14.8% |
45.9% |
1.1x |
Buy |
|
KCB Group*** |
33.0 |
32.9 |
(0.3%) |
(7.5%) |
(14.3%) |
38.4 |
45.5 |
6.1% |
44.6% |
0.5x |
Buy |
|
Kenya Reinsurance |
1.8 |
1.9 |
3.3% |
0.0% |
1.1% |
1.9 |
2.5 |
10.6% |
43.4% |
0.1x |
Buy |
|
CIC Group |
1.8 |
1.7 |
(4.4%) |
(11.7%) |
(9.4%) |
1.9 |
2.3 |
7.5% |
41.6% |
0.6x |
Buy |
|
ABSA Bank*** |
12.4 |
12.2 |
(1.6%) |
(5.1%) |
(0.4%) |
12.2 |
15.1 |
11.1% |
35.7% |
1.0x |
Buy |
|
NCBA*** |
39.0 |
39.5 |
1.3% |
7.6% |
1.4% |
39.0 |
48.7 |
10.8% |
34.2% |
0.8x |
Buy |
|
Equity Group*** |
45.2 |
45.8 |
1.4% |
0.7% |
1.7% |
45.1 |
56.3 |
8.7% |
31.7% |
0.9x |
Buy |
|
Co-op Bank*** |
13.1 |
13.3 |
1.9% |
1.1% |
9.9% |
12.1 |
15.9 |
11.3% |
30.8% |
0.6x |
Buy |
|
Diamond Trust Bank*** |
53.8 |
54.8 |
1.9% |
6.8% |
9.8% |
49.9 |
64.6 |
9.1% |
27.2% |
0.3x |
Buy |
|
Stanbic Holdings |
114.5 |
116.0 |
1.3% |
5.5% |
13.7% |
102.0 |
131.8 |
10.9% |
24.4% |
0.8x |
Buy |
|
HF Group |
3.8 |
3.9 |
1.6% |
1.8% |
23.2% |
3.2 |
4.5 |
0.0% |
14.7% |
0.2x |
Accumulate |
|
*Target Price as per Cytonn Analyst estimates **Upside/ (Downside) is adjusted for Dividend Yield ***For Disclosure, these are stocks in which Cytonn and/or its affiliates are invested in |
|||||||||||
We are “Neutral” on the Equities markets in the short term due to the current adverse operating environment and huge foreign investor outflows, and, “Bullish” in the long term due to current cheap valuations and expected global and local economic recovery.
With the market currently trading at a discount to its future growth (PEG Ratio at 0.7x), we believe that investors should reposition towards value stocks with strong earnings growth and that are trading at discounts to their intrinsic value. We expect the current high foreign investors sell-offs to continue weighing down the equities outlook in the short term.
- Industry Reports
During the month, the following industry reports were released and the key take-outs were as follows:
|
Cytonn Report: Notable Industry Reports During the Month |
|||
|
# |
Theme |
Report |
Key Take-outs |
|
1 |
General Real Estate |
Leading Economic Indicators (LEI) November 2022, December 2022 and January 2023 reports by the Kenya National Bureau of Statistics (KNBS) |
|
We expect Kenya’s Real Estate sector to continue registering growth in terms of activity, driven by continuous recovery of the hospitality sector, supported by increased inbound earnings and number of foreign tourists into the country for various reasons such as leisure, sporting activities, trade, cultural and agricultural expos, multilateral organizational meetings, and inter-governmental conferences. However, the Real Estate sector will continue facing some challenges that could hinder its optimal performance such as high construction costs, exacerbated by inflationary pressures resulting from both local and global economic shocks. Additionally, the continued depreciation of the Kenyan shilling against major international trading currencies such as the United States Dollar (USD), could further increase the import bill of building materials and raw materials for local production of crucial construction materials such as cement, paint and steel among others.
- Retail Sector
During the week, chain store Quickmart Supermarket opened a new outlet located along Links road in Nyali, Mombasa, bringing the retailer’s number of operating outlets countrywide to 58. The retailer’s decision to open the 24-hour store in Nyali was influenced by the desire to increase shoppers’ convenience and have a piece of the high-end market which has been enjoyed by existing large retailers such as CarreFour located in City Mall, Naivas Supermarket located in Nyali Centre Mall, and Chandarana FoodPlus located in Nyali Cinemax Plaza. The retailer’s entry therefore increases the competitive niche in the region and aims to establish its dominance in the coastal region, where it already boasts of two existing stores located in Mtwapa town and one store in Mombasa Central Business District (CBD). Additionally, the aggressive expansion of the retailers in Nyali and the larger Coastal region has taken advantage of the low formal retail penetration in Kenya which stood at 30.0% as of 2018, coupled with gaps left by other retailers such as Nakumatt, Uchumi, Choppies, Shoprite, and Tuskys Supermarkets which exited the Coastal market.
The table below shows the number of stores operated by key local and international retail supermarket chains in Kenya;
|
Cytonn Report: Main Local and International Retail Supermarket Chains |
|||||||||||
|
Name of retailer |
Category |
Branches as at FY’ 2018 |
Branches as at FY’ 2019 |
Branches as at FY’ 2020 |
Branches as at FY’ 2021 |
Branches as at FY’2022 |
Branches opened in 2023 |
Closed branches |
Current branches |
Branches expected to be opened |
Projected branches FY’2023 |
|
Naivas |
Hybrid* |
46 |
61 |
69 |
79 |
91 |
1 |
0 |
92 |
0 |
92 |
|
Quick Mart |
Hybrid** |
10 |
29 |
37 |
48 |
55 |
3 |
0 |
58 |
0 |
58 |
|
Chandarana |
Local |
14 |
19 |
20 |
23 |
26 |
0 |
0 |
26 |
0 |
26 |
|
Carrefour |
International |
6 |
7 |
9 |
16 |
19 |
0 |
0 |
19 |
0 |
19 |
|
Cleanshelf |
Local |
9 |
10 |
11 |
12 |
12 |
1 |
0 |
13 |
0 |
13 |
|
Tuskys |
Local |
53 |
64 |
64 |
6 |
4 |
0 |
59 |
5 |
0 |
5 |
|
Game Stores |
International |
2 |
2 |
3 |
3 |
0 |
0 |
3 |
0 |
0 |
0 |
|
Uchumi |
Local |
37 |
37 |
37 |
2 |
2 |
0 |
35 |
2 |
0 |
2 |
|
Choppies |
International |
13 |
15 |
15 |
0 |
0 |
0 |
15 |
0 |
0 |
0 |
|
Shoprite |
International |
2 |
4 |
4 |
0 |
0 |
0 |
4 |
0 |
0 |
0 |
|
Nakumatt |
Local |
65 |
65 |
65 |
0 |
0 |
0 |
65 |
0 |
0 |
0 |
|
Total |
|
257 |
313 |
334 |
189 |
209 |
5 |
181 |
215 |
0 |
215 |
|
*40% owned by IBL Group (Mauritius), Proparco (France), and DEG (Germany), while 60% owned by Gakiwawa Family (Kenya) |
|||||||||||
|
**More than 50% owned by Adenia Partners (Mauritius), while Less than 50% owned by Kinuthia Family (Kenya) |
|||||||||||
Source: Cytonn Research
Additionally, during the month;
- Naivas Supermarket opened a new outlet located at Brick Mall, Thindigua Kiambu County, bringing the total number of its operating outlets countrywide to 92. For more information, see our Cytonn Weekly #14/2023.
We continue to expect increased activities in the Kenyan retail industry attributed to; i) sustained expansion efforts by both domestic and foreign retailers who are aggressively competing for a bigger share of the market and increased capital investments by foreign entities in the retail market, ii) the growing demand for goods, services, and retail space driven by favorable demographics both within and beyond the Nairobi Metropolitan Area (NMA), and, iii) increased infrastructural development enhancing accessibility in regions offering new opportunities for retail investment. Nevertheless, the rampant proliferation of e-commerce which is quickly changing how consumers shop and purchase goods, and the oversupply of retail spaces, currently estimated at 3.0 mn SQFT in the Nairobi Metropolitan Area (NMA) and 1.7 mn SQFT in the larger Kenyan retail sector (excluding NMA), remain significant obstacles that continue to impede the sector's growth and overall performance.
- Hospitality Sector
During the month, JW Marriot, a subsidiary of the Marriot Bonvoy global portfolio of 30 extraordinary hotel brands officially opened a luxurious safari lodge in River Masai Mara, Talek, within Masai Mara National Reserve dubbed ‘JW Marriott Masai Mara’. For more information, see our Cytonn Weekly #14/2023.
We expect the hospitality sector to continue showcasing resilience in terms of performance in the post-COVID-19 period as the sector recovers towards pre-COVID-19 levels. The positive performance will be supported by increased number of local and international visitors attracted by various tourist destinations, sporting and leisure activities and events, and increased meetings and conferences in the country. This is on the back of intensive marketing campaigns through platforms such as the Magical Kenya and Kenya Tourism Board under the Ministry of Tourism Strategy 2021-2025 and continuous opening, expansions, and acquisitions and mergers by local and international hotel brands in the country.
- Industrial Sector
Notable highlights in the sector during the month include;
- Rogers Group Limited, a Mauritanian investment group disclosed that it recorded a Kshs 113.6 mn gain in a bargain purchase acquisition deal of Rongai Workshop and Transport Limited, a renowned transport and logistics company in Kenya, through its logistics subsidiary Velogic Limited. Additionally, Turkish based manufacturing conglomerate, Turkish Industry Holdings, committed Kshs 48.0 bn towards the construction of five industries situated within the Naivasha Industrial Park, Mai Mahiu, Nakuru County. The project which is valued at Kshs 90.0 bn, was commissioned by President Uhuru Kenyatta in July 2022 during the official opening of the 1,000-acre Special Economic Zone (SEZ), and consists of six manufacturing industries set across 400 acres within the SEZ. For more information, see our Cytonn Weekly #16/2023, and,
- Improvon, a South African based logistics and industrial developer, announced ongoing expansion efforts to set up mini-warehouse units at Nairobi Gate Industrial Park in Northlands City, Ruiru. The facility targets medium-sized firms seeking specialized logistics solutions and already hosts two 5,000 SQM depots. For more information, see our Cytonn Weekly #15/2023.
Currently, Kenya boasts of having 15 Special Economic Zones (SEZs) spread across Naivasha, Mombasa, Kiambu, Kisumu, and Machakos counties which have been developed by both private and public institutions. We therefore expect crucial investments in the industrial sector to be spearheaded by establishment of more SEZs strategically located along major infrastructural and transportation linkages across the country. These include areas such as international airports in Nairobi, Mombasa, Eldoret, and Kisumu, the Standard and Metre Gauge Railways connecting the Port of Mombasa with Uganda, LAPPSET project connecting the Port of Lamu with South Sudan, Mombasa - Malaba highway connecting Port of Mombasa with Uganda, Namanga - Moyale Highway connecting Tanzania with Ethiopia and many more. The establishment of these SEZs and industrial parks is part of Kenya’s Industrial Transformation Programme launched in 2015 which targets to; i) increase activities in the manufacturing sector to over 15.0% of the country’s Gross Domestic Product (GDP), ii) create one million job opportunities, an initiative that is meant to help tackle the current unemployment rate, currently standing at 4.9%, as at December 2022, iii) attract local capital by improving the ease of doing business among local investors, and, iv) influence a five-fold growth in Foreign Direct Investments (FDIs) by promoting and facilitating export-oriented investments in a bid to boost inflows and attracting more foreign businesses investors in setting up their operations on large scale. This is at the back of various incentives offered within the zones such as administration and tax exemptions as well as access to cheaper power tariffs which were reviewed to Kshs 10.0 per unit in March 2023 Power Tariff Review.
Moreover, we anticipate the sector to realise growth and development activities in 2023 supported by; i) increased business operations in the post-electioneering period, ii) the government's accelerated focus on exporting agricultural and horticultural products to the international market, with aim to improve the quantity, quality, efficiency, and reliability of Kenya-farmed produce thereby increasing the country’s competitiveness, iii) Kenya being recognized as a regional hub hence attracting investments, iv) increased demand for data centres by both the government and private-sector firms driven by continued increase in demand for data protection services in line with the Data Protection Act 2019 requiring personal data to be stored in servers or data centres located within Kenya’s borders, v) increased demand for cold storage facilities for drugs and vaccines whose demand is supported by the Universal Health Coverage program initiated by the government and accelerated campaign in provision of better and cheaper health services by private and Non-Governmental health organisations, and, vi) increased demand of e-commerce warehouses in the retail sector driven by the rising demand for space to store goods meant for delivery to clients across the country, as more people shift towards home delivery as a convenient and efficient way to purchase goods. However, the prolonged stalling of development of infrastructure such as roads, water and electricity within industrial parks and in most towns coupled with reduced funding on infrastructural sector continues to hamper optimum development and investments in the industrial sector hence eroding investors’ confidence.
- Regulated Real Estate Funds
- Real Estate Investment Trusts (REITs)
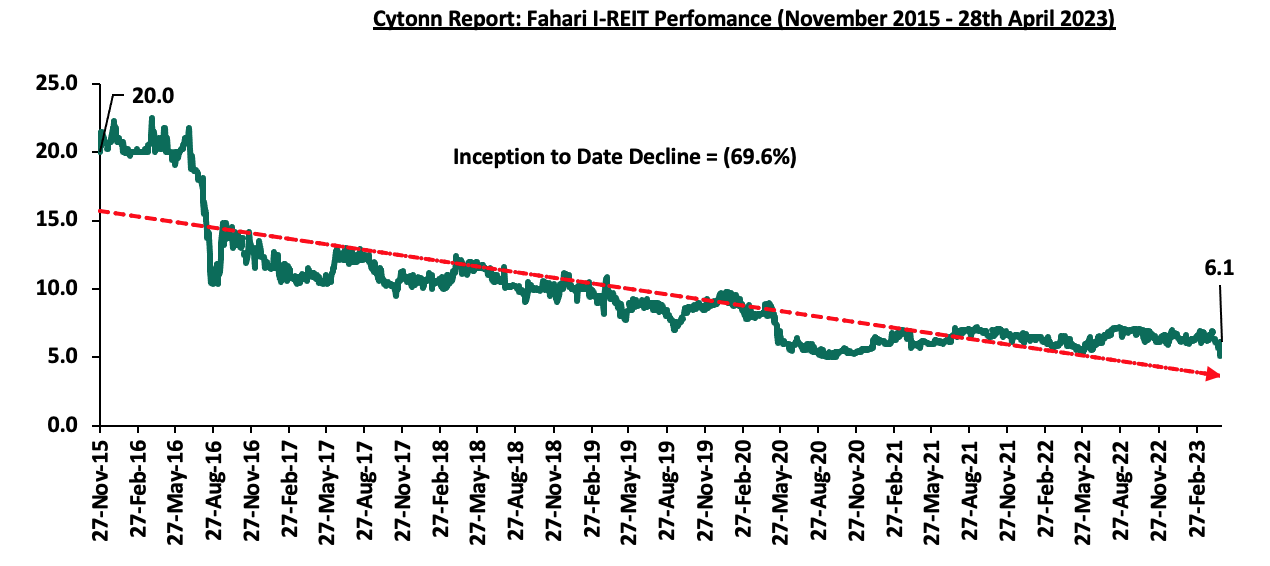
In the Nairobi Securities Exchange, ILAM Fahari I-REIT closed the week trading at an average price of Kshs 6.1 per share. The performance represented a 0.8% gain from Kshs 6.0 per share recorded the previous week, taking it to a 10.2% Year-to-Date (YTD) decline from Kshs 6.8 per share recorded on 3 January 2023. In addition, the performance represented a 69.6% Inception-to-Date (ITD) loss from the Kshs 20.0 inception price. The dividend yield currently stands at 10.7%. The graph below shows Fahari I-REIT’s performance from November 2015 to 28 April 2023;
In the Unquoted Securities Platform, Acorn D-REIT and I-REIT traded at Kshs 23.9 and Kshs 20.9 per unit, respectively, as at 28th April 2023. The performance represented a 19.4% and 4.4% gain for the D-REIT and IREIT, respectively, from the Kshs 20.0 inception price. The volumes traded for the D-REIT and I-REIT came in at 12.3 mn and 29.6 mn shares, respectively, with a turnover of Kshs 239.0 mn and Kshs 603.2 mn, respectively, since inception in February 2021.
REITs provide numerous advantages, including; access to more capital pools, consistent and prolonged profits, tax exemptions, diversified portfolios, transparency, liquidity and flexibility as an asset class. Despite these benefits, the performance of the Kenyan REITs market remains limited by several factors such as; i) insufficient investor understanding of the investment instrument, ii) time-consuming approval procedures for REIT creation, iii) high minimum capital requirements of Kshs 100.0 mn for trustees, and, iv) high minimum investment amounts set at Kshs 5.0 mn discouraging investments.
- Cytonn High Yield Fund (CHYF)
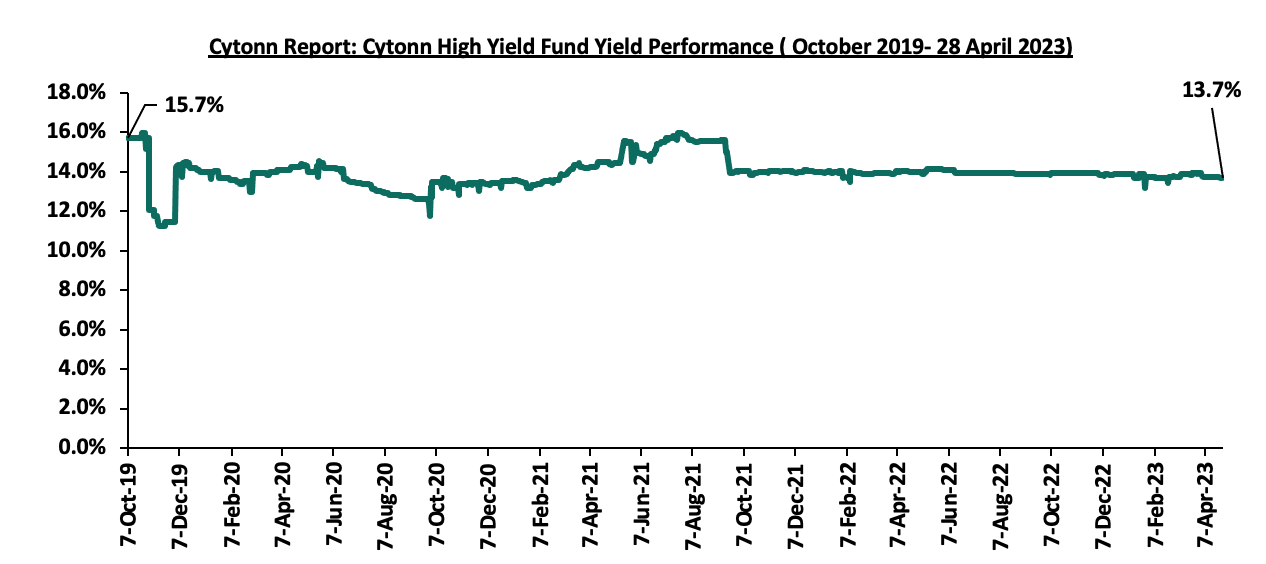
Cytonn High Yield Fund (CHYF) closed the week with an annualised yield of 13.7%, remaining relatively unchanged from what was recorded the previous week. The performance also represented a 0.2% points Year-to-Date (YTD) decline from 13.9% yield recorded on 1 January 2023 and 2.0% points Inception-to-Date (ITD) loss from the 15.7% yield. The graph below shows Fahari I-REIT’s performance from November 2015 to 28 April 2023;
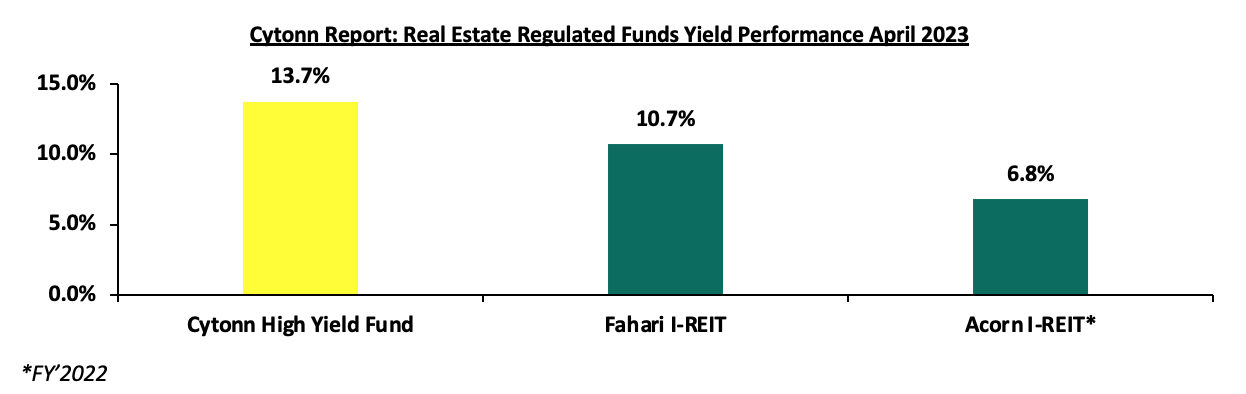
However, the CHYF had the best performance compared to other regulated Real Estate funds at 13.7% with Fahari I-REIT and Acorn I-REIT recording yields of 10.7%, and 6.8% respective, making it one of the best alternative investment resource in Real Estate. The graph below shows the yield performance of Real Estate Regulated Funds;
Source: Cytonn Research
We anticipate a sustained upward trend in Kenya's Real Estate sector performance propelled by various factors, including continuous expansion of both local and foreign retailers, continuous recovery and resilience of the hospitality sector, and a heightened emphasis on the industrial sector that will broaden the scope for Real Estate opportunities. However, factors such as rising costs of construction due to inflationary pressures, a surplus of physical space in specific sectors, and low investor appetite for REITs are expected to continue subduing the optimal performance of the general Real Estate sector.
Unit Trust Funds (UTFs) are Collective Investment Schemes that pool funds from different investors and are managed by professional fund managers. The fund managers invest the pooled funds in a portfolio of securities such as equity stocks, bonds or any authorized financial securities, with the aim of generating returns to meet the specific objectives of the fund. Following the release of the Capital Markets Authority (CMA) Quarterly Statistical Bulletin-Q1’2023, we analyze the performance of Unit Trust Funds for the period ending 31 December 2022, whose total Assets Under Management (AUM) have been steadily increasing, and are among the most popular investment options in the Kenyan market. We will further analyze the performance of Money Market Funds, a product under Unit Trust Funds.
In our previous focus on Unit Trust Funds, we looked at the Unit Trust Funds Performance-Q3’2022 by Fund Managers, where we highlighted that their AUM stood at Kshs 155.9 bn, a 7.0% increase from Kshs 145.8 bn recorded in Q2’2022. In this topical, we focus on the FY’2022 performance of Unit Trust Funds where we shall analyze the following:
- Performance of the Unit Trust Funds Industry,
- Spread of Investments,
- Performance of Money Market Funds,
- Comparing Unit Trust Funds AUM Growth with other Markets, and,
- Recommendations.
Section I: Performance of the Unit Trust Funds Industry
Unit Trust Funds are investment schemes that pool funds from investors and are managed by professional Fund Managers. The fund manager invests the pooled funds with the aim of generating returns in line with the specific objectives of the fund. The Unit Trust Funds earn returns in the form of dividends, interest income, rent and/or capital gains depending on the underlying security. The main types of Unit Trust Funds include:
- Money Market Funds – These are funds that invest in fixed income securities such as fixed deposits, treasury bills and bonds, commercial papers, etc. They are very liquid, have stable returns, and, they are suitable for risk averse investors,
- Equity Funds – These are funds which largely invest in listed securities and seek to offer superior returns over the medium to long-term by maximizing capital gains and dividend income. The funds invest in various sectors to reduce concentration risk and maintain some portion of the fund’s cash in liquid fixed income investments to maintain liquidity and pay investors if need be without losing value,
- Balanced Funds – These are funds whose investments are diversified across the Equities and the Fixed Income market. Balanced Funds offer investors long-term growth as well as reasonable levels of stability of income,
- Fixed Income Funds – These are funds which invest in interest-bearing securities, which include treasury bills, treasury bonds, preference shares, corporate bonds, loan stock, approved securities, notes and liquid assets consistent with the portfolio’s investment objective, and,
- Sector Specific Funds – These are funds that invest primarily in a particular sector or industry. The funds provide a greater measure of diversification within a given sector than may be otherwise possible for the other funds. They are specifically approved by the Capital Markets Authority as they are not invested as per the set rules and regulations.
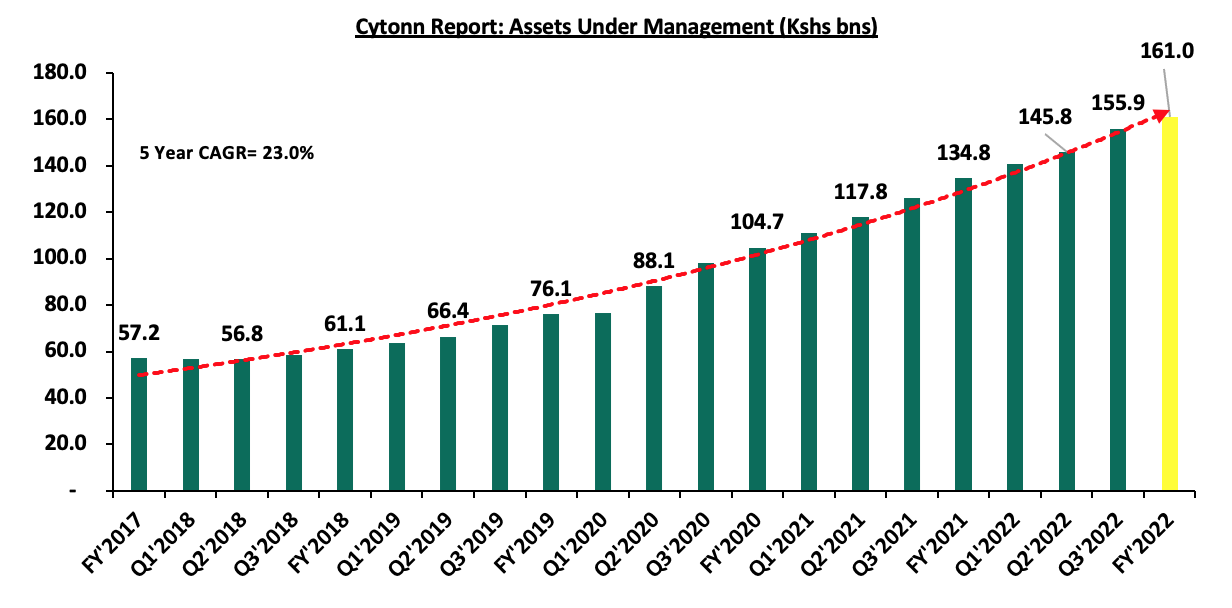
As per the Capital Markets Authority (CMA) Quarterly Statistical Bulletin-Q1’2023, the industry’s overall Assets under Management (AUM) grew by 3.3% on a quarter on quarter basis to Kshs 161.0 bn as at the end of FY’2022, from Kshs 155.9 bn recorded in Q3’2022. Similarly, on a y/y basis, the total AUM increased by 19.6% to Kshs 161.0 bn, from Kshs 134.8 bn as at the end of FY’2021. Key to note, Assets under Management of the Unit Trust Funds have registered an upward trajectory over the last five years, growing at a 5-year CAGR of 23.0% to Kshs 161.0 bn in FY’2022, from Kshs 57.2 bn recorded in FY’2017. The chart below shows the growth in Unit Trust Funds’ AUM:
Source: Capital Markets Authority Quarterly Statistical bulletins
The growth can be largely attributed to:
- Low Investments minimums: Majority of the Unit Trust Funds Collective Investment Schemes’ (CIS) in the market require a relatively low initial investment ranging between Kshs 100.0 - Kshs 10,000.0. This has in turn made them attractive to retail and individual investors, boosting their growth,
- Increased Investor Knowledge: There has been a drive towards investor education mainly by the fund managers on the various products offered by trust funds, which has meant that more people are aware and have a deeper understanding of the investment subject. As a result, their confidence has been boosted leading to increased uptake,
- Diversified product offering: Unit Trust Funds are also advantageous in terms of providing investors with access to a wider range of investment securities through pooling of funds. This allows investors the opportunity of diversifying their portfolios which would have not been accessible if they invested on their own,
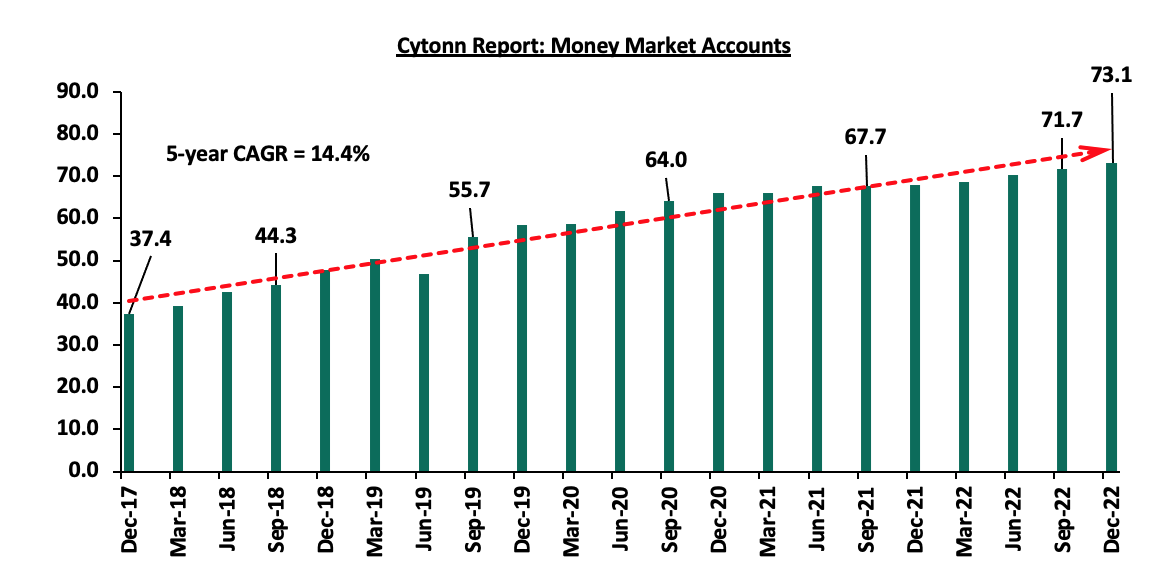
- Adoption of Fintech: Digitization and automation within the industry has enhanced ease in cash accessibility, enabling investors to immediately access their investments via M-pesa withdrawals and 3 to 5 working days if they are withdrawing to their bank accounts. According to the Central Bank of Kenya, more individuals are transacting through mobile money services as evidenced by the increase in the total number of registered mobile money accounts to 73.1 mn in December 2022, up from 37.4 mn recorded in December 2017, translating to a 5-year CAGR of 14.4%. The graph below shows the growth in the number of money market accounts in the period 2017 to 2022;
Source: CBK
Further, investors can easily track their investments based on principal invested as well as interest earned during various periods and the charges incurred via mobile apps. Some of the apps in the market include Cytonn money market App, SC Shilingi App Zimele Asset Managers App, among others, and,
- Efficiency and ease of access to cash/High Liquidity: Funds invested in UTFs are invested as portfolios with different assets and the fund managers always maintain a cash buffer. Unit trusts are highly liquid, as it is easy to sell and buy units without depending on demand and supply at the time of investment or exit.
According to the Capital Markets Authority, as at the end of FY’2022, there were 34 Collective Investment Schemes (CISs) in Kenya, up from 32 recorded at the end of Q3’2022, and a further 20.7% y/y increase from 29 recorded at the end of FY’2021. Out of the 34, 21 equivalent to 61.8% were active while 13 (38.2%) were inactive. The table below outlines the performance of the Collective Investment Schemes comparing Q3’2022 and FY’2022:
|
|
Cytonn Report: Assets Under Management (AUM) for the Approved Collective Investment Schemes |
|||||
|
No. |
Collective Investment Schemes |
Q3'2022 AUM |
Q3’2022 |
FY'2022 AUM |
FY’2022 |
AUM Growth |
|
(Kshs mns) |
Market Share |
(Kshs mns) |
Market Share |
Q3'2022 –FY'2022 |
||
|
1 |
CIC Unit Trust Scheme |
60,579.0 |
38.9% |
61,263.9 |
38.1% |
1.1% |
|
2 |
NCBA Unit Trust Scheme |
23,687.8 |
15.2% |
25,342.0 |
15.7% |
7.0% |
|
3 |
Sanlam Unit Trust Scheme |
14,542.6 |
9.3% |
15,841.6 |
9.8% |
8.9% |
|
4 |
ICEA Unit Trust Scheme |
14,939.0 |
9.6% |
14,758.9 |
9.2% |
(1.2%) |
|
5 |
British American Unit Trust Scheme |
13,439.1 |
8.6% |
13,318.0 |
8.3% |
(0.9%) |
|
6 |
Old Mutual Unit Trust Scheme |
7,363.3 |
4.7% |
7,570.5 |
4.7% |
2.8% |
|
7 |
Dry Associates Unit Trust |
3,849.3 |
2.5% |
3,881.8 |
2.4% |
0.8% |
|
8 |
Coop Unit Trust Scheme |
3,341.6 |
2.1% |
3,567.4 |
2.2% |
6.8% |
|
9 |
Nabo Capital Ltd |
3,158.7 |
2.0% |
3,291.4 |
2.0% |
4.2% |
|
10 |
Madison Asset Unit Trust Funds |
2,806.8 |
1.8% |
2,923.2 |
1.8% |
4.1% |
|
11 |
Zimele Unit Trust Scheme |
2,485.3 |
1.6% |
2,605.5 |
1.6% |
4.8% |
|
12 |
ABSA Unit Trust Scheme |
1,536.3 |
1.0% |
2,342.1 |
1.5% |
52.5% |
|
13 |
African Alliance Kenya Unit Trust Scheme |
1,476.6 |
0.9% |
1,579.3 |
1.0% |
7.0% |
|
14 |
Apollo Unit Trust Scheme |
809.5 |
0.5% |
871.1 |
0.5% |
7.6% |
|
15 |
Cytonn Unit Trust Fund |
795.7 |
0.5% |
774.5 |
0.5% |
(2.7%) |
|
16 |
Genghis Unit Trust Funds |
626.4 |
0.4% |
608.9 |
0.4% |
(2.8%) |
|
17 |
Orient Collective Investment Scheme |
247.9 |
0.2% |
248.0 |
0.2% |
0.0% |
|
18 |
Equity Investment Bank |
189.3 |
0.1% |
185.5 |
0.1% |
(2.0%) |
|
19 |
Amana Unit Trust Funds |
27.8 |
0.0% |
27.8 |
0.0% |
0.3% |
|
20 |
GenAfrica Unit Trust Scheme |
0 |
0.0% |
2.9 |
0.0% |
0.0% |
|
21 |
Wanafunzi |
0.7 |
0.0% |
0.7 |
0.0% |
2.6% |
|
22 |
Genghis Specialized Funds |
- |
- |
- |
- |
- |
|
23 |
Standard Investments Bank |
- |
- |
- |
- |
- |
|
24 |
Diaspora Unit Trust Scheme |
- |
- |
- |
- |
- |
|
25 |
Dyer and Blair Unit Trust Scheme |
- |
- |
- |
- |
- |
|
26 |
Jaza Unit Trust Fund |
- |
- |
- |
- |
- |
|
27 |
Masaru Unit Trust Fund |
- |
- |
- |
- |
- |
|
28 |
Adam Unit Trust Fund |
- |
- |
- |
- |
- |
|
29 |
First Ethical Opportunities Fund |
- |
- |
- |
- |
- |
|
30 |
Natbank Unit Trust Scheme |
- |
- |
- |
- |
- |
|
31 |
Amaka Unit Trust (Umbrella) Scheme |
- |
- |
- |
- |
- |
|
32 |
Mali Money Market Fund |
- |
- |
- |
- |
- |
|
33 |
Jubilee Unit Trust Scheme |
- |
- |
- |
- |
- |
|
34 |
Enwealth Capital Unit Trust |
- |
- |
- |
- |
- |
|
Total |
155,902.6 |
100.0% |
161,004.8 |
100.0% |
3.3% |
|
Source: Capital Markets Authority: Quarterly Statistical Bulletin, Q1’2023, and Collective Investments Scheme December 2022
Key take outs from the above table include:
- Assets Under Management: CIC Unit Trust Scheme remained the largest overall Unit Trust Fund, with an AUM of Kshs 61.3 bn in FY’2022, from an AUM of Kshs 60.6 bn in Q3’2022, translating to a 1.1% AUM growth, albeit a lower growth rate from 6.0% AUM growth recorded in Q3’2022,
- Growth: In terms of AUM growth, Absa Unit Trust recorded the highest growth for the fourth consecutive quarter, with its AUM increasing to Kshs 2.3 bn, from Kshs 1.5 bn in Q3’2022, equivalent to a 52.5% AUM growth. On the other hand, Genghis Unit Trust Fund recorded the largest decline with its AUM declining by 2.8% to Kshs 0.61 bn in FY’2022, from Kshs 0.63 bn in Q3’2022,
- Market Share: CIC Unit Trust Scheme remained the largest overall Unit Trust with a market share of 38.1%, a 0.8% points decline from 38.9% achieved in Q3’2022. The decline in market share is an indication of increasing competition as new collective schemes enter the market,
- New Collective Investment Schemes: GenAfrica Unit Trust Scheme, with AUM of Kshs 2.9 mn became an active collective investment scheme in the capital market at the end of FY’2022, increasing the number of active collective schemes to 21. Additionally, Kuza money market fund began its operation in December posting its first daily yield on 23 December 2022,
- 13 UTFs remained inactive at the end of FY’2022: Natbank Unit Trust Scheme, First Ethical Opportunities Fund, Adam Unit Trust Fund, Masaru Unit Trust Fund, Jaza Unit Trust Fund, Dyer and Blair Unit Trust Scheme, Diaspora Unit Trust Scheme, Standard Investments Bank, Genghis Specialized Fund, Jubilee Unit Trust, Enwealth Capital Trust, Amaka Unit Trust and Mali Money Market Fund remained inactive as at the end of FY’2022,
Section II: Spread of Investments
Money Market Funds (MMFs) have continued to gain popularity in Kenya with MMFs accounting for Kshs 123.8 bn out of the Kshs 161.0 bn managed by Collective Investments Schemes as at end of FY’2022, equivalent to 76.9%, which is the largest share of investments allocation by the Collective Investment Schemes. Further, this translates to a 2.0% y/y increase from Kshs 121.4 bn recorded as at end of FY’2021. The popularity of MMFs is driven by the ease in investing in terms of time and requirements, as it does not involve opening of a Central Depository System (CDS) account, coupled with the higher returns they offer compared to the returns on bank deposits and treasury bills. The table below shows investment allocations of the different funds comparing FY’2021and FY’2022:
|
Cytonn Report: Investment Allocation in Different Funds (Kshs bn) |
||||||
|
Item |
Dec-21 |
FY'2021 Investment Share |
Sep-22 |
Q3'2022 Investment Share |
Dec-22 |
FY’2022 Investment Share |
|
Money Market Funds |
121.4 |
90.2% |
121.3 |
77.8% |
123.8 |
76.9% |
|
Fixed Income Funds |
3.7 |
2.8% |
21.2 |
13.6% |
22.7 |
14.1% |
|
Equity Funds |
3.5 |
2.6% |
3.0 |
1.9% |
2.9 |
1.8% |
|
Other funds |
6.1 |
4.5% |
10.4 |
6.7% |
11.6 |
7.2% |
|
Total |
134.7 |
100.0% |
155.9 |
100.0% |
161.0 |
100.0% |
Source: CMA
Key take outs from the table above include:
- Money Market Funds: MMFs have the largest investment allocation, coming in at 76.9% at the end of FY’2022, an indication of its preference by majority of investors due to its ease of investing and high liquidity, coupled with high returns. The fund is also a good safe haven for investors who wish to switch from a higher risk portfolio to a low risk portfolio, especially in times of uncertainty. Notably, despite the large market share, the investment allocation is a decline from 77.8% and 90.2% allocations in Q3’2022 and FY’2021, respectively, highlighting the gaining competition from other funds especially the Fixed Income Fund,
- Fixed Income Funds recorded tremendous growth in 2022 to Kshs 22.7 bn in FY’2022, up from Kshs 3.7 bn in FY’2021. Similarly, on a q/q basis, Fixed Income allocation increased by 7.1% to Kshs 22.7 bn, from Kshs 21.2 bn. The growth is largely attributed to higher yields, following the upward readjustment of the yield curve, with investors demanding a higher premium to compensate for the perceived risks on the Kenyan economy, following the elevated inflationary pressures, currency depreciation, and the growing concerns surrounding the government’s ability to pay its debt obligations, and,
- Equity Funds continued on the downward trajectory, with investment allocation in equities recording a 14.7% decline to Kshs 2.9 bn as at end of FY’2022, from Kshs 3.5 bn as at end of FY’2021. The decline in equity fund’s portfolio holdings is attributable to the downward movements in the Equities market, with the Nairobi All Share Index (NASI) registering a 23.7% loss as at the end of FY’2022, a complete reversal from the 5.5% gain recorded in FY’2021. The loss is mainly attributable to increased selloffs in the Nairobi Securities Exchange, underpinned by capital outflows by foreign investors to developed economies.
In terms of UTFs’ distribution of investments by asset classes, government securities segment had the largest share of investments, with Kshs 73.4 bn out of the total 164.0 bn, translating to 45.5% of investments allocation. Similarly, investments in Fixed Deposits had Kshs 69.3 bn (43.0%) in a similar period. Key to note, the concentration of investments in the fixed income assets highlights the lack of diversification of investments and the overreliance on one investment asset class. The table below shows the distribution of investments into various asset classes:
|
Cytonn Report: Distribution of Investments in terms of Asset Classes (Kshs bn) |
|||||||
|
Asset Class |
Dec-21 |
FY’2021(%) |
Sep-22 |
Q3’2022 (%) |
Dec-22 |
FY’2022(%) |
y/y Change |
|
Government securities |
59.7 |
44.1% |
74.9 |
46.5% |
73.4 |
45.6% |
1.5% |
|
Fixed Deposit |
60.4 |
44.7% |
63.4 |
39.4% |
69.3 |
43.0% |
(1.7%) |
|
Cash and Demand Deposits |
3.6 |
2.7% |
5.6 |
3.4% |
5.6 |
3.5% |
0.8% |
|
Nairobi Stock Exchange (NSE) Listed Securities |
6.0 |
4.5% |
5.2 |
3.2% |
5.1 |
3.1% |
(1.4%) |
|
Other securities not listed at the NSE |
3.4 |
2.5% |
4.3 |
2.7% |
4.8 |
3.0% |
0.5% |
|
Other collective investments schemes |
0.8 |
0.6% |
1.2 |
0.7% |
1.5 |
1.5% |
0.9% |
|
Off-shore investments |
0.6 |
0.5% |
0.7 |
0.4% |
0.9 |
0.5% |
0.0% |
|
Immovable property |
0.6 |
0.5% |
0.5 |
0.3% |
0.5 |
0.3% |
(0.2%) |
|
Total |
135.3 |
100.0% |
155.6 |
100.0% |
161.0 |
100.0% |
0.6% |
Source: CMA
Section III: Performance of Money Market Funds
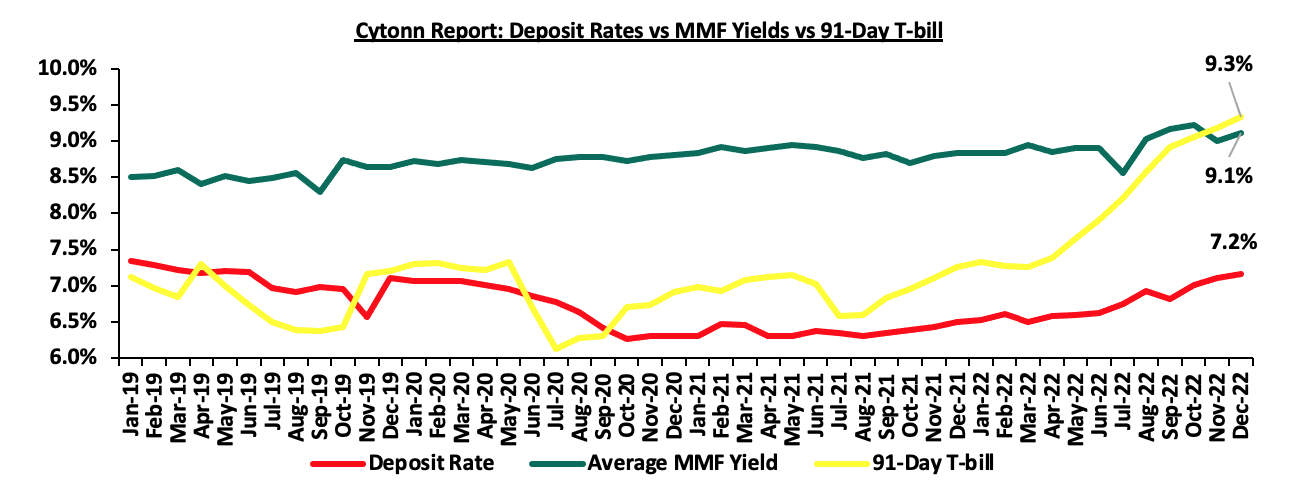
According to the Central Bank of Kenya Q4’2022 economic review, the average deposit rate increased by 40.0 bps to 7.2% in Q4’2022, from 6.8% recorded in Q3’2022. Despite the increase, the average deposit rate continues to offer the lowest returns in comparison to investing in either government securities focusing on the 91-day T-bill, or the money market funds.
During the period under review, the average deposit rate offered lower yields, with the average deposit rate for the month of December 2022 coming in at 7.2%, compared to December’s average MMF yield of 9.1%. The 91-day T-bill offered a higher return of 9.3%, with the continued increase in returns occasioned by continuous upward readjustment in the yield curve as investors demand higher compensation for the perceived risks in the country driven by high inflation and currency depreciation. The graph below shows the performance of the Money Market Fund to other short-term financial instruments:
Source: Central Bank of Kenya, Cytonn Research
As per the regulations, funds in MMFs should be invested in short-term liquid interest-bearing securities with an average tenor to maturity of 18 months or less. The short-term securities include bank deposits, fixed income securities listed on the Nairobi Securities Exchange (NSE) and securities issued by the Government of Kenya. As a result, the Money Market funds are best suited for investors who require a low-risk investment that offers capital stability, liquidity, but with a high-income yield. The fund is also a good safe haven for investors who wish to switch from a higher risk portfolio to a low risk portfolio, especially in times of uncertainty.
Top Five Money Market Funds by Yields
During the period under review, the following Money Market Funds had the highest average effective annual yield declared, with the Cytonn Money Market Fund having the highest effective annual yield at 10.7% against the industry Q4’2022 average of 8.5%.
|
Cytonn Report: Top 5 Money Market Fund Yield in Q4’2022 |
||
|
Rank |
Money Market Fund |
Effective Annual Rate (Average Q4'2022) |
|
1 |
Cytonn Money Market Fund |
10.7% |
|
2 |
Zimele Money Market Fund |
9.9% |
|
3 |
GenCap Hela Imara Money Market Fund |
9.8% |
|
4 |
NCBA Money Market Fund |
9.6% |
|
5 |
Sanlam Money Market Fund |
9.5% |
|
Average of Top 5 Money Market Funds |
9.9% |
|
|
Industry average |
8.5% |
|
Source: Cytonn Research
Section IV: Comparison between Unit Trust Funds AUM Growth and other Markets
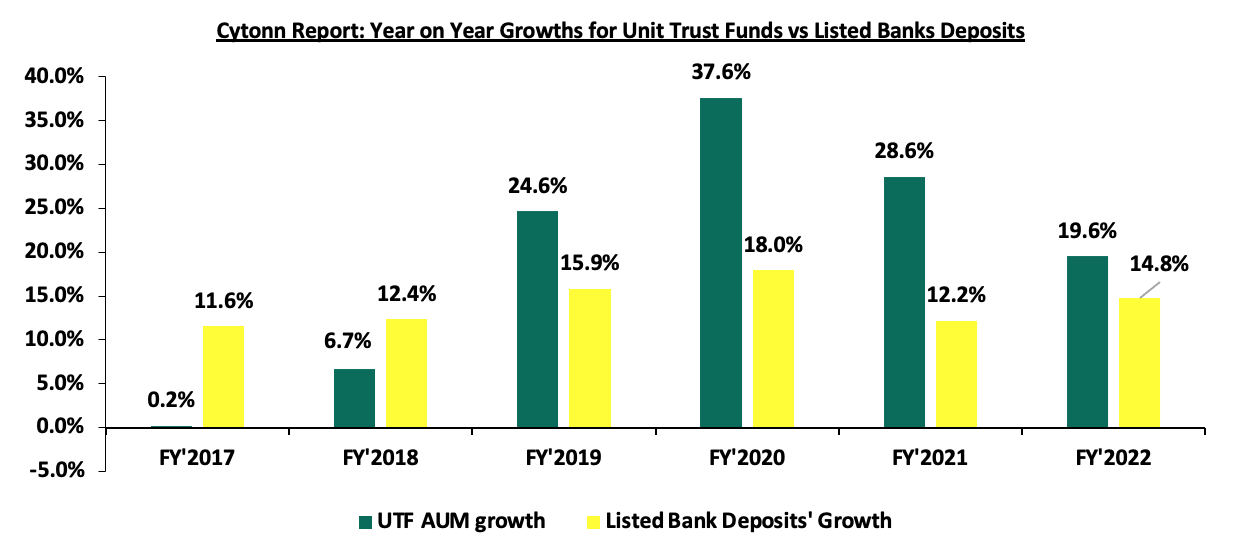
Unit Trust Funds’ assets recorded a Year on Year growth of 19.6% in FY’2022, compared to a 14.8% growth recorded by listed banks cumulative deposits over the same period. For the Unit Trust Funds, the growth of 19.6% was a decline, from 28.6% growth recorded in FY’2021. On the other hand, listed banks deposits, recorded an increase of 2.6% points to 14.8%, from the 12.2% growth recorded in FY’2021. The chart below highlights the year-on-year AUM growths for Unit Trust Funds AUM vs Listed banks deposits since 2017;
Source: Cytonn Research
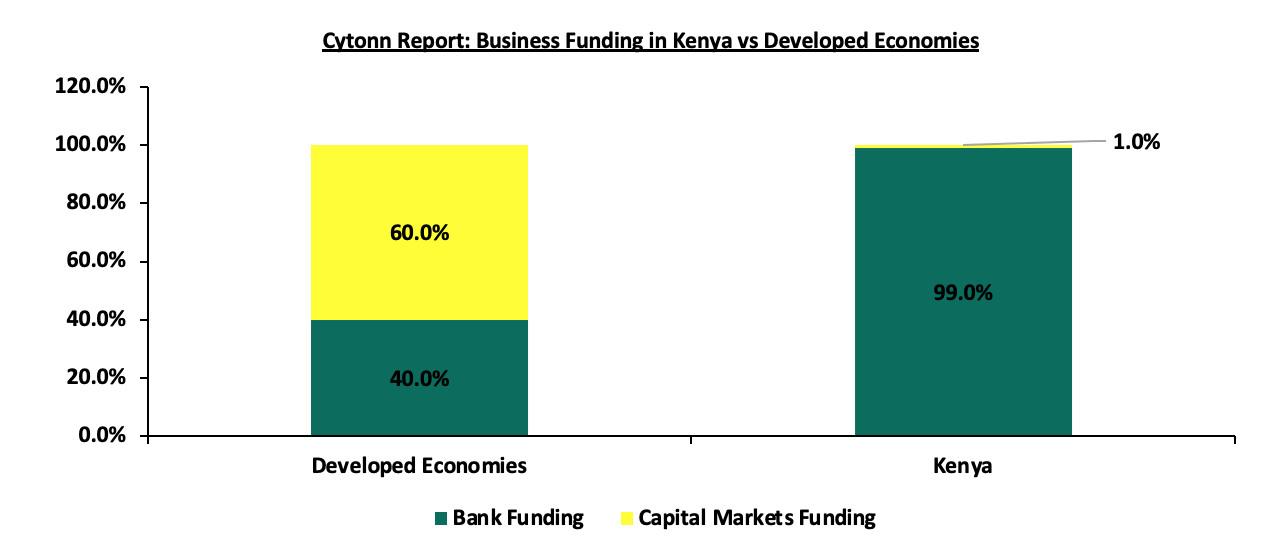
The UTFs are gaining popularity as seen by a higher growth rate, however we note that Kenya’s capital market remains stunted, driven by overreliance on the banking sector for funding. According to the World Bank data, in developed economies, businesses rely on bank funding for 40.0% of the funding; with the larger percentage of funding at 60.0% coming from the Capital markets. However, closer home, the World Bank noted that businesses in Kenya relied on banks for 99.0% of their funding while less than 1.0% comes from the capital markets, an indication of constraints in our capital markets.
Source: World Bank
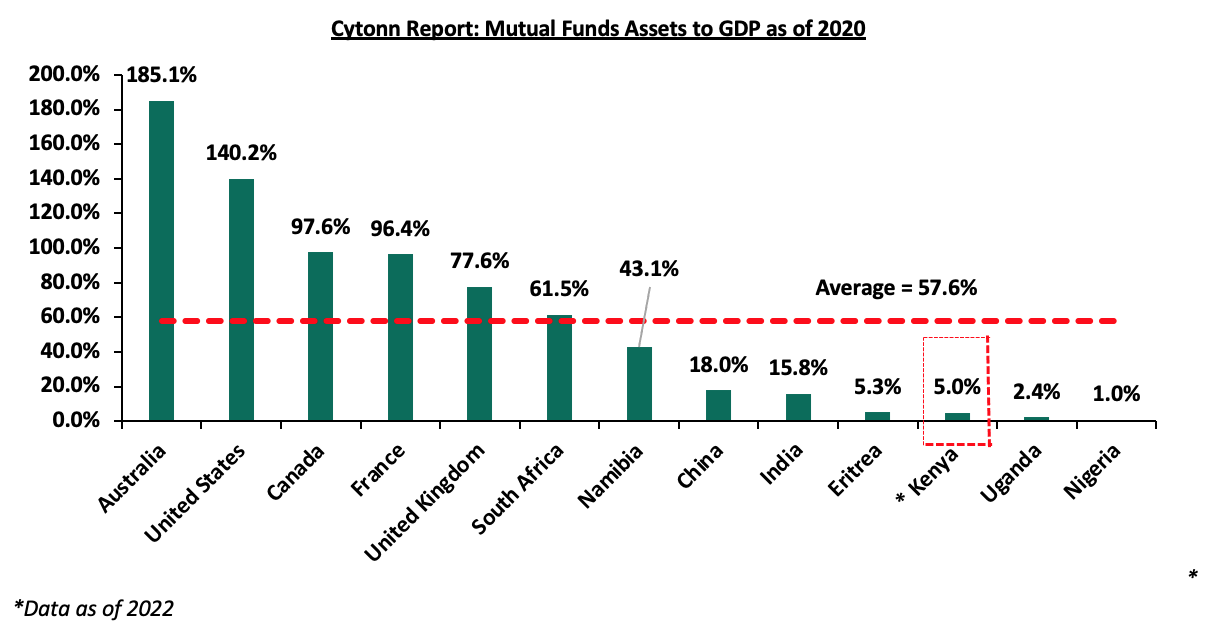
Notably, Kenya’s Mutual Funds/UTFs to GDP ratio at the end of FY’2022 came in at 5.0%, an increase from the 1.1% recorded as at end of Q3’2022, but significantly lower compared to an average of 57.6% amongst select global markets. Additionally, Sub-Saharan African countries such as South Africa and Namibia have higher mutual funds to GDP ratios of 61.5% and 43.1%, respectively as at end of 2020, compared to Kenya’s 5.0% depicting that the Kenya’s UTF industry suffers from low penetration rate, driven by an underdeveloped capital market. As such, we still have room to improve and enhance our capital markets. The chart below shows some countries’ mutual funds as a percentage of GDP:
Source: World Bank Data
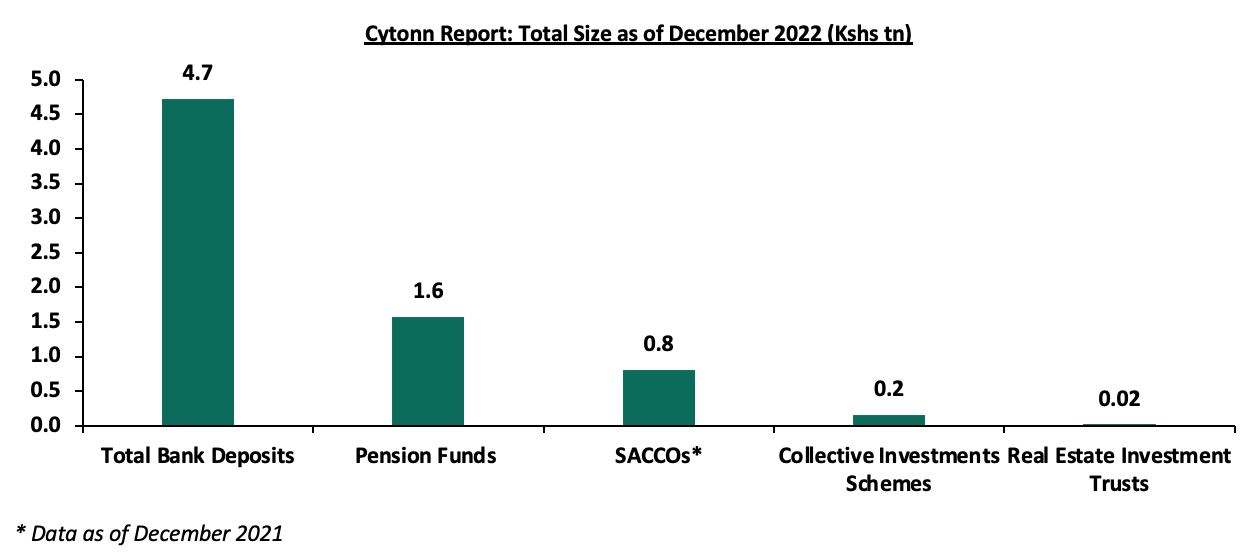
Over the past 5 years, Unit Trust Funds (UTFs) AUM has exhibited positive performance, with the Unit Trust Funds AUM having grown at a 5-year CAGR of 23.0% to Kshs 161.0 bn in FY’2022, from Kshs 57.2 bn recorded in FY’2017. However, the industry is still overshadowed by other asset gatherers such as bank deposits with the entire banking sector deposit coming in at Kshs 4.7 tn and the pension industry at Kshs 1.8 tn as of December 2022. Below is a graph showing the sizes of different saving channels and capital market products in Kenya as at December 2022;
Source: CMA, RBA, CBK, SASRA Annual Reports and REITs Financial Statements
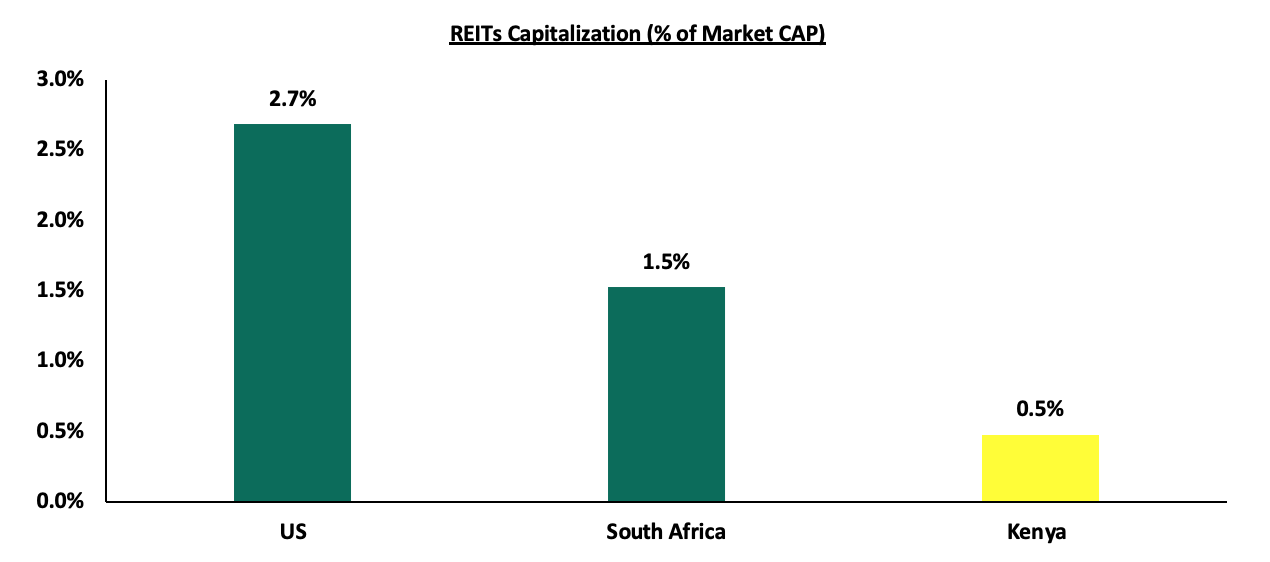
Comparing other Capital Markets products like REITS, Kenya has made strides in the sector, evidenced by the increase in REITS to market capitalization ratio to 0.5% in FY’2022, from a paltry 0.1% in FY’2021, however, there is still a lot of room for improvement. The listed REITs capitalization as a percentage of total market cap in Kenya stands at 0.5%, as compared to 2.7% in the United States (US) and 1.5% in South Africa, as of 28 April 2023. Notably, the increase is due to a decline in the total market capitalization that has adversely affected Nairobi Stock Exchange, with NASI registering 15.5% YTD decline, attributable to increased sell offs by institutional investors. Below is a graph showing comparison of Kenya’s REITs to Market Cap Ratio to that of US and South Africa:
Source: Online research, Nairobi Securities Exchange (NSE)
Section V: Recommendations
In conclusion, as witnessed by the penetration of Money Market Fund apps resulting in MMFs leading among unit trust products, there is still need to leverage more on innovation and digitization in order to further propel the growth of unit trust products in Kenya. This is further emphasized by the launch of the HISA app in Kenya, enabling retail investors to trade in Kenyan stocks, as well as, the US REITs and mutual funds, and effortlessly set up and open Central Depository and Settlement Corporation (CDSC) accounts via the application. In addition, we recommend the following actions that can be taken to stimulate growth of UTFs in the Kenyan capital market;
- Lower the minimum investment amounts: Currently, the minimum investment for sector specific funds is Kshs 1.0 mn, while that for Development REITS is currently at Kshs 5.0 mn. According to the Kenya National Bureau of Statistics, 42.2% of employees in the formal sector earn a monthly median gross income of Kshs 50,000.0 or less and another 45.5% earn a gross income range of Kshs 50,000.0 to Kshs 100,000.0, resulting in 87.7% of employees earning below Kshs 100,000.0 monthly. As such, the high minimum initial and top up investments amounts for investing in sector specific funds deter potential investors. Furthermore, these high amounts disadvantage the majority of retail investors by restricting their options for investments,
- Encourage innovation and diversification of UTFs’ investments: Majority of UTFs’ investments are either in fixed income or fixed deposits, highlighting high concentration risks. There is need to encourage fund managers to invest in different sectors of the economy as this will spur diversification of investments, as seen in the US UTF industry, as well as enhance innovation of other investment vehicles, and,
- Update regulations: The current Collective Investments Schemes Regulations in Kenya were formulated in 2001 and have not been updated since, despite the dynamic nature of the capital markets worldwide. This has led to the regulations lagging behind. For instance, the regulations do not include provisions for private offers that have grown in importance over the years. The regulations also lack stipulated guidelines on special funds to cater for the sophisticated investors’ interest in regulated alternative investments products. While there are efforts to update the regulations, we note that they remain in progress and are yet to be completed,
- Allow for sector funds: Under the current capital markets regulations, UTFs are required to diversify. However, one has to seek special dispensation in the form of sector funds such as a financial services fund, a technology fund or a Real Estate Unit Trust Fund. Regulations allowing unit holders to invest in sector funds would go a long way in expanding the scope of unit holders interested in investing,
- Eliminate conflicts of interest in the capital markets governance and allow non-financial institutions to also serve as Trustees: The capital markets regulations should foster a governance structure that is more responsive to both market participants and market growth. In particular, restricting Trustees of Unit Trust Schemes to Banks only limits options, especially given the direct competition between the banking industry and capital markets, and,
- Provide Support to Fund Managers: In our opinion, the regulator, CMA needs to include market stabilization tools as part of the regulations/Act that will help Fund Managers meet fund obligations especially during times of distress like when there are a lot of withdrawals from the funds. This can be done by collaborating with industry players to find solutions rather than publicly shunning and alienating industry players facing challenges as this may not be in the best interest of investors. We commend and appreciate the regulator’s role in safeguarding investor interests. However, since Fund Managers also play a significant role in the capital markets, the regulator should also protect the reputation of different fund managers in the industry.
Key to note, the Capital Markets Authority (CMA) publicized the Draft Capital Markets (Licensing Requirements) Regulations 2023 meant to replace the Capital Markets (Licensing)(General)Regulations, 2002, which have been in effect since 19 July 2002, with the aim of revising the fees in the capital markets operations for various industry players. The key takeout from the new draft regulations include; increase application fees for investment bank to Kshs 20,000.0 and that of other firms to Kshs 10, 000.0, from the initial fees of Kshs 2,500.0. The license fee for the fund managers registered with Retirement Benefits Authority is also set to increase to Kshs 100,000.0 from Kshs 50,000.0, while the renewal fees was maintained at Kshs 50,000.0. Additionally, the authority introduced a new category in the market, a brokerage dealer, creating room for any firm to either be a broker, or a dealer, or combine both in offering brokerage and dealership services.
Despite the growth of Unit Trust Fund penetration in Kenya, the industry still has potential to grow through the introduction of different innovative products, promotion of sector specific REITs as is the norm in the US with over 172 REITs, pushing the level of innovation higher as the REITs compete for the limited market within the U.S economy. Additionally, we note that the updated draft regulations set to increase fees in the UTF industry could be more of a disincentive to majority of the industry players. Therefore, we maintain that to spur more growth the Capital Markets Authority needs to relax its regulations to support capital markets growth.
Disclaimer: The views expressed in this publication are those of the writers where particulars are not warranted. This publication, which is in compliance with Section 2 of the Capital Markets Authority Act Cap 485A, is meant for general information only and is not a warranty, representation, advice or solicitation of any nature. Readers are advised in all circumstances to seek the advice of a registered investment advisor.

- Talk to us
- Kenya
- P.O Box 20695 - 00200, Nairobi, Kenya
- Cell +254709101200
- Tel +254709101200
- WhatsApp +254741676635
- United States
- +254709101200
- DOWNLOAD OUR APP
-


- Kenya
- 8th Floor, Pinetree Plaza, Kaburu Drive, Ngong Road, Nairobi, Kenya
- USA
- Suite 1150, 1775 Eye Street NW, USA, Washington DC 20006, USA
- Investments
- High Yield
- Private Equity
- Real Estate
- Real Estate
- RiverRun Estates
- Cytonn Towers
- The Ridge
- Taraji Heights
- The Alma