Unlocking New Listings on the Nairobi Bourse, & Cytonn Weekly #40/2018
By Cytonn Research Team, Oct 21, 2018
Executive Summary
Fixed Income
T-bills were under-subscribed during the week, with the overall subscription rate coming in at 51.5%, a decline from 63.7% recorded the previous week. Yields on the 182-day and 364-day papers remained unchanged at 8.5% and 9.6%, respectively, while the yield on the 91-day paper declined by 10 bps to 7.5%, from 7.6% the previous week. According to the Energy Regulatory Commission (ERC), petrol prices have declined by 1.0% to Kshs 115.7 from Kshs 116.8 per litre previously, while diesel and kerosene prices have increased by 1.5% and 0.4% to Kshs 109.7 and Kshs 108.8 per litre, respectively, effective 15th October 2018 - 14th November 2018. We project the inflation rate for the month of October to range between 5.8% - 6.2%;
Equities
During the week, the equities market was on an upward trend with NASI and NSE 25 gaining by 1.4%, and 1.6%, respectively while the NSE 20 remained flat. This takes the YTD performance to declines of 14.5%, 24.4% and 16.2%, for NASI, NSE 20 and NSE 25, respectively. Kenya Commercial Bank, Standard Chartered and National Bank announced a reduction of their deposit rates in line with the scrapping of the minimum interest rates on deposits requirement;
Private Equity
During the week, the Retirement Benefits Authority (RBA) released a report highlighting pension schemes’ increased investments in Private Equity. The data released showed that investments by pension funds in private equity increased by 68.0% to Kshs 0.4 bn in June 2018, from Kshs 0.3 bn in June 2017. The increase highlights the growing appetite for investors in private equity in the quest to diversify their portfolios as well as take advantage of the high returns. Also during the week, Cytonn Investments entered into a transaction with its leading institutional partner, Taaleri of Finland, whereby Taaleri has acquired the option to subscribe for up to 20.0% of shareholding in Cytonn at IPO;
Real Estate
During the week, Hass Consult released their Land Price Index Q3'2018 Report, which indicated that during the quarter, land prices recorded a slight growth of 0.2% compared to 0.4% in Q3’2017, with developers adopting a wait and see attitude, as they await the rolling out of the State Plan on affordable housing, that is likely to result in a market shift on certain areas. The House Price Index Q3’2018 Report indicated increase in house prices, with the asking house prices in Nairobi increasing by 1.1% in Q3’2018, compared to a 1.8% decrease in Q3’2017, attributable to the restored investor confidence following the conclusion of the elections held last year. In the residential sector, the Principal Secretary, State Department for Housing and Urban Development, Mr. Charles Hinga, announced that the government will be using blockchain technology to allocate the low cost housing units that will be developed under the National Housing Development Fund (NHDF);
Focus of the Week
The Nairobi Securities Exchange (NSE) has struggled to attract new listings, having only seen two over the last five years - with one each in 2014 and 2015 by NSE and Stanlib Investments, respectively, raising Kshs 627.0 mn and Kshs 3.6 bn respectively. The Capital Markets Authority (CMA) has raised concerns that Kenya has been unable to achieve its projected listings targets as articulated in its Capital Markets Master Plan, which envisions at least four listings on the NSE every year. In this week’s focus note, we take a view on the reasons behind the low number of new listings, as well as recommendations on what should be done to end the listing drought at the NSE.
- Cytonn Investments Management Plc entered into a transaction with its leading institutional partner, Taaleri of Finland, whereby Taaleri has acquired the option to subscribe for up to 20% of Cytonn shares. The transaction effectively enhances the partnership beyond project financing to now ownership, which better aligns the parties. For more information, see our press release;
- Maurice Oduor, Principal Officer, Cytonn Asset Managers Ltd was on Citizen TV to discuss the taxes on internet and mobile money transfers that were introduced by the Kenya Government following the passing of the Finance Bill 2018. See Maurice here;
- Beatrice Mwangi, Assistant Research Analyst was on Njata TV to discuss the Company’s product offering. See Beatrice here;
- The Show Houses for The Ridge, our Kshs 12.0 bn development in Ridgeways, will be open for viewing from October 27th, 2018. To subscribe, please register here;
- We continue to hold weekly workshops and site visits on how to build wealth through real estate investments. The weekly workshops and site visits target both investors looking to invest in real estate directly and those interested in high yield investment products to familiarize themselves with how we support our high yields. Watch progress videos and pictures of The Alma, Amara Ridge, The Ridge, and Taraji Heights. Key to note is that our cost of capital is priced off the loan markets, where all-in pricing ranges from 16.0% to 20.0%, and our yield on real estate developments ranges from 23.0% to 25.0%, hence our top-line gross spread is about 6.0%. If interested in attending the site visits, kindly register here;
- We continue to see very strong interest in our weekly Private Wealth Management Training (largely covering financial planning and structured products). The training is at no cost and is open only to pre-screened participants. We also continue to see institutions and investment groups interested in the training for their teams. The Wealth Management Training is run by the Cytonn Foundation under its financial literacy pillar. If interested in our Private Wealth Management Training for your employees or investment group, please get in touch with us through wmt@cytonn.com. To view the Wealth Management Training topics, click here;
- For recent news about the company, see our news section here;
- We have 10 investment-ready projects, offering attractive development and buyer targeted returns of around 23.0% to 25.0% p.a. See further details here: Summary of Investment-Ready Projects; and
- We continue to beef up the team with ongoing hires for Financial and Real Estate Advisors for our offices in Nairobi, Nakuru, Kisumu, and Nyeri. Visit the Careers section on our website to apply.
T-Bills & T-Bonds Primary Auction:
T-bills were under-subscribed during the week, with the overall subscription rate coming in at 51.5%, a decline from 63.7% recorded the previous week. The subdued performance is partly attributable to the 15-year tenor primary bond sale that closed this week, on 16th October 2018, amidst tighter liquidity in the interbank market, which has seen the interbank rate increase to 3.8% as at 19th October 2018, from 3.5% as at 15th October 2018. The subscription rate for the 182-day paper increased to 35.8% from 26.4% the previous week, while the subscription rate for the 91-day and 364-day papers declined to 95.8% and 49.6% from 157.6% and 63.4%, recorded the previous week, respectively. The yields on the 182-day and 364-day papers remained unchanged at 8.5% and 9.6%, respectively, while the yield on the 91-day paper declined by 10 bps to 7.5%, from 7.6% the previous week. The acceptance rate for T-bills declined marginally to 97.4% from 99.3%, the previous week, with the government accepting Kshs 12.0 bn of the Kshs 12.4 bn worth of bids received, against the Kshs 24.0 bn on offer.
The newly issued 15-year Treasury bond for the month of October, (FXD 2/2018/15), was undersubscribed at an overall subscription rate of 67.6%. We attribute the continued low-performance of long-term bonds to the relatively flat yield curve on the long-end as compared to the relatively steep short-end of the yield curve, making it unattractive to hold longer-term bonds. The yield came in at 12.7%, in line with our expectations of 12.6% - 12.8%, lower than the May bond issue, (FXD1/2018/15), with a similar tenor, which had a yield of 13.1%, as yields continue to decline due to the Central Bank of Kenya’s (CBK’s) efforts to keep rates low by rejecting expensive bids in the auction market. The government accepted Kshs 7.8 bn out of the Kshs 27.0 bn worth of bids received against Kshs 40.0 bn on offer, translating to an acceptance rate of 29.0%.
Liquidity:
The average interbank rate increased marginally to 3.7%, from 3.5% the previous week, while the average volumes traded in the interbank market increased by 18.2% to Kshs 15.4 bn from 13.0 bn the previous week. The increase in the interbank rate points to tighter liquidity conditions, attributed to banks trading at higher interest rates.
Kenya Eurobonds:
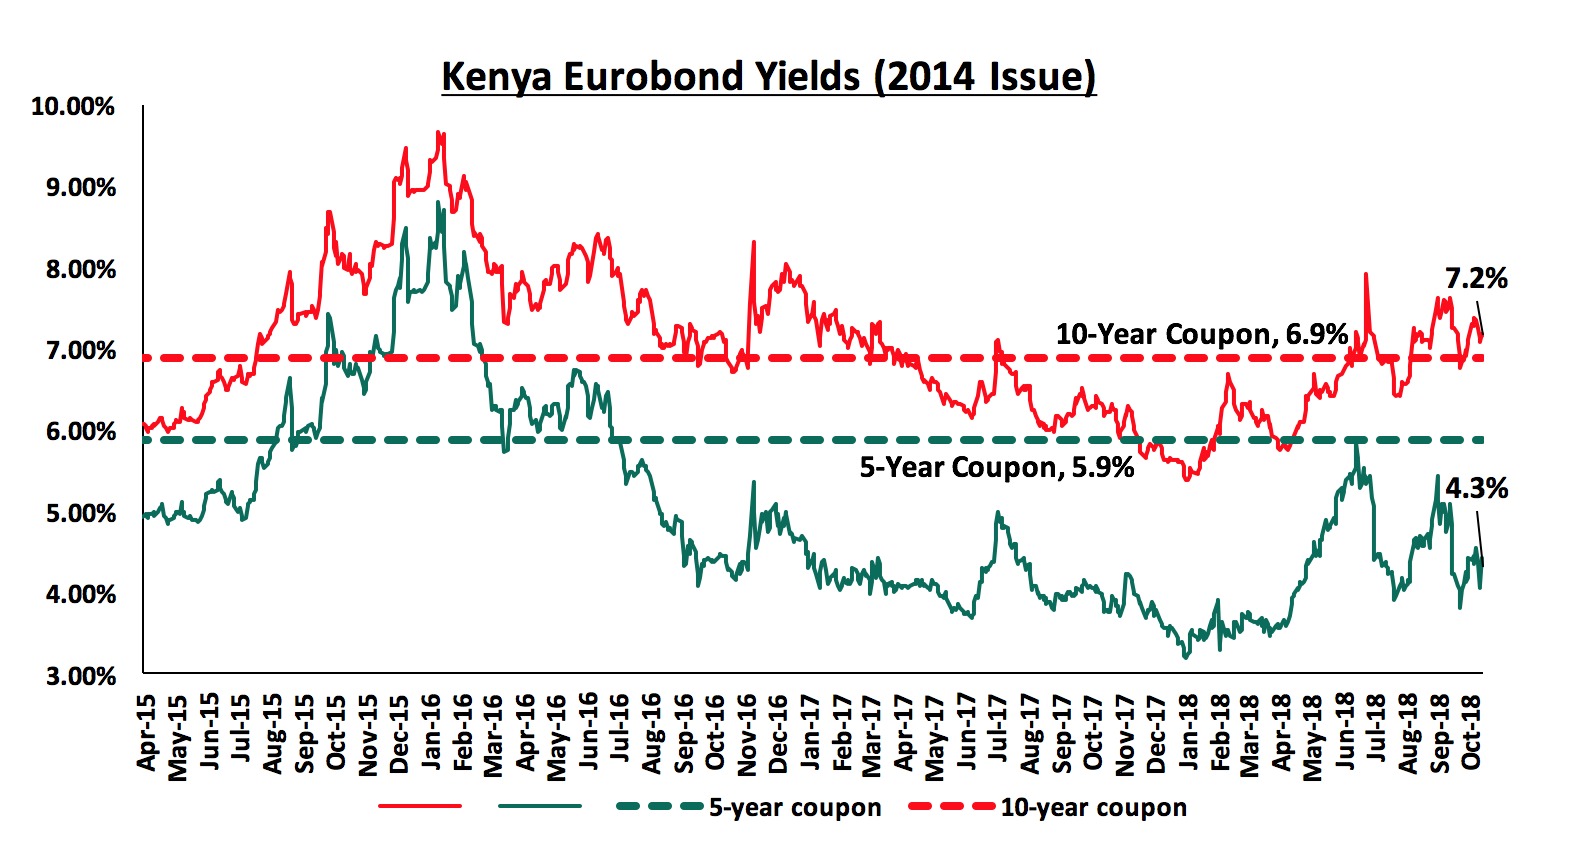
According to Bloomberg, the yields on the 10-year and 5-year Eurobonds issued in 2014 declined by 0.1% points and 0.2% points to 7.2% and 4.3% from 7.3% and 4.5% the previous week, respectively. Since the mid-January 2016 peak, yields on the Kenyan Eurobonds have declined by 2.4% points and 4.5% points for the 10-year and 5-year Eurobonds, respectively, an indication of the relatively stable macroeconomic conditions in the country. Key to note is that these bonds have 0.7 years and 5.7 years to maturity for the 5-year and 10-year, respectively.
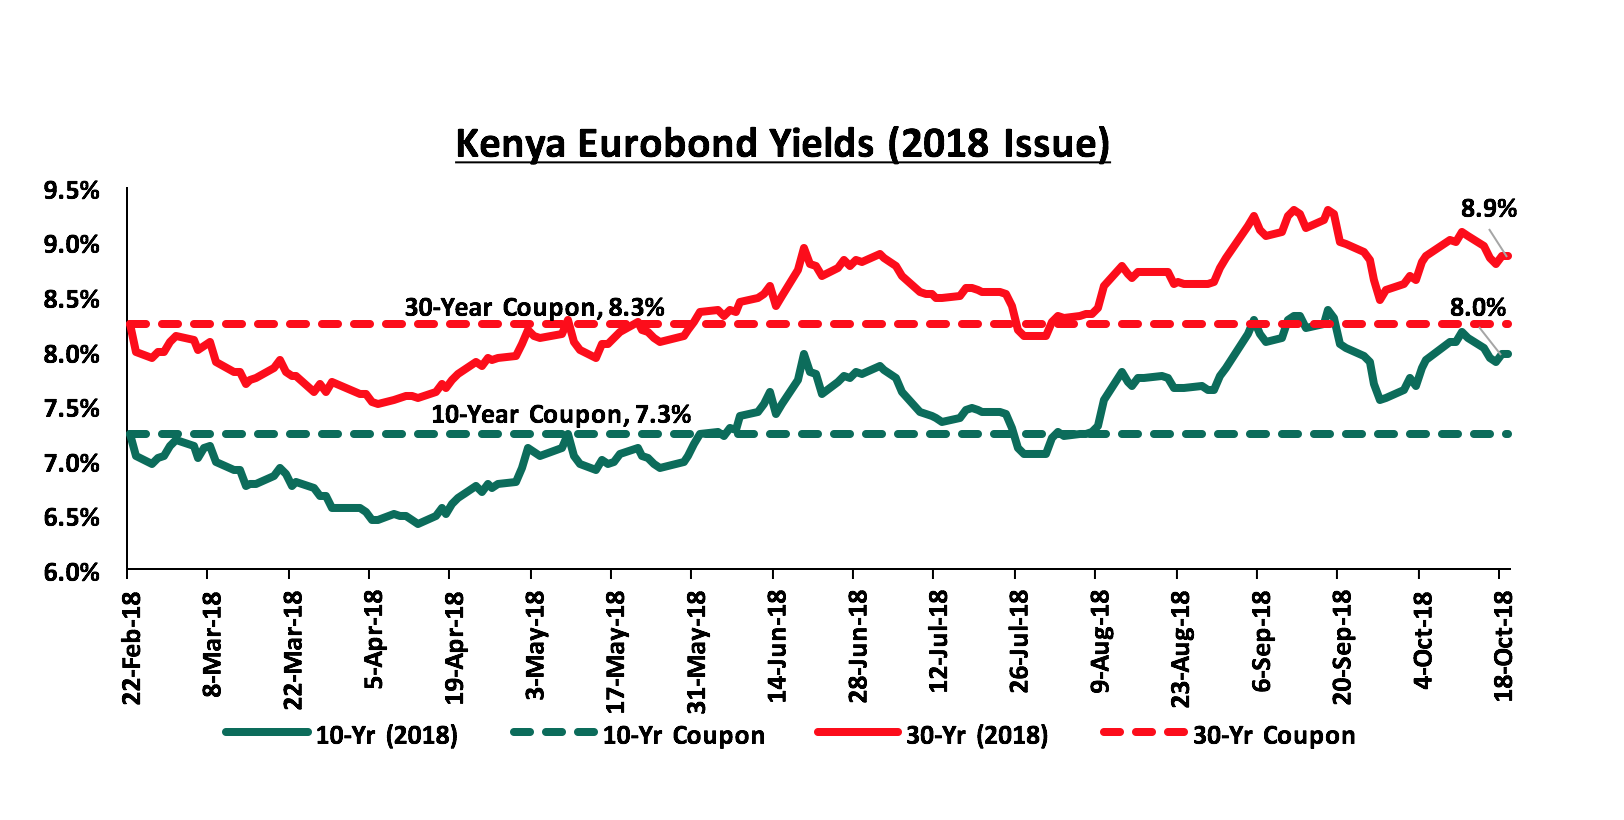
For the February 2018 Eurobond issue, during the week, the yields on both the 10-year and 30-year Eurobonds declined by 0.1% points and 0.2% points to 8.0% and 8.9% from 8.1% and 9.1% the previous week, respectively. Since the issue date, the yields on the 10-year and 30-year Eurobonds have both increased by 0.7% and 0.6% points, respectively.
Kenya Shilling:
During the week, the Kenya Shilling remained stable against the US Dollar, depreciating marginally by 0.1% from Kshs 100.9 to Kshs 101.0, due to demand from merchant importers matching supply from diaspora remittances. The Kenya Shilling has appreciated by 2.1% year to date, and in our view the shilling should remain relatively stable to the dollar in the short term, supported by:
- The narrowing of the current account deficit to 5.8% in the 12-months to June 2018, from 6.3% in March 2018, attributed to improved agriculture exports, and lower capital goods imports following the completion of Phase I of the Standard Gauge Railway (SGR) project,
- Stronger inflows from principal exports, which include coffee, tea, and horticulture, which increased by 1.7% during the month of July to Kshs 24.7 bn, from Kshs 24.3 bn in June, with the exports from horticulture improving by 9.1%,
- Improving diaspora remittances, which increased by 71.9% y/y to USD 266.2 mn in June 2018 from USD 154.9 mn in June 2017 and by 4.9% m/m, from USD 253.7 mn in May 2018, with the largest contributor being North America at USD 130.1 mn, attributed to; (a) recovery of the global economy, (b) increased uptake of financial products by the diaspora due to financial services firms, particularly banks, targeting the diaspora, and (c) new partnerships between international money remittance providers and local commercial banks making the process more convenient, and,
- High levels of forex reserves, currently at USD 8.4 bn, equivalent to 5.6-months of import cover, compared to the one-year average of 5.4-months.
Highlight of the Week:
During the week, the Energy Regulatory Commission (ERC) released their monthly statement on the Maximum Retail Prices in Kenya for the period 15th October 2018 to 14th November 2018. Below are the key take-outs from the statement:
- Petrol prices have declined by 1.0% to Kshs 115.7 from Kshs 116.8 per litre previously, while diesel and kerosene prices have increased by 1.5% and 0.4% to Kshs 109.7 and 108.8 per litre, respectively, from Kshs 108.1 and 108.4 per litre, previously,
- The changes in prices have been attributed to the decrease in average landing costs of imported super petrol by 2.0% to USD 729.0 per ton in September from USD 743.9 per ton in August. Landing costs for diesel and kerosene increased by 2.1% and 0.6% to USD 700.4 per ton and USD 721.6 per ton in September, respectively, from USD 686.0 per ton and USD 717.3 per ton in August,
- The mean monthly USD to Kenyan Shilling exchange rate accelerated the rise in prices with the Kenyan Shilling depreciating by 0.2% to Kshs 100.9 from Kshs 100.7 in August,
- Additionally, kerosene prices have been on a steady rise due to the continued effects of the anti-adulteration levy of Kshs 18.0 per litre of the customs value of kerosene payable by the importer at the time of entry of the Kerosene into the country. The levy was introduced in a bid to harmonize the prices of kerosene and diesel thus eliminating fuel adulteration that has led to pollution, damage to vehicle engines as well as adversely affecting government’s revenue.
Inflation Projection:
We are projecting the inflation rate for the month of October to range between 5.8% - 6.2%. We expect the month on month inflation to decline mainly due to:
- A decline in food prices mainly because of reduced prices of maize flour, resulting from the directive by the government requiring millers and traders to sell a 2 kg bag at or below Kshs 75.0 from the initial range of between Kshs 82.0 to Kshs 100.0, attributed to improved maize harvest,
- A decline in petrol prices by 1.0% to Kshs 115.7 from Kshs 116.8 per litre, despite an increase in diesel prices by 1.5% to Kshs 109.7 per litre. We expect this to directly affect transport costs and indirectly affect food prices in October,
- On the housing, water, electricity, gas and other fuels index, kerosene prices went up marginally during the month by 0.4%. This is however expected to be mitigated by a decline in electricity costs, as homes and businesses will for the second month get a refund of Kshs 0.0768 per kilowatt hour (kWh), after receiving a Kshs 0.013 per kWh refund in September, following a review of the foreign exchange levy on power bills by the Energy Regulatory Commission (ERC). The commission had used a higher dollar rate to compute the foreign exchange levy in August, which had brought a rise in tariffs of up to 52.8% in that month.
We expect inflation in H2’2018 to experience upward pressure mainly due to the implementation of the 8.0% VAT on fuel as well as other tax amendments introduced through the Finance Bill 2018. We however expect this to be mitigated by declined food prices due to improved weather conditions, affirming the expectations of inflation for the year to average within the government’s set target of 2.5% - 7.5%.
Rates in the fixed income market have been on a declining trend, as the government continues to reject expensive bids, as it is currently 46.8% ahead of its pro-rated borrowing target for the current financial year, having borrowed Kshs 130.5 bn against a pro-rated target of Kshs 88.9 bn. The 2018/19 budget had given a domestic borrowing target of Kshs 271.9 bn, 8.6% lower than the 2017/2018 fiscal year’s target of Kshs 297.6 bn, which may result in reduced pressure on domestic borrowing. With the rate cap still in place, with the president having assented to the Finance Bill 2018, we maintain our expectation of stability in the interest rate environment. With the expectation of a relatively stable interest rate environment, our view is that investors should be biased towards medium-term fixed-income instrument.
Market Performance:
During the week, the equities market was on an upward trend with NASI and NSE 25 gaining by 1.4%, and 1.6%, respectively while the NSE 20 remained flat. This takes the YTD performance to declines of 14.5%, 24.4% and 16.2%, for NASI, NSE 20 and NSE 25, respectively. This week’s performance was driven by gains in large cap counters such as KCB Group, Safaricom, Barclays Bank of Kenya, and NIC, which gained by 4.1%, 3.3%, 1.4%, and 1.0% respectively. For the last twelve months (LTM), NASI, NSE 20 and NSE 25 have declined by 5.6%, 20.8%, and 8.5%, respectively.
Equities turnover increased by 133.9 % to USD 26.5 mn from USD 11.3 mn the previous week, bringing the YTD turnover to USD 1.5 bn. Foreign investors remained net sellers, with net weekly outflows increasing by 83.9% to USD 12.9 mn, from USD 7.0 mn in the previous week. We expect the market to remain subdued in the near-term as international investors exit the broader emerging markets due to the expectation of rising US interest rates coupled with the strengthening US Dollar.
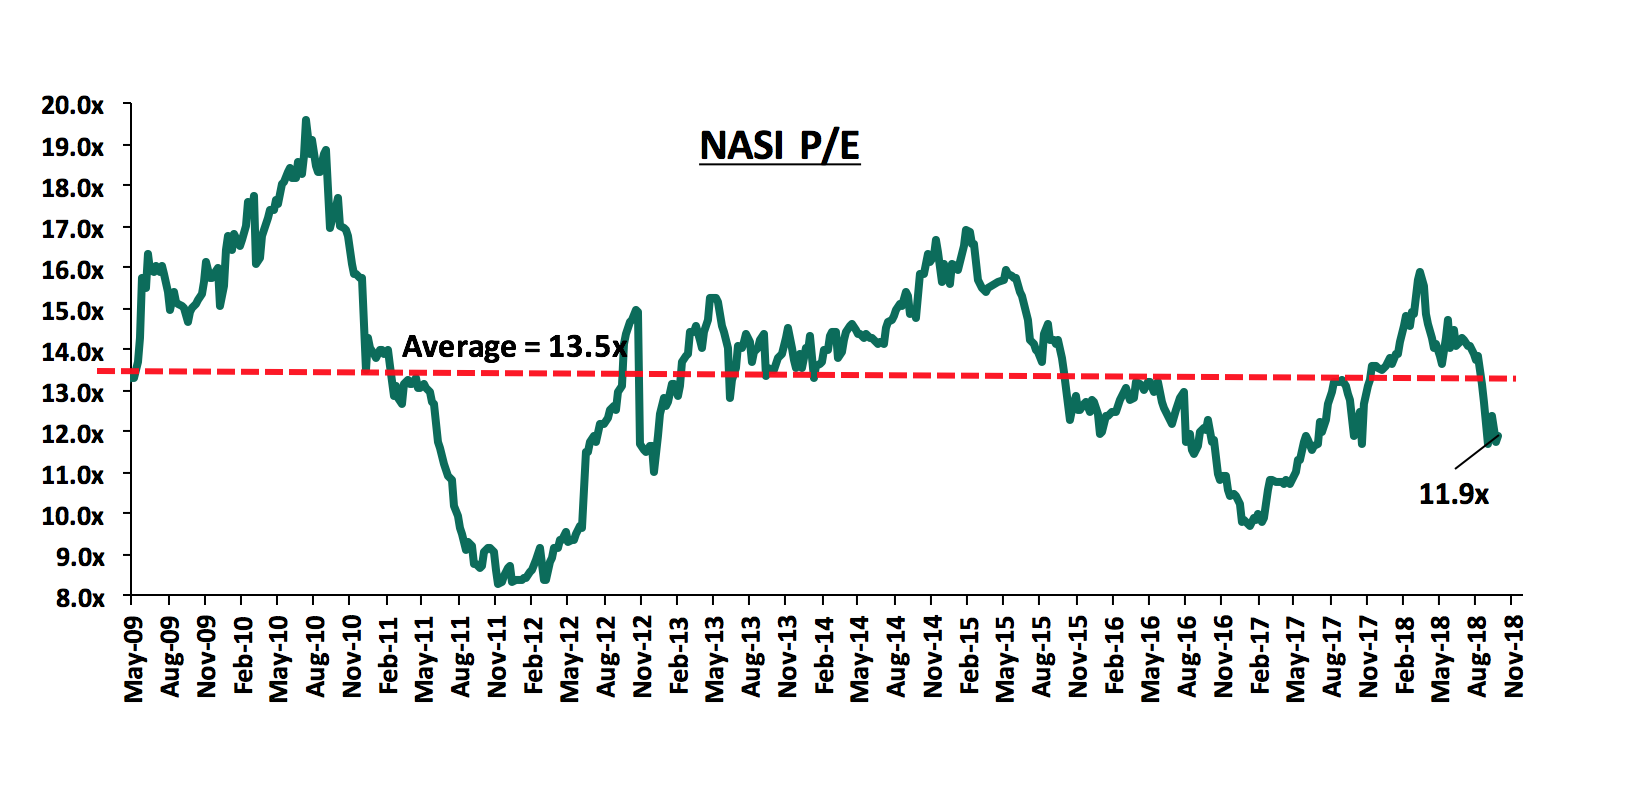
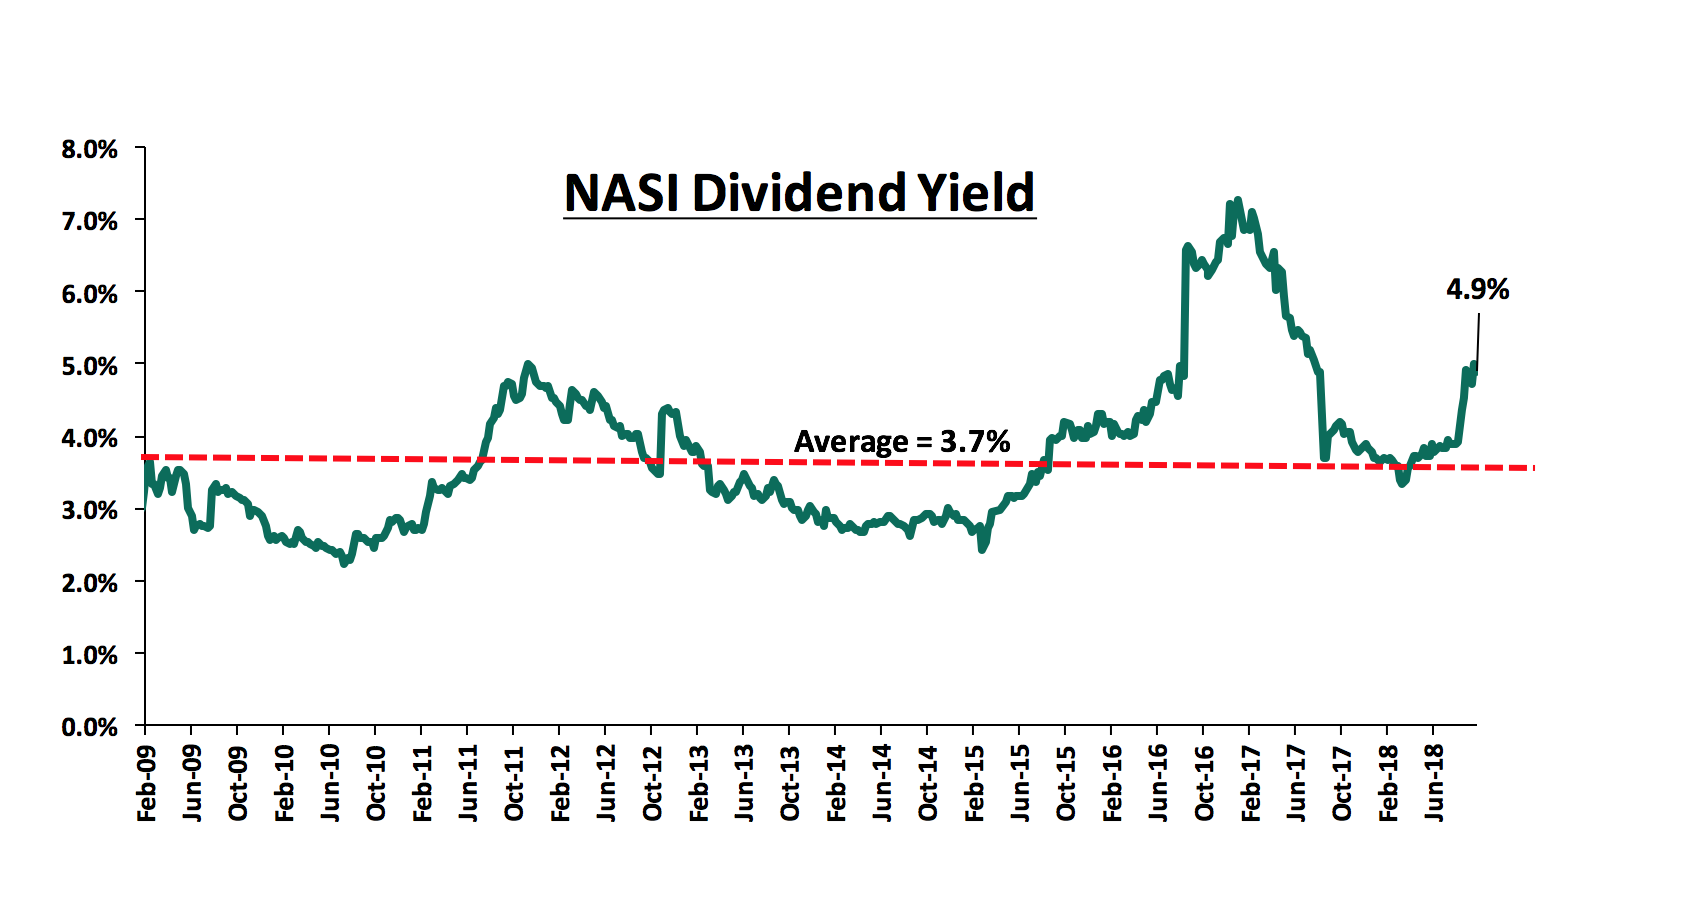
The market is currently trading at a price to earnings ratio (P/E) of 11.9x, which is 13.0% below the historical average of 13.5x, and a dividend yield of 4.9%, higher than the historical average of 3.7%. The current P/E valuation of 11.9x is 21.5% above the most recent trough valuation of 9.8x experienced in the first week of February 2017, and 43.5% above the previous trough valuation of 8.3x experienced in December 2011. The charts below indicate the historical P/E and dividend yields of the market:
Weekly Highlights:
Following the enactment of the Finance Bill 2018 in September 2018, banks are no longer mandated to pay a minimum 70% of Central Bank Rate (CBR) on interest-earning deposits as was previously required, since the enactment of Banking (Amendment) Act 2015. As a result, banks have initiated the process of revising their deposit rates downwards as they aim to reduce their cost of funding. Kenya Commercial Bank (KCB) issued a notice that it had slashed interest rates on its Goal Savings Account from 8.5 % to 7.0 %. The bank also announced that customers would be paid less than 6.3% interest on all the other savings accounts. The classifications are summarized below;
|
KCB Revision of Interest Rates |
||
|
|
Before |
Revised interest rate (p.a) |
|
KCB Cub Account |
6.3% |
5.0% |
|
KCB Simba Account |
6.3% |
5.0% |
|
KCB Goal Savings Account |
8.5% |
7.0% |
|
Fixed Deposits Accounts |
>6.3% |
6.0% |
The notice will be effective 16th November, 2018. As a result, we expect the interest expense to reduce on the back of a downward revision of interest rate payable on deposits, and consequently improve the Net Interest Margin. Historically, the bank’s performance has been as highlighted below;
|
KCB Historical Cost of funding and Net Interest Margin |
|||||||
|
|
2012 |
2013 |
2014 |
2015 |
2016 |
2017 |
H1'2018 |
|
Net Interest Margin |
10.5% |
10.3% |
9.6% |
8.6% |
9.2% |
8.7% |
8.6% |
|
Cost of Funding |
4.2% |
2.8% |
3.2% |
3.9% |
3.3% |
3.0% |
3.0% |
Standard Chartered Bank also revised downwards its deposit rate for savings accounts where only deposits of above Kshs 50.0 mn will get an annual return of 6.0%. The tiers are classified as highlighted below;
|
Standard Chartered Bank Revision of Interest Rates |
|
|
Savings (Kshs mn) |
Revised interest rate (p.a) |
|
0 - 1.9 |
1.0% |
|
2 - 4.9 |
2.0% |
|
5 - 9.9 |
2.5% |
|
10 - 14.9 |
3.0% |
|
15 - 19.9 |
3.5% |
|
20 - 24.9 |
4.0% |
|
25 - 29.9 |
4.5% |
|
30 - 49.9 |
5.0% |
|
Above 50 |
6.0% |
National Bank of Kenya (NBK) also announced lower, albeit relatively competitive deposit rates. In a new deposit mobilization plan, the bank introduces a tiered interest rate structure that will see customers earn between 1.0% and 7.0% depending on the amount of deposits. The tiers are classified as highlighted below;
|
National Bank Revised deposit Rates |
|
|
Savings (Kshs) |
Revised interest rate (p.a) |
|
5,001 - 50,000 |
1.0% |
|
50,000 - 2.0 mn |
5.0% |
|
Above 2.0 mn |
7.0% |
This is an effort by the lender to increase deposits, which dropped after peaking in 2015, as indicated below;
|
NBK Historical Cost of funding and Net Interest Margin |
|||||||
|
|
2012 |
2013 |
2014 |
2015 |
2016 |
2017 |
H1'2018 |
|
Deposits |
55.1 |
78.0 |
104.7 |
110.6 |
93.9 |
94.3 |
96.0 |
|
Cost of Funding |
6.5% |
3.8% |
4.1% |
5.3% |
4.1% |
3.3% |
3.0% |
According to data from the Central Bank of Kenya (CBK), the average cost of deposits in the banking sector has been on a decline since 2015. This was largely due to reclassification of bank accounts to non-interest earning accounts, effectively reducing the associated interest expense. As at December 2017, the average cost of deposits stood at 4.3%, translating to a total interest expense of Kshs 124.4 bn as indicated below;
|
Banking Sector Interest Expenses |
||||||
|
2012 |
2013 |
2014 |
2015 |
2016 |
2017 |
|
|
Average Cost of Deposits |
5.9% |
3.8% |
4.9% |
5.5% |
5.0% |
4.3% |
|
Total Interest Expense |
110.9 |
83.8 |
103.6 |
133.1 |
130.8 |
124.4 |
We expect other banks to follow suit and lower their deposit rates and as a result, the average cost of deposit is set to continue declining, which is likely to improve the sector’s overall Net Interest Margin (NIM).
NIC Bank announced that it has sealed a deal to supply 400 trucks to the Kenya Police worth Kshs 1.2 bn. The deal will see the banks leasing arm, NIC Leasing Liability Partnership partner with car dealer Isuzu East Africa to deliver the 400 Isuzu trucks, buses and double-cab trucks. In a similar deal early in October 2018, Co-operative Bank announced a joint leasing venture with South African logistics firm, Super Group, to supply 412 trucks, also to the Kenya Police, worth Kshs 2.2 bn. Banks have been making forays in various segments to grow their fee income, to try and mitigate the impact of compressed Net Interest Margins (NIMs) which declined from 9.6% in 2016 to 8.3% in 2017 signalling the ushering of the current interest rate capped regime. This is seen with the average Non-Funded Income to Total Operating Income ratio increasing to 34.3% in H1’2018 from 34.0% in H1’2017. With the cap on interest rates chargeable on loans still in place, we expect banks to continue diversifying their income sources by continuing to focus mainly on the Non-Funded Income (NFI), which include; venturing in bancassurance and transactional income from alternative channels.
Equities Universe of Coverage:
Below is our Equities Universe of Coverage:
|
Banks |
Price as at 12/10/2018 |
Price as at 19/10/2018 |
w/w change |
YTD Change |
LTM Change |
Target Price* |
Dividend Yield |
Upside/Downside* |
P/TBv Multiple |
|
NIC Bank*** |
24.5 |
24.8 |
1.0% |
(26.7%) |
(26.4%) |
48.8 |
4.0% |
101.2% |
0.6x |
|
KCB Group |
36.8 |
38.3 |
4.1% |
(10.5%) |
4.8% |
61.3 |
7.8% |
68.1% |
1.2x |
|
Diamond Trust Bank |
165.0 |
164.0 |
(0.6%) |
(14.6%) |
(8.4%) |
283.7 |
1.6% |
74.6% |
0.9x |
|
Union Bank Plc |
5.0 |
5.0 |
1.0% |
(35.9%) |
(18.2%) |
8.2 |
0.0% |
63.0% |
0.5x |
|
Zenith Bank*** |
22.2 |
22.9 |
3.2% |
(10.7%) |
(12.8%) |
33.3 |
11.8% |
57.3% |
1.0x |
|
Equity Group |
38.0 |
38.3 |
0.7% |
(3.8%) |
5.5% |
56.2 |
5.2% |
52.2% |
1.8x |
|
Ghana Commercial Bank*** |
5.4 |
5.4 |
0.0% |
5.9% |
33.8% |
7.7 |
7.1% |
51.4% |
1.3x |
|
I&M Holdings*** |
95.0 |
95.0 |
0.0% |
(25.2%) |
(23.4%) |
138.6 |
3.7% |
49.6% |
1.0x |
|
UBA Bank |
8.1 |
8.2 |
0.6% |
(20.9%) |
(7.9%) |
10.7 |
10.4% |
41.7% |
0.5x |
|
Co-operative Bank |
15.4 |
14.6 |
(4.9%) |
(8.8%) |
(9.3%) |
19.9 |
5.5% |
41.8% |
1.4x |
|
Ecobank |
8.0 |
8.0 |
(0.6%) |
4.6% |
16.8% |
10.7 |
0.0% |
35.0% |
1.8x |
|
Barclays |
10.4 |
10.5 |
1.0% |
8.9% |
16.1% |
12.5 |
9.6% |
29.2% |
1.4x |
|
CRDB |
160.0 |
150.0 |
(6.3%) |
(6.3%) |
(11.8%) |
207.7 |
0.0% |
38.5% |
0.5x |
|
Access Bank |
8.0 |
8.3 |
3.8% |
(20.6%) |
(12.6%) |
9.5 |
4.8% |
19.3% |
0.5x |
|
CAL Bank |
1.2 |
1.1 |
(5.2%) |
1.9% |
19.7% |
1.4 |
0.0% |
27.3% |
1.0x |
|
Stanbic Bank Uganda |
33.0 |
32.5 |
(1.5%) |
19.3% |
19.3% |
36.3 |
3.6% |
15.2% |
2.3x |
|
HF Group*** |
6.2 |
5.9 |
(4.1%) |
(43.3%) |
(38.5%) |
6.6 |
5.9% |
17.8% |
0.2x |
|
Standard Chartered |
186.0 |
187.0 |
0.5% |
(10.1%) |
(13.4%) |
196.3 |
6.7% |
11.7% |
1.5x |
|
SBM Holdings |
6.3 |
6.3 |
(0.3%) |
(16.5%) |
(19.3%) |
6.6 |
4.8% |
9.6% |
0.9x |
|
Bank of Kigali |
289.0 |
289.0 |
0.0% |
(3.7%) |
1.4% |
299.9 |
4.8% |
8.6% |
1.6x |
|
Guaranty Trust Bank |
36.5 |
36.8 |
0.8% |
(9.7%) |
(11.8%) |
37.1 |
6.5% |
7.3% |
2.3x |
|
Bank of Baroda |
126.0 |
126.0 |
0.0% |
11.5% |
14.5% |
130.6 |
2.0% |
5.6% |
1.1x |
|
Stanbic Holdings |
91.0 |
90.0 |
(1.1%) |
11.1% |
13.9% |
92.6 |
2.5% |
5.4% |
0.9x |
|
National Bank |
5.2 |
5.0 |
(3.8%) |
(46.5%) |
(48.5%) |
4.9 |
0.0% |
(2.0%) |
0.4x |
|
Stanbic IBTC Holdings |
45.1 |
45.0 |
(0.2%) |
8.4% |
1.6% |
37.0 |
1.3% |
(16.5%) |
2.3x |
|
FBN Holdings |
9.1 |
9.1 |
0.0% |
3.4% |
51.4% |
6.6 |
2.7% |
(24.4%) |
0.5x |
|
Standard Chartered |
26.1 |
26.0 |
(0.4%) |
3.0% |
55.7% |
19.5 |
0.0% |
(25.2%) |
3.3x |
|
Ecobank Transnational |
17.5 |
17.0 |
(2.9%) |
0.0% |
(2.9%) |
9.3 |
0.0% |
(45.4%) |
0.6x |
|
*Target Price as per Cytonn Analyst estimates **Upside / (Downside) is adjusted for Dividend Yield ***Banks in which Cytonn and/or its affiliates holds a stake. For full disclosure, Cytonn and/or its affiliates holds a significant stake in NIC Bank, ranking as the 5th largest shareholder **** Stock prices are in respective country currency |
|||||||||
We are “NEUTRAL” on equities since the markets are currently trading below historical P/E averages. However, pockets of value continue to exist, with a number of undervalued sectors like Financial Services, which provide an attractive entry point for medium and long-term investors, and with expectations of higher corporate earnings this year, we are “POSITIVE” for investors with a long-term investment horizon.
Data released from the Retirement Benefits Authority (RBA) shows that investments in alternative assets by pension schemes in Kenya gained traction, with the inclusion of Private Equity & Venture Capital and REITs as separate classes in the regulations with Private Equity constituting 0.04% of the Kshs 1.2 tn total assets under management. Over one year to June 2018, pension funds increased their investments in Private Equity by 68.0% to Kshs 0.4 bn in June 2017 from Kshs 0.3 bn in June 2016. Over the six months to June 2018, pension funds’ investment in Private Equity grew by 31.3% to Kshs 0.4 bn in June 2018 from Kshs 0.3 bn in December 2017, with the number of pensions, which have invested in PE firms growing to thirteen from two in 2015. This highlights the growing appetite for investments in the Private Equity sector as investors seek higher returns.
Notwithstanding the above increase, Private Equity investment is still dwarfed by investment in traditional asset classes such as Government Securities, Quoted Equities, Immovable Property and Guaranteed Funds. Investments in Government Securities had the highest allocation at 36.3% followed by Quoted Equities at 20.7%, Real Estate (Immovable Property) at 19.7%, REITS at 0.09%, with Private Equity at 0.04% against an allowable allocation of 90.0%, 70.0%, 30.0%, 30.0% and 10.0%, respectively. This was primarily due to the lower risk associated with these investments. However, we expect that Private Equity investments by pension funds will keep growing as pension funds seek the higher returns it offers.
The table below shows the overall industry investment portfolio:
|
|
Jun-16 |
Dec-16 |
Jun-17 |
Dec-17 |
Jun-18 |
Allowable % |
|||||
|
Asset Category (Kshs bn) |
Kshs |
% |
Kshs |
% |
Kshs |
% |
Kshs |
% |
Kshs |
% |
% |
|
Government Securities |
211.85 |
25.47% |
349.15 |
38.26% |
353.47 |
36.70% |
394.19 |
36.50% |
423.70 |
36.32% |
90.00% |
|
Quoted Equities |
129.68 |
15.59% |
159.07 |
17.43% |
180.35 |
18.73% |
210.17 |
19.46% |
241.46 |
20.70% |
70.00% |
|
Immovable Property (Real Estate) |
126.52 |
15.21% |
178.42 |
19.55% |
204.6 |
21.24% |
226.72 |
20.99% |
229.32 |
19.66% |
30.00% |
|
Guaranteed Funds |
101.89 |
12.25% |
129.58 |
14.20% |
103.67 |
10.76% |
142.97 |
13.24% |
159.63 |
13.68% |
100.00% |
|
Listed Corporate Bonds |
39.42 |
4.74% |
46.95 |
5.14% |
46.83 |
4.86% |
41.99 |
3.89% |
41.51 |
3.56% |
20.00% |
|
Fixed Deposits |
28.31 |
3.40% |
24.57 |
2.69% |
45.49 |
4.72% |
32.88 |
3.04% |
31.62 |
2.71% |
30.00% |
|
Offshore |
5.27 |
0.63% |
6.96 |
0.76% |
9.68 |
1.01% |
12.77 |
1.18% |
15.03 |
1.29% |
15.00% |
|
Cash |
8.71 |
1.05% |
12.93 |
1.42% |
13.91 |
1.44% |
12.95 |
1.20% |
18.99 |
1.63% |
5.00% |
|
Unquoted Equities |
62.57 |
7.52% |
3.95 |
0.43% |
3.91 |
0.41% |
4.06 |
0.38% |
3.780 |
0.32% |
5.00% |
|
Private Equity |
0.00 |
0.00% |
0.22 |
0.02% |
0.25 |
0.03% |
0.32 |
0.03% |
0.42 |
0.04% |
10.00% |
|
REITS |
0.00 |
0.00% |
0.84 |
0.09% |
0.89 |
0.09% |
1.03 |
0.10% |
1.01 |
0.09% |
30.00% |
|
Others e.g. Unlisted Commercial Papers |
117.56 |
14.13% |
0.00 |
0.00% |
0.00 |
0.00% |
0.06 |
0.01% |
0.22 |
0.02% |
10.00% |
|
Total |
831.78 |
100.00% |
912.64 |
100.00% |
963.05 |
100.00% |
1,080.11 |
100.00% |
1166.69 |
100.00% |
|
Source: RBA
In terms of total assets in the industry, these increased by 8.0% from Kshs 1.1 tn in December 2017 to Kshs 1.2 tn in June 2018. Despite this performance, Private Equity funds still control a paltry 0.04%, of the Kshs 1.2 tn against an accepted investment limit of up to 10.0%. This can be attributed largely to; (i) little awareness among pension schemes trustees, which can be countered by creation of awareness by Fund Managers, and (ii) risk averseness among the pension scheme trustees and failure to think innovatively makes it very difficult for the trustees to see the opportunity in the Private Equity. In an effort to diversify their investment portfolios and increase returns, we expect pension funds to show stronger interest in Private Equity as an asset class, which is not correlated with other traditional investments and which offer higher returns compared to other traditional investments. According to a survey done by KPMG/ EAVCA, average returns for Private Equity was 19%, which is above the returns from traditional investments like Government Securities and Equities.
Cytonn Investments has entered into a transaction with its leading institutional partner, Taaleri of Finland, whereby Taaleri has acquired the option to subscribe for up to 20.0% of Cytonn. Taaleri is a financial group, whose parent company Taaleri Oyj's shares are listed on the NASDAQ stock exchange. Taaleri manages investments worth Kshs 813.0 bn and provides funding in the capital-intensive real estate sector in Africa.
This will be the fifth time the Finnish firm will be investing with Cytonn, having already committed over Kshs 5.0 bn towards projects and investments with Cytonn, namely The Alma, The Ridge, Situ Village and Amara Ridge, which has already been delivered to homeowners. In addition to their investments, Taaleri has already successfully received back its investments from Amara Ridge and The Alma, underlining Cytonn’s commitment to deliver above-average returns in real estate for global institutional investors. For more information, see our Cytonn Press Release.
Private equity investments in Africa remains robust as evidenced by the increasing investor interest, which is attributed to; (i) rapid urbanization, a resilient and adapting middle class and increased consumerism, (ii) the attractive valuations in Sub Saharan Africa’s private markets compared to its public markets, (iii) the attractive valuations in Sub Saharan Africa’s markets compared to global markets, and (iv) better economic projections in Sub Sahara Africa compared to global markets. We remain bullish on PE as an asset class in Sub-Sahara Africa. Going forward, the increasing investor interest and stable macro-economic environment will continue to boost deal flow into African markets.
- Industry Reports
During the week, Hass Consult released their Land Price Index Q3'2018 Report, highlighting that land prices in Nairobi suburbs recorded a slight growth of 0.2%, compared to 0.4% in Q3’2017 and an increase of 0.2% in Q2’2018. The slow growth is attributable to; (i) a wait and see attitude by property buyers, as they await to see the direction of the affordable housing policy, that is likely to result in inclined focus to certain areas for development, and (ii) uncertainty of land ownership papers and regulatory permits during the sale of property, given that recently, there has been an increase in cases of the government disregarding ownership documents and building permits that had been previously issued to developers, which has resulted in the demolition of developments.
Other key takes-outs from the report were;
- Land in satellite towns recorded a quarterly capital appreciation of 0.6%, compared to 0.5% in Q2’2018, attributable to continued demand for land in the areas given their relatively affordable prices. According to Cytonn Research, the average price of land in satellite towns as at Q3’2018 stood at Kshs 21.0 mn per acre compared to the average price in suburbs that stood at Kshs 92.0 mn per acre,
- Among the Nairobi suburbs, Ridgeways recorded the highest quarterly increase of 2.9% to an average of Kshs 74.7 mn per acre from an average of Kshs 72.6 mn per acre in Q2’2018. We attribute this to high demand driven by its proximity to commercial nodes such as Nairobi CBD and Gigiri where several expatriates and diplomats work, a good transport network enabling ease of access to major roads such as the Thika Superhighway, the Northern Bypass and estates such as Runda and Muthaiga, and availability of social amenities such as schools, hospitals and malls including the Ciata City Mall and Ridgeways Mall, and,
- Among the Nairobi satellite towns, Mlolongo area recorded the highest quarterly increase in land price of 4.0% during Q3’2018 to Kshs 25.3 mn per acre from Kshs 24.3 mn per acre in Q2’2018. This is attributed to the increased preference for development, driven by the ease of accessibility into the area through Mombasa Road and the growing demand for property in the area by middle-income households.
We anticipate continued price growth especially in satellite towns such as Mavoko, Thika and Ruiru, driven by the expected rolling out of affordable housing projects and the continued infrastructural development that continues to open up areas for development. In Nairobi suburbs, we recommend a quick resolution or review of documentation system and issuing of building permits, to mitigate against the demolition of buildings, which has negatively affected investors.
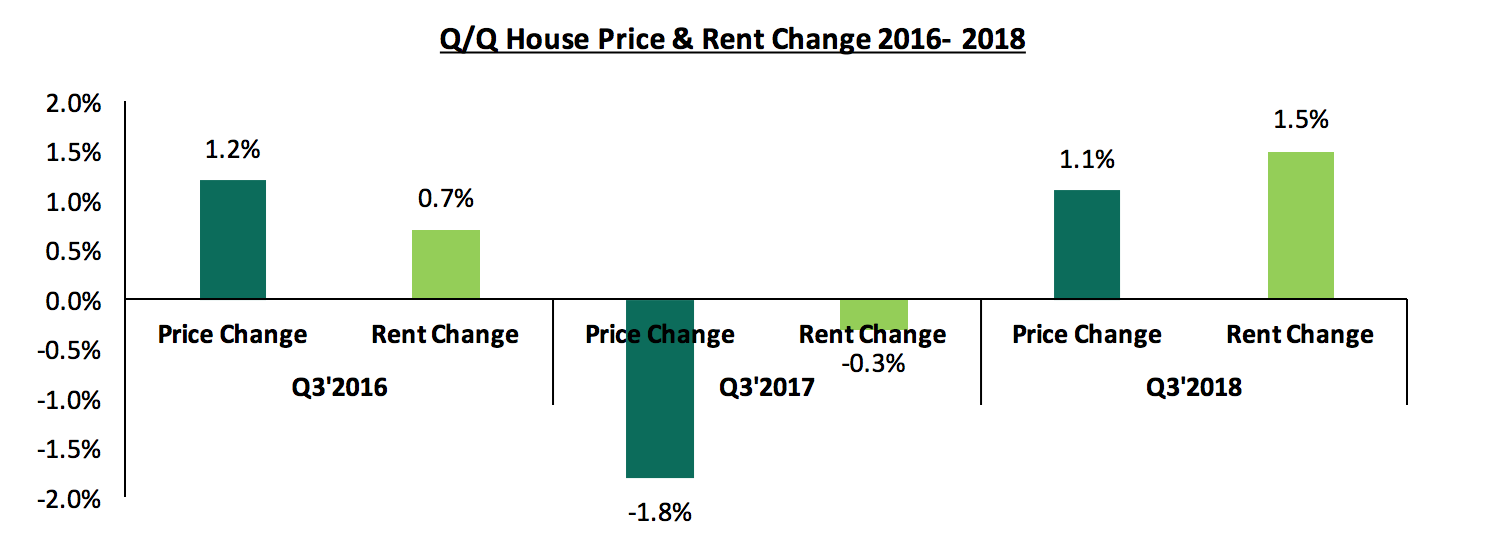
Hass Consult also released their House Price Index Q3'2018 with the following key take-outs;
- Asking house prices in Nairobi increased slightly by 1.1% q/q, compared to a 1.8% decline in Q3’2017, attributable to the growing investor confidence following the conclusion of the elections held last year, despite the constrained access to funds. The 1.1% growth is, however, slower than the 3.6% recorded in Q2’2018 on account of the increase in cases of the government disregarding ownership documents and building permits that had been previously issued to developers, which has resulted in the demolition of developments,
- Asking rents in Q3’2018 recorded a 1.5% increase compared to a 0.3% decline in Q2’2018 attributable to the continued demand for rental properties as people cannot afford properties on sales due to low income and difficult access to credit,
- In terms of typologies, in the sales market, detached units recorded the highest change in asking price with a 1.3% growth, while apartments and semi-detached recorded a 0.8% and 0.5% increase in asking prices, respectively. This better performance of the detached is attributed to their preference by families and as they offer privacy and exclusivity in comparison to apartments, and,
- In the rental market, apartments recorded the highest rental price increase at 3.5%, while detached and semi-detached units recorded 1.1% and 0.8% respectively, driven by the high demand for rental apartments, which are more affordable for majority of the population, compared to the detached and semi-detached units.
Source: Hass Consult Research
The above report is in tandem with Cytonn Q3'2018 Market Review, which stated that the housing sector in Nairobi recorded a slow price growth of 0.9% q/q in Q3’2018, attributable to the persistent low levels of credit to the private sector following the retention of the interest rates cap law. For Q4’2018, we expect the residential sector to continue recording activity in relation to affordable housing. However, the market performance and uptake is likely to remain subdued due to factors such as increased supply in the high-end and upper middle-income market and the barriers to home purchasing such as the decline in private sector credit growth.
- Residential Sector
During the week, The Principal Secretary, State Department for Housing and Urban Development, Mr. Charles Hinga, announced that the government would be using blockchain technology to allocate the low cost housing units that will be developed under the National Housing Development Fund (NHDF), in a bid to enhance transparency and efficiency in the allocation of these housing units. Under the scheme;
- Potential homeowners will be expected to contribute approximately 1.5% of their salary, or an amount not exceeding Kshs 5,000 every month, and their employer will match the amount towards the fund, as payment for the units. See Cytonn Weekly #25/2018 or more details on the fund, and,
- The government funded housing units will then be allocated to the beneficiaries on completion using the blockchain technology which involves the use of a shared digitalized ledger that allows one to keep track of transactions, which on entry cannot be modified. In addition, blockchain is an open-source ledger, where each and every transaction will be made public thus reducing the chances of fraud.
We expect that the move by the government to adopt the technology will enhance transparency and make the housing transactions impenetrable to fraud and thus ensure rightful owners live in the government funded housing units. However, given that blockchain is a tech-intensive system, it is likely to be a challenge for potential homeowners who are not tech savvy and thus we recommend sensitization and training of the public to enhance awareness and generate buy-in.
- Infrastructure
In Nakuru, plans to rehabilitate and upgrade roads have begun with an aim of improving the state of infrastructure in the town. The road modernization project, which is funded by the Kenya Urban Roads Authority (KURA), will cost Kshs 1.9 bn, will cover approximately 22 KM, and serve areas such as Menengai, Milimani, Nakuru Prisons and London Estates. According to Cytonn Nakuru Real Estate Investment Opportunity Report 2018, Nakuru town recorded an average rental yield of 6.1%, a capital appreciation of 8.8%, and thus a total return of 14.9% as of February 2018. The main factors driving the sector are; (i) devolution, which has opened up the town, attracting entrepreneurs, private investors and government institutions, (ii) positive demographics with a high population growth rate of on average 3.1% per annum, compared to a Kenyan average of 2.6%, and (iii) increased focus on infrastructural development. We expect that the improved infrastructure will enhance the performance of the real estate sector in Nakuru area, through the opening up of areas for development, improving the ease of doing business and thus attracting investors into the area. In addition, with infrastructure being a key enabler for development, we expect that above project will also drive the government’s affordable housing agenda, which aims at developing approximately 500,000 housing units by 2022 in key towns in Kenya such as Nakuru.
Other highlights during the week;
- Troubled retailer chain, Uchumi Supermarket was evicted from its Nairobi Industrial Area headquarters for failure to pay its rent arrears. The local retailer current has six operational branches; (i) Langata Hypermat, along Langata Road Nairobi, (ii) Ngong Hypermat, along Ngong Road Nairobi, (iii) Adams Arcade Branch, (iv) Jogoo Road Branch, (v) Nairobi West Branch, and (vi) Meru Branch. Uchumi has been struggling with heavy debts and cash flows, which has resulted in delayed payment to its staff, suppliers and landlords, and thus, the closing down of some of its branches,
- According to the Ministry of Tourism, Cabinet Secretary Najib Balala, starting next week, there shall be two direct charter flights from Brussels in Belgium and Amsterdam in Holland to the Moi International Airport in Mombasa. The flights aim to enhance the growth of international tourist arrivals into the Kenyan Coast, and thus drive the tourism and hospitality sector. This follows the recent announcement by Qatar Airways, that they will be introducing direct flights to Mombasa from Doha, Qatar, starting 9th December, 2018, in a bid to increase their foothold in Kenya. The number of international arrivals increased by 0.9% to 443,950 by June 2018 compared to 439,807 during the same period in 2017, and we expect the continued airline operations to enhance growth of the same going forward.
- Listed Real Estate Sector
- Fahari I-REIT
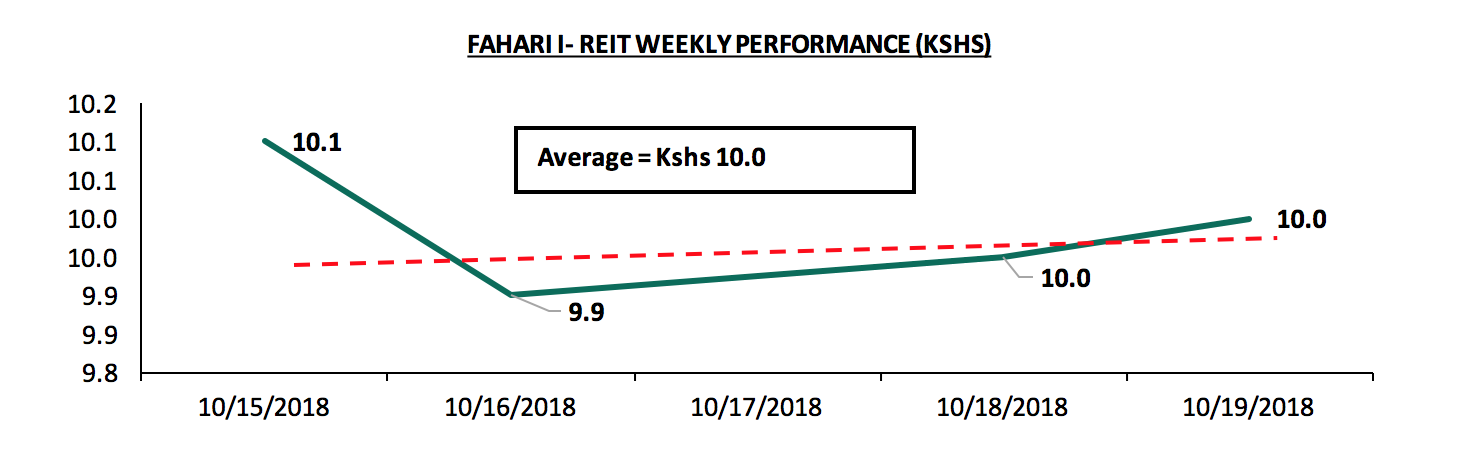
During the week, the share prices for the Fahari I-REIT remained relatively stable, with the instrument closing the week at Kshs 10.0, similar to the closing price of Kshs 10.0 the previous week. Additionally, during the week, it recorded an average price of Kshs 10.0 per share, 1.0% increase from last weeks’ average of Kshs 9.9. The instrument continues to trade at low prices and in low volumes largely due to; (i) the negative sentiments currently engulfing the sector given the poor performance of the Fusion D-REIT (FRED), which failed to raise the minimum capital required to list on the NSE, (ii) inadequate investor knowledge, and (iii) the poor performance of Fahari I-REIT recording a dividend yield of 5.7% compared to brick and mortar office and retail at 9.3% and 9.7%, respectively.
- Nigeria I- REIT
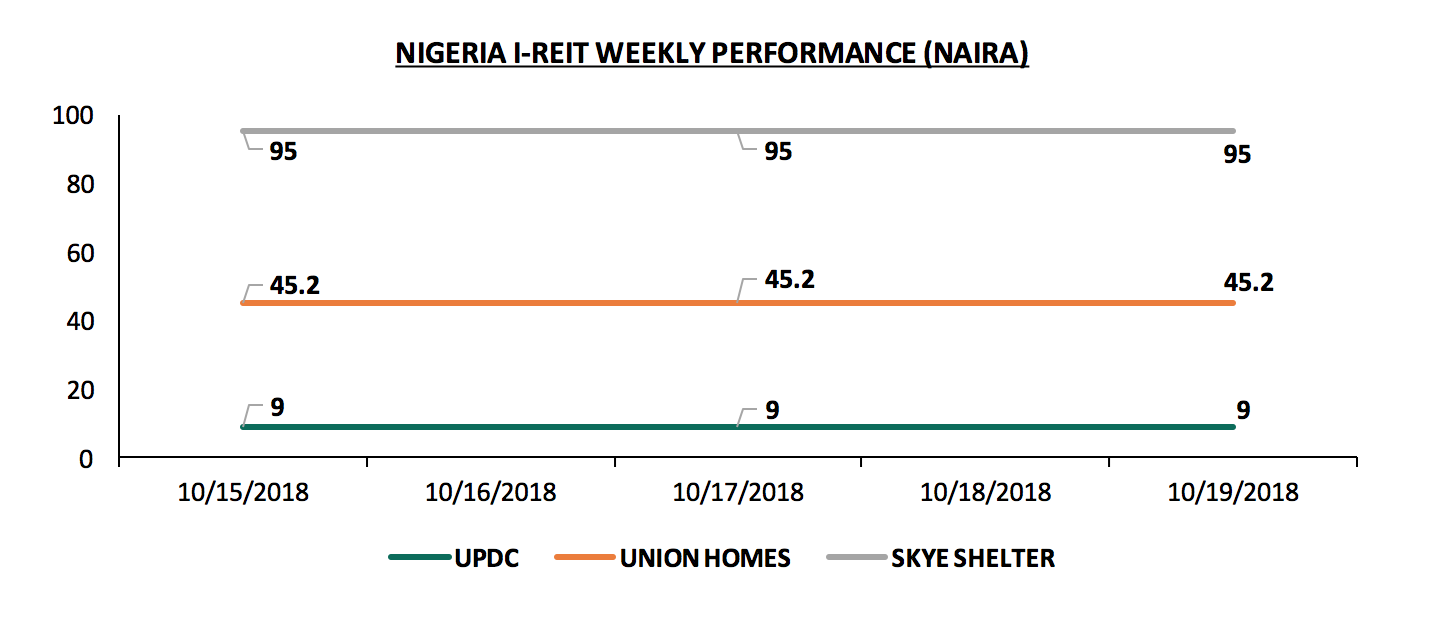
The Nigerian I-REIT market remained unchanged during the week, with, Skye Shelter, Union Homes and UPDC, retaining a price per share of N95, N45.2, and N9, respectively. We attribute the plateaued performance to inadequate investor knowledge about the market hence low investor interest in the instrument.
- Fahari I-REIT
We expect continued increase in activities in the real estate sector, supported by; (i) improved infrastructural developments, which will open up areas for development, and (ii) increased flights frequency, which is expected to result in increased demand for accommodation and other hospitality services, and thus improved performance of the hospitality sector.
The Nairobi Securities Exchange (NSE) has struggled to attract new listings, having only raised Kshs 4.2 bn in two initial public offers (IPO’s) in the last 5-years, with one each in 2014 and 2015 by NSE and Stanlib Investments, respectively. Currently the bourse has 64 listed stocks with a total market capitalization of Kshs 2.16 tn, of which Safaricom controls 44.0% market share. The Capital Markets Authority (CMA) has raised concerns that Kenya has been unable to achieve its projected listings targets as articulated in its Capital Markets Master Plan, which envisions at least four listings on the NSE every year. CMA has also noted that a few large cap stocks, namely Safaricom PLC, East African Breweries Ltd, Equity group Holdings and KCB Group Ltd, hold almost 75.0% of the total market capitalization, making the market volatile, due to the dependence on these few stocks, which presents a risk of a market collapse should anything happen to those companies. To remedy the listing drought, the CMA has been engaging stakeholders, who include the National Treasury, NSE, Central Depository and Settlement Corporation (CDSC), and Fund Managers Association (FMA), among others, to come up with value propositions for listing in the bourse as well as come up with propositions to reduce the tight regulations of entry into the bourse. From the engagements, NSE disclosed their strategy, which seeks to introduce an incubator board designed to accelerate the growth and success of entrepreneurial companies, through an array of business support resources and services to nurture firms that are not ready to list but have promising prospects. This is geared towards helping in developing a pipeline of successful businesses for possible listing on the exchange. In this week’s focus note, we take a view on the reasons behind the low number of new listings, as well as recommendations on what should be done to end NSE’s IPO drought. To cover this topic, we shall address the following:
- The structure, types of listing, and requirements for listing in the different segments in the NSE,
- Reasons behind the low number of new listings in the Nairobi Securities Exchange,
- A case study of Egypt, and some of the key takeout’s that can be implemented in Kenya, and,
- Recommendations to unlock new IPO’s in the Kenyan Capital Market.
Section I: The structure, types of listing, and requirements for listing in the different segments in the NSE:
The NSE market has grown since its registration in 1954 under the Societies Act (1954) as a voluntary association of stockbrokers and charged with the responsibility of developing the securities market and regulating trading activities, with the most recent developments being:
- The introduction of the Growth Enterprise Market Segment (GEMS) in 2013, with the intention of providing more options for SMEs finance, especially long-term funding, by use of favourable listing requirements tailored for SME’s. Currently the segment has five listed stocks, with four having listed by introduction, and one through cross listing,
- The introduction of NEXT, which is the Nairobi Securities Exchange (NSE) derivatives market aimed at facilitating trading of equity index futures and single stock futures in the Kenyan market. The financial derivatives market is expected to go live in 2019, after conclusion of the 2-phase test trade from July to November 2018, aimed at testing market system set-up, trade execution, reporting and settlement as well as risk management controls. The 1st phase carried between 3rd July and 3rd August 2018, saw participating investment banks and stockbrokers trade in three-month contracts using virtual cash of up to Kshs 1.0 mn. The 2nd phase started in September, involving trading using real money,
- Approval of the Policy Guidance Note for the listing and trading of global depositary receipts and notes in July 2017, allowing Kenyan firms to sell shares in other countries without cross-listing as well as International companies to sell shares in Kenya without listing on the NSE,
- Launch of the Barclays NewGold ETF, the largest Gold exchange-traded fund (ETF) in Africa and the 7th largest in the world, which was listed on 27th March 2017, valued at approximately USD 1.4 bn. The listing made 400,000 units, valued at nearly Kshs 500 mn, available for trading in the NSE with the opportunity for growth depending on demand, and,
- The change of name to the Nairobi Securities Exchange in July 2011 Limited reflecting the strategic plan of the NSE to evolve into a full service securities exchange which supports trading, clearing and settlement of equities, debt, derivatives and other associated instruments. In the same year, the equity settlement cycle moved from the previous T+4-settlement cycle to the T+3-settlement cycle.
In 2001, the NSE was split into three market segments according to type of investment and type of asset class, and in 2013, a fourth segment, the Growth Enterprises Market Segment (GEMS), was introduced to give SMEs an opportunity to access the capital markets and grow their businesses. The four segments are discussed below:
- Main Investment Market Segment (MIMS): This is the main segment of the NSE where most companies are listed, currently having 48 listed stocks with a total market capitalization of Kshs 2.15 tn, as at 19th October 2018, equivalent to 99.5% of the total NSE market capitalization. It is suitable for bigger companies that have been around for a longer period of time. For a company to be listed in this segment, it must submit at least 5-years of audited financials, 3 of which should be profitable years, and must have at least Kshs 50.0 mn worth of fully paid up share capital and at least, Kshs 100.0 mn in assets. Listing fees for this segment 0.06% of securities value to be listed, subject to a minimum of Kshs 200,000 and a maximum of Kshs 1.5 mn,
- Alternative Investment Market Segment (AIMS): This market segment is better suited for medium-sized companies that have at least Kshs 20.0 mn in assets and Kshs 20.0 mn of fully paid up share capital at the time of listing. The company must also have been in existence in the same line of business for a minimum of two-years and demonstrate good growth potential. The AIMS segment currently has 9 listed companies with a market cap of Kshs 8.1 bn as at 19th October 2018 equivalent to 0.4% of the total NSE market cap. Listing fees for this segment are 0.06% of securities value to be listed, subject to a minimum of Kshs 100,000 and a maximum of Kshs 1.0 mn,
- Fixed Income Securities Market Segment (FISMS): This segment was designed to incorporate listing and secondary market trading of fixed income securities, mainly corporate and government bonds, and,
- Growth Enterprises Market Segment (GEMS): GEMS was introduced to provide a regulated platform whereby SMEs could gain access to cheaper capital market funds and benefit from the regulatory environment that comes with it, promoting corporate governance and transparency. Its requirements were made less stringent to accommodate the smaller growth companies, with requirements such as: (i) no minimum firm asset value and profitability record required, (ii) submission of audited accounts for just the year that precedes the year of listing, with no profitability requirement, and (iii) a minimum of Kshs 10.0 mn in paid up share capital. The GEMS segment currently has 5 listed stocks, with a total market capitalization of Kshs 1.0 bn as at 19th October, 2018 equivalent to 0.1% of the total NSE market capitalization, including Atlas which was suspended in May 2017.
Companies can get listed on the various segments of the market through the following ways:
- Initial Public Offer (IPO): This is the most common type of listing. It involves a company issuing new shares while listing on the selected stock exchange that will result in a new set of shareholders from the public buying the shares at a specified share price, and hence the company raising capital from the exercise,
- Listing by Introduction: This type of listing occurs when a company takes its existing shares and lists them on an exchange. Since only existing shares are listed by introduction, it follows that no new shares will be issued and no additional funds will be raised. This type of listing only provides the company with a regulated environment within which to operate and a platform to trade shares with the public investors in the capital markets,
- Cross Listing: This occurs when a company that is already listed on one stock exchange decides to list on another stock exchange other than its primary or original exchange. Cross listing is advantageous in that it gives the listed company a larger scope of access to capital from different jurisdictions and different investors. No new shares are issued. Atlas managed the first cross listing between the London Stock Exchange and the NSE raising Kshs 450.0 mn, by offering 10% of its 393.9 mn total issued shares for cross-listing on the NSE with price per share set at Kshs 11.5 with a minimum subscription of Kshs 1.0 mn per investor, and,
- Reverse Listing: This is a rare kind of listing strategy also referred to as back door listing where a company that is not listed on any exchange purchases a listed company and becomes automatically listed by virtue of this transaction. It is common when a company that wants to have access to the capital markets also wants to avoid the time and cost spent in a regular listing. The listing of I&M bank for instance, was through reverse acquisition of City Trust Limited (CTL) in 2013.
As mentioned earlier, the NSE is categorized into different market segments approved by CMA. The segments as stipulated have different eligibility, trading restrictions and disclosure requirements, prescribed by CMA that companies planning to publicly offer shares through listing have to abide to. Below is a summary of those requirements:
|
Table showing the Requirements for public offering of shares and listing |
||||||
|
Requirement |
Criteria for the Main Investment Market Segment(MIMS) |
Criteria for The Alternative Investment Market Segment (AIMS) |
Criteria for the Growth Enterprise Market Segment(GEMS) |
|||
|
Incorporation status
|
It should be a public company limited by shares and registered under the Companies Act |
|||||
|
Share Capital |
The issuer should have a minimum of Kshs 50.0 mn of authorized issued and fully paid up ordinary share capital |
The issuer should have a minimum of Kshs 20.0 mn of authorized issued and fully paid up ordinary share capital |
The issuer should have a minimum authorized and fully paid up ordinary share capital of Kshs 10.0 mn and must have not less than 100,000 shares in issue |
|||
|
Net Assets
|
Net assets immediately before the public offering or listing of shares should not be less than Kshs 100.0 mn. |
Net assets immediately before the public offering or listing of shares should not be less than Kshs 20.0 mn |
N/A |
|||
|
Free Transferability of Shares
|
Shares to be listed should be freely transferable and not subject to any restrictions on marketability or any pre-emptive rights.
|
|||||
|
Availability and Reliability of Financial records
|
|
NA |
||||
|
Solvency and adequacy of working capital |
working capital |
|
||||
|
Share Ownership Structure |
|
|
|
|||
|
Track record, profitability and future prospects |
The issuer must have declared profits after tax attributable to shareholders in at least three of the last five completed accounting periods to the date of the offer |
The issuer must have been in existence in the same line of business for a minimum of two years one of which should reflect a profit with good growth Potential. |
N/A |
|||
|
Dividend policy |
The issuer must have a clear future dividend policy. |
N/A
|
||||
|
Source: NSE |
||||||
Section II: Reasons behind the low number of new listings in the Nairobi Securities Exchange
According to PWC’s, 2017 Africa Capital Markets watch, Africa has recorded 134 IPO’s between 2013 and 2017. In 2017, the continent recorded 28 IPO’s raising a total of USD 2.9 bn, up from 24 IPO’s recorded in 2016 raising a total of USD 1.6 bn. Out of the 134 IPO’s recorded in the last 5-years in Africa, Kenya only managed to attract 2 IPOS, through the NSE IPO in 2014, which raised Kshs 627.0 mn by selling 66 mn new shares at a price of Kshs 9.5 per share, and the Income-Real Estate Investment Trust (Reit) IPO in 2015 by Stanlib Investments that grossed Kshs 3.6 bn. IPO activity in the African region has mainly been dominated by the South African Capital Market, having raised USD 4.8 bn in the past 5 years through 44 IPO’s representing 52.0% of the total capital raised through IPO’s in the region. The Egypt and Tunisia bourses have also been performing well having had 13 and 23 IPO’s, raising USD 1.3 bn and USD 391.0 mn USD, respectively.
|
Top 5 Countries With the Highest Number of IPOs (2013-2017) |
||
|
Country |
Number of IPO's |
Capital raised (USD mn) |
|
South Africa |
44 |
4,774 |
|
Tunisia |
23 |
391 |
|
Egypt |
13 |
1,254 |
|
BRVM* |
8 |
301 |
|
Tanzania |
8 |
243 |
|
*BRVM- regional stock exchange serving the following West African countries: Benin Burkina Faso Guinea Bissau Côte d'Ivoire Mali Niger Senegal Togo Source: PWC 2017 Africa Capital Markets watch |
||
To address the issue of low number of listings as well as slow uptake of the capital markets products in Kenya, CMA has been embarking on offering incentives to attract companies with the potential to list to the bourse, which include:
- A lower corporate tax of 27.0% for 3-years, set to commence immediately after company’s financial year following the date of listing for a newly listed Company approved under the Capital Markets Act with at least 20.0% of its issued share capital listed. Under the Income Tax Bill, 2018 there was a proposal to amend this and raise the rate to 30.0% for 3 years,
- A lower corporate tax of 25.0% for a period of 5-years, set to commence immediately after the company’s financial year following the date of listing for a newly listed company on any securities exchange approved under the Capital Markets Act with at least 30.0% of its issued share capital listed. Under the Income Tax bill, 2018 there was a proposal to amend this and raise the rate to 30.0% for 5-years,
- A lower corporate tax of 20.0%, for a period of 5-years commencing immediately after the year of income following the date of listing of a company which has at least 40.0% of its issued share capital listed. Under the Income Tax bill, 2018 there was a proposal to amend this and raise the rate to 25.0% for 5-years,
- There were amendments made to reduce listing fees by 50.0% i.e. from the initial 0.3% to 0.2% for offers of equity,
- All the expenditure of a capital nature incurred in the financial year when the listing took place, by a person on legal costs and other incidental expenses relating to the authorization and issue of shares, debentures or similar securities offered for purchase by the public were made tax deductible expenses,
- Cost of credit rating was also made tax deductible to encourage credit rating by companies, and,
- A tax amnesty on past omitted income for companies that apply and are listed, provided they make a full disclosure and undertake to pay all their future due taxes.
The incentives have however, not boosted the number of listings. We believe this is because the measures undertaken to address the low number of listings have not taken a bottoms-up approach to identify the real impediment to listings, focusing mainly on tax exemptions whilst there are a number of deep underlying issues that still need to be remedied, in order to make the country’s capital market robust. Some of the key issues that we believe should be addressed in order to unlock capital in the capital markets include:
- Stringent regulatory framework and disclosure requirements: The regulatory framework in Kenya’s capital market has partially been a major impeding factor to the uptake of capital markets products as well as the number of listings in the bourse. Requirements such as the debt ratios, minimum number of shareholders and capital requirements, costs associated with compliance with regulatory as well as corporate governance framework requirements have been a limiting factor for companies to list. Most non-listed companies shy away from listing as compliance to some of these requirements amounts to loss of privacy exposing the company to the public domain, which they perceive as a loss of competitive advantage. There also is a concern in the efficiency of the processes in the capital market due to the stringent regulations and approvals that normally take too long, making listing as well as de listing on the NSE a challenging, long and tedious process. For instance, the de listing of Hutchings Biemer and A. Baumann was effected 16-years and 9-years later after the two companies were suspended from trading, respectively,
- Harmonizing tax incentives between Bank Funding and Capital Market Funding: Currently, other non-bank funding entities and capital markets products such as unit trust funds and private investment do not enjoy similar tax incentives available to banks e.g. the 15% final withholding tax that bank depositors enjoy. These entities are however, essential to the economy in mobilizing savings, which improves efficiency, liquidity and volume of investments in the capital markets and in effect, enhance economic growth and development. The government needs to harmonize tax incentives so that other non-bank funding entities and capital markets products become more attractive to investors,
- Costs associated with listing: Issuing of shares in the stock exchange usually involves some direct costs perceived to be high especially for smaller firms because the companies have to pay annual listing fees. Kenya’s economy has dominance of small and medium sized enterprises, which are mainly reliant on bank loans. According to a study by the CMA, the percentage cost of floating securities in the capitals market is relatively lower than bank lending rates. According to the study, IPO costs have ranged from 1.9% to 10.6% from 2012-2016, compared to bank lending rates ranging at 13.0%-16.0%, with the highest being the floatation of Eveready at 10.6% and the lowest being Deacons in 2016 at 1.9%. CMA also noted that compared to bank loans, which are annual costs over the tenure of the relevant loans, the cost of floatation is a one-off cost. Despite raising capital through the capital markets being cheaper than loans, lack of awareness by companies with the capacity to list has been established as one of the major issue in emerging markets, as companies do not fully understand the benefits accrued to them from floating their shares,
- Size of companies: As stated earlier, Kenya’s economy has a dominance of small and medium scale enterprises mainly reliant on bank loans and other informal sources of financing. Quoting Chemmanur (2005), “only large old public firms with adequate cash flows and private limited firms that have accumulated a track record of successful performance find it optimal to go public by issuing IPO”. This has made small companies shy away from listing for fear of having failed IPO’s. IPOs are described as great indicators that a firm has matured. With this in mind, the low number of listings in our country maybe an indication of a deeper underlying issue, that start-up companies in the country are not growing big enough thus the reason the informal sector still dominates the economy,
- Market infrastructure: The evolution of infrastructure in a capitals market is an essential factor as it influences demand and supply of capital bringing investors and companies together as well as allow adequate dissemination of information. The NSE has seen an improvement in its market infrastructure over the years. In November 2004, the automated central clearing settlement and depository system (CDS) was commissioned. This essentially facilitated the electronic trading of shares. In September 2006, there was the introduction of live trading through the automated trading systems (ATS) which matching of bids and asks orders automatically as well as execution of the orders on a first come first served basis by the stockbrokers. The bourse has continued to be more diverse, with the latest development in the offing being the licensing to set up a derivatives exchange, which has seen the NSE continue to work with stakeholders to ensure the institutions and infrastructure necessary are in place. However, to attract more capital including foreign investors, there is need to implement liquidity-enhancing mechanisms, such as securities lending and short selling, derivatives like commodity contracts, stock and currency futures. The implementation of these however is reliant on proper infrastructure and platforms for execution. On this front, the Nairobi Securities Exchange has been testing its derivatives trading platform, which is set to go live next year,
- Loss of control: Many firms especially family owned or closely held companies are reluctant to list due to fears of dilution of ownership and lose of voting control. The companies tend to rely on bank finance as well as a proven network of family and friends to raise additional capital when required. Companies also avoid listing due to constant pressure to increase earnings that come with it as public shareholders unlike the original owners, usually take a short-term view mainly interested in seeing constant rises in the stock's price so they can sell their shares for a profit and less emphasis on the values and core ideologies of the company. To remedy this, we believe that the NSE and the government, through amendments to the Company Act, should come up with alternative policies to address the concerns of loss control by major investors’ e.g. allow companies to have a shareholders structure that ensures the initial owners do not lose control. As in the case of Facebook, which has a dual class stock structure consisting of Class A and Class B shares. Facebook’s founder Mark Zuckerberg and a small group of insiders have about 18.0% of the shares. Despite this, Zuckerberg and the small group of insiders owns the majority voting rights. This is because, as per their shareholding structure, they hold a class of shares of the company, which carry 10 votes per share as compared to what is held by the public shareholders, that carry only one vote per share,
- Shallow market: A shallow market is one with few instruments and relatively low liquidity, leaving firms with minimal financing options. The strength of securities markets that make them essential in an economy, is the ability to mobilize long term savings for financing long term ventures, to improve efficiency of resource allocation through competitive pricing mechanisms, to provide capital, and encourage broader ownership of firms. A robust stock market assists in the rational and efficient allocation of capital. The NSE is characterized by intermittent trading of relatively few stocks, often held by a relatively small group of investors making it inefficient. The NSE also lags behind in the number of listed stocks as compared to countries such as South Africa with a total of 165 listed companies. To enhance the level of activity, improve liquidity and attract more capital in the bourse, foreign ownership limits were lifted effective July 2015 allowing foreigners to hold over 75.0% of the listed companies in the NSE. Despite this, the market still lags behind being heavily reliant on a few stocks thus limiting liquidity in the market and in effect discouraging listing as companies with the potential to list shy away for fear of having failed IPOs,
- The rise of Private Equity firms providing easily accessible capital: Kenya’s private equity space has been vibrant. Raising capital through private equity firms has been on the rise, filling much of the void left by the drought in IPOs. The attractiveness of private equity funding as opposed to public listing is mainly because, private equity funding gives companies the opportunity to continue financing their growth while remaining privately held which, allows companies to preserve decision-making control which is usually lost when companies list, and,
- False Market Perception that Capital Markets Should Play a Second Fiddle to Banking Industry: In developed economies, capital markets funding is larger than bank funding, at 60% compared to banks, which only provide 40% of the funding in the market. Whereas in Kenya it is the opposite with the capital markets providing 5% of the funding in the market and banks providing 95%. Beyond the numbers, there is somehow acceptance that banks control the economic agenda, rather than them being equal to capital markets. For example, we had a case of an innovative product, Cash Management Solutions, CMS, which was phased out of the market, just because banks did not like it. In more developed markets, the capital markets industry and the regulator would have pushed back on the banking industry. Capital markets ought to view itself as just as important as the banking industry.
Section III: Case Study of the Egyptian Exchange
The Egyptian Exchange (EGX) has established itself as one of the most active markets in Africa as evidenced by the rise in the number of new listings. It comprises of two exchanges, Cairo and Alexandria that share a trading, settling and clearing system as well as governed by the same board of directors. Between 2011 and 2013, the bourse did not record a single IPO; partly attributed to the Egypt 2011 uprising that negatively affected the conditions for listings, which also saw the temporary closure of the exchange. In February 2014, new listing and disclosure requirements took effect in the bourse, becoming one of the most significant regulatory changes carried out by the EGX authority in recent years. The rules introduced incentivized IPO’s by providing better regulatory clarity, addressing issues such as minimum number of shareholders, percentage free float requirement and minimum number of shares to be listed. The new listing rules also reduced the listing documents by around 50.0%. To make the process of listing simpler, the authority also agreed to accept listing companies on conditional basis, with the agreement that the companies were to provide the less essential documents at a future date for them to remain listed. Further amendments and additions have been integrated in the listing rules over the years to ensure a wider application of corporate governance, more investors' protection and making disclosure requirements friendlier.
EGX also embarked on conducting meetings with promising companies to enhance awareness of the benefits of getting listed as well as organizing the 1st EGX IPO summit in 2014 that attracted more than 300 firms, to give companies better insight into listing and its benefits to the growth of businesses. The implementation of these changes saw the spate in growth in IPO activity. It saw Egypt emerge as one of the principal generator of public offerings in 2015 in the Middle East and North Africa (MENA) region, raising a total of USD 752.0 mn, from four IPO’s. Since then, the activity in the bourse has been stable recording four IPO’s annually since 2015 according to data from PWC’s African capital markets report. Foreign participation was also on the rise recording an average of 56.0% since 2014, indicating improved investor sentiments since the uprising in 2011, which led to investors exiting the market.
The improved investor sentiments have also reflected in the oversubscriptions of the IPO’s, which were as high as 31-times in some of the IPO’s. The exchange has continued to embark on efforts to boost transparency, which saw the introduction of the Electronic Disclosure System in 2015 that enables companies to send their disclosures to the authority electronically. The amendments in the listing rules have mainly focused on raising the degree of corporate governance and investor protection, among them, which include introduction of a requirement that, managers, directors and founders of companies seeking to list should not have previous court judgments issued against them. In order to deepen the market, increase liquidity and draw local and foreign investors, Beltone Financial Holding was issued with Egypt’s first license in March 2014, to operate an exchange-traded fund (ETF), which is a marketable security that tracks an index giving investors exposure to a range of various stocks. This granted investors the opportunity to start trading from January 2015 when it became operational. The ETF tracks Egypt’s main index EGX30 and on its commencement day, it led to a 2.5% rise in the index a clear indication of its positive effects to the market. The authority has continued reinforcing the bourse performance through:
- Continuous development of the legislation and regulatory framework to ensure investor protection,
- The introduction of new technologies with the latest being the introduction of EGYCOMEX, which will be the first electronic Commodities Exchange in the MENA region
- Continued investment in human infrastructure, and enhanced corporate governance.
The government of Egypt has also been on the forefront in the efforts to boost the number of IPO’s in the country. In March 2018, the government announced the names of 23 state companies in different sectors ranging from banking and petroleum to real estate that it planned to sell stakes through minority share offerings on the Cairo bourse in a bid to raise USD 4.6 bn.
From the above, it is clear that there are concerted efforts towards making the Egypt’s capital market robust, which believe can also be adopted in Kenyan to remedy the drought in the number of IPO’s over the years. In summary, Egypt has mainly focused on the following:
- Finding the balance by making the rules and regulations friendly while still maintaining investor protection and not sacrificing minimum requirements for disclosure,
- Remedying the issues of shallow markets through the introduction of liquidity-enhancing mechanisms such as the introduction of the exchange-traded fund (ETF) which tracks the EGX 30 index,
- Addressing the issue of tedious listing processes through implementation of various reforms,
- Efforts by the Government to encourage the number of listings through privatization of some of the state corporations,
- Active campaigns to sensitize companies with a potential top list through the IPO forums as well as promoting the bourse to foreign markets which has even seen the EGX authorities even organizing an Egyptian Capital Markets Day in the USA, and,
- To support growing medium and small enterprises, the Egyptian Exchange (EGX) also initiated a secondary market, NILEX in 2010. The NILEX has lighter disclosure requirements in terms of the quarterly and semi-annually financials compared to the main board, which is the EGX, as they are not required to be submitted to the regulator for approval. Listing in the NILEX is also easier and cheaper as the companies are only required to provide one year’s financial statements.
Section IV: Recommendations to remedy the low number of listings:
From the issues identified, we are of the view that the following should be done to facilitate growth in the number of new listings as well as development of products in the NSE:
- Embarking on privatization of some of the state corporations through listing: Over the years, the NSE has played an increasingly important role in the Kenyan economy, especially in the privatization of state-owned enterprises. The privatization process started in 1988 when the government floated 7.5 mn shares equivalent to 20.0% equity of the Kenya Commercial Bank (KCB) that was over- subscribed by 2.3-times. Since then the government has had subsequent issues, which have also been popular, recording subscription rates of as high as 400%. A study by CMA shows that successful IPOs by State Owned Enterprises, in Kenya have generated significant interest in the market, attracting a good number of private companies to list immediately after. KCB’s 327% over-subscription in 1988 immediately attracted the listing of Total Oil Company, Standard Chartered Bank and Nation Printers. The 303.0% oversubscription of Housing Finance Corporation of Kenya in 1992 also attracted new companies like Crown Berger, East African oxygen (BOC), NIC, Firestone, Rea Vipingo and East African Portland Cement to the stock market. We are of the view that the government should embark on privatization of some of the state corporations through listing in a bid to bolster investment in order to revive the economy. Privatization would also lead to additional revenue, which would also effectively reduce the fiscal deficit as well as reduce a portion of the recurrent expenditure in running them. This strategy has been replicated in various economies such as Brazil, which earmarked 57 companies in 2017 to be privatized as well as Egypt, which named 23 companies in March 2018 that the government is planning to privatize through listing. Privatization also has a positive impact on the financial performance of poorly managed state companies are usually insulated from the same discipline requirements as private companies.
- Harmonizing tax incentives: We are of the view that tax incentives available to banks should also be made available to non-bank funding entities and capital markets products such as unit trust funds and private investment funds. For example, providing alternative and capital markets funding organizations with the same withholding tax incentives that banking deposits enjoy, of a 15% final withholding tax so that investors don’t feel that they have to go to a bank to enjoy the 15% tax, which is final; alternatively, normalize the tax on interest for all players at 30% to level the playing field,
- Review of rules and regulations: In order to remedy this, the CMA should continuously review, identify and amend restrictive provisions in the capital markets and related Laws that are unattractive to capital raising and listing to ensure the rules in place facilitate rather than deter active participation in the markets. This include rules such as the restrictive regulation inhibiting participation of investors. For example, the minimum amount an investor can put in a DREIT at Kshs 5.0 mn,
- Engaging with private equity firms to consider exiting through the capital markets: The size of the private equity market space in Africa and more so in Kenya, largely involved in financing businesses showing great potential in the market has grown significantly in the recent past. The Capital market Authority ought to engage with private equity firms to consider exit mechanisms through the capital markets to take advantage of the vibrancy in the PE space to compliment the capital markets activities. For this to happen however, the issue of the shallow market in the NSE needs to be addressed in order to make exiting through IPO’s feasible.
- Awareness programs aimed at enhancing literacy on capital markets: One of the major impediments to the number of listings as well as uptake in the products listed in the NSE remains to be the level of awareness and knowledge by the companies with listing potential as well as the local investors who are important in driving IPOs. In order to rectify this, the CMA as well as other market stakeholders should embark on a comprehensive awareness programme targeted at enhancing literacy on the capital markets and the various opportunity accrued to its participants.
In conclusion, regulators should focus on making the process of listing appealing to companies while still maintaining investor protection and not sacrificing minimum requirements for disclosure. They should also sensitize companies on the importance of listing to companies as well as focus on liquidity-enhancing mechanisms, such as securities lending and short selling, derivatives like commodity contracts, stock and currency futures to deepen the capital markets and provide a range of options to investors. The government should also stimulate the Capital markets through the privatization of state- owned enterprises through the NSE.
Disclaimer: The views expressed in this publication are those of the writers where particulars are not warranted. This publication, which is in compliance with Section 2 of the Capital Markets Authority Act Cap 485A, is meant for general information only and is not a warranty, representation, advice or solicitation of any nature. Readers are advised in all circumstances to seek the advice of a registered investment advisor.

- Talk to us
- Kenya
- P.O Box 20695 - 00200, Nairobi, Kenya
- Cell +254709101200
- Tel +254709101200
- WhatsApp +254741676635
- United States
- +254709101200
- DOWNLOAD OUR APP
-


- Kenya
- 8th Floor, Pinetree Plaza, Kaburu Drive, Ngong Road, Nairobi, Kenya
- USA
- Suite 1150, 1775 Eye Street NW, USA, Washington DC 20006, USA
- Investments
- High Yield
- Private Equity
- Real Estate
- Real Estate
- RiverRun Estates
- Cytonn Towers
- The Ridge
- Taraji Heights
- The Alma