Business Restructuring Options, & Cytonn Weekly #35/2020
By Cytonn Research, Aug 30, 2020
Executive Summary
Fixed Income
During the week, T-bills remained undersubscribed, with the subscription rate coming in at 52.3%, up from 40.4% the previous week. The highest subscription rate was on the 91-day paper, which came in 113.3%, up from 65.5% recorded the previous week. The yields on the 91-day, 182-day and 364-day papers remained unchanged at 6.3%, 6.6% and 7.5%, respectively; the undersubscription was because of investors’ preference to participate in the primary bond market where an 11-year amortized bond was issued during the month and had a subscription rate of 145.0%,
Equities
During the week, the equities market was on an upward trajectory, with NSE 25, NASI and NSE 20 recording gains of 5.8%, 5.3%, and 4.0% respectively, taking their YTD performance to losses of 16.6%, 22.3%, and 32.4%, for NASI, NSE 25 and NSE 20. The performance was driven by gains recorded by large-cap stocks, with the highest gains being recorded in NCBA, Equity Group, Co-operative Bank and KCB Group, which gained by 16.1%, 10.6%, 9.5% and 8.2%, respectively. Banks will now have to get approval from the Central Bank of Kenya (CBK), before declaring dividends for the current financial year, in a bid to ensure that the banks have enough capital that will enable them to respond appropriately to the COVID-19 pandemic. Co-operative Bank of Kenya completed the 90.0% acquisition of Jamii Bora Bank and rebranded it to Kingdom Bank Limited. During the week, Standard Chartered Bank Kenya, I&M Holdings Plc, HF Group, ABSA Bank Kenya, Diamond Trust Bank Kenya and NCBA Group released their H1’2020 financial results;
Real Estate
During the week, Centum Investments, through its real estate arm announced the launch of a Kshs 7.0 bn new 268-unit affordable housing developments within Kasarani dubbed “265 Elmer One Apartment”. Radheshyam Transport, a local go-down and general construction company announced plans to develop a Kshs 1.0 bn project in Donholm comprising of 424 residential units, with 256 stand-alone maisonette and 168 apartments. Additionally, in the residential sector, Kenya Commercial Bank (KCB), announced that mortgages topped their list of restructured loans accounting for 22.5% of the total Kshs 101.0 bn loans restructured between mid-march and June. In the retail sector, Tuskys supermarket Eldoret branch was shut down by Chargless Auctioneers Limited over rent areas totaling to Kshs 14.0 mn. Despite the above, the retailer confirmed the signing of terms of agreement with an undisclosed Mauritius-based private equity fund during the week, for the provision of a financing facility amounting to approximately Kshs 2.0 bn.
Focus of the Week
Covid-19 has brought challenges to certain businesses as evidenced by recent headlines of auctioneers closing businesses. Consequently, this week we discuss how businesses are affected by insolvency, business preparedness to handle restructuring, and the various aspects involved. We believe the ultimate goal should be to guarantee the success of a restructured business to avoid an outcome such as what happened to Nakumatt;
- Weekly Rates:
- Cytonn Money Market Fund closed the week at a yield of 10.55%. To invest, just dial *809#;
- Cytonn High Yield Fund closed the week at a yield of 12.77% p.a. To invest, email us at sales@cytonn.com and to withdraw the interest you just dial *809#
- Cytonn Apartments Ruaka, “The Alma” has seen significant demand and we shall be raising the prices in the coming week, all those with ongoing discussions are encouraged to book their units before prices go up
- For an exclusive tour of Cytonn’s real estate developments, visit: Sharp Investor's Tour and for more information, email us at sales@cytonn.com;
- We continue to offer Wealth Management Training daily, from 9:00 am to 11:00 am, through our Cytonn Foundation. The training aims to grow financial literacy among the general public. To register for any of our Wealth Management Training, click here;
- For Pension Scheme Trustees and members, we shall be having different industry players talk about matters affecting Pension Schemes and the pensions industry at large. Join us every Wednesday from 9:00 am to 11:00 am for in-depth discussions on matters pension;
- Cytonn continues to inform the market on the importance of retirement planning and issues affecting the pensions industry. In this week's article, we focus on how to take care of your medical expenses once you retire here
- If interested in our Private Wealth Management Training for your employees or investment group, please get in touch with us through wmt@cytonn.com;
- For recent news about the company, see our news section here;
- We have 10 investment-ready projects, offering attractive development and buyer targeted returns. See further details here: Summary of Investment-ready Projects.
Money Markets, T-Bills & T-Bonds Primary Auction:
During the week, T-bills remained undersubscribed, with the subscription rate coming in at 52.3%, up from 40.4% the previous despite high liquidity in the money market. The markets remained liquid supported by government payments with the average interbank rate ending the week at 3.0%, lower than the 2019 average rate of 4.3%. The highest subscription rate was on the 91-day paper, which came in 113.3%, up from 65.5% recorded the previous week. The subscription for the 182-day paper also increased to 61.0% from 8.8% recorded the previous week, while that of the 364-day paper decreased to 19.3% from 61.8% recorded the previous week. The acceptance rate reduced to 85.4% from 100.0% the previous week, while the yields on the 91-day, 182-day and 364-day papers remained unchanged at 6.3%, 6.6% and 7.5%, respectively.
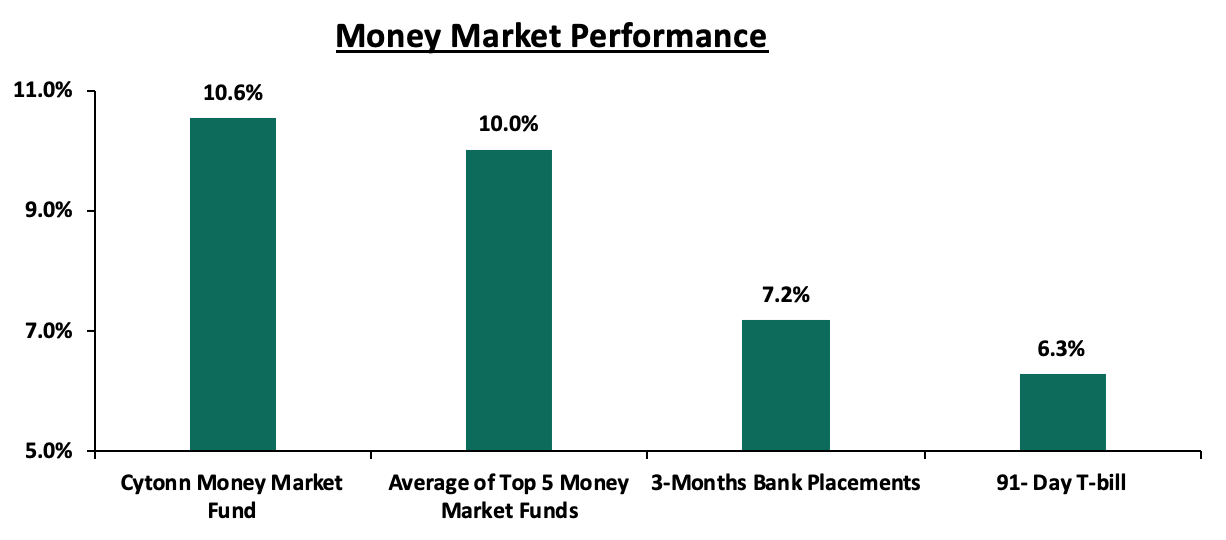
In the money markets, 3-month bank placements ended the week at 7.2% (based on what we have been offered by various banks), while the yield on the 91-day T-bill remained unchanged at 6.3%. The average yield of Top 5 Money Market Funds declined marginally to 10.0% from 10.1% previously. The yield on the Cytonn Money Market also declined marginally to close at 10.6%, from 10.7% recorded the previous week.
Liquidity:
The money markets remained liquid during the week, despite the average interbank rate increasing to 3.0%, from 2.6% recorded the previous week, mainly supported by government payments and maturing TADS of Kshs 81.1 bn. (TADs are used when the securities held by the CBK for Repo purposes are exhausted or when CBK considers it desirable to offer longer tenor options). The average interbank volumes increased by 23.0% to Kshs 16.9 bn, from Kshs 13.8 bn recorded the previous week. The commercial banks’ excess reserves came in at Kshs 28.7 bn.
Kenya Eurobonds:
According to Reuters, the yield on the 10-year Eurobond issued in June 2014 declined marginally to close the week at 6.0%, down from the 6.1% recorded last week.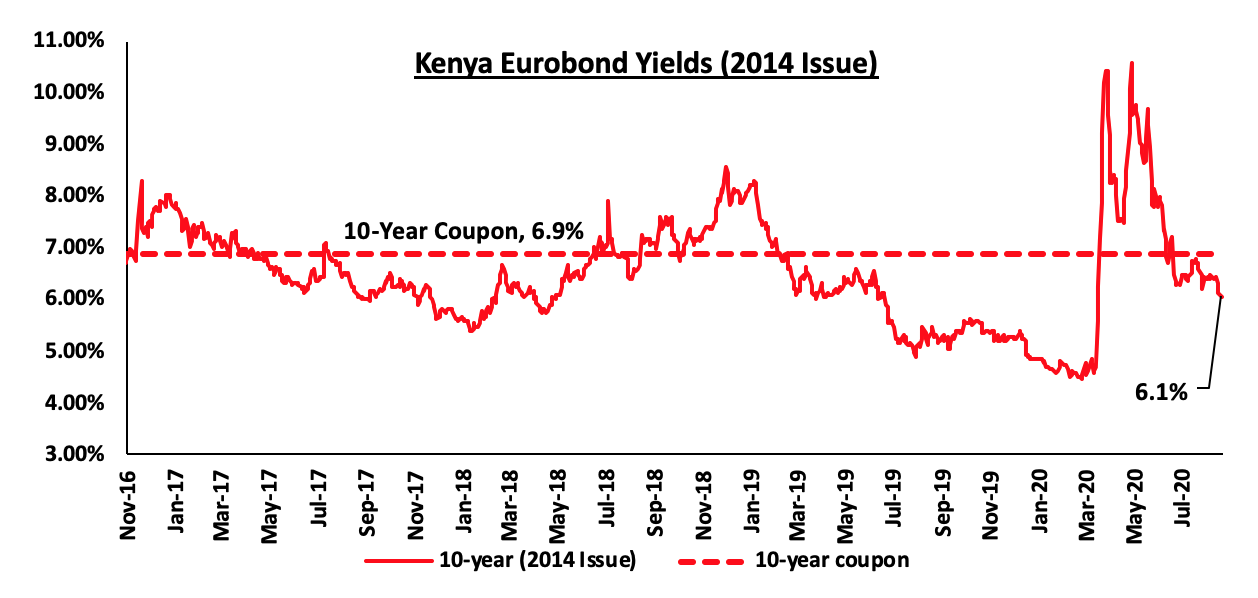
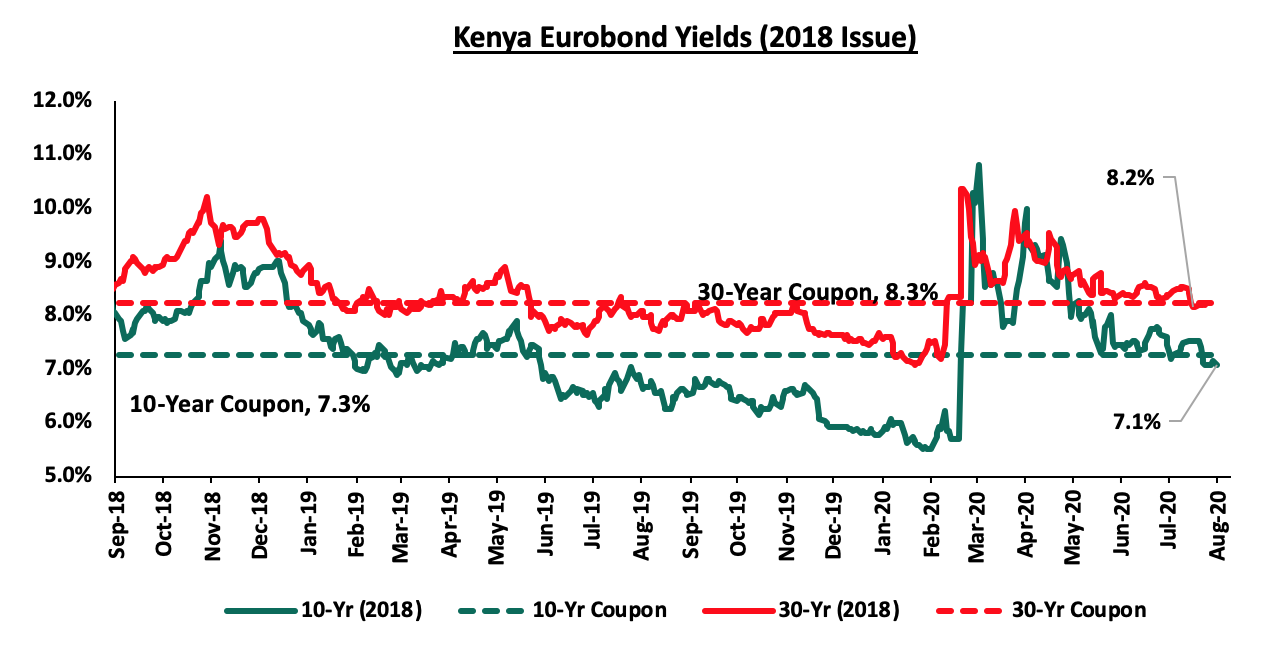
The yields on the 10-year and 30-year Eurobonds issued in 2018 both remained unchanged at 7.1% and 8.2%, respectively.
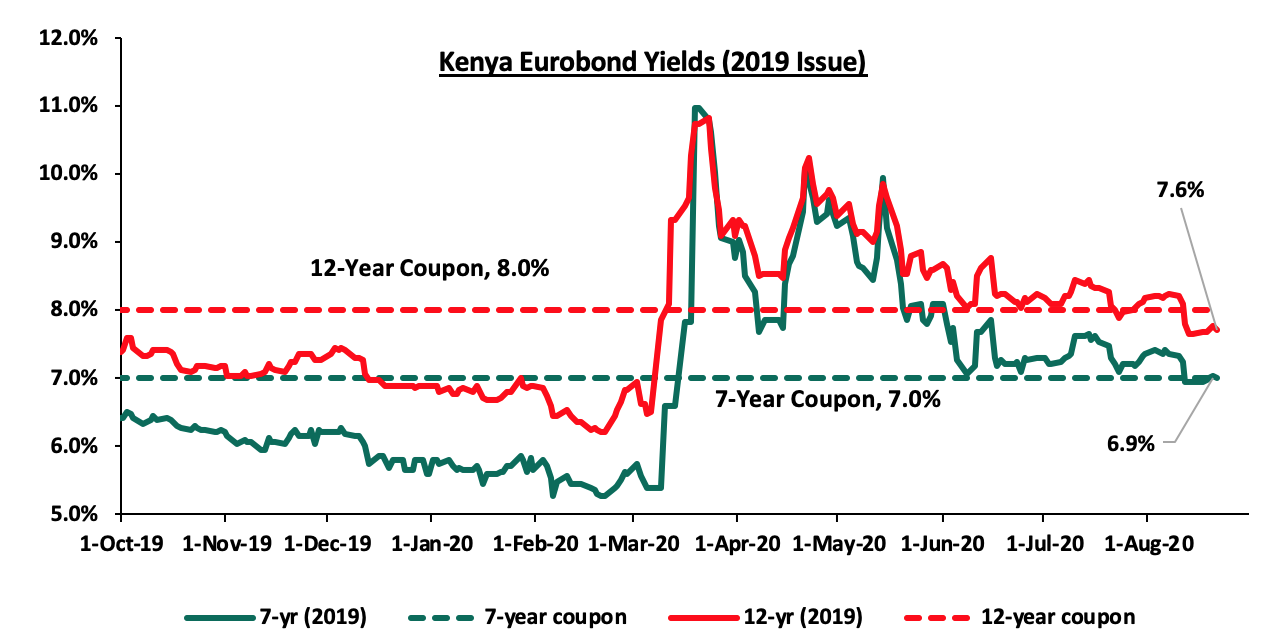
The yield on the 7-year and 12-year Eurobond declined marginally by 0.1% points to 6.9% and 7.6%, respectively, from the 7.0% and 7.7% recorded last week.
Kenya Shilling:
During the week, the Kenya Shilling depreciated by 0.2% against the US Dollar to close the week at Kshs 108.2, from Kshs 108.0, recorded the previous week, due to end-month importer dollar demand amidst lacklustre inflows. On a YTD basis, the shilling has depreciated by 6.8% against the dollar, in comparison to the 0.5% appreciation in 2019. We expect continued pressure on the shilling due to:
- Demand from merchandise and energy sector importers as they beef up their hard currency positions,
- A deteriorating current account position, with the current account deficit deteriorating by 10.2% during Q1’2020, to Kshs 110.9 bn, from Kshs 100.6 bn recorded in Q1’2019 attributable to;
- 30% decline in the secondary income balance (transfers recorded in the balance of payments whenever an economy provides or receives goods, services, income or financial items), to Kshs 124.1 bn, from Kshs 128.0 bn in Q1’2019, and,
- A 67.0% decline in the services trade balance (the difference between the imports and exports of services) to Kshs 20.4 bn, from Kshs 61.9 bn.
The shilling is however expected to be supported by:
- The high levels of forex reserves, currently at USD 8.9 mn (equivalent to 5.4-months of import cover), above the statutory requirement of maintaining at least 4.0-months of import cover, and the EAC region’s convergence criteria of 4.5-months of import cover
- Relatively strong Diaspora remittances that Increased to USD 277.0 million in July compared to USD 225 million in July 2019 though lower than the USD 288.5 million in June 2020,
Rates in the fixed income market have remained relatively stable due to the high liquidity in the money markets, coupled with the discipline by the Central Bank as they reject expensive bids. The government is 89.9% ahead of its prorated borrowing target of Kshs 93.5 bn having borrowed Kshs 177.5 bn. In our view, the government will not be able to meet their revenue collection targets of Kshs 1.9 tn for FY’2020/2021 because of the current subdued economic performance in the country brought about by the spread of COVID-19, and therefore leading to a larger budget deficit than the projected 7.5% of GDP, ultimately creating uncertainty in the interest rate environment as additional borrowing from the domestic market will be required to plug in the deficit. Owing to this uncertain environment, our view is that investors should be biased towards short-term to medium-term fixed income securities to reduce duration risk.
Market Performance
During the week, the equities market was on an upward trajectory, with NSE 25, NASI and NSE 20 recording gains of 5.8%, 5.3%, and 4.0% respectively, taking their YTD performance to losses of 16.6%, 22.3%, and 32.4%, for NASI, NSE 25 and NSE 20, respectively. The performance was driven by gains recorded by large-cap stocks, with the highest gains being recorded in NCBA, Equity Group, Co-operative Bank and KCB Group, which gained by 16.1%, 10.6%, 9.5% and 8.2%, respectively.
Equities turnover increased by 38.9% during the week to USD 25.2 mn, from USD 18.1 mn recorded the previous week, taking the YTD turnover to USD 1.0 bn. Foreign investors turned net buyers during the week, with a net buying position of USD 2.6 mn, from a net selling position of USD 0.9 mn recorded the previous week, taking the YTD net selling position to USD 266.3 mn.
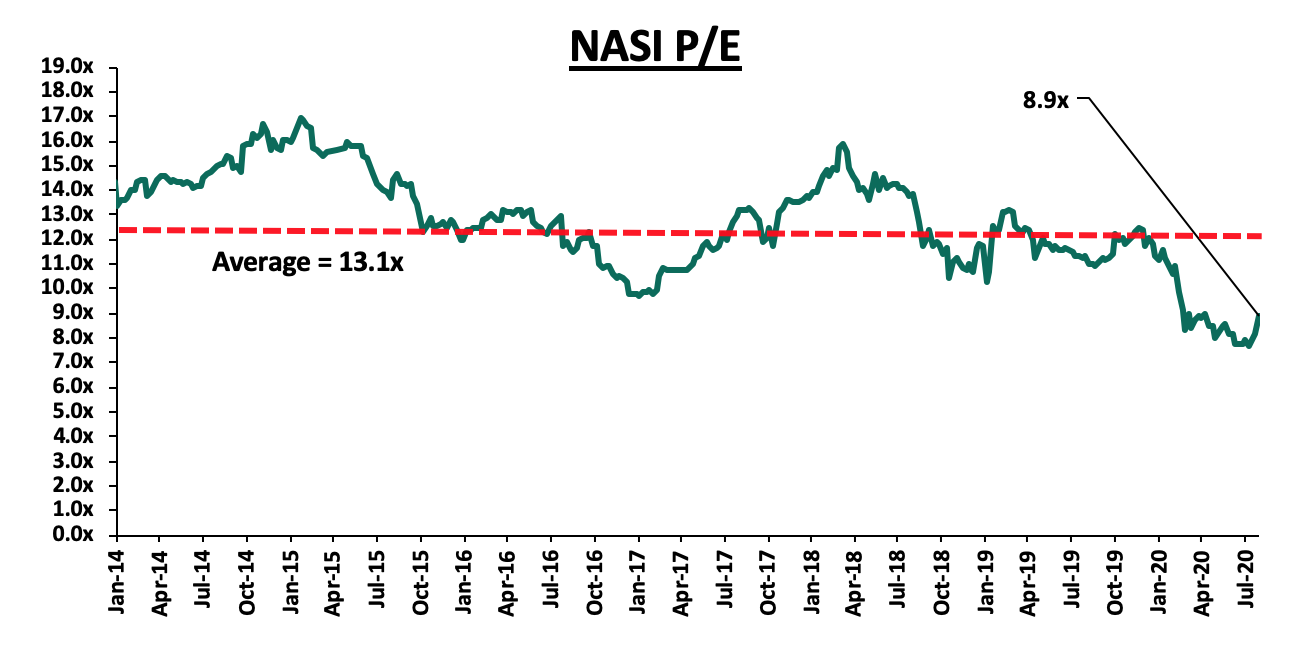
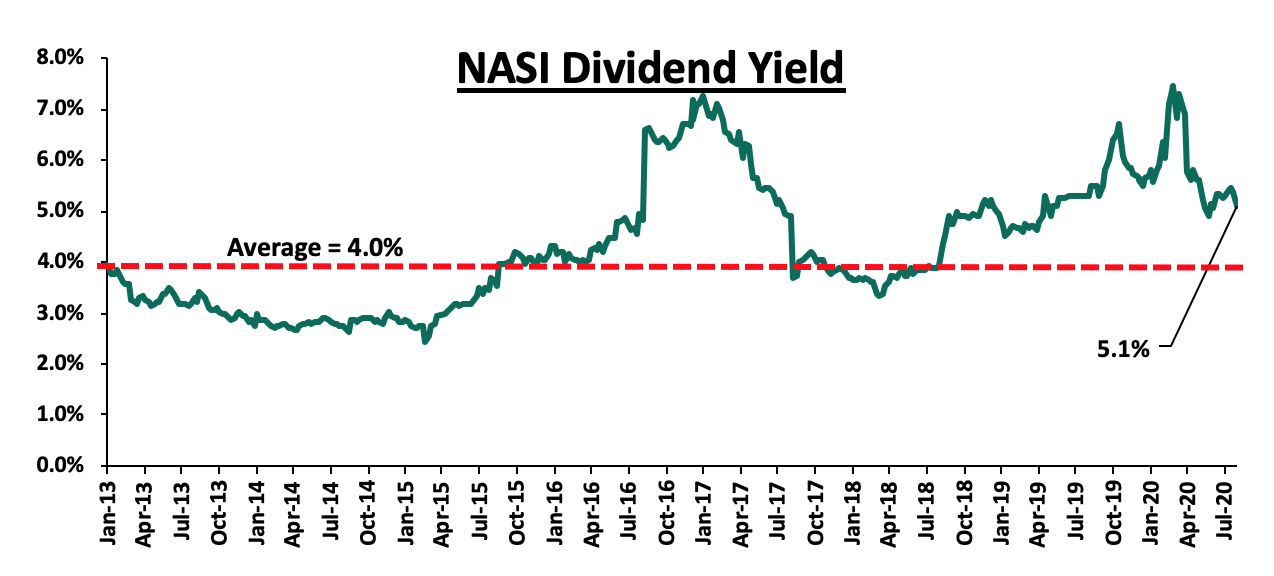
The market is currently trading at a price to earnings ratio (P/E) of 8.9x, 37.1% below the 11-year historical average of 13.0x. The average dividend yield is currently at 5.1%, 0.3% points below the 5.4% recorded the previous week and 1.1% points above the historical average of 4.0%. The decline in dividend yield is attributable to price gains recorded by most stocks. With the market trading at valuations below the historical average, we believe there are pockets of value in the market for investors with higher risk tolerance and are willing to wait out the pandemic. The current P/E valuation of 8.9x is 15.6% above the most recent valuation trough of 7.7x experienced in the first week of August 2020. The charts below indicate the historical P/E and dividend yields of the market.
Weekly Highlight
During the week, the Central Bank of Kenya (CBK), directed that Banks will have to get approval before declaring dividends for the current financial year, in a bid to ensure that the banks have enough capital that will enable them to respond appropriately to the COVID-19 pandemic. The CBK has given guidance to lenders asking them to revise their ICAAP (Internal Capital Adequacy Assessment Process) based on the pandemic. Key to note, ICAAP is a process through which banks assess whether their capital levels are adequate and consistent with their business plans, strategies, risk profiles and prevailing operating environment. ICAAP was introduced by the CBK in August 2016 allowing banks to determine the level of capital needed to support the nature and scope of the risks they would be undertaking. Banks have up-to 30th October 2020 to submit their revised capital levels based on the adjustments. Subject to the submission of the revised Internal Capital Adequacy Assessment Process, (ICAAP), CBK will determine if it will endorse the board’s decision to pay out dividends. The move is in line with what has been implemented in other jurisdictions such as the United States, where the Federal Reserve announced on 25th June 2020 that it would cap dividend payments and prevent share repurchases up to the end of 2020 since banks suffered capital losses due to the economic slump brought about by the pandemic. The Federal Reserve capped the dividend payout indicating that banks payout ratio in Q3’2020 should not exceed Q2’2020 payout ratio. Additionally, their dividend payment should not exceed the average Net Income over the last four quarters. Closer home, on 6th April 2020, the South African Reserve Bank’s Prudential Authority issued guidance to the South African banking sector advising banks not to pay out dividends this year and that the bonuses for senior executives should also be put on hold during this period as well. The authority highlighted that this directive would ensure banks conserve their capital and as such, enable the banks to fulfil their fundamental roles. In our view, the directive by the Central Banks is a precautionary stance, in a bid to ensure that the banking sector remains adequately capitalized, which will provide them with the requisite cover to partake in core banking activities, thereby catalyzing economic growth and development in the country. Furthermore, with an aggregate adequate capital cover, the banking sector will remain resilient to any internal or external systemic shocks that may affect the sector. On the downside, however, the move might result in capital flight from equity investors whose focus is on the dividend play.
During the week, Co-operative Bank Kenya completed the 90.0% acquisition of Jamii Bora Bank. As highlighted in our Cytonn Weekly #32/2020, the Central Bank of Kenya approved the acquisition of a 90.0% stake of Jamii Bora’s shareholding by Co-operative Bank, which was to be completed on 21st August 2020 after the deal received all regulatory approval following approval by the National Treasury on 4th August 2020. The acquisition of the bank was at a discount and was at a lower valuation from the previous discussions on a purchase of 100% stake. We covered the transaction valuation on our Cytonn Weekly #26/2020. Following the completion of the transaction, Jamii Bora Bank will now operate as Kingdom Bank Limited. We believe that continued bank consolidation efforts in Kenya, as highlighted in our Q1’2020 Banking Report, will lead to a stable banking sector, as consolidation continues to eliminate weaker banks. In our view, banks will continue to consolidate to form strategic partnerships and well-capitalized entities capable of navigating the relatively tough operating environment induced by stiff competition.
Below is a summary of the transaction multiples of the various bank transactions that have happened in the recent past.
|
Acquirer |
Bank Acquired |
Book Value at Acquisition (Kshs. Bns) |
Transaction Stake |
Transaction Value |
P/Bv Multiple |
Date |
|
Co-operative Bank |
Jamii Bora Bank |
3.4 |
90.0% |
1.0 |
0.3x |
Aug-20 |
|
Commercial International Bank |
Mayfair Bank Limited |
1.0 |
51.0% |
Undisclosed |
N/A |
May-20* |
|
Access Bank PLC (Nigeria) |
Transnational Bank PLC. |
1.9 |
100.0% |
1.4 |
N/A |
Feb-20* |
|
KCB Group |
National Bank of Kenya |
7.0 |
100.0% |
6.6 |
0.9x |
Sep-19 |
|
CBA Group |
NIC Group |
33.5 |
53%:47% |
23.0 |
0.7x |
Sep-19 |
|
Oiko Credit |
Credit Bank |
3.0 |
22.8% |
1.0 |
1.5x |
Aug-19 |
|
CBA Group** |
Jamii Bora Bank |
3.4 |
100.0% |
1.4 |
0.4x |
Jan-19 |
|
AfricInvest Azure |
Prime Bank |
21.2 |
24.2% |
5.1 |
1.0x |
Jan-19 |
|
KCB Group |
Imperial Bank |
Unknown |
Undisclosed |
Undisclosed |
N/A |
Dec-18 |
|
SBM Bank Kenya |
Chase Bank Ltd |
Unknown |
75.0% |
Undisclosed |
N/A |
Aug-18 |
|
DTBK |
Habib Bank Kenya |
2.4 |
100.0% |
1.8 |
0.8x |
Mar-17 |
|
SBM Holdings |
Fidelity Commercial Bank |
1.8 |
100.0% |
2.8 |
1.6x |
Nov-16 |
|
M Bank |
Oriental Commercial Bank |
1.8 |
51.0% |
1.3 |
1.4x |
Jun-16 |
|
I&M Holdings |
Giro Commercial Bank |
3.0 |
100.0% |
5.0 |
1.7x |
Jun-16 |
|
Mwalimu SACCO |
Equatorial Commercial Bank |
1.2 |
75.0% |
2.6 |
2.3x |
Mar-15 |
|
Centum |
K-Rep Bank |
2.1 |
66.0% |
2.5 |
1.8x |
Jul-14 |
|
GT Bank |
Fina Bank Group |
3.9 |
70.0% |
8.6 |
3.2x |
Nov-13 |
|
Average |
75.9% |
1.4x |
||||
|
* Announcement Date ** Deals that were dropped |
||||||
Following this acquisition, the number of banks remain at 38 since Kingdom Bank will continue to operate, compared to 43 banks from 5-years ago. The ratio of the number of banks per 10 million population in Kenya will remain at 8.0x, which is a reduction from 9.2x from 5 years ago, demonstrating continued consolidation of the banking sector. However, despite the ratio improving, Kenya still remains overbanked as the number of banks remains relatively high compared to the population.
The chart below highlights the ratio of the number of banks per 10.0 mn people in Kenya, South Africa and Nigeria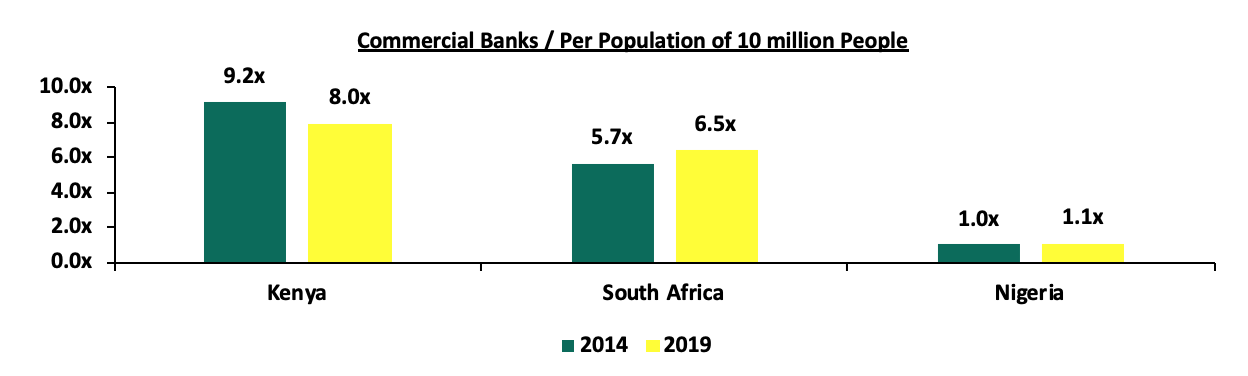
Earnings Releases:
During the week, Standard Chartered Bank Kenya, I&M Holdings Plc, HF Group, ABSA Bank Kenya, Diamond Trust Bank Kenya and NCBA Group released their H1’2020 financial results. Below is a summary of their performance:
- Standard Chartered Bank Kenya
|
Standard Chartered H1’2020 Key Highlights |
|||
|
Balance Sheet |
|||
|
Balance Sheet Items |
H1’2019 (Kshs bn) |
H1’2020 (Kshs bn) |
y/y change |
|
Government Securities |
102.6 |
104.7 |
2.1% |
|
Net Loans and Advances |
120.1 |
134.3 |
11.9% |
|
Total Assets |
294.5 |
327.2 |
11.1% |
|
Customer Deposits |
228.5 |
256.5 |
12.3% |
|
Deposits per Branch |
6.7 |
7.1 |
6.0% |
|
Total Liabilities |
247.7 |
275.5 |
11.2% |
|
Shareholders’ Funds |
46.9 |
51.7 |
10.3% |
|
Income Statement |
|||
|
Income Statement Items |
H1’2019 (Kshs bn) |
H1’2020 (Kshs bn) |
y/y change |
|
Net Interest Income |
9.8 |
9.4 |
(4.6%) |
|
Net non-Interest Income |
4.71 |
4.40 |
(6.6%) |
|
Total Operating income |
14.6 |
13.8 |
(5.2%) |
|
Loan Loss provision |
0.4 |
1.6 |
328.8% |
|
Total Operating expenses |
7.6 |
8.7 |
13.8% |
|
Profit before tax |
6.9 |
5.1 |
(26.2%) |
|
Profit after tax |
4.7 |
3.2 |
(31.3%) |
|
Core EPS |
13.70 |
9.4 |
(31.3%) |
|
Key Ratios |
|||
|
Ratios |
H1’2019 |
H1’2020 |
% point change |
|
Yield on Interest Earning Assets |
10.2% |
8.8% |
(1.3%) |
|
Cost of Funding |
3.2% |
2.2% |
(0.9%) |
|
Net Interest Margin |
7.6% |
6.9% |
(0.8%) |
|
Non-Performing Loans (NPL) Ratio |
14.6% |
13.9% |
(0.7%) |
|
NPL Coverage |
75.9% |
78.2% |
2.3% |
|
Loan to Deposit Ratio |
52.5% |
52.4% |
(0.2%) |
|
Cost to Income with LLP |
52.5% |
63.0% |
10.5% |
|
Cost to Income Without LLP |
49.9% |
51.2% |
1.3% |
|
Return on Average Assets |
2.8% |
2.2% |
(0.6%) |
|
Return on Average Equity |
18.2% |
13.7% |
(4.5%) |
Key take-outs from the earnings release include;
- Core earnings per share declined by 31.3% to Kshs 9.4, from Kshs 13.7 in H1’2019, driven by a 5.2% decline in total operating income to Kshs 13.8 bn, from Kshs 14.6 bn in H1’2019, coupled with a 13.8% rise in total operating expenses to Kshs 8.7 bn, from Kshs 7.6 bn in H1’2019. The decline in core earnings per share was not in line with our expectations of a 19.6% decline, with the variance being attributable to the 328.8% rise Loan Loss Provisions to Kshs 1.6 bn, from Kshs 0.4 bn in H1’2019, against our expectations of a 224.4% increase,
- Interest income declined by 6.3% to Kshs 11.9 bn, from Kshs 12.7 bn in H1’2019. This was driven by a 12.7% decline in interest income from government securities to Kshs 4.8 bn from Kshs 5.4 bn in H1’2019, coupled with a 6.6% decline in interest income on loans and advances to Kshs 6.3 bn, from Kshs 6.7 bn in H1’2019,
- The yield on interest-earning assets declined to 8.8% from 10.2% in H1’2019, attributable to the 6.3% decline in interest income, which was despite a 9.0% y/y growth in average interest-earning assets to Kshs 276.9 bn, from Kshs 254.1 bn in H1’2019,
- Interest expense declined by 12.1% to Kshs 2.5 bn, from Kshs 2.9 bn in H1’2019, following a 10.9% decline in interest expense on customer deposits to Kshs 2.3 bn from Kshs 2.6 bn in H1’2019 and a 34.9% decline in other interest expenses to Kshs 0.2 bn from Kshs 0.3 bn in H1’2019. Cost of funds, on the other hand, declined to 2.2%, from 3.2% in H1’2019, owing to a 12.1% decline in interest expense, despite a 20.2% growth in average interest-bearing liabilities,
- Net Interest Margin (NIM) declined to 6.9% from 7.6% in H1’2019, owing to a 4.6% decline in Net Interest Income (NII), despite a 9.0% growth in average interest-earning assets,
- Total operating expenses grew by 13.8% to Kshs 8.7 bn, from Kshs 7.6 bn, largely driven by 328.8% rise in Loan Loss Provisions (LLP) to Kshs 1.6 bn in H1’2020, from Kshs 0.4 bn in H1’2019 on account of the poor operating environment brought about by COVID-19. Staff costs, on the other hand, recorded a 5.3% decline to Kshs 3.3 bn from Kshs 3.5 bn in H1’2019,
- The balance sheet recorded an expansion as total assets grew by 11.1% to Kshs 327.2 bn, from Kshs 294.5 bn in H1’2019. This growth was largely driven by an 11.9% growth recorded in the loan book to Kshs 134.3 bn, from Kshs 120.1 bn in H1’2019, coupled with a 7.3% increase in placements from banking institutions to Kshs 47.1 bn in H1’2020, from Kshs 43.9 bn in H1’2019. Investment in government and other securities increased by 2.1% to Kshs 104.7 bn, from Kshs 102.6 bn in H1’2019,
- Total liabilities rose by 11.2% to Kshs 275.5 bn, from Kshs 247.7 bn in H1’2019, driven by a 12.3% increase in customer deposits to Kshs 256.5 bn, from Kshs 228.5 bn in H1’2019. Deposits per branch rose by 6.0% to Kshs 7.1 bn from Kshs 6.7 bn in H1’2019, with the number of branches increasing by 2 to 36 from 34 branches, and,
- Gross Non-Performing Loans (NPLs) increased by 5.6% to Kshs 20.9 bn in H1’2020, from Kshs 19.8 bn in H1’2019. The NPL ratio, however, improved to 13.9%, from 14.6% in H1’2019, attributable to the faster 11.9% growth in gross loans, which outpaced the 5.6% growth in Gross Non-Performing Loans (NPLs),
For a comprehensive analysis, please see our SCBK H1’2020 Earnings Note
- I&M Bank Kenya
|
I&M H1’2020 Key Highlights |
|||
|
Balance Sheet |
|||
|
Balance Sheet Items |
H1’2019 (Kshs bn) |
H1’2020 (Kshs bn) |
y/y change |
|
Government Securities |
55.5 |
72.2 |
30.1% |
|
Net Loans and Advances |
172.2 |
184.6 |
7.2% |
|
Total Assets |
317.1 |
340.6 |
7.4% |
|
Customer Deposits |
237.2 |
252.5 |
6.4% |
|
Deposits per Branch |
3.5 |
3.8 |
8.6% |
|
Total Liabilities |
261.6 |
278.6 |
6.5% |
|
Shareholders’ Funds |
50.1 |
59.3 |
18.4% |
|
Income Statement |
|||
|
Income Statement Items |
H1’2019 (Kshs bn) |
H1’2020 (Kshs bn) |
y/y change |
|
Net Interest Income |
7.0 |
6.9 |
(1.4%) |
|
Net non-Interest Income |
4.5 |
4.2 |
(7.1%) |
|
Total Operating income |
11.6 |
11.1 |
(3.6%) |
|
Loan Loss provision |
(1.1) |
(1.0) |
(7.0%) |
|
Total Operating expenses |
(5.7) |
(6.1) |
5.5% |
|
Profit before tax |
6.2 |
4.5 |
(27.7%) |
|
Profit after tax |
4.5 |
3.2 |
(29.5%) |
|
Core EPS |
5.5 |
3.9 |
(29.5%) |
|
Key Ratios |
|||
|
Ratios |
H1’2019 |
H1’2020 |
% point change |
|
Yield on Interest Earning Assets |
10.4% |
9.8% |
(0.6%) |
|
Cost of Funding |
4.7% |
4.6% |
(0.1%) |
|
Net Interest Margin |
6.0% |
5.5% |
(0.5%) |
|
Non-Performing Loans (NPL) Ratio |
13.0% |
11.0% |
(2.0%) |
|
NPL Coverage |
62.4% |
63.1% |
0.7% |
|
Loan to Deposit Ratio |
72.6% |
73.1% |
0.5% |
|
Cost to Income with LLP |
49.7% |
54.4% |
4.7% |
|
Cost to Income Without LLP |
40.1% |
45.1% |
5.0% |
|
Return on Average Assets |
2.9% |
2.7% |
(0.2%) |
|
Return on Average Equity |
17.7% |
15.4% |
(2.3%) |
Key take-outs from the earnings release include;
- Core earnings per share declined by 29.5% to Kshs 3.9, from Kshs 5.5 in H1’2019, not in line with our projections of an 8.6% decline to Kshs 5.0. The performance was driven by a 3.6% decline in total operating income and a 5.5% increase in total operating expenses. The variance in core earnings per share growth against our expectations was largely due to the 3.6% decline in total operating income to Kshs 11.1 bn, from Kshs 11.6 bn in H1’2019, with the drop being faster than our expectation of a 2.8% drop,
- Interest income rose by 3.4% to Kshs 13.1 bn, from Kshs 12.7 bn in H1’2019. This was driven by a 5.0% increase in interest income from Loans and Advances to 10.8 bn from 10.2 bn in H1’2019, as well as, a 0.7% growth in interest income from government securities to Kshs 2.15 bn from Kshs 2.13 bn in H1’2019,
- The yield on interest-earning assets declined to 9.8%, from 10.4% in H1’2019, largely attributable to a faster 8.3% increase in average interest-earning assets as compared to the 3.4% growth in Interest Income,
- Interest expense rose by 9.4% to Kshs 6.2 bn, from Kshs 5.7 bn in H1’2019, following a 6.4% rise in Interest expense on deposits to Kshs 5.4 bn from Kshs 5.1 bn in H1’2019, coupled with a 224.8% increase in the interest expense on placements to Kshs 0.4 bn, from Kshs 0.1 bn in H1’2019, which outpaced the 8.6% decline in other interest expenses to Kshs 0.4 bn from Kshs 0.5 bn in H1'2019. Cost of funds declined marginally to 4.6% from 4.7% in H1’2019, owing to a faster 8.6% increase in average interest-bearing liabilities, to Kshs 263.5 bn from Kshs 242.6 bn in H1’2019 that outpaced the 8.0% growth in trailing interest expense,
- Net Interest Margin (NIM) on the other hand declined to 5.3%, from 6.0% in H1’2019 due to the 1.4% increase in NII, that was outpaced by the 8.3% increase in average interest-earning assets,
- Total operating expenses rose by 5.5% to Kshs 6.1 bn from Kshs 5.7 bn in H1’2019, largely driven by a 17.2% increase in other operating expenses to Kshs 2.7 bn from Kshs 2.3 bn in H1’2019. The decline was however weighed down by the 7.0% decline in Loan Loss Provisions (LLP) to Kshs 1.0 bn from Kshs 1.1 bn in H1’2019, coupled with marginal declines of 0.04% in Staff costs to Kshs 2.325 bn from Kshs 2.326 bn in H1’2019,
- The balance sheet recorded an expansion as total assets grew by 7.4% to Kshs 340.6 bn, from Kshs 317.1 bn in H1’2019. Growth was supported by a 30.1% increase in government securities to Kshs 72.2 bn from Kshs 55.5 bn in H1’2019, coupled with a 7.2% loan book expansion to Kshs 184.6 bn from Kshs 172.2 bn in H1’2019. Placements, on the other hand, declined by 19.8% to Kshs 35.2 bn from Kshs 44.0 bn in H1’2019,
- Total liabilities rose by 6.5% to Kshs 278.6 bn, from Kshs 261.6 bn in H1’2019, driven by a 23.8% increase in placements to Kshs 9.5 bn from Kshs 7.6 bn in H1’2019, coupled with a 6.6% rise in customer deposits to Kshs 252.5 bn from Kshs 237.2 bn in H1’2019. Deposits per branch increased by 8.6% to Kshs 3.8 bn from Kshs 3.5 bn in H1’2019, with the number of branches remaining unchanged at 67, and,
- Gross non-performing loans declined by 9.4% to Kshs 22.1 bn in H1’2020 from Kshs 24.4 bn in H1’2019. Consequently, the NPL ratio, improved to 11.0% in H1’2020 from 13.0% in H1’2019 as the 9.4% decline in Non-Performing Loans, despite a 5.9% growth in gross loans. The NPL coverage improved to 63.1% in H1’2020 from 62.4% in H1’2019, as general Loan Loss Provisions increased by 17.4% to Kshs 9.8 bn from Kshs 8.3 bn in H1’2019, despite a 9.4% decline in gross non-performing loans,
For a comprehensive analysis, please see our I&M H1’2020 Earnings Note
- ABSA Bank Kenya
|
ABSA H1’2020 Key Highlights |
|||
|
Balance Sheet |
|||
|
Balance Sheet Items |
H1’2019 (Kshs bn) |
H1’2020 (Kshs bn) |
y/y change |
|
Government Securities |
114.0 |
133.9 |
17.4% |
|
Net Loans and Advances |
186.7 |
201.9 |
8.2% |
|
Total Assets |
353.8 |
391.9 |
10.8% |
|
Customer Deposits |
229.7 |
248.7 |
8.3% |
|
Deposits per Branch |
2.6 |
3.0 |
15.4% |
|
Total Liabilities |
311.4 |
348.9 |
12.0% |
|
Shareholders’ Funds |
42.4 |
43.0 |
1.4% |
|
Income Statement |
|||
|
Income Statement Items |
H1’2019 (Kshs bn) |
H1’2020 (Kshs bn) |
y/y change |
|
Net Interest Income |
11.0 |
11.3 |
2.5% |
|
Net non-Interest Income |
5.3 |
5.5 |
4.2% |
|
Total Operating income |
16.3 |
16.8 |
3.0% |
|
Loan Loss provision |
(1.6) |
(5.4) |
228.1% |
|
Total Operating expenses |
(10.0) |
(13.6) |
34.9% |
|
Profit before tax |
5.7 |
1.6 |
(72.1%) |
|
Profit after tax |
3.9 |
0.6 |
(84.8%) |
|
Core EPS |
0.7 |
0.1 |
(84.8%) |
|
Key Ratios |
|||
|
Ratios |
H1’2019 |
H1’2020 |
% point change |
|
Yield on Interest Earning Assets |
10.7% |
9.7% |
(1.1%) |
|
Cost of Funding |
3.5% |
3.1% |
(0.4%) |
|
Net Interest Margin |
7.9% |
7.3% |
(0.6%) |
|
Non-Performing Loans (NPL) Ratio |
7.9% |
8.0% |
0.1% |
|
NPL Coverage |
72.5% |
63.6% |
(8.9%) |
|
Loan to Deposit Ratio |
81.3% |
81.2% |
(0.1%) |
|
Cost to Income with LLP |
61.6% |
80.6% |
19.1% |
|
Cost to Income Without LLP |
51.5% |
48.6% |
(2.9%) |
|
Return on Average Assets |
2.5% |
1.8% |
(0.7%) |
|
Return on Average Equity |
18.1% |
15.9% |
(2.2%) |
Key take-outs from the earnings release include;
- Core earnings per share declined by 84.8% to Kshs 0.11, from Kshs 0.72 in H1’2019, not in line with our expectation of a 1.5% increase to Kshs 0.83. The performance was driven by a 34.9% increase in total operating expenses, which grew faster than the 3.0% growth in total operating income. The variance in core earnings per share growth against our expectations was largely due to the 228.1% increase in Loan Loss Provisions to Kshs 5.4 bn, from Kshs 1.6 bn in H1’2019, against our expectation of a 71.6% increase to Kshs 2.8 bn,
- Interest income rose marginally by 0.9% to Kshs 15.3 bn, from Kshs 15.2 bn in H1’2019. This was driven by a 6.3% growth in interest income from government securities to Kshs 4.3 bn, from Kshs 4.1 bn in H1’2019, which offset the 0.8% decline in Interest income from Loans and Advances to Kshs 10.9 bn from Kshs 11.0 bn in H1’2019, as well as the 20.8% decline in interest income from placements to Kshs 0.1 bn from Kshs 0.2 bn in H1’2019,
- The yield on interest-earning assets declined to 9.7%, from 10.7% in H1’2019, attributed to the faster 14.8% y/y increase in average interest-earning assets to Kshs 321.9 bn, from Kshs 280.5 bn in H1’2019, that outpaced the 3.5% growth in trailing interest income, which the management confirming it had been dropping lending rates for customers, in line with the CBR cuts,
- Interest expenses declined by 3.3% to Kshs 4.0 bn, from Kshs 4.2 bn in H1’2019, following a 7.8% decline in interest expense on customer deposits to Kshs 3.2 bn, from Kshs 3.4 bn in H1’2019. The decline was however weighed down by a 16.9% rise in placement liabilities to Kshs 0.7 bn from Kshs 0.6 bn in H1’2019. Cost of funds, on the other hand, declined to 3.1%, from 3.5% in H1’2019, owing to the faster 17.5% growth in average interest-bearing liabilities, despite the 4.2% decline in trailing interest expense,
- Net Interest Margin (NIM) on the other hand declined to 7.3%, from 7.9% in H1’2019, owing to the faster 14.8% growth in average interest-earning assets which outpaced the 2.5% growth in Net Interest Income (NII),
- Total operating expenses rose by 34.9% to Kshs 13.6 bn, from Kshs 10.0 bn in H1’2019, largely driven by a 228.1% increase in Loan Loss Provisions (LLP) to Kshs 5.4 bn in H1’2020, from Kshs 1.6 bn in H1’2019, coupled with a 4.9% increase in staff costs to Kshs 5.0 bn in H1’2020, from Kshs 4.8 bn in H1’2019. The increased provisions are attributed to the bank adopting a cautious stance on the back of the expectations of an increase in defaults due to the subdued operating environment. The rise in operating expenses was however mitigated by a 13.0% decline in other operating expense to Kshs 3.2 bn from Kshs 3.6 bn in H1’2019,
- The balance sheet recorded an expansion as total assets rose by 10.8% to Kshs 391.9 bn, from Kshs 353.8 bn in H1’2019. This growth was largely driven by a 17.4% increase in government securities to Kshs 133.9 bn, from Kshs 114.0 bn in H1’2019, coupled with an 8.2% growth in the loan book to Kshs 201.9 bn, from Kshs 186.7 bn in H1’2019,
- Total liabilities rose by 12.0% to Kshs 348.9 bn, from Kshs 311.4 bn in H1’2019, driven by an 8.3% increase in customer deposits to Kshs 248.7 bn, from Kshs 229.7 bn in H1’2019, coupled with a 14.2% increase in deposits and balances due to foreign banking institutions to Kshs 520.7 mn, from Kshs 456.1 mn in H1’2019. The growth in liabilities was mitigated by a 21.3% decline in placement liabilities to Kshs 6.2 bn, from Kshs 7.8 bn in H1’2019. Deposits per branch increased by 15.4% to Kshs 3.0 bn, from Kshs 2.6 bn in H1’2019, with the number of branches having reduced to 84 in H1’2020, from 88 in H1’2019, and,
- Gross Non-Performing Loans (NPLs) increased by 8.4% to Kshs 17.0 bn in H1’2020, from Kshs 15.7 bn in H1’2019. The NPL ratio thus deteriorated marginally to 8.0% in H1’2020, from 7.9% in H1’2019, owing to the faster 8.4% growth in gross NPLs, which outpaced the 7.4% growth in gross loans (after adding back interest suspense),
For a comprehensive analysis, please see our ABSA H1’2020 Earnings Note
- NCBA Group Kenya
|
NCBA H1’2020 Key Highlights |
|||
|
Balance Sheet |
|||
|
Balance Sheet Items |
H1’2019 (Kshs bn) |
H1’2020 (Kshs bn) |
y/y change |
|
Government Securities |
7.0 |
8.2 |
16.8% |
|
Net Loans and Advances |
238.8 |
248.3 |
4.0% |
|
Total Assets |
476.1 |
514.0 |
8.0% |
|
Customer Deposits |
358.0 |
390.5 |
9.1% |
|
Deposits per Branch |
4.4 |
4.8 |
9.1% |
|
Total Liabilities |
406.6 |
443.7 |
9.1% |
|
Shareholders’ Funds |
69.2 |
70.1 |
1.3% |
|
Income Statement |
|||
|
Income Statement Items |
H1’2019 (Kshs bn) |
H1’2020 (Kshs bn) |
y/y change |
|
Net Interest Income |
10.5 |
11.2 |
6.8% |
|
Net non-Interest Income |
8.9 |
10.1 |
13.7% |
|
Total Operating income |
19.4 |
21.3 |
10.0% |
|
Loan Loss provision |
2.7 |
7.6 |
180.9% |
|
Total Operating expenses |
12.2 |
17.0 |
39.6% |
|
Profit before tax |
6.7 |
3.9 |
(42.0%) |
|
Profit after tax |
4.3 |
2.6 |
(38.3%) |
|
Core EPS |
6.1 |
3.7 |
(38.3%) |
|
Key Ratios |
|||
|
Ratios |
H1’2019 |
H1’2020 |
% point change |
|
Yield on Interest Earning Assets |
9.8% |
6.3% |
(3.5%) |
|
Cost of Funding |
4.7% |
3.1% |
(1.6%) |
|
Net Interest Margin |
5.3% |
3.3% |
(1.9%) |
|
Non-Performing Loans (NPL) Ratio |
11.8% |
13.1% |
1.3% |
|
NPL Coverage |
58.1% |
53.2% |
(4.9%) |
|
Loan to Deposit Ratio |
66.7% |
63.6% |
(3.1%) |
|
Cost to Income with LLP |
62.9% |
79.8% |
17.0% |
|
Cost to Income Without LLP |
48.8% |
44.0% |
(4.8%) |
|
Return on Average Assets |
2.0% |
1.3% |
(0.7%) |
|
Return on Average Equity |
13.7% |
8.9% |
(4.8%) |
Key take-outs from the earnings release include;
- Core earnings per share declined by 38.3% to Kshs 3.7 from Kshs 6.1 in H1’2019 which was not in line with our projections of Kshs 1.9. The variance can be attributed to our expectations of slower growth in both total operating income, where we expected an 18.4% decline, compared to the actual growth of 10.0%. The performance can be attributed to the 180.9% increase in loan loss provisions, which lead to a 39.6% increase in total operating expenses, coupled with the 10.0% growth in total operating income,
- Interest income rose by 6.2% to Kshs 20.7 bn, from Kshs 19.5 bn in H1’2019. This was mainly driven by a 33.5% rise in interest income from deposits to Kshs 0.4 bn from Kshs 0.3 bn in H1’2019 coupled with a 16.8% rise in interest income on government securities to Kshs 8.2 bn in H1’2020, from Kshs 7.0 bn in H1’2019. This was weighed down by a 0.5% decline in interest income from loans and advances to Kshs 12.0 bn, from Kshs 12.1 bn, and a 20.8% decline in other interest income to Kshs 51.1 mn in H1’2020, from Kshs 64.5 mn,
- The yield on interest-earning assets declined to 6.4% in H1’2020 from 9.7% in H1’2019, due to the faster 6.7% growth in average interest-earning assets to Kshs 436.8 bn from Kshs 411.0 bn in H1’2019, compared to the 6.2% growth in Interest Income,
- Interest expense increased by 5.5% to Kshs 9.5 bn from Kshs 9.0 bn in H1’2019, mainly attributable to an 11.6% increase in interest expense on customer deposits to Kshs 8.4 bn from Kshs 7.5 bn in H1’2019. The cost of funds fell to 3.1% from 4.7% in H1’2019 owing to the slower growth of 5.5% in interest expense compared to the growth of 7.6% in average interesting bearing liabilities to Kshs 425.0 bn in H1’2020, from Kshs 395.0 bn in H1’2019,
- Net Interest Margin came in at 3.4%, lower than the 5.2% seen in 2019, due to the 29.4% decline in NII compared to the 6.7% growth seen in the average interest-earning assets,
- Total operating expenses increased by 39.6% to Kshs 17.0 bn, from Kshs 12.2 bn in H1’2019, largely driven by a 180.9% increase in loan loss provision to Kshs 7.6 bn in H1’2020 from Kshs 2.7 bn in H1’2019, coupled with other operating expenses which increased by 6.4% to Kshs 5.9 bn in H1’2020 from Kshs 5.5 bn in H1’2019. The high increase in Loan loss provision was driven by the expectations of a significant increase in NPLs due to the economic fallouts of the Coronavirus. Staff costs, on the other hand, decreased by 11.2% to Kshs 3.5 bn, from Kshs 3.9 bn recorded in H1’2019,
- The balance sheet recorded an expansion with a total assets growth of 8.0% to Kshs 514.0 bn from Kshs 476.1 bn in H1’2019. This growth was largely driven by a 24.0% increase in government securities to Kshs 169.0 bn from the Kshs 136.2 bn recorded in H1’2019. The loan book on the other hand expanded by 4.0% to Kshs 248.3 bn in H1’2020 from Kshs 238.8 bn in H1’2019,
- Total liabilities rose by 9.1% to Kshs 443.7 bn from Kshs 406.6 bn in H1’2019, driven by a 9.1% increase in customer deposits to Kshs 390.5 bn from Kshs 358.0 bn in H1’2019. Placements increased by 58.6% from the Kshs 8.3 bn recorded in H1’2019 to Kshs 13.1 bn in H1’2020. Deposits per branch increased by 9.1% from Kshs 4.4 bn, to Kshs 4.8 bn in H1’2020, with the number of branches remaining unchanged at 82 branches, and,
- Gross non-performing loans (NPLs) increased by 15.3% to Kshs 34.9 bn in H1’2020 from Kshs 30.3 bn in H1’2019. Consequently, the NPL ratio deteriorated to 13.1% in H1’2020 from 11.8% in H1’2019 attributable to the faster 15.3% increase in NPLs that outpaced the 4.3% increase in gross loans which came in at Kshs 34.9 bn in H1’2020, from the Kshs 30.3 bn in H1’2019. General loan loss provisions increased by 2.6% from Kshs 11.9 bn, to Kshs 12.2 bn in H1’2020. The NPL coverage fell to 53.2% in H1’2020, from 58.1% owing to the slower 2.6% increase in general loan loss provisions, compared to the 15.3% growth in gross NPLs,
For a comprehensive analysis, please see our NCBA Group H1’2020 Earnings Note
- HF Group
|
HF Group H1’2020 Key Highlights |
|||
|
Balance Sheet |
|||
|
Balance Sheet Items |
H1’2019 (Kshs bn) |
H1’2020 (Kshs bn) |
y/y change |
|
Government Securities |
0.2 |
0.24 |
26.3% |
|
Net Loans and Advances |
40.5 |
38.2 |
(5.8%) |
|
Total Assets |
57.0 |
56.5 |
(0.9%) |
|
Customer Deposits |
33.8 |
39.2 |
15.8% |
|
Deposits per Branch |
1.5 |
1.8 |
15.8% |
|
Total Liabilities |
46.6 |
46.6 |
(0.1%) |
|
Shareholders’ Funds |
10.4 |
9.9 |
(4.3%) |
|
Income Statement |
|||
|
Income Statement Items |
H1’2019 (Kshs bn) |
H1’2020 (Kshs bn) |
y/y change |
|
Net Interest Income |
1.0 |
1.0 |
(3.9%) |
|
Net non-Interest Income |
0.9 |
0.3 |
(68.8%) |
|
Total Operating income |
1.9 |
1.3 |
(34.4%) |
|
Loan Loss provision |
(0.4) |
(0.3) |
(27.6%) |
|
Total Operating expenses |
(2.0) |
(1.6) |
(23.1%) |
|
Profit before tax |
(0.1) |
(0.3) |
210.8% |
|
Profit after tax |
(0.1) |
(0.3) |
203.9% |
|
Core EPS |
(0.3) |
(0.8) |
203.9% |
|
Key Ratios |
|||
|
Ratios |
H1’2019 |
H1’2020 |
% point change |
|
Yield on Interest Earning Assets |
11.3% |
12.7% |
1.4% |
|
Cost of Funding |
7.4% |
6.4% |
(1.0%) |
|
Net Interest Margin |
4.0% |
5.0% |
1.0% |
|
Non-Performing Loans (NPL) Ratio |
28.2% |
26.7% |
(1.5%) |
|
NPL Coverage |
41.5% |
54.3% |
12.8% |
|
Loan to Deposit Ratio |
119.8% |
97.4% |
(22.4%) |
|
Cost to Income with LLP |
104.9% |
123.0% |
18.2% |
|
Cost to Income Without LLP |
85.8% |
102.0% |
16.2% |
|
Return on Average Assets |
(1.1%) |
(0.5%) |
0.6% |
|
Return on Average Equity |
(6.5%) |
(3.0%) |
3.5% |
Key take-outs from the earnings release include;
- HF Group recorded a loss per share of Kshs 0.8 in H1’2020, lower than the loss per share of Kshs 0.3 recorded in H1’2019, which was not in-line with our expectations of a Kshs 0.1 loss per share. This variance can be attributed to lower Non-Funded Income where we expected a 2.7% growth for the first half of the year, compared to the 68.8% decline that was recorded. The performance of the group can be attributed to the decline in non-funded income, that resulted in a 34.4% decline in total operating income which weighed down on the effect of the 23.1% decline in total operating expenses,
- Interest income declined by 12.7% to Kshs 2.4 bn, from Kshs 2.7 bn in H1’2019. This was driven by a 16.5% decline in interest income from loans and advances to Kshs 2.1 bn, from Kshs 2.5 bn in H1’2019. Interest income on government securities, however, recorded a 26.3% rise to Kshs 247.3 mn, from Kshs 195.7 mn in H1’2019,
- The yield on interest-earning assets declined to 10.6%, from 11.3% in H1’2019, due to the faster 12.7% decline in interest income compared to the 8.7% decline in the average interest-earning assets (IEA),
- Interest expense declined by 18.2% to Kshs 1.4 bn, from Kshs 1.7 bn in H1’2019, following a 55.2% decline in other interest expenses to Kshs 0.3 bn, from Kshs 0.7 bn in H1’2019. Interest expenses on customer deposits, on the other hand, increased by 9.1% to Kshs 1.0 bn in H1’2020, from Kshs 0.9 bn in H1’2019. Cost of funds declined to 6.4% from the 7.4% recorded in H1’2019, following the faster 18.2% decline in interest expense compared to the marginal 0.1% decline in the average interest-bearing liabilities (IBL),
- Net Interest Margin (NIM) increased to 4.3%, from 4.0% in H1’2019, due to the faster 8.7% decline in the average interest-earning assets, compared to the 1.1% decline in trailing Net Interest Income (NII),
- Total Operating Expenses declined by 23.1% to Kshs 1.6 bn from Kshs 2.0 bn seen in H1’2019. This is attributable to a 28.4% drop in Other Expenses to Kshs 0.8 bn from Kshs 1.2 bn in H’2019, coupled with a 276% decline in Loan Loss Provisions from Kshs 0.4 bn to Kshs 0.3 bn in H1’2019, and a 7.1% decline in Staff Costs to Kshs 462.9 mn from Kshs 498.5 mn recorded in H1’2019,
- The company’s balance sheet recorded a contraction as total assets declined by 0.9% from Kshs 57.0 bn to Kshs 56.5 bn in H1’2019. This is attributable to a 5.8% decline in the loan book to Kshs 38.2 bn from Kshs 40.5 bn recorded in H1’2019. This was however mitigated by a 171.7% increase in placements to Kshs 1.0 bn, from Kshs 0.5 bn in H1’2019, and a 13.5% rise in government securities increased to Kshs 4.8 bn from the Kshs 4.2 bn recorded in H1’2019,
- Total liabilities declined marginally by 0.1% to Kshs 46.56 mn in H1’2020, from Kshs 46.62 mn, driven by a 49.9% decline in borrowings to Kshs 5.3 bn, from Kshs 10.6 bn in H1’2019. This drop can be attributed to the corporate bond that was retired during the last quarter of 2019. The decline was mitigated by a 15.8% rise in Customer deposits to Kshs 39.2 bn from Kshs 33.8 bn in H1’2019. Deposits per branch increased by 15.8% from Kshs 1.5 bn to Kshs 1.8 bn in H1’2020, with the number of branches remaining unchanged at 22, and,
- Gross non-performing loans (NPLs) declined by 8.2% to Kshs 11.9 bn from Kshs 13.0 bn recorded in H1’2019. Consequently, the NPL ratio improved to 26.7% from the 28.2% following the faster 8.2% decline in NPLs that outpaced the 2.8% decline in gross loans which came in at Kshs 44.6 bn in H1’2020, from Kshs 45.9 bn recorded in H1’2019. General loan loss provisions increased by 16.5% to Kshs 3.0 bn in H1’2020, from Kshs 2.5 bn in H1’2019. NPL coverage increased to 54.3% in H1’2020, from 41.5% owing to the faster 16.5% increase in general loan loss provisions which outpaced the 8.2% decline in gross NPLs,
For a comprehensive analysis, please see our HF Group H1’2020 Earnings Note
- Diamond Trust Bank Kenya
|
DTBK H1’2020 Key Highlights |
|||
|
Balance Sheet |
|||
|
Balance Sheet Items |
H1’2019 (Kshs bn) |
H1’2020 (Kshs bn) |
y/y change |
|
Government Securities |
120.7 |
132.5 |
9.8% |
|
Net Loans and Advances |
190.8 |
201.5 |
5.6% |
|
Total Assets |
375.9 |
388.3 |
3.3% |
|
Customer Deposits |
283.1 |
280.4 |
(1.0%) |
|
Deposits per Branch |
2.2 |
2.1 |
(4.5%) |
|
Total Liabilities |
313.4 |
321.1 |
2.5% |
|
Shareholders’ Funds |
56.9 |
61.0 |
7.2% |
|
Income Statement |
|||
|
Income Statement Items |
H1’2019 (Kshs bn) |
H1’2020 (Kshs bn) |
y/y change |
|
Net Interest Income |
9.2 |
9.3 |
1.2% |
|
Net non-Interest Income |
3.0 |
3.2 |
5.9% |
|
Total Operating income |
12.2 |
12.4 |
2.3% |
|
Loan Loss provision |
0.5 |
1.9 |
249.2% |
|
Total Operating expenses |
6.2 |
8.0 |
28.1% |
|
Profit before tax |
6.0 |
4.5 |
(24.7%) |
|
Profit after tax |
4.1 |
2.6 |
(36.5%) |
|
Core EPS |
14.8 |
9.4 |
(36.5%) |
|
Key Ratios |
|||
|
Ratios |
H1’2019 |
H1’2020 |
% point change |
|
Yield on Interest Earning Assets |
10.3% |
9.7% |
(0.6%) |
|
Cost of Funding |
4.8% |
4.4% |
(0.4%) |
|
Net Interest Margin |
5.8% |
5.6% |
(0.2%) |
|
Non-Performing Loans (NPL) Ratio |
7.6% |
8.3% |
0.7% |
|
NPL Coverage |
50.3% |
51.2% |
0.9% |
|
Loan to Deposit Ratio |
67.4% |
71.9% |
4.5% |
|
Cost to Income with LLP |
51.2% |
64.1% |
12.9% |
|
Cost to Income Without LLP |
46.8% |
49.1% |
2.3% |
|
Return on Average Assets |
1.9% |
1.5% |
(0.4%) |
|
Return on Average Equity |
13.2% |
9.8% |
(3.5%) |
Key take-outs from the earnings release include;
- The bank’s core earnings per share declined by 36.5% to Kshs 9.4, from Kshs 14.8 in H1’2019, lower than our expectation of a 17.8% decline to Kshs 12.1 per share. The variance was mainly attributable to the increase in total operating expenses which rose by 28.1%, higher than our expectations of a 6.8% decline. The bank’s performance was driven the increase in total operating expenses, which outweighed the 2.3% increase in total operating income,
- Interest income declined by 3.3% to Kshs 15.8 bn from Kshs 16.3 bn in H1’2019. This was driven by a 3.3% decline in interest income from loans and advances to Kshs 9.6 bn from Kshs 9.9 bn in H1’2019, coupled with the 63.9% decline in interest income from deposit placements to Kshs 0.2 bn, from Kshs 0.1 bn in H1’2019,
- The yield on interest-earning assets declined to 9.7% from 10.3% in H1’2019, attributable to the faster 6.6% increase in average interest-earning assets to Kshs 344.1 bn, from Kshs 322.8 bn in H1’2019, that outpaced the 5.3% decline in trailing interest income, largely attributable to the decline in lending rates, which saw interest income decline by 3.3%,
- Interest expenses declined by 9.0% to Kshs 6.5 bn from Kshs 7.2 bn in H1’2019, following a 9.5% decline in interest expense on placement liabilities to Kshs 357.0 mn from Kshs 394.6 mn in H1’2019, coupled with an 8.4.% decline in interest expense on customer deposits to Kshs 5.6 bn, from Kshs 6.1 bn in H1’2019. Cost of funds, declined to 4.4% from 4.8% in H1’2019, owing to the 9.0% decline in interest expenses, despite the 2.7% increase in interest-bearing liabilities,
- Net Interest Margin (NIM) declined marginally to 5.6%, from 5.8% in H1’2019 due to the 3.3% decline in interest income as compared to the 0.8% increase in average interest-earning assets,
- Total operating expenses rose by 28.1% to Kshs 8.0 bn, from Kshs 6.2 bn in H1’2019, largely driven by the 249.2% increase in Loan Loss Provisions (LLP) to Kshs 1.9 bn from Kshs 0.5 bn in H1’2019, other expenses which rose by 7.6%, to Kshs 3.7 bn from Kshs 3.5 bn in H1’2019, and staff costs which increased by 6.8% to Kshs 2.4 bn, from Kshs 2.2 bn,
- The balance sheet recorded an expansion as total assets increased by 3.3% to Kshs 388.3 bn from Kshs 375.9 bn in H1’2019. This growth was largely driven by a 9.8% increase in government securities to Kshs 132.5 bn from Kshs 120.7 bn in H1’2019, coupled with a 5.6% increase in net loans to Kshs 201.5 bn from Kshs 190.8 bn in H1’2019. The growth in assets was however slowed down by a 26.7% decline in cash and bank placements to Kshs 24.5 bn from Kshs 33.4 bn in H1’2019,
- Total liabilities also rose by 2.5% to Kshs 321.1 bn from Kshs 313.4 bn in H1’2019, driven by an 80.3% increase in placement liabilities to Kshs 15.7 bn from Kshs 8.7 bn in H1’2019, coupled with the 29.2% increase in borrowings to Kshs 17.1 bn from Kshs 13.2 bn in H1’2019. The growth was however mitigated by the 0.1% decline in deposits to Kshs 280.4 bn from Kshs 283.1 bn in H1’2019. Deposits per branch declined by 4.5% to Kshs 2.1 bn from Kshs 2.2 bn in H1’2019, as the number of branches remained unchanged at 137 in H1’2020, and,
- Gross Non-Performing Loans (NPLs) rose by 16.0% to Kshs 17.5 bn in H1’2020 from Kshs 15.1 bn in H1’2019. Consequently, the NPL ratio deteriorated to 8.3% in H1’2020, from 7.6% in H1’2019, due to the faster 16.0% growth in gross NPLs, which outpaced the 6.2% growth in gross loans. General Loan Loss Provisions increased by 15.5% to Kshs 6.2 bn from Kshs 5.4 bn in H1’2019. Consequently, the NPL coverage increased to 51.2% in H1’2020 from 50.3% in H1’2019, owing to the faster 24.3% growth in interest suspense to Kshs 2.8 bn from Kshs 2.3 bn in H1’2019, that outpaced the 16.0% growth in Gross NPLs,
For a comprehensive analysis, please see our DTBK H1’2020 Earnings Note
The table below highlights the performance of the banks that have released so far, showing the performance using several metrics, and the key take-outs of the performance.
|
Bank |
Core EPS Growth |
Interest Income Growth |
Interest Expense Growth |
Net Interest Income Growth |
Net Interest Margin |
Non-Funded Income Growth |
NFI to Total Operating Income |
Growth in Total Fees & Commissions |
Deposit Growth |
Growth in Government Securities |
Loan to Deposit Ratio |
Loan Growth |
Return on Average Equity |
|
ABSA |
(84.8%) |
0.9% |
(3.3%) |
2.5% |
7.3% |
4.2% |
32.8% |
4.1% |
8.3% |
17.4% |
81.2% |
8.2% |
15.9% |
|
KCB |
(40.4%) |
23.2% |
25.7% |
22.3% |
7.6% |
6.0% |
31.0% |
4.3% |
34.6% |
54.5% |
73.8% |
17.0% |
16.0% |
|
NCBA |
(38.3%) |
9.6% |
7.7% |
11.2% |
3.4% |
28.0% |
47.3% |
61.3% |
9.1% |
24.0% |
63.6% |
4.0% |
8.9% |
|
DTBK |
(36.5%) |
(3.3%) |
(9.0%) |
1.2% |
5.6% |
5.9% |
25.3% |
24.2% |
(0.1%) |
9.8% |
75.2% |
5.6% |
9.8% |
|
SCBK |
(31.3%) |
(6.3%) |
(12.1%) |
(4.6%) |
6.9% |
6.6% |
31.9% |
(5.2%) |
12.3% |
2.1% |
52.4% |
11.9% |
13.7% |
|
Stanbic |
(31.2%) |
(4.8%) |
(3.1%) |
(0.7%) |
4.5% |
(18.8%) |
44.0% |
(36.7%) |
20.6% |
(13.4%) |
81.9% |
32.8% |
10.9% |
|
I&M |
(29.5%) |
3.4% |
9.4% |
(1.4%) |
5.5% |
(7.1%) |
37.8% |
7.7% |
6.4% |
30.1% |
73.1% |
7.2% |
15.4% |
|
Equity |
(24.4%) |
18.5% |
23.6% |
16.9% |
8.1% |
(13.0%) |
36.9% |
(10.8%) |
18.6% |
24.2% |
72.0% |
22.0% |
17.5% |
|
Co-op |
(3.6%) |
6.8% |
(4.4%) |
11.6% |
8.4% |
(5.1%) |
34.3% |
(42.5%) |
18.9% |
28.0% |
70.8% |
19.4% |
18.6% |
|
HF Group |
N/A |
(12.7%) |
(18.20%) |
(3.9%) |
4.3% |
(68.8%) |
22.4% |
42.1% |
15.8% |
13.5% |
97.4% |
(5.8%) |
(3.0%) |
|
H1'20 Mkt Weighted Average* |
(33.6%) |
10.4% |
10.0% |
10.9% |
7.0% |
(1.1%) |
35.2% |
(3.4%) |
18.5% |
26.1% |
71.5% |
16.1% |
15.4% |
|
H1'19Mkt Weighted Average** |
9.0% |
3.7% |
5.3% |
3.8% |
7.70% |
16.5% |
37.2% |
12.7% |
8.6% |
12.1% |
73.8% |
9.8% |
19.3% |
|
*Market-cap-weighted as at 28/08/2020 **Market-cap-weighted as at 06/09/2019 |
|||||||||||||
Key takeaways from the table above include:
- For the first half of 2020, the core Earnings Per Share (EPS) has declined by (33.6%) as compared to a growth of 9.0% in H1’2019,
- The sector recorded a deposit growth of 18.5% up from the 8.6% growth recorded in H1’2019. Interest expense, on the other hand, grew faster by 10.0%, compared to 5.3% in Q1’2019. Cost of funds, however, declined, coming in at a weighted average of 2.9% in H1’2020, from 3.0% in H1’2019, an indication that the sector was able to mobilize cheaper deposits,
- Average loan growth came in at 16.1%, which was faster than the 9.8% recorded in H1’2019, but slower than the 26.1% growth in government securities, an indication of the banks preference in investing in Government securities as opposed to lending during the COVID-19 pandemic,
- Interest income rose by 10.4%, compared to a growth of 3.7% recorded in H1’2019. The faster growth in interest income may be attributable to the 16.1% growth in loans and increased allocation to government securities. Despite the rise in interest income, the Yield on Interest Earning Assets (YIEA) declined to 9.7% from the 10.4% recorded in H1’2019, an indication of the increased allocation to lower-yielding government securities by the sector. The decline in the YIEA can also be attributed to the reduced lending rates for customers by the sector, in line with the Central Bank Rate cuts. Consequently, the Net Interest Margin (NIM) now stands at 7.0%, compared to the 7.7% recorded in H1’2019 for the listed banking sector, and,
- Non-Funded Income declined by 1.1% y/y, slower than 16.5% growth recorded in H1’2019. The performance in NFI was on the back of declined growth in fees and commission of 3.4%, which was slower than the 12.7% growth recorded in H1’2019. The low growth in fees and commission can be attributed to the recent waiver on fees on mobile transactions below Kshs 1,000 and the free bank-mobile money transfer. Banks with a large customer base who rely heavily on mobile money transactions are likely to take the biggest hit.
Universe of Coverage:
|
Banks |
Price at 21/08/2020 |
Price at 28/08/2020 |
w/w change |
YTD Change |
Year Open |
Target Price* |
Dividend Yield |
Upside/ Downside** |
P/TBv Multiple |
Recommendation |
|
Diamond Trust Bank*** |
66.0 |
65.8 |
(0.4%) |
(39.7%) |
109.0 |
136.3 |
3.9% |
110.4% |
0.3x |
Buy |
|
NCBA*** |
20.2 |
23.5 |
16.1% |
(45.2%) |
36.9 |
32.1 |
1.0% |
59.7% |
0.6x |
Buy |
|
I&M Holdings*** |
43.0 |
43.4 |
0.8% |
(20.4%) |
54.0 |
66.4 |
5.1% |
59.5% |
0.7x |
Buy |
|
KCB Group*** |
33.7 |
36.4 |
8.2% |
(37.7%) |
54.0 |
46.3 |
9.9% |
47.5% |
0.8x |
Buy |
|
Co-op Bank*** |
10.5 |
11.5 |
9.5% |
(35.8%) |
16.4 |
14.3 |
8.4% |
44.5% |
0.8x |
Buy |
|
ABSA Bank*** |
9.8 |
9.5 |
(2.5%) |
(26.7%) |
13.4 |
11.7 |
12.0% |
31.6% |
1.2x |
Buy |
|
Standard Chartered*** |
150.0 |
150.3 |
0.2% |
(25.9%) |
202.5 |
177.5 |
7.8% |
26.1% |
1.2x |
Buy |
|
Equity Group*** |
33.0 |
36.5 |
10.6% |
(38.4%) |
53.5 |
41.1 |
0.0% |
24.7% |
0.9x |
Buy |
|
Stanbic Holdings |
74.5 |
78.0 |
4.7% |
(31.8%) |
109.3 |
84.9 |
9.0% |
23.0% |
0.7x |
Buy |
|
HF Group |
4.1 |
4.0 |
(1.5%) |
(37.0%) |
6.5 |
3.9 |
0.0% |
(3.1%) |
0.2x |
Sell |
|
*Target Price as per Cytonn Analyst estimates **Upside/ (Downside) is adjusted for Dividend Yield ***For Disclosure, these are banks in which Cytonn and/ or its affiliates are invested in |
||||||||||
We are “Neutral” on equities for investors because, despite the sustained price declines, which have seen the market P/E decline to below its historical average presenting investors with attractive valuations in the market, the economic outlook remains grim.
- Residential Sector
During the week, Centum Investments, through its real estate arm, announced the launch of a Kshs 7.0 bn affordable housing development in Kasarani. The project dubbed “265 Elmer One Apartment”, will consist of approximately 268 units, comprising of studio apartments, 1 bedroom, 1 bedroom loft and 2 bedrooms apartments of 20 sqm, 40 sqm, 40 sqm and 60 sqm, respectively priced from Kshs 1.9mn (further details on the unit prices are yet to be disclosed). This follows the launch of a 365-unit housing project in Ruaraka Nairobi area by the developer in April,” 365 Pavilion Place”, comprising of 50 sqm and 56 sqm- 1 bedroom units at Kshs 4.8 mn and Kshs 6.2 mn, respectively, 75 sqm and 91 sqm- 2 bedrooms at Kshs 7.1 mn and Kshs 9.9 mn, respectively, 105 sqm- 3 bedroom at Kshs 10.0 mn and 135 sqm-3 bedroom with DSQ at Kshs 13.3 mn. The unit prices translate to an average sales price of Kshs 100,655 per SQM, 9.7% higher than the lower mid-end market average of Kshs 90,939 per SQM. The developer’s focus on Kasarani area is supported by the relatively good infrastructure providing access of the area, proximity to amenities such as Thika Road Mall (TRM) Mall and Garden City Mall, and positive demographics with Kasarani hosting a growing middle class.
Radheshyam Transport, a local go-down and general construction company, announced plans to develop a Kshs 1.0 bn residential project within Donholm, Embakasi Constituency. The project which will be constructed on a 17.2-acre piece of land will consist of 424 residential units targeting middle-income earners; 256 stand-alone maisonettes and 168 apartment units spread across 2 blocks, 7 floors each (more details about the units are yet to be disclosed). The development will also have a commercial shopping complex, a kindergarten, among other facilities. The developer’s move is an indicator of investor interest in the submarket supported by infrastructural developments such as the expansion of the Outering Road and construction of key road arteries which has increased accessibility into the area, proximity to the Nairobi CBD thus hosts a growing working population, close proximity to shopping facilities such as the Greenspan mall and positive demographics. According to Cytonn’s Nairobi Metropolitan 2020 Residential Report apartments within Donholm recorded an average occupancy of 89.6%, against a market average of 86.5%, while the rental yield increased by 0.3% points from 5.0% FY’2019 to 5.3% FY’2020.
The table below shows the performance of lower mid-end suburbs in the FY’2020,
|
Performance of Apartments in Lower Mid-End Suburbs |
|||||||
|
Area |
Average Price Per SQM |
Average rent per SQM |
Average occupancy FY’20 |
Average Annual uptake |
Average Rental Yield FY’20 |
Average Y/Y Price appreciation |
Average Total Returns |
|
Dagoretti |
101,335 |
676 |
87.0% |
21.9% |
6.2% |
3.1% |
9.3% |
|
South C |
110,644 |
589 |
96.9% |
22.7% |
6.0% |
0.1% |
6.1% |
|
Langata |
98,863 |
515 |
94.5% |
21.3% |
5.6% |
0.5% |
6.1% |
|
Donholm |
70,718 |
403 |
89.6% |
16.3% |
5.3% |
0.0% |
5.3% |
|
Upper Kabete |
88,582 |
530 |
76.1% |
23.2% |
6.0% |
(0.7%) |
5.2% |
|
Ngong Road |
96,546 |
568 |
76.2% |
23.3% |
5.3% |
(0.6%) |
4.7% |
|
Kahawa West |
69,885 |
403 |
85.6% |
13.3% |
5.9% |
(1.4%) |
4.5% |
|
Average |
90,939 |
526 |
86.6% |
20.3% |
5.8% |
0.1% |
5.9% |
Source: Cytonn Research, 2020
According to the Kenya Population and Housing Census 2019 Report, Embakasi and Kasarani were ranked as the highest populated areas within Nairobi, with approximately 988,808 and 780,656 residents, respectively, indicating the high demand for residential housing units mainly by the growing middle-income population.
The graph below shows the population distribution within Nairobi Sub-countries
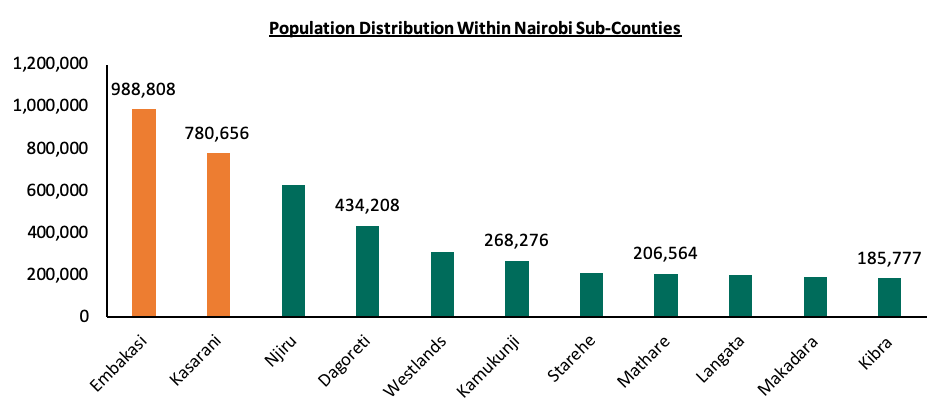
Source: Kenya National Bureau of Statistics
The residential market has witnessed continued investor focus on the low and mid-end market segments supported by:
- High demand for affordable housing options,
- Incentives by the government on affordable housing projects,
- Positive demographics with Kenya’s urbanization and population growth rate of 4.0% and 2.3% against a global average of 1.9% and 2.3% respectively according to World Bank,
- Availability of development land in the Nairobi outskirts, and
- Improving infrastructure thus opening up areas for development.
We expect increased activities on the affordable housing front as private developers seek to leverage on the above and thus complement the government efforts in achieving the Big Four Agenda on the provision of affordable housing with a target of developing 0.5 million housing units by 2020.
Kenya Commercial Bank (KCB), announced that mortgages topped the list of their Kshs 101.0 bn restructured loans. The real estate borrowers applied for a total of Kshs 22.7 bn restructuring on their loans, accounting for 22.5% of the total Kshs 101 bn restructured loans between mid-march and June. In total, KCB received 7,002 applications for restructuring and out which 640 came from the real estate sector. The building and construction sector also saw Kshs 12.3 bn restructured, which is 29.0% of the total Kshs 42.2 bn amount of loans borrowed for building and construction purposes. The restructuring followed Kenya Bankers Association announcement that reliefs would be granted to borrowers affected by COVID-19 if their repayments were up to date as at 2 March 2020. Following which banks would consider issuing extensions for repayments and other restructuring arrangements to borrowers in a bid to ease the financial strain.
In a bid to understand the impact of the Pandemic we looked at the two reports released. I.e. the Survey On Socio-Economic Impact Of Covid-19 On Households, which indicate that approximately 21.5% of households are unable to pay their rent, also as per the Credit Survey Report March 2020 the number of loan defaulters has been on the rise with the ratio of gross non-performing loans to gross loans deteriorating from 12.0% in December 2019 to 12.5% in March 2020 this means that the real estate sector will be affected in that constrained income will lead to homebuyers and renters having less to spend on housing costs, leading to slow uptake, lower home prices and lower market rents. Also, the sector will continue to record decreased development activities due to reduced inflows and dwindling Foreign Direct Investment (FDI) due to the current uncertainty. Nevertheless, in addition to the restructuring of loans, we continue to witness other government interventions aimed at cushioning the sector, among them;
- The Central Bank Rate was reduced to 7.00% to lower the cost of borrowing and lenders were urged to give reliefs on personal loans and SME loans,
- Central Bank of Kenya extended the maximum tenor of repos to 91 days to enable banks to accommodate customers for longer periods of moratorium,
- Savers were allowed the use of 40%, to a maximum of Kshs 7.0 mn of their pension savings towards purchasing a residential home, and
- Provision of a 100% tax relief for persons earning Kshs 24 000 and below monthly.
- Operationalization the Kenya Mortgage Refinance Company (KMRC)
- Retail Sector
During the week, Tuskys supermarket’s Eldoret branch located along Uganda Road was shut down by Chargless Auctioneers Limited due to rent arrears totaling to Kshs 14.0 mn. This follows the closure of the Kisumu branch located at the United Mall and Nakuru’s Midtown branch earlier in the month over rent arrears. The current financial strain is mainly attributed to strained revenues due to reduced demand, and the family wrangles among the retail chain’s shareholders thus affecting its operations. We expect retail centres to record a slump in occupancy rates due to the exit of troubled retailers such as Tuskys, while some retailers are shutting down their operations to cushion themselves against the effects emanating from the pandemic.
|
Local and international retailers that have exited or closed down outlets in Kenya |
||
|
Name of Retailer |
Initial no. of branches |
Current no. of branches |
|
Tuskys |
63 |
55 |
|
Nakumatt Holdings |
65 |
0 |
|
Botswana’s Choppies |
15 |
2 |
|
South Africa’s Shoprite |
4 |
2 |
|
Uchumi |
37 |
4 |
|
Total |
184 |
63 |
Source: Online Research
On the same note, there have been several entrants in the Kenyan retail market taking up spaces previously occupied by outgoing local and international retail chains as shown in the table below:
|
Main local and international retail supermarket chains opened in 2020 |
|
|
Name of retailer |
Number of branches |
|
QuickMart Supermarket |
3 |
|
French retailer, Carrefour |
1 |
|
South Africa’s Game Stores |
1 |
|
Naivas Supermarket |
4 |
|
Chandarana Foodplus Supermarket |
1 |
|
Total |
10 |
Source: Online Research
Tuskys is looking for capital to turn around its operations and during the week, the retailer’s board of directors confirmed that they had signed terms of agreement with an undisclosed Mauritius-based private equity fund for the provision of a financing facility amounting to approximately Kshs 2.0 bn subject to fulfilling transaction condition precedents. The funds are intended to stabilize the retailer's operations and ease financial pressure, giving it more time to negotiate the sale of a majority stake in a transaction that is underway.
In our view, the debt financing will; (i) boost the cash flows of the retailer, (ii) help clear the pressing debt issues, (iii) enable the retailer to gain control over its business, and (iv) give the retailer tax advantages because the amount that the retailer pays in interest is tax-deductible thereby reducing its net obligations.
If properly managed, we expect the debt financing to cushion the struggling retailer and enhance investor confidence in Kenya’s retail market, thus boosting the sector’s performance through fueling uptake of retail spaces. We also expect to see retailers invest in their e-commerce infrastructure and also decentralize to locations that are easily accessible from people’s homes.
We expect the real estate sector to continue on an upward trajectory with the continued focus on the affordable housing initiative by private developers and measures undertaken by financial institutions to cushion borrowers and investor confidence in Kenya’s retail market.
Susan Wojcicki the CEO of YouTube once said that; “life doesn’t always present you with the perfect opportunity at the perfect time. Opportunities come when you least expect them, or when you’re not ready for them. Rarely are opportunities presented to you in the perfect way, in a nice little box with a yellow bow on top. … Opportunities, the good ones, they’re messy and confusing and hard to recognize. They’re risky. They challenge you.” The world-over is facing unprecedented times occasioned by the prevailing Pandemic and we have seen Governments and businesses putting in place various measures to ensure continuity of the economies and businesses alike.
The role of the government is always to ensure that they provide the requisite operational environment for businesses and individuals to thrive. It is, therefore, the role of the various arms of government to work together in ensuring that we have the right fiscal and monetary policies, the right laws and that they are well implemented through the Judiciary systems to protect the citizenry.
One of the biggest requirements for businesses and individuals to do well is the availability of liquidity and this is brought about by the ability of the businesses to run profitably. Recently we have seen significant challenges with most businesses being hard hit and if we take the performance of the listed banking sector stocks to represent the overall business performance we have seen a 33% drop in the overall profitability as measured using the Earnings per Share in the half-year financial reports. From this, it is therefore important for business owners to understand: what are the key options available, to ensure that their businesses remain afloat and grow in the long term.
Companies that face significant financial challenges have various options that they can explore. These include getting in new capital either Debt or Equity or go the extra mile and request for time to restructure their businesses.
In this week’s Focus, we shall discuss the topic in three sections;
- Review business restructuring options under the law
- Case studies of businesses which have gone through the business restructuring process with different outcomes
- Key learnings and Conclusion
Section 1: Review Business Restructuring Options under the Law
Starting from the point that the biggest challenge is when a business cannot be able to raise enough cash to pay for its obligation; if this happens the company is said to be insolvent. There are two levels of this: i) where the company’s liabilities are more than the assets, and, ii) technical insolvency where the assets exceed liabilities but cannot be easily liquidated to pay off the obligations that are due. It is good to note that mere insolvency does not afford enough ground for lenders to petition for involuntary bankruptcy of the borrower or forced liquidation of the business.
The Law has continued to improve and provides alternatives on how a technically insolvent business can be assisted to get back to its feet and be able to service its creditors’ obligations and protect the interests of the other stakeholders. The available options include: (i) Administration, (ii) Company Voluntary arrangements (iii) Liquidation.
Administration of Insolvent Companies
Administration is a fairly new development in Kenyan Law. It was introduced by the Insolvency Act, No. 18 of 2015 as an alternative to liquidation, with the following key objectives;
- To maintain the company as a going concern,
- To achieve a better outcome for the company’s creditors than liquidation would offer, and
- To realize the property of the company and make distributions to secured or preferential creditors.
The process of administration is headed by an Administrator, a certified Insolvency Practitioner, who may be appointed by an administration order of the court, unsecured creditors, or a company or its directors. An administrator of a company is required to perform the administrator’s functions in the interests of the company’s creditors as a whole. The administrator is deemed an officer of the Court, whether appointed by the court or not.
Once the Administrator is appointed, they are entitled to all the records of the company and are required to present a proposal to the creditors on their plan to salvage the company. The Administrator assumes control of all the property the company is entitled to manage the affairs, and property of the company. While under administration, creditors may undertake procedures to enforce security over the company’s property, with approval from the court or an agreement with the administrator. The Administrator must therefore set a date for the creditors meeting and invite all the creditors that it knows of, having had access to the books of the company. Only creditors who have filed proof of debt before 4.00 pm of the day before the Creditors meeting are entitled to vote at the said creditor’s meeting.
At the Creditors’ meeting, the Administrator must present their proposal to the Creditors who shall vote on it. The percentage of an individual vote shall be determined by the amount of debt owed to the creditor. The creditor may opt to either vote for the proposal without amendments, vote for the proposal with amendments, or reject the proposal altogether. The decision of the creditors meeting shall be final.
Company Voluntary Arrangements
Company Voluntary Arrangements were also introduced in Kenyan law by the Insolvency Act, No. 18 of 2015. This arrangement is entered into when a company is insolvent and the directors, administrator or liquidator as the case may be, propose to the company’s shareholders and its creditors on the best way to save the company from liquidation. However, there are restrictions placed on Company Voluntary Arrangements, with the arrangement not being an option in the case of the following:
- Banking and Insurance companies,
- Companies under Administration or Liquidation,
- A Company in Respect of which a Voluntary Arrangement has been Carried Out,
- Companies in Public-Private Partnerships, and
- Companies with Liabilities of over Kshs 1.0 bn.
The Directors must appoint a person, who must be a licensed insolvency practitioner, to supervise the company for the process of implementing the voluntary arrangement. The Supervisor must within 30 days of the proposal or a longer period be allowed by the court to submit a report detailing their opinion on the viability of the proposal and whether a meeting of the creditors should be called to vote on it and the date and time of such a meeting.
On the date of the creditors’ meeting, the creditors shall appoint a chairperson who shall divide the creditors into groups of secured creditors, unsecured creditors and preferential creditors. The Creditors shall then vote either to approve the proposal as is, approve it with modifications or reject it altogether. The proposal is approved if voted for by a majority of the members and a majority of each group present at the meeting. The proposal if approved shall be binding on the company and the creditors.
Liquidation
It is also worth noting that the Insolvency Act also provides liquidation as an option, for insolvent companies. There are two modes in which a company may be wound up:-
-
- Compulsory Winding Up by the court
A company may be wound up by a court under the following circumstances,
- The company has by special resolution resolved that the company be liquidated by the Court;
- Being a public company that was registered as such on its original incorporation-
-
- The company has not been issued with a trading certificate under the Companies Act, 2015; and
- More than twelve months have elapsed since the company was registered;
- The company does not commence its business within twelve months from its incorporation or suspends business for a whole year;
- Except in the case of a private company limited by shares or by guarantee, the number of members is reduced to below two;
- The company is unable to pay its debts;
- At the time at which a moratorium for the company ends, a voluntary arrangement made does not have an effect in relation to the company; and,
- The Court is of the opinion that it is just and equitable that the company should be liquidated.
-
- Voluntary Winding Up
A company’s members/ creditors may make an application for winding up, regardless of whether the company is insolvent or not. Under voluntary liquidation, liquidation is sought by the members or creditors of the company without the interference of the court. The purpose of voluntary liquidation is that the members and creditors are left free to settle without going to court. According to section 425 of the Insolvency Act, an application to the Court for the liquidation of a company may be made by any or all of the following:
- The company or its directors;
- A creditor or creditors (including any contingent/prospective creditor(s));
- A contributor or contributors to the company;
- A provisional liquidator or an administrator of the company;
- The liquidator- if the company is in voluntary liquidation,
- An Official Receiver or any other person authorized under the other the provisions of the Act, may make a liquidation application to the Court in respect of a company that is involuntary liquidation.
Section 2: Case Studies
In this section, we look at the various companies that have experienced financial distress and consequently invoked the Insolvency Act. We shall thus look at Nakumatt Holdings, Athi River Mining (ARM) Limited, and Deacons East Africa PLC. The table below summarizes all the companies that have invoked the Insolvency Act 2015:
|
Companies That Have Invoked the Insolvency Act |
|||
|
Company |
Date taken under Administration |
Administrators |
Approximated Debt Amount (Kshs bn) |
|
Spencon Ltd |
9th January 2017 |
Kuria Muchiru & Muniu Thoithi of PwC |
Undisclosed |
|
Nakumatt Holdings |
22nd January 2018 |
Peter Kahi of PKF Consulting |
35.8 |
|
ARM Cement Ltd |
18th August 2018 |
Muniu Thoithi & George Weru of PwC |
21.7 |
|
Midland Energy |
16th November 2018 |
Anthony Makenzi & Julius Mumo of Ernst & Young LLP |
Undisclosed |
|
Deacons East Africa PLC |
18th November 2018 |
Peter Kahi & Atul Shag of PKF Consulting |
0.7 |
Case Study of Nakumatt Holdings
Nakumatt Holdings is a Kenyan supermarket chain. Until February 2017, Nakumatt was regarded as the largest Kenyan retailer, with 62 branches across the region, (45 in Kenya, 9 in Uganda, 5 in Tanzania and 3 in Rwanda) and a gross turnover of Kshs 52.2 bn. However, what was fueling Nakumatt’s rapid expansion was funded through debt. This included short-term borrowings, bank loans and letters of credit to its numerous suppliers. However, due to a number of reasons, Nakumatt started experiencing serious cash-flow difficulties in 2016. The retailer was therefore unable to meet its financial obligations to landlords, its suppliers and employees. It was for these reasons that the administrator was appointed by an order of the court pursuant to an application filed by unsecured creditors, and Nakumatt Holdings was placed under administration in January 2018.
PKF Consulting Limited (PKF) was appointed as Nakumatt Holdings’ administrator. This was to assess the possibility that the company could be revived after a full assessment of the company, and for all creditors of Nakumatt to come forward and register their claims with the retailer.
Following the assessment of Nakumatt’s financial position, the administrator determined that if a liquidation route was used, then out of the total creditors of Kshs 35.8 bn, Kshs 30.6 bn are unlikely to be paid. This represents a significant 85% potential loss to the creditors. In essence, all unsecured creditors, namely Trade Creditors, Commercial Paper Holders and Short Term Noteholders, and private placement loan providers will suffer the maximum 100% loss of their debt amounts, as the available assets would first pay off secured creditors. Since the business model of Nakumatt can support a better outcome for all the creditors as compared to a liquidation scenario, the Administrator set out to come up with a restructuring proposal to achieve this outcome based on the company remaining a going concern.
Nakumatt’s administrator came back to creditors with proposals, which we highlighted in our focus note, Restructuring an Insolvent Business, that the creditors were supposed to take a vote on, and if deemed fit, the company shall adopt as the way forward. In our view, the proposals brought forth were not equitable and fair to all creditors. In addition, they failed to inspire confidence especially with the major stakeholders, required to turn around the business, especially suppliers, landlords, and employees. We thus concur with the creditors who rejected the deal in the current format.
We noted that the best-case scenario for all creditors is a debt to equity conversion of their creditor claims, as liquidation is not in the best interest of anyone. This should include even the banks who had taken preferential debt. Case in point being, the recent restructuring of Kenya Airways. In the case of Kenya Airways’ restructuring, the Government and several banks converted their debt into equity to the tune of Kshs 59.0 bn. The Government’s stake in Kenya Airways rose to 46.5% from 29.8% before the debt to equity conversion, while the bank’s consortium (KQ Lenders Co.) ended up owning 35.7% of the company. Ordinary shareholders who did not inject additional equity were diluted by 95.0%.
In conclusion, we note that the proposed procedures, in line with the Insolvency Act, accorded Nakumatt with a second chance, to pursue the ongoing recovery strategy, dubbed “Nakumatt Bounce Back” but it was later in 2020 voted that the company could not continue with its operations and the creditors voted for its winding up.
Case Study of Athi River Mining (ARM) Cement
ARM is a Kenyan manufacturing company listed at the Nairobi Securities Exchange, with operations in Kenya, Tanzania and Rwanda. The firm specializes in the production of cement, fertilizers, quicklime, and other industrial minerals. ARM cement, once a stable company, started experiencing difficulty in 2016, as the firm’s revenue lines started decreasing, with revenue declining by 32.0% from Kshs 12.8 bn in FY’2016 to Kshs 8.7 bn in FY’2017, coupled with the rising operating expenses, which rose by 34.8% to Kshs 3.1 bn from Kshs 2.3 bn in FY’2016. This saw the operating loss widen to Kshs 4.2 bn in FY’2017 from Kshs 0.3 bn in FY’2016, and consequently the loss after tax widened by 87.5% to Kshs 7.5 bn in FY’2017 from Kshs 4.0 bn in FY’2016. The shrinking revenue lines were largely attributed to stiff competition in the cement industry both in Kenya and Tanzania, the company’s main revenue contributors. The declining performance pushed the company into a negative working capital position, further exacerbating the poor performance, thereby rendering the company unable to service its debt obligations to various creditors, such as:-
- UBA Bank Kenya, which provided the company with a Kshs 500.0 mn short term loan,
- Africa Finance Corporation (AFC), which provided a Kshs 4.6 bn loan, and,
- Stanbic Bank Kenya, which provided the company with a Kshs 3.2 bn loan.
Unable to service these obligations, the company was then placed under administration in August 2018, with PwC’s Muniu Thoithi and George Weru appointed as the administrators. The administrators, having full control held a creditor’s meeting in October 2018, where creditors voted to give the administrators up to September 2019, to revive the company. The creditors also approved the sale of some or even all of the company’s assets, and capital injections from strategic investors as part of the strategies to revive the company. With the administrators writing off the Kshs 21.3 bn in loans advanced to its Tanzanian Subsidiary, due to alleged misrepresentation of the loan given that it had been non-performing for several years and that the subsidiary was deemed unable to repay the loan any time soon, the company slipped to a negative equity position of Kshs 2.4 bn, effectively meaning a complete write-off for shareholders in the event of a liquidation, and that only secured lenders are now fully covered by the current Kshs 14.2 bn asset base. The administrators have appointed Knight Frank to undertake a valuation of the company’s fixed assets, amid concerns of misrepresentation, and suspicious dealings amounting to Kshs 153.0 mn. With the administrators currently engaged in the asset sales of the various subsidiaries, this would provide the company with a capital base to boost and streamline the core operations. We also note that the proposed move to look for a strategic investor may also provide a reprieve, with several major companies such as Dangote Cement and Oman Based Raylat limited expressing interest in acquiring the troubled lender. The Insolvency Act has thus enabled the company to remain operational as it undertakes the turnaround strategy, focused on ensuring the company attains good financial health and consequently improving its debt-servicing capability to its creditors.
Section 3: Key learnings and Conclusion
It is important for business owners to fully understand the insolvency act as it helps in:
- First offers struggling businesses a second chance to reorganize themselves and come out stronger and viable businesses, and,
- Secondly, it will encourage entrepreneurship by providing a path to redemption in the case of a viable venture that has run into turbulence and just needs room to restructure. Research has shown that the availability of reorganization frameworks encourages entrepreneurship.
As people look at the options of restructuring, it is important that the various stakeholders approach it from a Win-Win mindset and be open to getting help as they redesign their businesses. Liquidation as an option gives the least value for all stakeholders and in the case of unsecured lenders of Nakumatt got zero and even the secured lenders got very little out of the sale of assets. Given the diverse shareholding of Athi River, the Asset sales may mean that some of the loans especially at subsidiary levels shall be paid. With the companies under administration and moratorium after invoking the Act, they are not subject to debt repayment obligations, as the administrators focus purely on the best possible resolution strategy to the creditors, and possibly to the shareholders. This will possibly encourage entrepreneurship, as business owners will be accorded time to restructure, and possibly regain their financial stability. This then consequently ensures that creditors and possibly shareholders recoup their lent amounts, and invested capital. The previous resolution mechanism under the Companies Act means that stakeholders faced the possibility of a wipeout of a significant amount, especially in the event the company’s assets failed to cover the liabilities. Thus given that these are the first instances of private sector insolvency restructuring in Kenya under the new Act, it is important that they are done professionally and with due care since they set a precedent for future cases.
Disclaimer: The views expressed in this publication are those of the writers where particulars are not warranted. This publication is meant for general information only and is not a warranty, representation, advice or solicitation of any nature. Readers are advised in all circumstances to seek the advice of a registered investment advisor.

- Talk to us
- Kenya
- P.O Box 20695 - 00200, Nairobi, Kenya
- Cell +254709101200
- Tel +254709101200
- WhatsApp +254741676635
- United States
- +254709101200
- DOWNLOAD OUR APP
-


- Kenya
- 8th Floor, Pinetree Plaza, Kaburu Drive, Ngong Road, Nairobi, Kenya
- USA
- Suite 1150, 1775 Eye Street NW, USA, Washington DC 20006, USA
- Investments
- High Yield
- Private Equity
- Real Estate
- Real Estate
- RiverRun Estates
- Cytonn Towers
- The Ridge
- Taraji Heights
- The Alma