Currency and Interest Rates Outlook, & Cytonn Weekly #07/2023
By Research Team, Feb 19, 2023
Executive Summary
Fixed Income
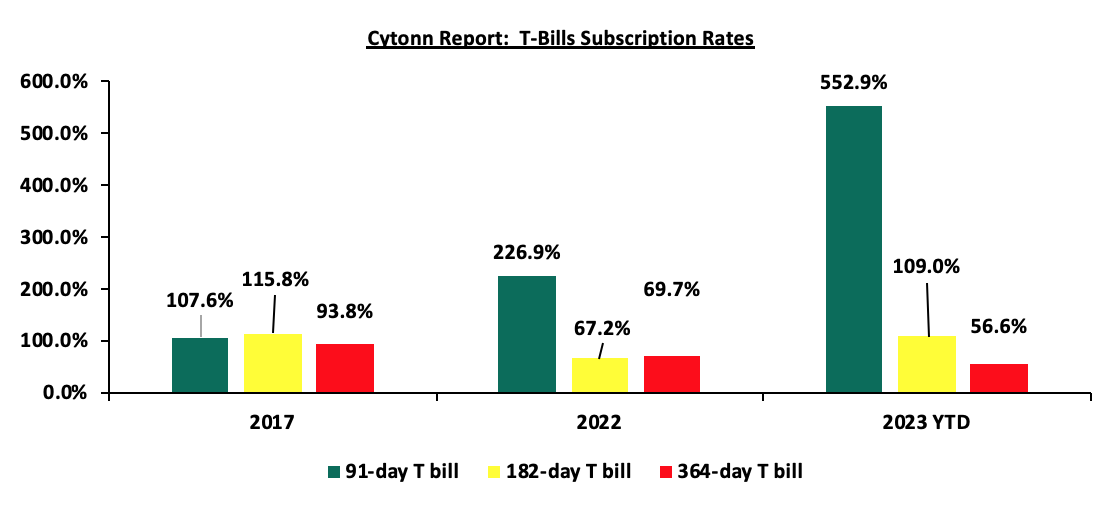
During the week, T-bills remained oversubscribed, with the overall subscription rate coming in at 191.3%, up from 187.1%, recorded the previous week, partly attributable to the eased liquidity in the money market with the average interbank rate declining to 6.2% from 6.5% recorded the previous week. Investor’s preference for the shorter 91-day paper persisted as they sought to avoid duration risk, with the paper receiving bids worth Kshs 22.1 bn against the offered Kshs 4.0 bn, translating to a subscription rate of 552.2%, albeit lower than the 780.0% recorded the previous week. The subscription rates for the 364-day and 182-day papers increased to 63.0% and 175.3% from 43.8% and 93.3%, respectively, recorded the previous week. The yields on the government papers were on an upward trajectory, with the yields on the 364-day, 182-day and 91-day papers increasing by 3.5 bps, 3.7 bps and 2.2 bps to 10.6%, 10.1% and 9.6%, respectively;
In the Primary Bond Market, the government was seeking to raise additional Kshs 10.0 bn for budgetary support in FY’2022/2023 by offering a tap sale of fixed coupon treasury bonds FXD1/2017/010 and FXD1/2023/010, with tenors to maturity of 4.4 years and 10.0 years, respectively. The bonds received bids worth Kshs 12.5 bn translating to an oversubscription rate of 124.6% with the government accepting bids worth Kshs 12.2 bn, translating to an acceptance rate of 97.9%. The weighted average yield for the two bonds FXD1/2017/010 and FXD1/2023/010 is 13.9% and 14.2%, respectively, while the coupon rates are 13.0% and 14.2%, respectively. Key to note, the government is also seeking to raise an additional Kshs 50.0 bn for funding infrastructural projects in the FY’2022/2023 by issuing a new bond IFB1/2023/17 with a tenor of 17 years. The bidding period for the bond closes on 7th March, 2023, with the auction date scheduled on 8th March, 2023. We anticipate the bond to record a high subscription rate given its tax free nature as is the case with infrastructure bonds. Our recommended bidding range for the bond is 13.7% to 14.2% based on bonds of similar tenor trading range;
Additionally, during the week, the National Treasury gazetted the revenue and net expenditures for the seven months of FY’2022/2023, ending 31th January 2023. Also, the National Treasury released the Final 2023 Budget Policy Statement, which was the first to be prepared under the new administration. This follows the release of the Draft of the 2023 Budget Policy Statement in January 2023. The policy statement stipulates the administration priority programs, policies and reforms to be implemented in the Medium-Term Expenditure Framework (MTEF);
During the week, the Energy and Petroleum Regulatory Authority (EPRA) released their monthly statement on the maximum retail fuel prices in Kenya effective 15th February 2023 to 14th March 2023. Notably, fuel prices remained unchanged for the third consecutive month at Kshs 177.3, Kshs 162.0 and Kshs 145.9 per litres of Super Petrol, Diesel and Kerosene, respectively;
Equities
During the week, the equities market recorded mixed performance, with NASI declining by 0.2%, while NSE 20 and NSE 25 gained by 0.5% and 0.2%, respectively, taking the YTD performance to gains of 0.5%, 0.3% and 1.7% for NASI, NSE 20, and NSE 25, respectively. The equities market performance was mainly driven by losses recorded by large cap stocks such as Bamburi and Safaricom of 1.2% and 1.0%, respectively. The losses were however mitigated by gains recorded by other large cap stocks such as BAT Kenya, Standard chartered Bank Kenya (SCBK) and Equity Group of 7.8%, 2.1% and 1.8% respectively;
During the week, British American Tobacco Kenya Plc released their FY’2022 financial results, recording a 6.3% growth in Profits after Tax (PAT) to Kshs 6.9 bn in FY’2022, from Kshs 6.5 bn recorded in FY’2021, majorly attributed to the 5.5% increase in Gross Sales to Kshs 42.2 bn in FY’2022 from Kshs 40.0 bn recorded in FY’2021;
Real Estate
During the week, the Architectural Association of Kenya (AAK) released the Status of The Built Environment Report January - December 2022, which highlighted curtailed growth rates in the Real Estate and construction sectors, with both sectors registering downward trends throughout the year. In the residential sector, Centum Real Estate, the development affiliate of Centum Investment Company PLC, completed the construction of phase one of its 32 luxurious four-bedroom duplexes dubbed ‘Loft Residences’, which sits on 3.9 acres situated in Two Rivers. Additionally, Madison Insurance entered into a Joint-Venture (JV) agreement with Housing Finance Company (HFC), a subsidiary of HF Group, to develop a Master Planned Community project dubbed ‘Villakazi Homes’ in Athi River, Machakos County. In the retail sector, local retail chain Cleanshelf Supermarket opened a new outlet located in Greenpark Estate along Mombasa road, Athi River bringing the retailer’s number of operating outlets countrywide to 13. In the infrastructure sector, Kenya Railways Corporation (KRC) commenced construction of the first phase of the Kshs 30.0 bn Railway City project which was launched in by President William Ruto in December 2022. In the Real Estate Investment Trusts (REITs) segment, Fahari I-REIT closed the week trading at an average price of Kshs 6.2 per share on the Nairobi Securities Exchange remaining relatively unchanged from the previous week. On the Unquoted Securities Platform, Acorn D-REIT and I-REIT closed the week ending 17th February 2023 trading at Kshs 23.9 and Kshs 20.9 per unit, respectively, a 19.4% and 4.4% gain for the D-REIT and I-REIT, respectively, from the Kshs 20.0 inception price;
Focus of the Week
The Kenyan shilling has recorded a Year to date depreciation of 1.8% against the US Dollar to close at Kshs 125.6 as at 17th February 2022, from Kshs 123.4 on 3rd January 2023, adding to a 9.0% depreciation in 2022 and further depreciation of 3.6% and 7.7% in 2021 and 2020 respectively. Key to note, this is the lowest the Kenyan shilling has gone against the dollar. The continued depreciation has been mainly driven by an ever present current account with of Kenya being a net importer and the import bill being in US Dollars. Being a net importer has also left Kenya susceptible to external shocks that have inflated the import bill and negatively affected the shilling such as the high global crude oil prices occasioned by persistent supply chain constraints worsened by the ongoing Russia-Ukraine conflict. The inflated import bill has led to increased dollar demand from importers against a lower supply of hard currency. Additionally, the aggressive public debt accumulation, especially external debt at a 10-year CAGR of 19.0% to Kshs 4.8 tn in December 2022, from Kshs 0.8 tn in the same period in 2012 has continued to exert pressure on the Kenyan shilling, due to the increased servicing costs, considering that 69.3% of the external debt stock is in US Dollars. Currency depreciation coupled with uncertainties such as elevated inflationary pressures on the Kenyan economy has seen government securities yields increase as investors attach higher premiums to compensate for the additional risk. Notably, in December 2022, Fitch Ratings downgraded Kenya's Long-Term Foreign-Currency Issuer Default Rating (IDR) to ‘B’ from 'B+' with a Stable Outlook. The downgrade was mainly attributable to Kenya's persistent fiscal and external deficits, high public debt and high external financing costs which presently constrain access to international capital markets. This week we shall do an in-depth analysis of the factors that are expected to drive the performance of the Kenya shilling and the interest rates and thereafter give our outlook for 2023;
Investment Updates:
- Weekly Rates:
- Cytonn Money Market Fund closed the week at a yield of 10.75%. To invest, dial *809# or download the Cytonn App from Google Playstore here or from the Appstore here;
- Cytonn High Yield Fund closed the week at a yield of 13.69% p.a. To invest, email us at sales@cytonn.com and to withdraw the interest, dial *809# or download the Cytonn App from Google Playstore here or from the Appstore here;
- We continue to offer Wealth Management Training every Wednesday and every third Saturday of the month, from 9:00 am to 11:00 am, through our Cytonn Foundation. The training aims to grow financial literacy among the general public. To register for any of our Wealth Management Trainings, click here;
- If interested in our Private Wealth Management Training for your employees or investment group, please get in touch with us through wmt@cytonn.com;
- Any CHYS and CPN investors still looking to convert are welcome to consider one of the five projects currently available for assignment, click here for the latest term sheet;
- Cytonn Insurance Agency acts as an intermediary for those looking to secure their assets and loved ones’ future through insurance namely; Motor, Medical, Life, Property, WIBA, Credit and Fire and Burglary insurance covers. For assistance, get in touch with us through insuranceagency@cytonn.com;
- Cytonnaire Savings and Credit Co-operative Society Limited (SACCO) provides a savings and investments avenue to help you in your financial planning journey. To enjoy competitive investment returns, kindly get in touch with us through clientservices@cytonn.com;
Real Estate Updates:
- For an exclusive tour of Cytonn’s real estate developments, visit: Sharp Investor's Tour, and for more information, email us at sales@cytonn.com;
- Phase 3 of The Alma is now ready for occupation and the show house is open daily. To rent please email properties@cytonn.com;
- We have 8 investment-ready projects, offering attractive development and buyer targeted returns; See further details here: Summary of Investment-ready Projects;
- For Third Party Real Estate Consultancy Services, email us at rdo@cytonn.com;
- For recent news about the group, see our news section here;
Hospitality Updates:
- We currently have promotions for Staycations. Visit cysuites.com/offers for details or email us at sales@cysuites.com;
Money Markets, T-Bills Primary Auction:
During the week, T-bills remained oversubscribed, with the overall subscription rate coming in at 191.3%, up from 187.1%, recorded the previous week, partly attributable to the eased liquidity in the money market with the average interbank rate declining to 6.2% from 6.5% recorded the previous week. Investor’s preference for the shorter 91-day paper persisted as they sought to avoid duration risk, with the paper receiving bids worth Kshs 22.1 bn against the offered Kshs 4.0 bn, translating to a subscription rate of 552.2%, albeit lower than the 780.0% recorded the previous week. The subscription rates for the 364-day and 182-day papers however increased to 63.0% and 175.3% from 43.8% and 93.3%, respectively, recorded the previous week. The yields on the government papers were on an upward trajectory, with the yields on the 364-day, 182-day and 91-day papers increasing by 3.5 bps, 3.7 bps and 2.2 bps to 10.6%, 10.1% and 9.6%, respectively. The Government accepted Kshs 44.7 bn worth of bids out of the Kshs 45.9 bn worth of bids received, translating to an acceptance rate of 97.4%. The graph below compares the overall T- bills subscription rates obtained in 2017, 2022 and 2023 Year to Date (YTD):
In the Primary Bond Market, the government was seeking to raise additional Kshs 10.0 bn for budgetary support in FY’2022/2023 by offering a tap sale of fixed coupon treasury bonds issue numbers FXD1/2017/010 and FXD1/2023/010, with tenors to maturity of 4.4 years and 10.0 years, respectively. The bonds received bids worth Kshs 12.5 bn translating to an oversubscription rate of 124.6% and the government accepted bids worth Kshs 12.2 bn, translating to an acceptance rate of 97.9%. The weighted average yield for the two bonds FXD1/2017/010 and FXD1/2023/010 are 13.9% and 14.2%, respectively, while the coupon rates are 13.0% and 14.2%, respectively. Key to note, the government is also seeking to raise an additional Kshs 50.0 bn for funding infrastructural projects in the FY’2022/2023 by issuing a new bond IFB1/2023/17 with a tenor of 17 years. The bidding period for the bond closes on 7th March, 2023, with the auction date scheduled on 8th March, 2023. We anticipate the bond to record a high subscription rate given its tax free nature as is the case with infrastructure bonds. Our recommended bidding range for the bond is 13.7% to 14.2% based on bonds of similar tenor trading range.
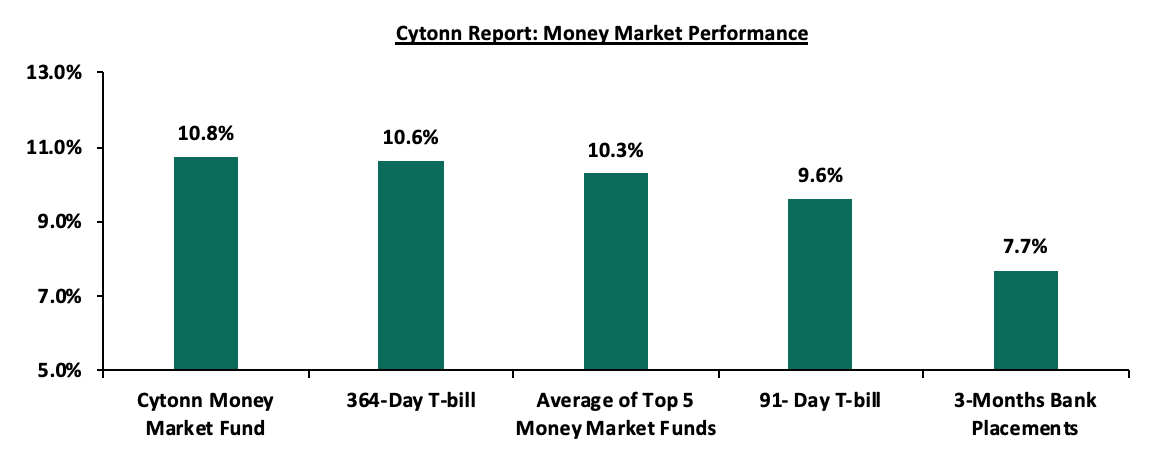
In the money markets, 3-month bank placements ended the week at 7.7% (based on what we have been offered by various banks), while the yield on the 364-day T-bill and 91-day T-bill increased by 3.5 bps and 2.2 bps to 10.6% and 9.6%, respectively. The average yield on the Top 5 Money Market Funds increased by 10.0 bps to 10.3% from 10.2% recorded the previous week, while that of Cytonn Money Market Fund remained unchanged at 10.8%.
The table below shows the Money Market Fund Yields for Kenyan Fund Managers as published on 17th February 2023:
|
Cytonn Report: Money Market Fund Yield for Fund Managers as published on 17th February 2023 |
||
|
Rank |
Fund Manager |
Effective Annual Rate |
|
1 |
Cytonn Money Market Fund (dial *809# or download Cytonn App) |
10.8% |
|
2 |
Apollo Money Market Fund |
10.5% |
|
3 |
GenCap Hela Imara Money Market Fund |
10.2% |
|
4 |
Dry Associates Money Market Fund |
10.2% |
|
5 |
Zimele Money Market Fund |
9.9% |
|
6 |
NCBA Money Market Fund |
9.9% |
|
7 |
Old Mutual Money Market Fund |
9.8% |
|
8 |
Kuza Money Market fund |
9.8% |
|
9 |
Sanlam Money Market Fund |
9.8% |
|
10 |
Nabo Africa Money Market Fund |
9.7% |
|
11 |
AA Kenya Shillings Fund |
9.7% |
|
12 |
Madison Money Market Fund |
9.4% |
|
13 |
Co-op Money Market Fund |
9.2% |
|
14 |
CIC Money Market Fund |
9.2% |
|
15 |
British-American Money Market Fund |
9.2% |
|
16 |
ICEA Lion Money Market Fund |
8.8% |
|
17 |
Orient Kasha Money Market Fund |
8.8% |
|
18 |
Absa Shilling Money Market Fund |
7.9% |
|
19 |
Equity Money Market Fund |
7.6% |
Source: Business Daily
Liquidity:
During the week, liquidity in the money markets eased, with the average interbank rate declining to 6.2% from 6.5% recorded the previous week, partly attributable to government payments that offset tax remittances. The average interbank volumes traded declined by 14.4% to Kshs 21.5 bn from Kshs 25.1 bn recorded the previous week.
Kenya Eurobonds:
During the week, the yields on Eurobonds recorded mixed performance, with the yield on the 10-year Eurobond issued in 2014 recording the largest gain, having gained by 0.9% points to 11.7% from 10.8%, recorded the previous week. The yield on the 10-year Eurobond issued in 2018 declined by 0.4% points to 10.5% from 10.9% recorded the previous week. The table below shows the summary of the performance of the Kenyan Eurobonds as of 16th February 2023;
|
Cytonn Report: Kenya Eurobonds Performance |
||||||
|
|
2014 |
2018 |
2019 |
2021 |
||
|
Date |
10-year issue |
10-year issue |
30-year issue |
7-year issue |
12-year issue |
12-year issue |
|
Amount Issued (USD bn) |
2.0 |
1.0 |
1.0 |
2.1* |
1.0 |
|
|
Years to Maturity |
1.3 |
5.0 |
25.0 |
4.2 |
9.2 |
11.3 |
|
Yields at Issue |
6.6% |
7.3% |
8.3% |
7.0% |
7.9% |
6.2% |
|
2-Jan-23 |
12.9% |
10.5% |
10.9% |
10.9% |
10.8% |
9.9% |
|
1-Feb-23 |
11.2% |
10.2% |
10.6% |
10.5% |
10.3% |
9.8% |
|
9-Feb-23 |
10.8% |
10.9% |
10.5% |
10.2% |
10.2% |
9.8% |
|
10-Feb-23 |
11.3% |
10.3% |
10.8% |
10.7% |
10.6% |
10.0% |
|
13-Feb-23 |
11.4% |
10.4% |
10.8% |
10.8% |
10.6% |
10.0% |
|
14-Feb-23 |
11.2% |
10.3% |
10.7% |
10.7% |
10.5% |
10.0% |
|
15-Feb-23 |
11.6% |
10.4% |
10.8% |
10.7% |
10.6% |
10.0% |
|
16-Feb-23 |
11.7% |
10.5% |
10.8% |
10.8% |
10.6% |
10.1% |
|
Weekly Change |
0.9% |
(0.4%) |
0.3% |
0.6% |
0.4% |
0.3% |
|
MTD Change |
0.5% |
0.3% |
0.2% |
0.3% |
0.3% |
0.3% |
|
YTD Change |
(1.2%) |
0.0% |
(0.1%) |
(0.1%) |
(0.2%) |
0.2% |
*2019 aggregate amount issued for the two issues was USD 2.1 bn
Source: Central Bank of Kenya (CBK)
Kenya Shilling:
During the week, the Kenyan shilling depreciated by 0.4% against the US dollar to close the week at Kshs 125.6, from Kshs 125.1 recorded the previous week, partly attributable to increased dollar demand from importers, especially oil and energy sectors against a slower supply of hard currency. On a year to date basis, the shilling has depreciated by 1.8% against the dollar, adding to the 9.0% depreciation recorded in 2022. We expect the shilling to remain under pressure in 2023 as a result of:
- High global crude oil prices on the back of persistent supply chain bottlenecks coupled with high demand,
- An ever-present current account deficit estimated at 4.9% of GDP in 2022, despite improving by 0.3% points from 5.2% recorded in 2021, and,
- The need for Government debt servicing which continues to put pressure on forex reserves given that 69.3% of Kenya’s External debt was US Dollar denominated as of October 2022.
The shilling is however expected to be supported by:
- Improving diaspora remittances standing at USD 349.4 mn as at January 2023, representing a 3.2% y/y increase from USD 338.7 mn recorded in a similar period in 2022.
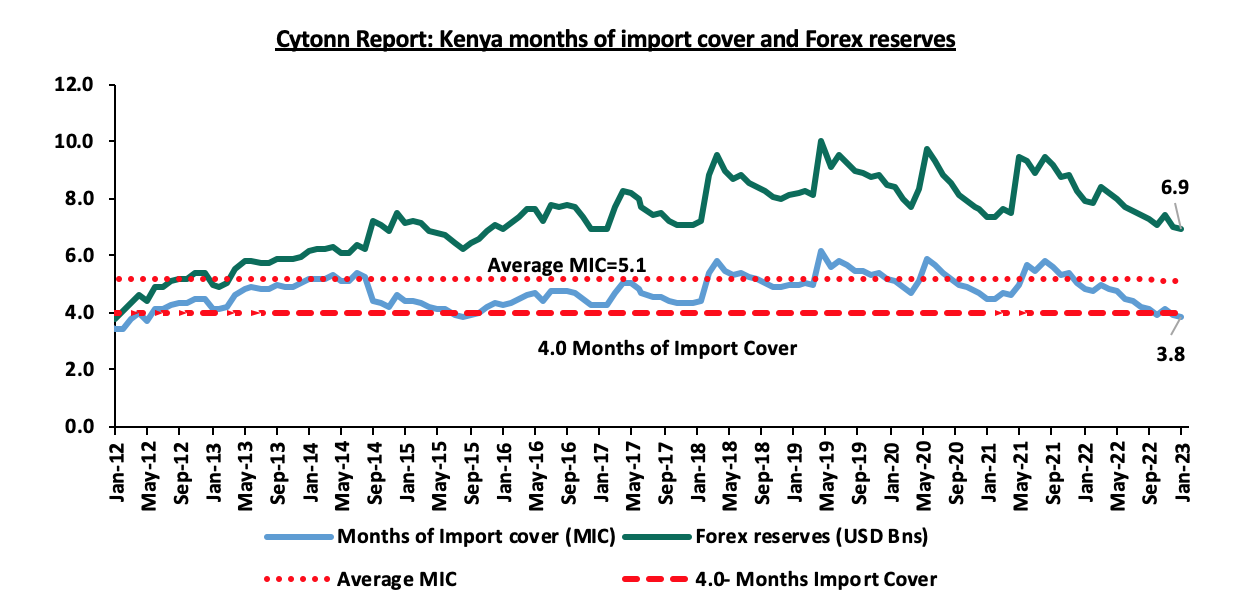
Key to note, Kenya’s forex reserves declined by 0.9% to remain relatively unchanged at USD 6.9 bn as of 16th February 2023. As such, the country’s months of import cover dropped to 3.8 months from 3.9 months recorded the previous week, and are marginally below the statutory requirement of maintaining at least 4.0-months of import. The chart below summarizes the evolution of Kenya months of import cover over the last 10 years;
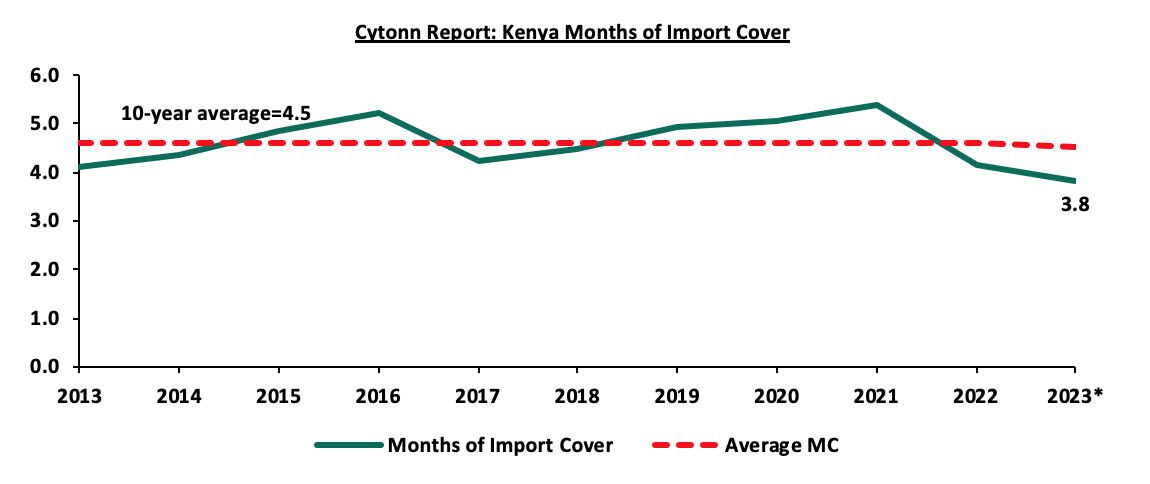
*Figure as of 17th February 2023
Weekly Highlight:
- Revenue and Net Exchequer for FY’2022/23
During the week, the National Treasury gazetted the revenue and net expenditures for the seven months of FY’2022/2023, ending 31th January 2023. Below is a summary of the performance:
|
Cytonn Report: FY'2022/2023 Budget Outturn - As at 31st January 2023 |
|||||
|
Amounts in Kshs billions unless stated otherwise |
|||||
|
Item |
12-months Original Estimates |
Actual Receipts/Release |
Percentage Achieved |
Prorated |
% achieved of prorated |
|
Opening Balance |
|
0.6 |
|
|
|
|
Tax Revenue |
2,071.9 |
1,104.8 |
53.3% |
1,208.6 |
91.4% |
|
Non-Tax Revenue |
69.7 |
36.2 |
52.0% |
40.6 |
89.1% |
|
Total Revenue |
2,141.6 |
1,141.6 |
53.3% |
1,249.3 |
91.4% |
|
External Loans & Grants |
349.3 |
193.2 |
55.3% |
203.8 |
94.8% |
|
Domestic Borrowings |
1,040.5 |
304.2 |
29.2% |
606.9 |
50.1% |
|
Other Domestic Financing |
13.2 |
15.3 |
115.9% |
7.7 |
198.6% |
|
Total Financing |
1,403.0 |
512.8 |
36.6% |
818.4 |
62.7% |
|
Recurrent Exchequer issues |
1,178.4 |
654.0 |
55.5% |
687.4 |
95.1% |
|
CFS Exchequer Issues |
1,571.8 |
684.7 |
43.6% |
916.9 |
74.7% |
|
Development Expenditure & Net Lending |
424.4 |
145.5 |
34.3% |
247.6 |
58.8% |
|
County Governments + Contingencies |
370.0 |
161.2 |
43.6% |
215.8 |
74.7% |
|
Total Expenditure |
3,544.6 |
1,645.4 |
46.4% |
2,067.7 |
79.6% |
|
Fiscal Deficit excluding Grants |
1,403.0 |
503.8 |
35.9% |
818.4 |
61.6% |
|
Total Borrowing |
1,389.8 |
497.5 |
35.8% |
810.7 |
61.4% |
Source: National Treasury and Kenya Gazette
Key takeouts from the release include;
- Total revenue collected as at the end of January 2023 amounted to Kshs 1,141.6 bn, equivalent to 53.3% of the original estimates of Kshs 2,141.6 bn for FY’2022/2023 and is 91.4% of the prorated estimates of Kshs 1,249.3 bn. We note that the government has not been able to meet its prorated revenue targets seven months into the FY’2022/2023 partly attributable to the tough macroeconomic environment in the country as a result of elevated inflationary pressures with January 2023 coming in at 9.0%, above the Central Bank of Kenya (CBK) ceiling of 7.5%. Cumulatively, tax revenues amounted to Kshs 1,104.8 bn, equivalent to 53.3% of the original estimates of Kshs 2,071.9 bn and 91.4% of the prorated estimates of Kshs 1,208.6 bn,
- Total financing amounted to Kshs 512.8 bn, equivalent to 36.6% of the original estimates of Kshs 1,403.0 bn and is equivalent to 62.7% of the prorated estimates of Kshs 818.4 bn. Additionally, domestic borrowing amounted to Kshs 304.2 bn, equivalent to 29.2% of the original estimates of Kshs 1,040.5 bn and is 50.1% of the prorated estimates of Kshs 606.9 bn,
- The total expenditure amounted to Kshs 1,645.4 bn, equivalent to 46.4% of the original estimates of Kshs 3,544.6 bn, and is 79.6% of the prorated target expenditure estimates of Kshs 2,067.7 bn. Additionally, the net disbursements to recurrent expenditures came in at Kshs 654.0 bn, equivalent to 55.5% of the original estimates of Kshs 1,178.4 bn and 95.1% of the prorated estimates of Kshs 687.4 bn,
- Consolidated Fund Services (CFS) Exchequer issues (refers to the Consolidated Fund established in the Kenya’s constitution into which development partners deposit funds before disbursing to the Exchequer accounts for projects such as servicing of public debt, payment of pensions and gratuities, salaries and allowances and subscription to International Organizations) came in at Kshs 684.7 bn, equivalent to 43.6% of the original estimates of Kshs 1,571.8 bn, and are 74.7% of the prorated amount of Kshs 916.9 bn. The cumulative public debt servicing cost amounted to Kshs 627.3 bn which is 45.0% of the original estimates of Kshs 1,393.1 bn, and is 77.2% of the prorated estimates of Kshs 812.7 bn. Notably, the Kshs 627.3 bn debt servicing cost is equivalent to 55.0% of the actual revenues collected as at the end of January 2023, further emphasizing on how much public debt weighs on the country’s expenditure. Additionally, Recurrent Exchequer issues came in at Kshs 654.0 bn equivalent to 55.5% of the original estimates of Kshs 1,178.4 bn and are 95.1% of the prorated estimates of Kshs 687.4, and,
- Total Borrowings as at the end of January 2023 amounted to Kshs 497.5 bn, equivalent to 35.8% of the original estimates of Kshs 1,389.8 bn for FY’2022/2023 and are 61.4% of the prorated estimates of Kshs 810.7 bn. The cumulative domestic borrowing target of Kshs 1,040.5 bn comprises of adjusted Net domestic borrowings of Kshs 579.1 bn and Internal Debt Redemptions (Roll-overs) of Kshs 461.4 bn.
The revenue performance for the seven months of the FY’2022/2023, reflects the current economic woes emanating from the elevated inflationary pressures coupled with sustained supply chain constraints. The business environment has consequently been adversely affected by high cost of production coupled with subdued customer demand which continues to hurt tax collections. However, the business environment has remained resilient evidenced by the rise in Purchasing Managers Index (PMI) to 52.0 in January 2023, from 51.6 recorded in December 2022. Additionally, the average PMI for the last 5 months has come in at 51.3, above the 50.0 contraction mark, indicating a sustained recovery in the business environment despite the global downturn. Furthermore, the government is keen on reforming its tax policies in order to scale up its revenue collections effort, which includes; reduction of Value Added Tax (VAT) gap from 38.9% to 19.8% of the potential by fully rolling out electronic Tax Invoice Management System (eTIMS), integration of KRA tax system with the Telecommunication companies, tax base expansion in the informal sector, implementation of rental income tax measures by mapping rental properties and roll out of measures at the Customs and Border Control leveraging on technology. However, we are adamant that the global economic down turn underpinned by the elevated inflationary pressures, as well as persistent supply chain constraints will continue to hamper economic activities in the country in the short to medium term.
- Budget Policy Statement
During the week, the National Treasury released the Final 2023 Budget Policy Statement, which was the first to be prepared under the new administration. This follows the release of the Draft of the 2023 Budget Policy Statement in January 2023. The policy statement stipulates the administration priority programs, policies and reforms to be implemented in the Medium-Term Expenditure Framework (MTEF). The table below shows major changes in the Budget Policy Statement from the draft:
|
Cytonn Report: Comparison of Draft and Final Budget Policy Statement 2023 |
|||
|
|
FY'2023/2024 DBPS |
FY2023/2024 FBPS |
Change between the draft and Final BPS |
|
Total revenue |
2,897.7 |
2,894.4 |
(0.1%) |
|
External grants |
48.1 |
48.1 |
0.0% |
|
Total revenue & external grants |
2,945.8 |
2,942.5 |
(0.1%) |
|
Recurrent expenditure |
2,422.3 |
2,459.3 |
1.5% |
|
Development expenditure & Net Lending |
796.4 |
769.3 |
(3.4%) |
|
County governments + contingencies |
422.3 |
422.9 |
0.1% |
|
Total expenditure |
3,641.0 |
3,651.5 |
0.3% |
|
Fiscal deficit excluding grants |
743.3 |
757.1 |
1.9% |
|
Deficit as % of GDP |
4.3% |
4.4% |
0.1% |
|
Net foreign borrowing |
198.6 |
198.6 |
0.0% |
|
Net domestic borrowing |
496.6 |
521.5 |
5.0% |
|
Total borrowing |
695.2 |
720.1 |
3.6% |
|
GDP Estimate |
16,290.3 |
16,290.3 |
0.0% |
N/B: DBPS = Draft Budget Policy Statement; FBPS = Final Budget Policy Statement
Key takeout’s from the table include;
- The total projected revenue revised downward marginally by 0.1% to Kshs 2.894.4 bn from Kshs 2.897.7 bn, due to downgrade of anticipated proceeds from appropriations in aid by 2.4% equivalent to Kshs 7.9 bn, taking the projected total revenue and external grants to Kshs 2,942.5 bn. The revenue performance is expected to be supported by the ongoing reforms in tax policy and revenue administration measures aimed at expanding the tax base,
- Projected recurrent expenditure has been revised upwards by 1.5% to Kshs 2,459.3 bn from Kshs 2,422.3 bn projected in the draft due to increased transfers for the county governments to Kshs 417.9 bn from Kshs 417.5 bn in draft. Development expenditure and net lending revised downward by 3.4% to Kshs 769.3 bn from a projection of Kshs 796.4 bn in the draft. This takes the projected expenditure to Kshs 3,651.5 bn from Kshs 3,641.0 bn, representing a 0.3% upward revision, and,
- Fiscal deficit excluding grants recorded an increase of 1.9% to Kshs 757.1 bn from Kshs 743.3 bn and will be financed by net foreign borrowing of Kshs 198.6 bn and net domestic borrowing which was revised upwards by 5.0% to Kshs 521.5 bn from 496.6 bn in the draft. This takes the projected government borrowing for the FY’2023/2024 to Kshs 720.1 bn, a 3.6% increase from the earlier Kshs 695.2 bn.
For more information please read our note on the Draft 2023 Budget Policy Statement Note
- Fuel Prices
During the week, the Energy and Petroleum Regulatory Authority (EPRA) released their monthly statement on the maximum retail fuel prices in Kenya effective 15th February 2023 to 14th March 2023. Notably, fuel prices remained unchanged for the third consecutive month at Kshs 177.3, Kshs 162.0 and Kshs 145.9 per litres of Super Petrol, Diesel and Kerosene, respectively. The performance was attributable to:
- The cross subsidization of the price of Diesel with that of Super Petrol and maintaining of Kshs 19.4 subsidy per litre of Kerosene under the Petroleum Development Levy, and,
- The decline in the average landed costs of Super Petrol, Diesel and Kerosene by 0.1%, 4.8% and 5.1% to USD 659.9 per cubic metre, USD 779.5 per cubic metre and USD 775.0 per cubic metre in January 2023, from USD 660.7 per cubic metre, USD 818.5 per cubic metre and USD 816.6 per cubic metre in December 2022, respectively.
The performance was despite:
- The 2.8% decline in the Free On Board (FOB) price in Murban crude oil to USD 90.9 per barrel in January 2023 from USD 93.5 per barrel recorded in December 2022, and,
- The continued depreciation of the Kenyan Shilling against the US Dollar, having depreciated by 1.6% to Kshs 130.6 in January 2023 from 128.6 in December 2022.
Key to note, EPRA maintained the Kshs 12.4 and Kshs 2.5 per litre margin to Oil Marketing Companies for Super Petrol and Diesel, respectively while Kerosene margins remained withheld. This is attributable to Super Petrol recording a Price Stabilization surplus of Kshs 10.7 per litre, while Kerosene recorded a deficit, of Kshs 5.6 per litre, respectively.
Notably, fuel prices in the country remain high despite the decline in average landing costs, mainly attributable to the move by the government to scale down fuel subsidies. Additionally, we expect global fuel prices to rise as demand surpasses supply, following the announcement by Russia to cut oil production by 5.0% per day starting March due to the global tension which led to the European Union and G7 nations impose price caps on Russian oil and oil products. However, the global fuel prices have dropped by 28.8% to USD 83.8 per barrel as of 16th February 2023, from USD 117.7 per barrel peak recorded as at 1st June 2022. We are also adamant that the continued maintenance of the fuel subsidies under the Petroleum Development Levy program is unsustainable and is a burden to the government expenditure. As such, we recommend quashing of the fuel subsidies as part of the current government fiscal consolidation measures.
Rates in the Fixed Income market have remained relatively stable due to the relatively ample liquidity in the money market. The government is 2.2% behind its prorated borrowing target of Kshs 374.0 bn having borrowed Kshs 365.6 bn of the Kshs 581.7 bn borrowing target for the FY’2022/2023. We expect sustained gradual economic recovery as evidenced by the revenue collections of Kshs 1.1 tn bn in the FY’2022/2023 as at the end of January 2023, equivalent to a 53.3% of its target of Kshs 2.1 tn. Despite the performance, we believe that the projected budget deficit of 5.7% is relatively ambitious given the downside risks and deteriorating business environment occasioned by high inflationary pressures. We however expect the support from the IMF and World Bank to ease the need for elevated borrowing and thus help maintain a stable interest rate environment since the government is not desperate for cash. Owing to this, our view is that investors should be biased towards short-term fixed-income securities to reduce duration risk.
Market Performance:
During the week, the equities market recorded mixed performance, with NASI declining by 0.2%, while NSE 20 and NSE 25 gained by 0.5% and 0.2%, respectively, taking the YTD performance to gains of 0.5%, 0.3% and 1.7% for NASI, NSE 20, and NSE 25, respectively. The equities market performance was mainly driven by losses recorded by large cap stocks such as Bamburi and Safaricom of 1.2% and 1.0%, respectively. The losses were however mitigated by gains recorded by other large cap stocks such as BAT Kenya, Standard chartered Bank Kenya (SCBK) and Equity Group of 7.8%, 2.1% and 1.8% respectively.
During the week, equities turnover declined by 5.0% to USD 10.5 mn from USD 11.1 mn recorded the previous week, taking the YTD turnover to USD 89.4 mn. Additionally, foreign investors turned net sellers, with a net selling position of USD 3.0 mn, from a net buying position of USD 2.4 mn recorded the previous week, taking the YTD net selling position to USD 24.1 mn.
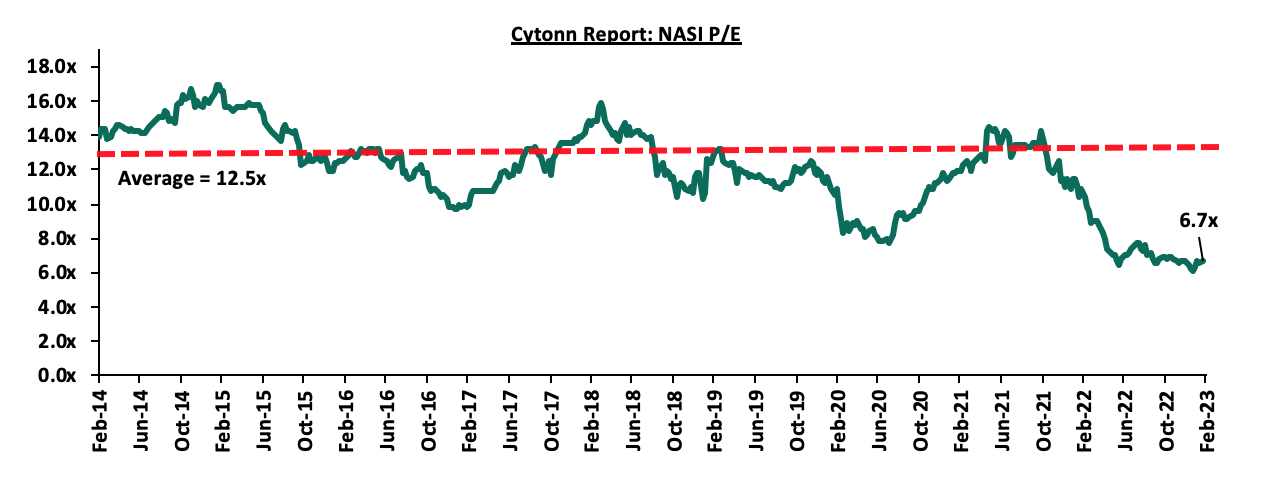
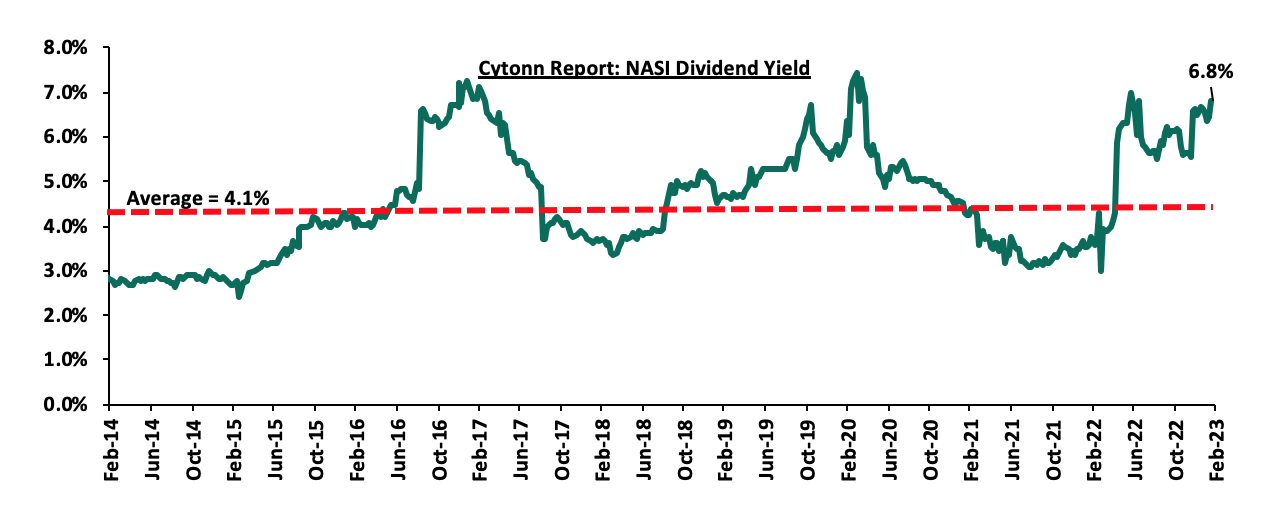
The market is currently trading at a price to earnings ratio (P/E) of 6.7x, 46.2% below the historical average of 12.5x, and a dividend yield of 6.9%, 2.8% points above the historical average of 4.1%. Key to note, NASI’s PEG ratio currently stands at 0.9x, an indication that the market is undervalued relative to its future growth. A PEG ratio greater than 1.0x indicates the market may be overvalued while a PEG ratio less than 1.0x indicates that the market is undervalued. The charts below indicate the historical P/E and dividend yields of the market;
Weekly Highlight: British American Tobacco (BAT) Kenya Plc FY’2022 Financial Performance
During the week, British American Tobacco Kenya Plc released their FY’2022 financial results, recording a 6.3% growth in Profits after Tax (PAT) to Kshs 6.9 bn, from Kshs 6.5 bn recorded in FY’2021. The increase in PAT was majorly attributed to the 5.5% increase in Gross Sales to Kshs 42.2 bn in FY’2022 from Kshs 40.0 bn recorded in FY’2021. However, the PAT performance was weighed down by a 9.0% increase in cost of operations to Kshs 17.5 bn in FY’2022, from Kshs 16.1 bn recorded in FY’2021 on the back of high inflationary pressures resulting in increased prices of factor inputs. The tables below show the breakdown of BAT’s financial performance;
|
Cytonn Report: British American Tobacco (BAT) Kenya Plc (BAT) Summarized Income Statement |
|||
|
Income Statement |
FY'2021 |
FY'2022 |
Y/Y Change |
|
Kshs (bn) |
Kshs (bn) |
||
|
Gross Sales including Indirect Taxes |
40.0 |
42.2 |
5.5% |
|
Exercise Duty and Value-Added Taxes |
(14.6) |
(14.9) |
1.7% |
|
Net Revenue |
25.4 |
27.4 |
7.7% |
|
Cost of operations |
(16.1) |
(17.5) |
9.0% |
|
Profit from operations |
9.4 |
9.9 |
5.4% |
|
Net Finance Costs/Income |
(0.08) |
0.03 |
140.2% |
|
Profit Before Income Tax |
9.3 |
9.9 |
6.7% |
|
Income Tax Expenses |
(2.8) |
(3.0) |
7.7% |
|
Profit After Tax |
6.5 |
6.9 |
6.3% |
|
Dividend Paid |
5.4 |
5.7 |
6.5% |
|
Earnings Per Share |
64.8 |
68.9 |
6.3% |
Source: British American Tobacco (BAT) Kenya Plc FY’2022 Financial Report
|
Cytonn Report: British American Tobacco Plc (BAT) Summarized Balance Sheet |
|||
|
Balance Sheet |
FY'2021 |
FY'2022 |
Y/Y Change |
|
Kshs (bn) |
Kshs (bn) |
||
|
Current Assets |
11.8 |
11.9 |
0.3% |
|
Non-Current Assets |
12.3 |
12.1 |
(1.7%) |
|
Total Assets |
24.1 |
23.9 |
(0.7%) |
|
Current Liabilities |
7.2 |
5.5 |
(23.9%) |
|
Non-Current Liabilities |
1.9 |
2.1 |
7.5% |
|
Total Liabilities |
9.1 |
7.6 |
(17.3%) |
|
Total Equity |
15.0 |
16.4 |
9.4% |
Source: British American Tobacco (BAT) Kenya Plc FY’2022 Financial Report
Key take outs from the financial performance include;
- Net revenue increased by 7.7% to Kshs 27.4 bn in FY’2022, from Kshs 25.4 bn recorded in FY’2021, mainly driven by the 5.5% growth in gross sales to Kshs 42.2 bn in 2022, from Kshs 40.0 bn in 2021 offsetting the 1.7% increase in indirect taxes that came in at Kshs 14.9 bn in FY’2022, from Kshs 14.6 bn in FY’2021. Notably, the increase in gross sales were due to improved export sales volumes and pricing benefit on the domestic sales during the period,
- Indirect Taxes increased by 1.7% to Kshs 14.9 bn, from Kshs 14.6 bn attributable to a cumulative 21.3% increase in exercise duty tax rates during the period of review. The prompt increase in exercise duty tax followed the multiple increases effected in Kenya in the 12-month period from November 2021 to November 2022, such as the 5.0% exercise duty increase in November 2021, the 10.0% exercise duty hike in July 2022 and 6.3% tax increase in November 2022,
- Cost of sales increased by 9.0% to Kshs 17.5 bn in FY’2022, from Kshs 16.1 bn in FY’2021, on the back of increased cost of inputs occasioned by the elevated inflationary pressures with annual inflation averaging 7.6% in 2022 as compared to an annual average of 6.1% recorded in 2021,
- The Group’s current liabilities declined significantly by 23.9% to Kshs 5.5 bn in FY’2022, from Kshs 7.2 bn recorded in FY’2021, mainly attributable decline in short term loans and prudent cash management, evidenced by a significant improvement of the net financial income of Kshs 0.03 bn in FY’2022, from a financial cost of Kshs 0.08 bn recorded in FY’2021, with the aim of boosting the working capital,
- Earnings per share increased by 6.3% to Kshs 68.9 in FY’2022, from Kshs 64.8 in FY’2021, mainly due to the 7.7% increase in net revenue to Kshs 27.4 bn in FY’2022, from Kshs 25.4 bn recorded in FY’2021, and,
- The board of directors proposed a final dividend of Kshs 52.0 per share pending approval by shareholders at the Annual General Meeting to be held on 15th June 2023 with an expected book closure on 26th May 2023. The total dividend to be paid for the FY’2022 totals to Kshs 57.0 per share, translating to a dividend yield of 11.5%, as at 17th February 2023.
BAT remained resilient delivering strong performance evidenced by the 6.3% increase in the PAT to Kshs 6.9 bn in FY’2022 from Kshs 6.5 bn in FY’2021. The performance was despite the challenging operating environment driven by persistent inflationary pressures eroding consumers’ purchasing power, coupled with the fiscal policies, which have increased excise taxes over the last 12 months. As a result, the increased taxes continue to weigh down on the Group’s overall performance and profitability. The legitimate market has also been impacted by the excise tax increase with an increased penetration of in illicit trade of tax-evaded cigarettes, coming in at 26.0% of total market turnover in FY’2022, up from 22.0% recorded in FY’2021. However, the Group’s announcement of a final dividend of Kshs 52.0 per share for the period ending 31st December 2022, adds to the interim dividend of Kshs 5.0 per share brings the total dividend for FY’2022 to Kshs 57.0, equivalent to a 6.5% increase from Kshs 53.5 total dividend per share paid in FY’2021. The increase in dividend per share shows improved performance and is expected to boost investors’ confidence in the Group’s stock.
Universe of coverage:
|
Company |
Price as at 10/02/2023 |
Price as at 17/02/2023 |
w/w change |
YTD Change |
Year Open 2023 |
Target Price* |
Dividend Yield |
Upside/ Downside** |
P/TBv Multiple |
Recommendation |
|
Jubilee Holdings |
182.0 |
183.0 |
0.5% |
(7.9%) |
198.8 |
305.9 |
7.7% |
74.8% |
0.3x |
Buy |
|
KCB Group*** |
38.8 |
38.6 |
(0.5%) |
0.5% |
38.4 |
52.5 |
7.8% |
43.9% |
0.6x |
Buy |
|
Kenya Reinsurance |
1.8 |
1.8 |
3.4% |
(2.7%) |
1.9 |
2.5 |
5.5% |
43.4% |
0.1x |
Buy |
|
Britam |
5.3 |
5.1 |
(4.1%) |
(1.5%) |
5.2 |
7.1 |
0.0% |
39.1% |
0.8x |
Buy |
|
Sanlam |
8.3 |
8.6 |
3.1% |
(10.4%) |
9.6 |
11.9 |
0.0% |
38.8% |
0.9x |
Buy |
|
Liberty Holdings |
5.0 |
5.0 |
0.0% |
(1.0%) |
5.0 |
6.8 |
0.0% |
35.3% |
0.4x |
Buy |
|
Equity Group*** |
45.7 |
46.5 |
1.8% |
3.1% |
45.1 |
58.4 |
6.5% |
32.1% |
1.1x |
Buy |
|
ABSA Bank*** |
12.6 |
12.6 |
0.0% |
2.9% |
12.2 |
15.5 |
8.8% |
31.9% |
1.1x |
Buy |
|
Co-op Bank*** |
12.6 |
12.6 |
0.0% |
4.1% |
12.1 |
15.5 |
7.9% |
30.7% |
0.7x |
Buy |
|
NCBA*** |
37.6 |
37.4 |
(0.5%) |
(4.1%) |
39.0 |
43.4 |
10.2% |
26.3% |
0.8x |
Buy |
|
I&M Group*** |
17.3 |
18.0 |
4.3% |
5.6% |
17.1 |
20.8 |
8.3% |
24.0% |
0.5x |
Buy |
|
Diamond Trust Bank*** |
50.0 |
50.0 |
0.0% |
0.3% |
49.9 |
57.1 |
6.0% |
20.3% |
0.2x |
Buy |
|
CIC Group |
2.0 |
2.0 |
(1.5%) |
4.2% |
1.9 |
2.3 |
0.0% |
16.6% |
0.7x |
Accumulate |
|
Standard Chartered*** |
158.0 |
161.3 |
2.1% |
11.2% |
145.0 |
166.3 |
11.8% |
14.9% |
1.1x |
Accumulate |
|
Stanbic Holdings |
111.8 |
111.0 |
(0.7%) |
8.8% |
102.0 |
112.0 |
8.1% |
9.0% |
1.0x |
Hold |
|
HF Group |
3.6 |
3.7 |
3.4% |
16.5% |
3.2 |
3.4 |
0.0% |
(6.5%) |
0.2x |
Sell |
|
*Target Price as per Cytonn Analyst estimates **Upside/ (Downside) is adjusted for Dividend Yield ***For Disclosure, these are stocks in which Cytonn and/or its affiliates are invested in N/B: All Dividend yields are computed from the total dividend issued in a financial year |
||||||||||
We are “Neutral” on the Equities markets in the short term due to the current adverse operating environment and huge foreign investor outflows, and, “Bullish” in the long term due to current cheap valuations and expected global and local economic recovery.
With the market currently trading at a discount to its future growth (PEG Ratio at 0.9x), we believe that investors should reposition towards value stocks with strong earnings growth and that are trading at discounts to their intrinsic value. We expect the current high foreign investors sell-offs to continue weighing down the economic outlook in the short term.
- Industry Report
During the week, the Architectural Association of Kenya (AAK) released the Status of The Built Environment Report January - December 2022, which highlighted curtailed growth rates in the Real Estate and construction sectors, with both sectors registering downward trends throughout the year. This was attributable a disruption of sector recovery in the post pandemic period owing to; i) commodity shortages and hike in fuel prices occasioned by the Russia-Ukraine war, which consequently led to increased production and construction costs, and, ii) political uncertainty instigated by the August general elections that saw investors delay spending and investment decisions as they adopted a ‘wait-and-see’ approach. The graph below shows the trend of the Real Estate and construction sector growth rates from Q1’2021 – Q3’2022;
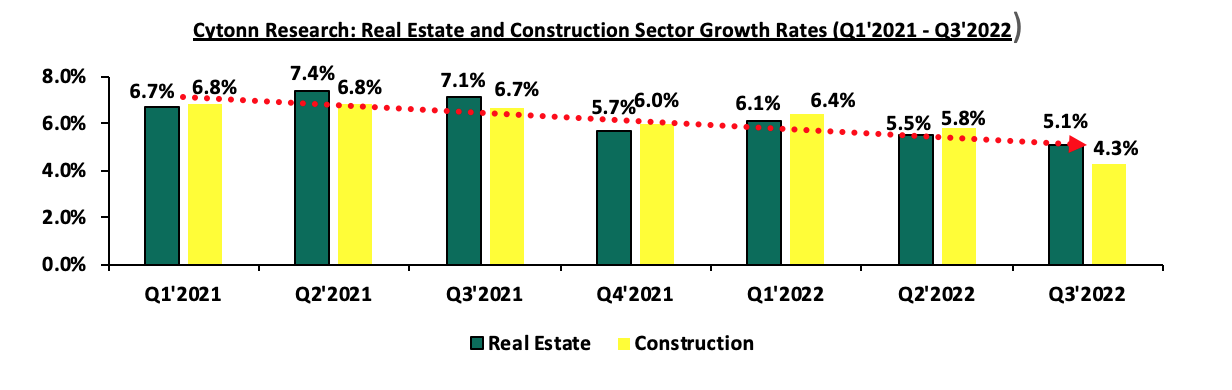
Source: Kenya National Bureau of Statistics (KNBS)
However, the Real Estate and construction sectors continue to make a growing contribution to Kenya's economy as evidenced by their contributions to Gross Domestic Product (GDP) highlighted in the graph below;
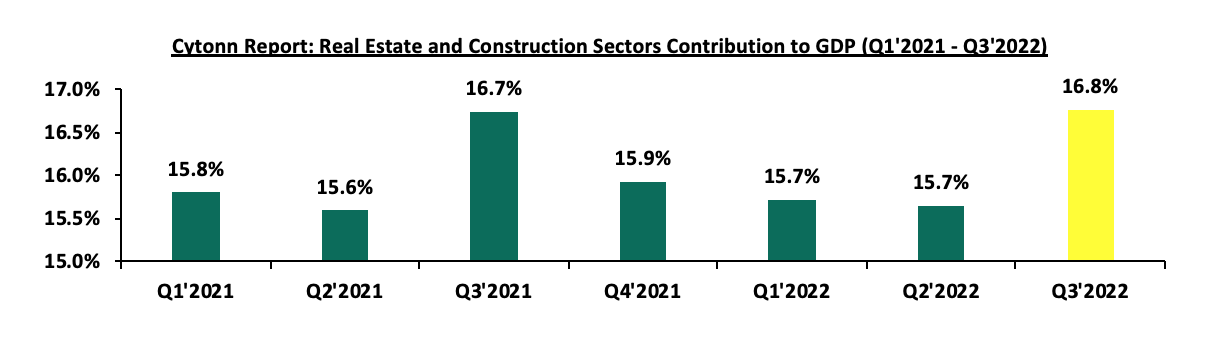
Source: Kenya National Bureau of Statistics (KNBS)
Other key take-outs and highlights include;
- Increased construction costs: In 2022, construction costs increased by 5.0% averaging Kshs 5,210 from Kshs 4,960 recorded in 2021 attributable to price increase of key construction materials such as cement, steel, paint, aluminium and Polyvinyl Chloride (PVC),
- Affordable Housing: The Affordable Housing Programme (AHP) is well on course with an active pipeline of 376 projects looking to deliver 599,000 units across the country. President William Ruto has so far commissioned 24,218 units in Nairobi and Machakos counties, and is set to further launch 35,980 units in Nairobi, Kiambu and Homa Bay counties. Currently, the construction of 9,935 affordable housing units is underway, with a total of 13,529 units having already been constructed,
- Safari Green Building Index: The AAK launched its green building certification tool that was developed in 2021 following a Kshs 5.2 bn funding commitment to the Kenyan Green affordable housing venture by UK Climate Investments (UKCI) and FSD Africa Investments (FSDAi). The initiative targeted delivery of approximately 10,000 homes using modern green technologies, and,
- Building and Regulatory Compliance: National Construction Authority (NCA) approved 4,377 applications for project registration with a combined worth of Kshs 280.9 bn out of a received total of 8,154 applications. The highest number of approved units were for residential developments, totaling 2,631. In addition, NCA inspected 26,060 construction projects and suspended 18,192 projects translating to a 69.8% non-compliance rate.
We expect the Real Estate and construction sectors to record a substantial resurgence in terms of activity during 2023, supported by; i) the government's ambitious plans to provide affordable housing, ii) renewed investor confidence that's bolstered by a stable political and business climate, and, iii) increased participation of private sector developers through Public Private Partnerships (PPPs) in bringing affordable housing projects to fruition. Nevertheless, there are some concerns that could hinder the sectors’ optimal performance, such as; i) the high costs of construction, and, ii) the unpredictable availability of essential building materials like steel, paint, aluminum, cement, and PVC in Kenya, which are expected to continue being affected by unprecedented global shocks such as ongoing the Russia – Ukraine war.
- Residential Sector
- Centum Real Estate completes construction of phase one of Loft Residences
During the week, Centum Real Estate, the development affiliate of Centum Investment Company PLC, completed the construction of phase one of its 32 luxurious four-bedroom duplexes dubbed ‘Loft Residences’, which sit on 3.9 acres situated in Two Rivers. This brings the total number of houses handed over by the developer in the last two years to 656. The project which was launched in November 2020 was funded through proceeds realized from its Kshs 4.0 bn secured Medium Term Note (MTN) program launched in December 2020, raising Kshs 3.0 bn in the first tranche. The three-year tenor notes set to mature in December 2023 are structured to offer zero-coupons during the life of the bond, but guarantee investors returns of 12.5% and 12.0% to senior and senior secured equity-linked noteholders respectively. The second phase of the project which will comprise of 24 additional units is expected to be completed in August 2023. Other notable projects by the developer include; Cascadia, Riverbank, Mizizi Court, and Elmer One Apartments. The table below details for the housing units;
|
Cytonn Report: Loft Residence Duplexes |
|||
|
Typologies |
Unit Size (SQM) |
Price (Kshs) |
Price per SQM |
|
4 bedroom + DSQ |
280 |
45.0 mn |
160,714 |
Source: Centum Real Estate Sales
In terms of performance, the unit prices translate to an average of Kshs 160,714 per SQM, which is 26.8% higher than the upper mid-end residential market average value of Kshs 126,751 per SQM realized in FY’2022. This can be attributed to; i) their prime location benefitting from world class amenities such as a shopping mall, hotels, and recreation centres, ii) the area being located within the United Nations (UN) Diplomatic blue zone, which creates demand for high quality residential units to service the large population of diplomats and expatriates, iii) ease of accessibility supported by good infrastructure, and iv) ample security. The table below shows upper mid-end residential apartments performance in FY’2022;
|
All values in Kshs unless stated otherwise |
||||||||
|
Cytonn Report: Residential Apartments Summary FY’2022 |
||||||||
|
Area |
Price per SQM FY'2022 |
Rent per SQM FY'2022 |
Occupancy FY'2022 |
Uptake FY'2022 |
Annual Uptake FY'2022 |
Rental Yield FY'2022 |
Price Appreciation FY'2022 |
Total Returns |
|
Upper Mid-End |
||||||||
|
Westlands |
149,518 |
826 |
83.1% |
87.3% |
24.5% |
5.9% |
0.5% |
6.4% |
|
Kilimani |
106,700 |
646 |
84.4% |
88.9% |
21.1% |
5.8% |
0.2% |
6.0% |
|
Kileleshwa |
126,855 |
654 |
85.0% |
88.2% |
14.8% |
5.5% |
0.3% |
5.8% |
|
Loresho |
123,248 |
541 |
88.0% |
97.2% |
10.4% |
4.7% |
1.1% |
5.8% |
|
Upperhill |
134,588 |
745 |
81.5% |
87.8% |
10.6% |
5.0% |
0.7% |
5.7% |
|
Parklands |
119,595 |
609 |
83.8% |
89.9% |
13.6% |
5.2% |
0.4% |
5.6% |
|
Average |
126,751 |
670 |
84.3% |
89.9% |
15.8% |
5.4% |
0.5% |
5.9% |
Source: Cytonn Research
We expect the residential sector will record increased activities supported by the completion of more housing projects as the year progresses and to see more developers leverage capital markets to raise financing for their projects.
- Madison Insurance and Housing Finance Company (HFC) partner to develop Mixed-Use project
During the week, Madison Insurance entered into a Joint-Venture (JV) agreement with Housing Finance Company (HFC), a subsidiary of HF Group, to develop a Master Planned Community project dubbed ‘Villakazi Homes’ in Athi River, Machakos County. The partnership deal will see Madison Insurance provide 100.0 acres of land valued at Kshs 3.0 bn, with HFC providing buyer financing options, project management expertise, and sales support for the project. The project is a Mixed-Use gated community which will comprise of serviced plots with the selling price starting from Kshs 2.7 mn, upon which investors will be allowed to develop their own homes out of two approved architectural plans which are yet to be disclosed. The project will consist of over 600 residential units, and amenities such as social spaces, commercial and education facilities. The project is set to begin construction next month which will be done in two phases; on a 60.0 acre and 40.0 acre parcels for phase one and two respectively. The table below shows the sizes and prices of the serviced plots offered at Villakazi Homes;
|
Cytonn Report: Sizes and Prices of Serviced Plots in Villakazi Homes |
||
|
Plot Size (Acres) |
Price (Kshs) |
Price Per Acre (Kshs) |
|
0.06 |
2,700,000 |
45,000,000 |
|
0.07 |
3,200,000 |
45,714,286 |
|
Average |
2,950,000 |
45,357,143 |
Source: Housing Finance Company
We expect the partnership and successful completion of the project will; i) help assist curb Kenya’s accumulated housing deficit which stands at 200,000 units annually or 80.0%, against the government’s target of 250,000 units and supply of 50,000 units annually, ii) improve home ownership rates which have remained significantly low especially in urban areas coming in at 22.0%, iii) ensure timely delivery of housing units banking on the financiers vested interest in allowing customers to assume ownership and commence loan repayments on time, and, iv) help improve the confidence of off-plan home purchasing schemes which have previously been marred with controversy partly attributable to untimely delivery of units among other factors. The graph below shows homeownership percentages for different countries in comparison to Kenya;
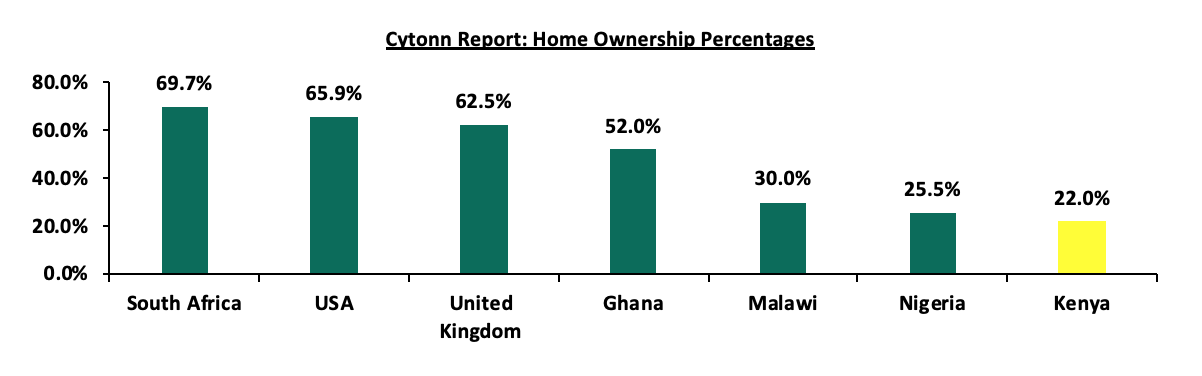
Source: Centre for Affordable Housing Africa, US Census Bureau, UK Office for National Statistics
- Retail Sector
During the week, local retail chain Cleanshelf supermarket opened a new outlet located in Greenpark Estate along Mombasa road, Athi River. The move by the retailer forms part of its expansion plan and strategy to capitalize on the thriving market which the location provides, and appeal to shoppers' preference for convenience. This brings the retailer’s number of operating outlets countrywide to 13. With the rise of residential market zones outside Nairobi Metropolitan Area (NMA) such as Gated-Community estates, Master-Planned Community estates, Conservancy Community estates, and Lifestyle Living Community estates, Cleanshelf is differentiating itself from other retail stores which are targeting commercial centres and malls in Mixed-Use Developments. Its decision to expand its retail store presence in such residential areas shows a strategic move that highlights the brand's focus on exploring newer opportunities beyond major urban centers. Moreover, by catering to the needs of residents in Greenpark Estate, Cleanshelf is providing convenience and accessibility, which can drive customer loyalty, attract a broader customer base, and increase the preference of the brand by the residents. Additionally, with approximately 30.0% of formal retail penetration in Kenya, there is a significant opportunity for investment in the retail sector, making Cleanshelf’s expansion strategy a major positive impact for the brand in the sector.
The table below shows the number of stores operated by key local and international retail supermarket chains in Kenya;
|
Cytonn Report: Main Local and International Retail Supermarket Chains |
|||||||||||
|
Name of retailer |
Category |
Branches as at FY’ 2018 |
Branches as at FY’ 2019 |
Branches as at FY’ 2020 |
Branches as at FY’ 2021 |
Branches as at FY’2022 |
Branches opened in 2023 |
Closed branches |
Current branches |
Branches expected to be opened |
Projected branches FY’2023 |
|
Naivas |
Local |
46 |
61 |
69 |
79 |
91 |
0 |
0 |
91 |
0 |
91 |
|
QuickMart |
Local |
10 |
29 |
37 |
48 |
51 |
0 |
0 |
51 |
0 |
51 |
|
Chandarana |
Local |
14 |
19 |
20 |
23 |
26 |
0 |
0 |
26 |
0 |
26 |
|
Carrefour |
International |
6 |
7 |
9 |
16 |
16 |
0 |
0 |
16 |
0 |
16 |
|
Cleanshelf |
Local |
9 |
10 |
11 |
12 |
12 |
1 |
0 |
13 |
0 |
13 |
|
Tuskys |
Local |
53 |
64 |
64 |
6 |
4 |
0 |
60 |
4 |
0 |
4 |
|
Game Stores |
International |
2 |
2 |
3 |
3 |
0 |
0 |
3 |
0 |
0 |
0 |
|
Uchumi |
Local |
37 |
37 |
37 |
2 |
2 |
0 |
35 |
2 |
0 |
2 |
|
Choppies |
International |
13 |
15 |
15 |
0 |
0 |
0 |
15 |
0 |
0 |
0 |
|
Shoprite |
International |
2 |
4 |
4 |
0 |
0 |
0 |
4 |
0 |
0 |
0 |
|
Nakumatt |
Local |
65 |
65 |
65 |
0 |
0 |
0 |
65 |
0 |
0 |
0 |
|
Total |
|
257 |
313 |
334 |
189 |
202 |
1 |
182 |
203 |
0 |
203 |
Source: Cytonn Research
The Kenyan retail industry continues to experience notable expansion as local and international retailers compete for dominance in the market, leading to an overall improvement in the sector's performance. Nevertheless, the fast-paced growth of e-commerce, and, the oversupply of retail space standing at approximately 3.0 mn SQFT in the NMA retail sector and 1.7 mn SQFT in the non-NMA Kenyan retail sector, are hindering the retail sector's performance.
- Infrastructure
During the week, Kenya Railways Corporation (KRC) commenced construction of the first phase of the Kshs 30.0 bn Railway City project. The transit-oriented and multi-modal urban development which will be set on 425.0 acres of government land bordering Uhuru Highway, Landhies Road, Bunyala Road and Haile Selassie Avenue was launched by President William Ruto in December 2022.
We anticipate that the project will have a positive impact on Kenya’s Real Estate sector upon its successful completion supported by: i) an increase in urban development in the areas surrounding the Railway city, (ii) an upswing in property values in regions close to the project, iii) heightened investor confidence which will attract more foreign investors thus promoting Nairobi as a regional business hub, in turn boosting the economy, and, iv) the creation of interlinked regional metropolises which will further boost urban development as the project will be connected to other upcoming smart cities such as the Northlands City, Tatu City in Kiambu County, and Konza City in Machakos County. For more information, please see our Cytonn Weekly #49/2022.
- Real Estate Investment Trusts (REITs)
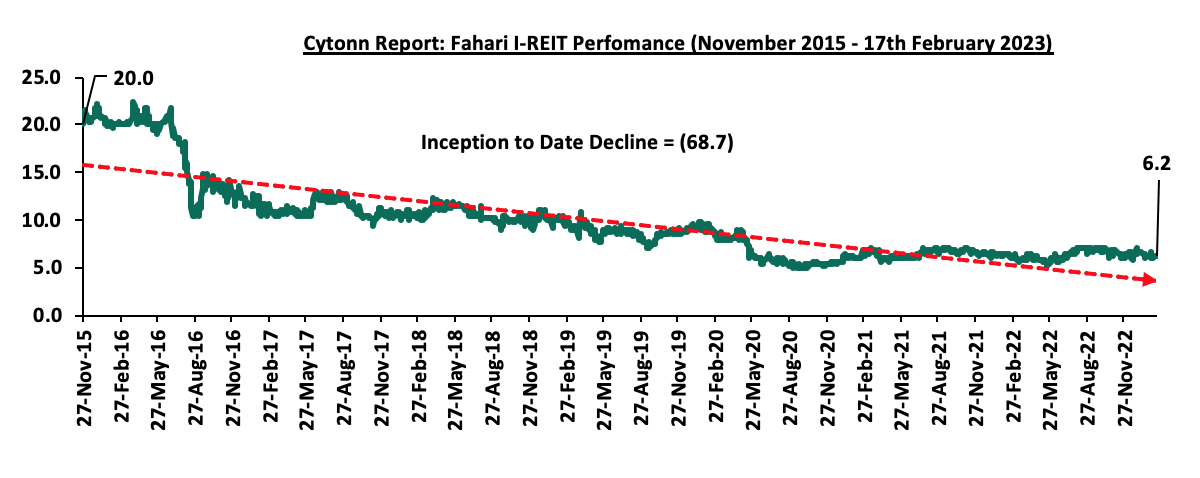
In the Nairobi Securities Exchange, ILAM Fahari I-REIT closed the week trading at an average price of Kshs 6.2 per share remaining relatively unchanged from the previous week. The performance represents a 8.8% Year-to-Date (YTD) decline from Kshs 6.8 per share recorded on 3rd January 2023, taking it to a 69.1% Inception-to-Date (ITD) loss from the Kshs 20.0 price. The dividend yield currently stands at 8.1%. The graph below shows Fahari I-REIT’s performance from November 2015 to 17th February 2023;
In the Unquoted Securities Platform, Acorn D-REIT and I-REIT traded at Kshs 23.9 and Kshs 20.9 per unit, respectively, as at 10th February 2023. The performance represented a 19.4% and 4.4% gain for the D-REIT and I-REIT, respectively, from the Kshs 20.0 inception price. The volumes traded for the D-REIT and I-REIT came in at 12.3 mn and 29.0 mn shares, respectively, with a turnover of Kshs 257.5 mn and Kshs 598.9 mn, respectively, since inception in February 2021.
We expect the performance of the Real Estate sector to remain on an upward trend, supported by factors such as; i) the launch and completion of affordable housing projects across the country, driven by government’s ambitious plan to provide descent, quality and affordable housing to its citizens, ii) the gaining traction of master-planned mixed use developments, iii) expansionary efforts and strategies of both local and international retailers, and, iv) progressive urban development positively impacting property values. However, factors such as; i) the existing oversupply of physical space in select sectors, and, ii) low investor appetite for REITs are expected to continue subduing the optimal performance of the sector.
The Kenyan shilling has recorded a Year to date depreciation of 1.8% against the US Dollar to close at Kshs 125.6 as at 17th February 2022, from Kshs 123.4 on 3rd January 2023, adding to a 9.0% depreciation in 2022 and further depreciation of 3.6% and 7.7% in 2021 and 2020 respectively. Key to note, this is the lowest the Kenyan shilling has gone against the dollar. The continued depreciation has been mainly driven by an ever present current account with of Kenya being a net importer and the import bill being in US Dollars. Being a net importer has also left Kenya susceptible to external shocks that have inflated the import bill and negatively affected the shilling such as the high global crude oil prices occasioned by persistent supply chain constraints worsened by the ongoing Russia-Ukraine conflict. The inflated import bill has led to increased dollar demand from importers against a lower supply of hard currency. Additionally, the aggressive public debt accumulation, especially external debt at a 10-year CAGR of 19.0% to Kshs 4.8 tn in December 2022, from Kshs 0.8 tn in the same period in 2012 has continued to exert pressure on the Kenyan shilling, due to the increased servicing costs, considering that 69.3% of the external debt stock is in US Dollars. Currency depreciation coupled uncertainties such as elevated inflationary pressures on the Kenyan economy has seen government securities yields increase as investors attach higher premiums to compensate for the additional risk. Notably, in December 2022, Fitch Ratings downgraded Kenya's Long-Term Foreign-Currency Issuer Default Rating (IDR) to ‘B’ from 'B+' with a Stable Outlook. The downgrade was mainly attributable to Kenya's persistent fiscal and external deficits, high public debt and high external financing costs which presently constrain access to international capital markets. This week we shall do an in-depth analysis of the factors that are expected to drive the performance of the Kenya shilling and the interest rates and thereafter give our outlook for 2023;
We have previously covered the topic as summarized below;
- In our Currency Outlook covered in May 2022, our outlook on currency was 4.7% depreciation by end of 2022 mainly driven by high global oil prices, persistent supply chain bottleneck constraints and ever present current account deficit,
- In May 2021, we released our topical on Currency and Interest Rates Outlook-2021, with our outlook on currency being a 0.6% appreciation by end of 2021. The expected appreciation was on account of gradual improvement in the export sector as Kenya’s trading partners continued to reopen their economies coupled with stable forex reserves on the back of increasing diaspora remittance inflows as well as continued investor capital inflows and debt relief from other institutions. On the interest rates, we expected an upward readjustment on the yield curve due to the increased pressure on the government to plunge in the budget deficit coupled with the increased demand by investors for higher yields due to the perceived risk in the country ahead of 2022 general election, and,
- In our Currency and Interest Rates Outlooktopical which was covered in May 2020, our outlook on the currency was a 5.5% depreciation by the end of 2020, driven by the reduced exports earning due to the lockdown measures put in place by Kenya’s trade partners coupled with the high fiscal deficit seen during the period. On the interest rates, we expected a slight upward readjustment on the yield curve due to increased demand by investors for higher yields arising from the perceived risk in the country.
With the shilling having depreciated by 1.8% on a YTD basis in 2023 and the continuous upward readjustment of on the yield curve, we saw the need to revisit the topic on currency and interest rates outlook, in order to shed some light on how the Kenyan shilling and the interest rates are expected to behave in 2023. In this focus, we shall be doing an in-depth analysis of the factors that are expected to drive the performance of the Kenyan shilling and the interest rates and thereafter give our outlook for 2023 based on these factors. We shall cover the following:
- Historical Performance of the Kenyan Shilling and drivers,
- Evolution of the Interest Rate Environment,
- Factors Expected to Drive the Interest Rate Environment, and,
- Conclusion and Our View Going Forward
Section I: Historical Performance of the Kenyan Shilling
Over the last 10 years, the Kenyan shilling has depreciated at a 10-year CAGR of 3.7% to an all-time low of Kshs 125.6 in February 2023 from Kshs 87.3 over the same period in 2013, mainly attributable to various factors such as an ever present current account deficit, increasing debt levels and the rising prices of commodities such as crude oil prices as Kenya remains a net importer. The economic disruptions occasioned by the COVID-19 pandemic in 2020 significantly caused volatility of the Kenyan shilling which led to a depreciation of 7.7% in 2020 followed by a further 3.6% in 2021. In 2022, the shilling depreciated for a fifth consecutive year, closing the year at Kshs 123.4 against the dollar as compared to Kshs 113.1 at the beginning of the year, translating to a depreciation of 9.0%. The weakening of the shilling was mainly attributable to increased dollar demand from commodity and energy sector importers as a result of the high global crude oil prices occasioned by supply chain constraints worsened by the geopolitical pressures at a time when the economy was recovering from the impacts of COVID-19 pandemic which had stifled demand in the economy. In 2023, on a YTD basis, the shilling has depreciated by 1.8% against the USD, to close at Kshs 125.6, from Kshs 123.4 recorded on 3rd January 2023. The continued depreciation in 2023 is mainly attributable to sustained dollar demand by importers especially in the oil and energy sector against a low supply of dollar currency leading to shortage of US Dollars in the Kenyan market. The chart below illustrates the performance of the Kenyan Shilling against the US Dollar over the last 10 years:
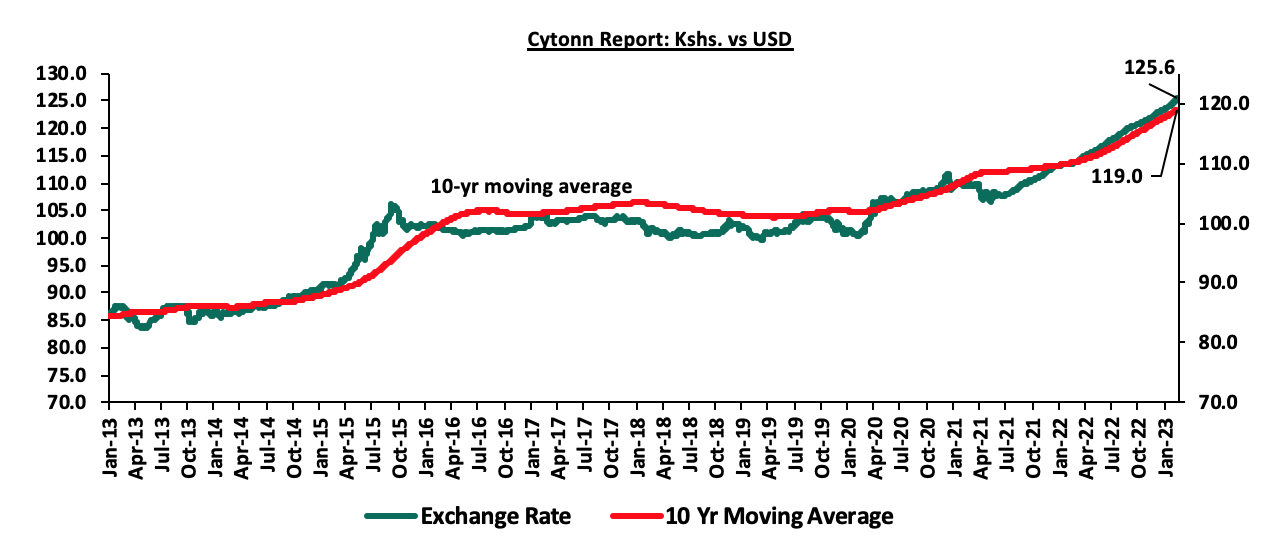
Source: Central Bank of Kenya
Below are some of the factors that has been supporting the shilling;
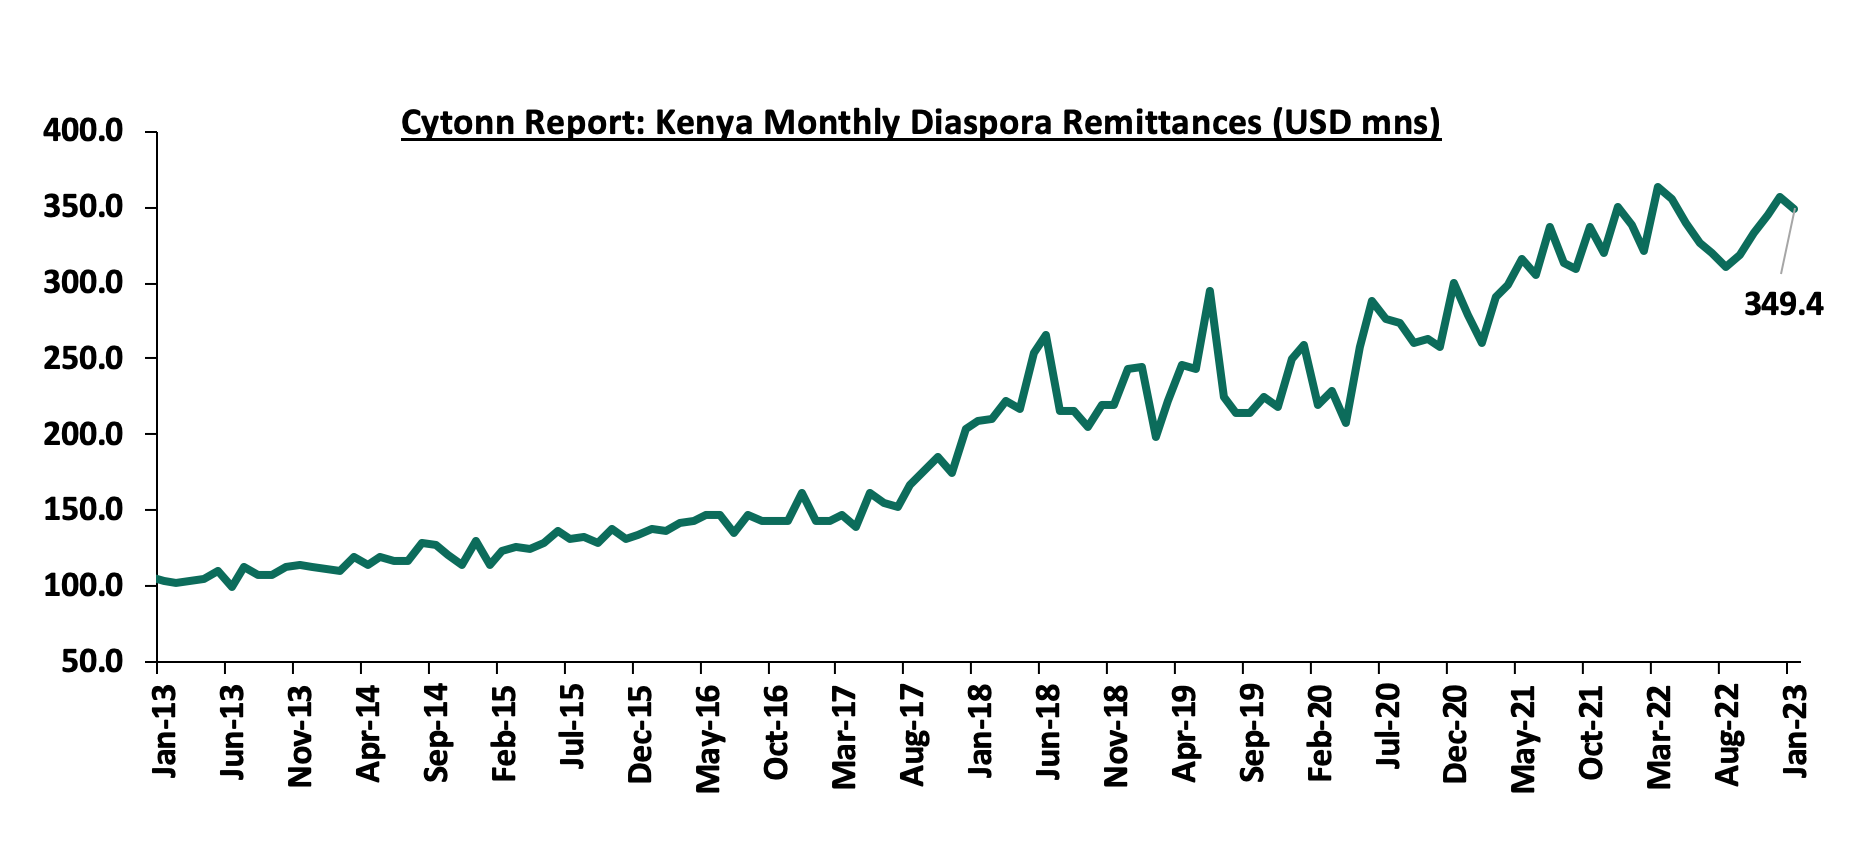
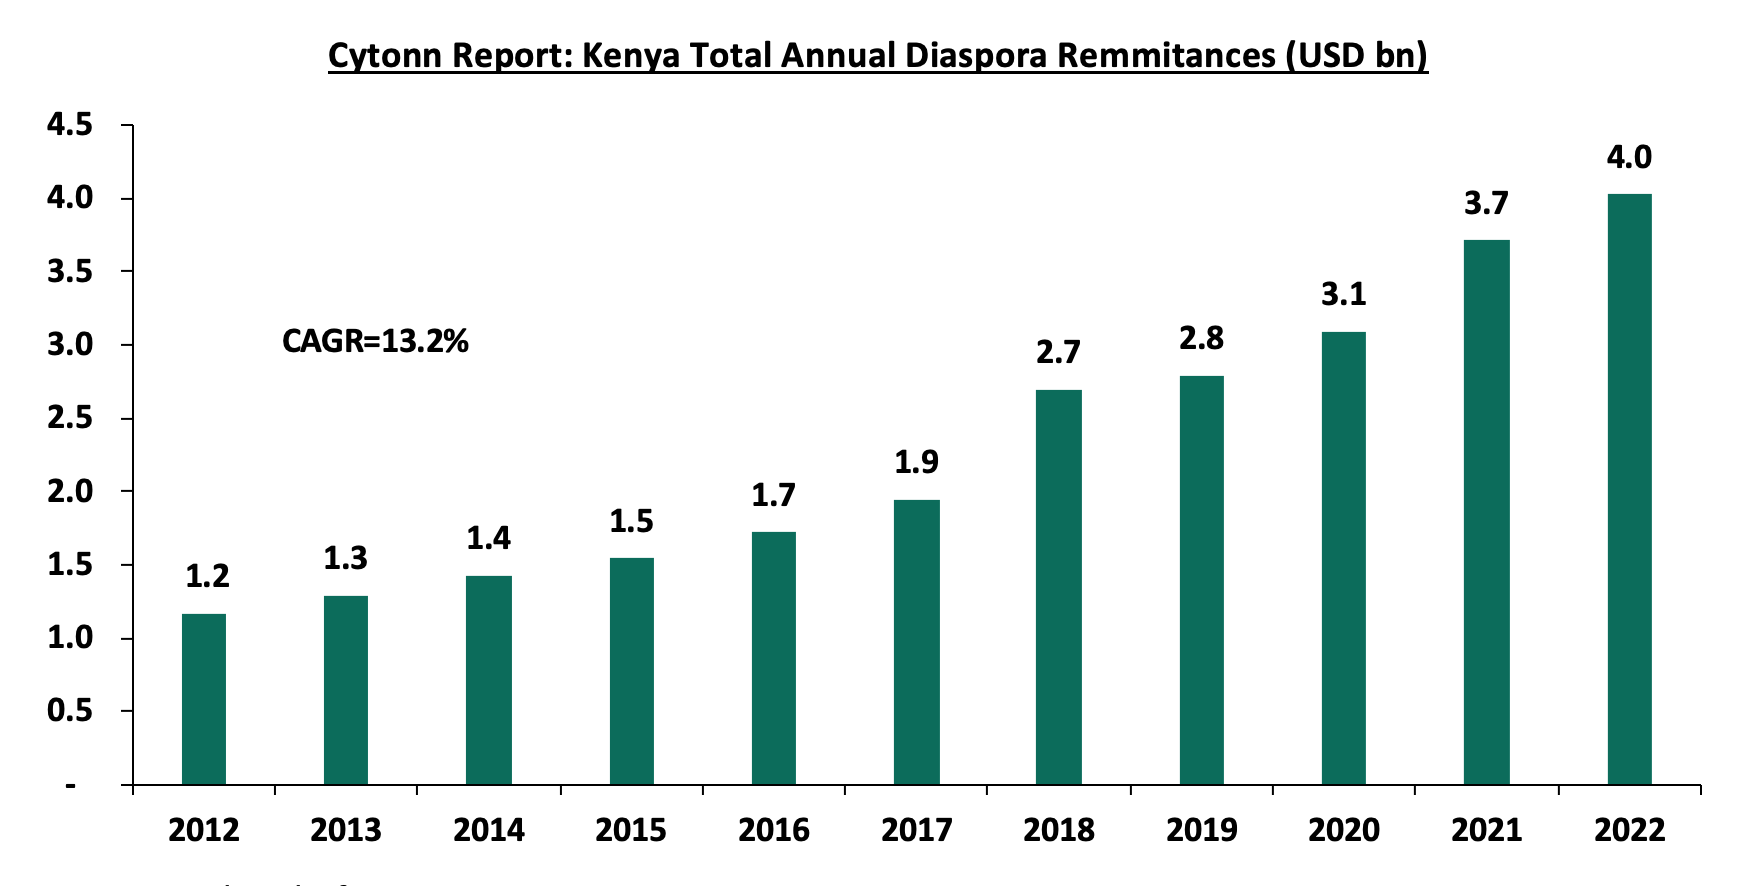
- Strong diaspora remittances, with monthly diaspora remittances having grown at a 10-year CAGR of 13.0% to USD 349.4 mn in January 2023, from USD 103.0 mn recorded in January 2013. Additionally, the total annual diaspora remittances have grown at a 10-year CAGR of 13.2% to USD 4.0 bn in 2022, from USD 1.2 bn in 2012. The continued growth in diaspora remittance is mainly attributable to the increasing Kenyan population in the diaspora and advancing technology that has facilitated easier transfer of money. The charts below show the trend of the evolution of monthly and annual Diaspora Remittances:
Source: Central Bank of Kenya
Source: Central Bank of Kenya
- The sufficient forex reserves held by the Central bank which have been above the statutory target of 4.0-months import cover in the last 10 years, with an average of USD 7.3 bn and 5.1-months average import cover. However, despite the Forex reserves being adequate for a long time, they have dropped by 21.6% to USD 6.9 bn (equivalent to 3.8 months of import cover) in February 2023, from USD 8.8 bn (equivalent to 5.1 months of import cover) recorded in January 2022. The drop is largely attributed to increased debt service obligations due to the continued depreciation of the Kenyan shilling. The chart below shows the trend of the evolution of the forex reserves:
Source: Central Bank of Kenya
- The value of the country’s principal exports has continued to grow over time consequently increasing foreign inflows which support the local currency. Notably, in Q3’2022, the value of horticulture and tea exports contributed Kshs 40.3 mn and Kshs 34.5 mn, respectively out of the total value of exports of Kshs 200.5 mn. The current account deficit as a percentage of the Gross Domestic product (GDP), has also continued to narrow with the deficit estimated to have narrowed to a deficit of 4.9% by the end of 2022, from a deficit of 5.2% in FY’2021,
- Before the onset of the Coronavirus pandemic, the country attracted huge foreign investment as evidenced by the Foreign Direct Investments (FDI) flows into the country, which had grown significantly by 8-year CAGR of 16.0% to USD 1.1 bn in 2019, from USD 0.3 bn in 2011. However, after economic disruptions caused by the COVID-19 pandemic which resulted in reduced investor activities, FDI flows into the country have declined in two consecutive years to USD 0.7 bn and USD 0.4 bn in 2020 and 2021, respectively,
- Kenya has continued to receive financing from the World Bank and other bilateral lenders such as the International Monetary Fund (IMF) which have supported the Kenyan shilling by boosting the forex reserves. Notably, the government received USD 750.0 mn World Bank loan facility in March 2022, as well as USD 235.6 mn and USD 447.4 mn funding from the International Monetary Fund (IMF) disbursed under the fourth and fifth tranches of the 38-month Extended Fund Facility (EFF) and Extended Credit Facility (ECF) in July and December 2022, respectively. Further, through the Special Drawing Rights, IMF disbursed an additional USD 14.6 mn (Kshs 26.6 bn) as buffer from the drought effects, which supported the forex reserves despite the continued depreciation of the Kenyan currency, and,
- Tightened monetary policy with the Monetary Policy Committee (MPC) continually hiking the central Bank rate by a cumulative 1.75% points to 8.75% from the previous 7.00% in a bid to anchor inflation which has surpassed government’s target range of 2.5%-7.5% and also strengthen the Kenyan shilling from further aggressive depreciation
Despite the above factors, the Kenyan shilling has been put under significant pressure by;
- High global crude oil prices attributable to the persistent supply chain constraints and high demand with fuel being an integral input in most sectors in the economy. Consequently, this increased dollar demand by oil and energy importers, as well as, manufacturers against a low supply of dollar currency. The high dollar demand has caused shortage of US Dollars in the Kenyan market further inflating the country’s import bill and consequently weakening the shilling,
- Existence of an ever-present current account deficit estimate at 4.9% of GDP in 2022, despite improving by 0.3% points from 5.2% recorded in 2021. The ever-present current account deficit signifies country’s reliance on imports and with the high global commodity prices, it has resulted in increased demand for foreign currency which weighs down on the local currency. The chart below highlights the trend in the current account deficit as a percentage of GDP for the last 10 years:
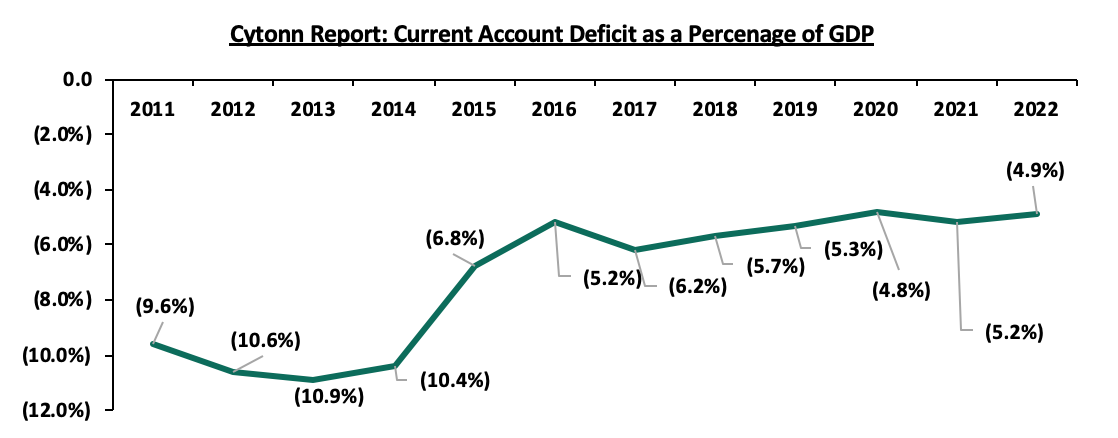
Source: Kenya National Bureau of Statistics (KNBS)
- A deterioration in Kenya’s trade imbalance as a result of adverse macroeconomic conditions in the country. According to the Kenya National Bureau of Statistics Q3’2022 Balance of Payments Report, Kenya’s balance of payments deteriorated by 283.9% in Q3’2022, coming in at a deficit of Kshs 112.7 bn, from a deficit of Kshs 29.3 bn in Q3’2021. The deterioration was brought by a 5.5% widening of the Current Account deficit to Kshs 193.4 bn, from Kshs 183.4 bn in Q3’2021, driven by a 15.8% deterioration in trade imbalance to Kshs 373.1 bn, from Kshs 322.0 bn in Q3’2021. Consequently, with Kenya being a net importer, the shilling has continued to weaken as a result of increasing import bill mainly attributable to the high global commodity prices,
- High debt levels and increasing debt servicing costs with Kenya’s public debt having grown exponentially at a 10-year CAGR of 17.7% to Kshs 9.1 tn in December 2022, from Kshs 1.8 tn in December 2012, with external debt contributing 51.1% of the total debt. Consequently, the increasing debt servicing costs mainly on the back of the continued weakening of the shilling have put pressure on forex reserves given that 69.3% of Kenya’s External Debt was US dollar denominated as of October 2022. Additionally, the projected amounts that is expected to be used for foreign debt servicing in FY’2023/2024 stands at Kshs 475.6 bn, which are likely to put more pressure forex reserves as most of it will be used to repay the debts. The chart below highlights the trend in the country’s debt composition:
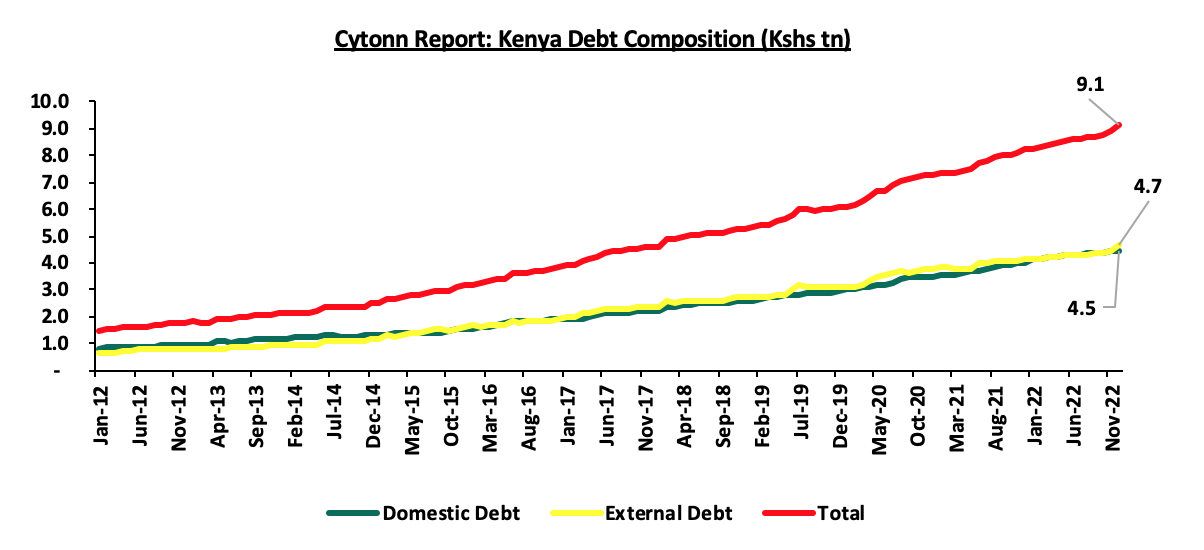
Source: The National Treasury
- High debt servicing costs mainly as a result of continued appreciation of the dollar and aggressive depreciation of the shilling on the back of the monetary policy tightening by United States Federal reserve. Consequently, this has resulted in continued dwindling of the country’s forex reserves given that 69.3% of Kenya’s External Debt was US dollar denominated as of October 2022.
Section II: Evolution of the Interest Rate environment in Kenya
The Interest rates in Kenya witnessed high volatility between 2012 and 2015 as evidenced by the significant increase in yields on the government papers. Key to note is that the yield on government papers largely follow what is happening in the economy and in times of expected high borrowing, lending rates tend to shoot up. In October 2015, the yields on the 91-day papers significantly increased to 22.5%, the highest yields from the last highest yields of 20.8% recorded in January 2012. The high borrowing target coupled with the high cost of credit environment saw the government offer attractive rates on its papers.
For the period between 2016 and 2020, the yield on government papers remained relatively stable at average yield of 7.7% for the 91-day paper. However, after the economic disruptions occasioned by the COVID-19 pandemic, the yields have been rising with the yields on the 91-day papers increasing by 2.1% points to close 2022 at 9.4%, from 7.3% at the beginning of the year. The continuous rise in the yields is mainly attributable to ever present fiscal deficit at an average of 8.1% of GDP in the last ten financial years, meaning that the government has to continuously borrow to meet its functions. Additionally, the continued rise in the yields in government papers is as a result of investors attaching a higher risk premium to the country, driven by the elevated inflationary pressures, high public debt and currency depreciation that have put the country’s macroeconomic environment at risk. The chart below highlights the trend in the 91-day T-bill weighted average yield for the last 10 years:
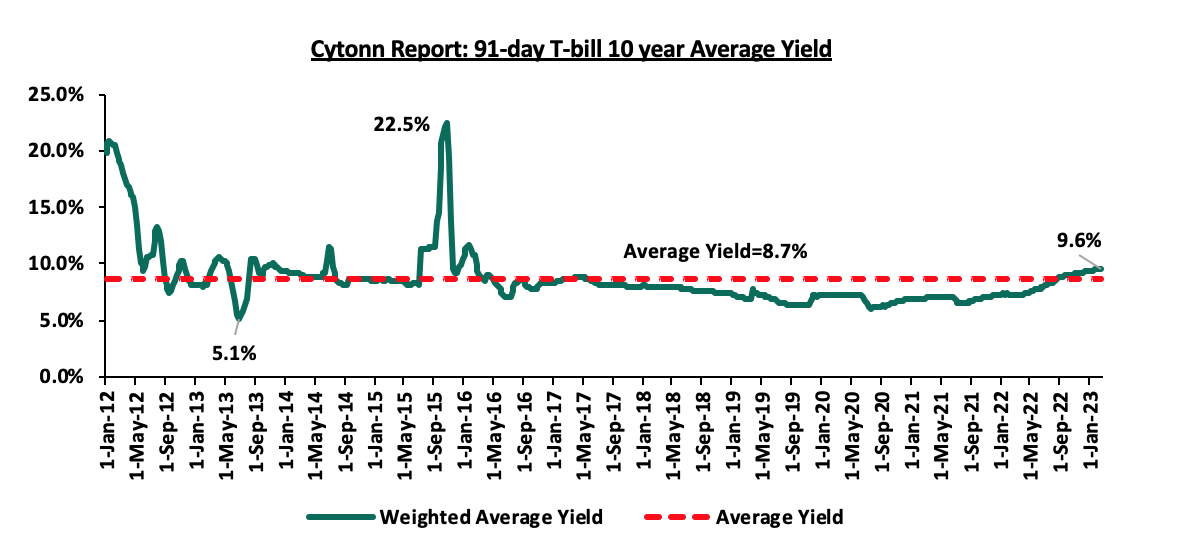
Source: Central Bank of Kenya
The Kenyan macroeconomic environment remains subdued mainly as a result of the elevated inflationary pressures and aggressive depreciation of the Kenyan Shilling that have suppressed business production levels. As such, we expect revenue collection to lag behind and an increase in domestic borrowing in a bid to bridge the fiscal deficit which will in turn create uncertainty in the country’s interest rate environment. However, we expect the interest rate environment to be supported by financing from concessional multilateral loans from the IMF reducing the government’s need to borrow externally.
We believe that in order for the government to ease pressure on the interest rate, they should:
- Shift financing strategies to prioritize concessional financing, and to use commercial borrowing in limited amounts. This will ease pressure given the current depreciation of the shilling and also given that the concessional funding have low interest rates and longer repayment periods,
- Focus on borrowing domestically in the short and medium term, given that domestic debt provides the government with a cheaper source of debt compared to foreign currency-denominated debts that have higher interest rates and have currency risks attached to them,
- Continue implementation of measures to reduce debt service to revenue ratio which was estimated at 51.1% as of December 2022, 21.1% points higher than the recommended threshold of 30.0%, and 1.1% points higher than FY2020/2021’s debt service ratio of 50.0%, attributable to increased debt service obligations mainly on the back of the depreciated local currency, and,
- Diversification of funding of projects by removing bottlenecks to Private Public Partnerships (PPPs) and joint ventures in order to attract more private sector involvement in funding development projects such as infrastructure instead of borrowing.
Currency outlook
|
Driver |
Outlook |
Effect on the currency |
|
Balance of Payments |
|
Negative |
|
Government Debt |
|
Negative |
|
Forex Reserves |
|
Negative |
|
Monetary Policy |
|
Neutral |
From the above currency drivers, 3 are negative (Balance of payment, Government Debt Forex Reserves), while 1 is neutral (Monetary Policy) indicating a negative outlook for the currency.
Section III: Factors expected to drive the Interest Rate environment
- Fiscal Policies
The government has continued to put in place measures to enhance revenue collection and we expect continued improvement given the raft of measures the new administration has put in place to boost tax collection such as the draft regulations for the Excise Duty Regulations 2023. Additionally, Kenya Revenue Authority (KRA) has also embarked on various efforts to raise more revenue through its strategies in the Budget Policy Statement, 2023 such as reducing the Value Added Tax (VAT) gap to 19.8% from 38.9%, minimizing Corporate Income Tax gap to 30.0% from the current 32.2% recorded in FY’2022/23, integrating KRA tax system with telecommunication companies, and expanding the tax base to include the informal sector targeting the SMEs. Consequently, the expected improvement in revenue collection will help lower the budget deficit and reduce the need for aggressive borrowing. Notably, KRA collected a total revenue of Kshs 2.03 tn, against the revised target of Kshs 1.98 tn in FY’2021/2022, translating to a performance rate of 102.8%. However, the upward revision of taxes comes at a time when the business environment remains subdued, underpinned by the elevated inflationary pressures and the aggressive depreciation of the Kenyan shilling that has suppressed business production levels weighing down on the projected revenue performance. As such, we expect this will significantly affect revenue collection necessitating borrowing to plug in the budget deficit, with projected total borrowing at Kshs 689.2 bn in the FY’2023/24, representing a 4.3% of the GDP. Below is a chart showing the revenue collections and domestic borrowings over the last 10 financial years:
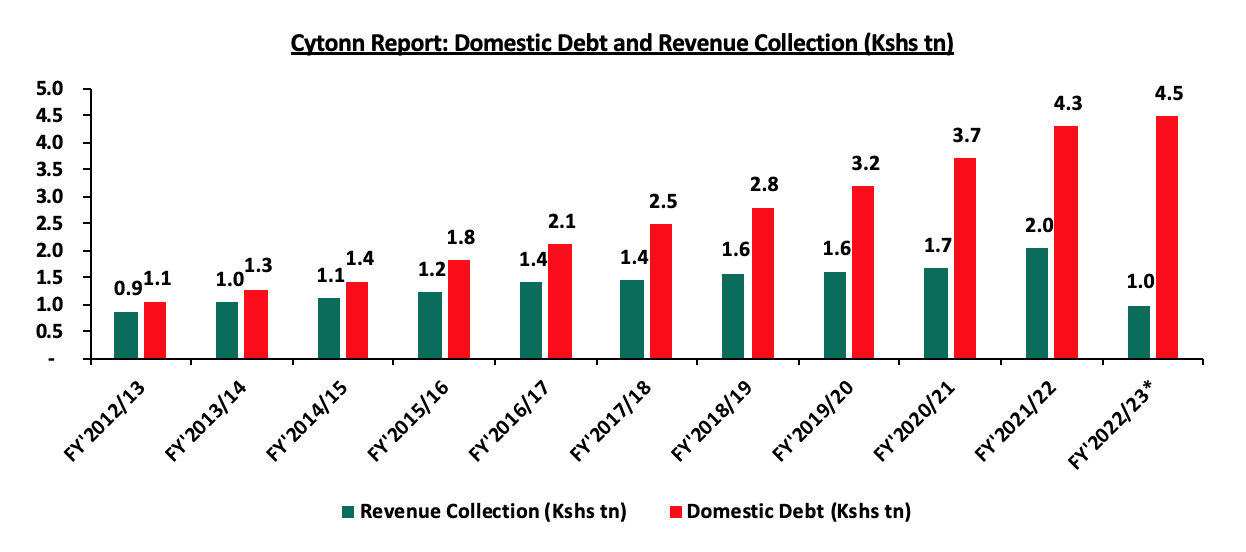
Source: National Treasury, Central Bank of Kenya, * Figures as of December 2022
- Liquidity
The MPC lowered the Cash Reserve Ratio (CRR) to 4.25% from 5.25% in their March 2020 sitting, which has since remained unchanged aimed at supporting the economic recovery from the ripple effects of Coronavirus pandemic. As a result, liquidity in the money market has remained relatively favorable as evidenced by the interbank rates at an average of 4.9% in 2022, compared to an average of 4.7% in 2021, with average interbank volumes increasing significantly by 74.7% to Kshs 18.6 bn in 2022, from Kshs 10.7 bn in 2021. In an ideal situation, ample liquidity in the money market, the lowering of commercial banks’ lending, and deposit rates would lead to increased money supply in the economy and an increase in consumers’ purchasing power.
The low Cash Reserve Ratio has played a big role in maintaining favorable liquidity in the money market as well increases the supply of money by commercial banks. We expect liquidity to improve in 2023 driven by increased access to credit as banks gradually increase their lending to the private sector and the continued adoption of risk-based lending by banks. However, due to uncertainties in the economy occasioned by elevated inflationary pressures, there still exists a high credit risk which hampers lending to businesses and individuals. As such, we expect to see more money flow into government securities, which will provide huge relief on government yields due to reduced credit competition from the private sector. Additionally, liquidity in the money market is expected to remain favorable as the Central Bank will have to settle T-bonds and T-bill maturities worth Kshs 214.4 bn and Kshs 448.0 bn, respectively for the FY’2022/23.
- Monetary Policy
The Monetary Policy Committee (MPC) has met once in 2023, where it retained the Central Bank Rate (CBR) at 8.75% after increasing the CBR by a cumulative 1.75% points in 2022 to 8.75% from the previous 7.00%. The hiking of the CBR in 2022 was aimed at anchoring inflation which is currently above the government’s target range of 2.5%-7.5% and also strengthen the weakening Kenyan shilling. Consequently, yields on government securities were on an upward trajectory mainly driven by investors’ demand for higher yield to cushion themselves against the high inflation rates recorded throughout the year coupled with increased borrowing appetite by the government. The Central Bank is expected to continue with the restrictive monetary policy stance in the medium term with the intention to anchor inflation back to CBK’s target range of 2.5%-7.5%. As such, we expect to see continued upward pressure on the interest rates as the government compensates investors for the increased risks posed by currency depreciation and elevated inflation.
Outlook:
|
Driver |
Outlook |
Effect on Interest Rates |
|
Fiscal Policies |
|
Negative |
|
Monetary Policy |
|
Neutral |
|
Liquidity |
|
Neutral |
From the above basis, 1 of the drivers is negative (fiscal policies), and 2 are neutral (Monetary policies and liquidity). We therefore believe that the interest rate environment remains uncertain and will likely adjust upwards.
Section IV: Conclusion and our view going forward
Based on the factors discussed above and factoring in the uncertainties in the Kenyan macroeconomic environment;
- We expect the Kenya Shilling to trade within the range of between Kshs 130.2 and Kshs 134.4 against the USD in 2023 based on the purchasing power parity (PPP) and interest rate parity (IRP) approach respectively, with a bias of a 6.4% depreciation mainly driven by:
- The ever present current account deficit with Kenya being a net importer, which will increase dollar demand in the market, and,
- The currently high global crude oil prices that have weighed in on the dollar demand from oil and energy importers who will have to increase the amounts they pay for oil imports and hence depleting dollar supply in the market.
- We expect a continued upward readjustment on the yield curve with our sentiments being on the back of:
- Increased pressure on the government to meet its budget deficit by borrowing more domestically. The government is likely to accept expensive bids and in turn destabilize the interest rate environment, and,
- Uncertainties about the economy occasioned by elevated inflationary pressures which have resulted in high credit risk which hampers lending to businesses and individuals.
Concerns remain high on the future performance of the shilling given the current pressures as well as the dwindling country’s forex reserves and the rising debt level. As such, we expect to see continued depreciation of the Kenyan shilling which will consequently have a negative impact on the economy as a result of increased import bill. Additionally, despite the tightened monetary policy, we expect inflation to remain high in the short term given the high fuel and fuel prices. Despite the fact that the current pressure on the Kenyan shilling is unlikely to abate in the near term, there are actionable steps that can be taken by the Government to mitigate further depreciation of the shilling. These include;
- Formulate policies to enhance a more diversified economy- There is need to enact policies to promote diversification of the economy with a key focus on improving the Kenya’s manufacturing sector in order to create an economy that is less dependent on agriculture. Key to note, the manufacturing sector contributes less than 10.0% to the country’s GDP, despite the fact that it could contribute more given the various opportunities available. This will consequently improve the country’s current account deficit through increased exports as well as preserve the country’s foreign exchange reserves, which will go a long way stabilizing the exchange rate,
- Enhancing fiscal consolidation- This will address the high fiscal deficit arising from the higher government expenditure as compared to the revenue collections which has continued to be the main driver of the high borrowing levels. The government can bridge the deficit gap by instituting austerity measures, reducing amounts extended to recurrent expenditure and focus on developments that will give back to the economy. These will reduce the government’s need for aggressive borrowing and in turn stabilize the exchange rate,
- Reduction of commercial loans. There is need for the government to reduce the share of commercial loans in order to reduce debt servicing costs. This is mainly because commercial loans attract higher interest rates as compared to concessional borrowings. Reduced debt service amounts would greatly help to bring down demand for the dollar and stabilize the exchange rate,
- Building an export driven economy. The government can do this by formulating and implementing robust export oriented policies and manufacturing to increase exports aimed at reducing the current account while reducing overreliance on imports to preserve the country’s foreign exchange reserves,
- Alternative projects financing strategies. The government should diversify sourcing of funding for infrastructure projects in the country to further shift to alternative financing strategies such as Public-Private Partnerships (PPPs), joint ventures and stimulate capital markets. This will attract more private sector involvement in funding development projects such as infrastructure instead of borrowing, and,
- Formulation of diaspora friendly policies. The Government should work in close conjunction with banks and other investments institutions to allow for favourable accounts for diaspora citizens, which will encourage them to remit more money back to the country hence cushioning the shilling against further depreciation. This can be done by reducing money transfer costs by exploring alternative channels for remitting money by leveraging on digitization and technology and explore alternative channels,
- Improve Ease of Doing Business. Improving the ease of doing business will make it easier for entrepreneurs to form business ventures, which will eventually grow, employ people and contribute to tax revenues.
Disclaimer: The views expressed in this publication are those of the writers where particulars are not warranted. This publication, which is in compliance with Section 2 of the Capital Markets Authority Act Cap 485A, is meant for general information only and is not a warranty, representation, advice or solicitation of any nature. Readers are advised in all circumstances to seek the advice of a registered investment advisor

- Talk to us
- Kenya
- P.O Box 20695 - 00200, Nairobi, Kenya
- Cell +254709101200
- Tel +254709101200
- WhatsApp +254741676635
- United States
- +254709101200
- DOWNLOAD OUR APP
-


- Kenya
- 8th Floor, Pinetree Plaza, Kaburu Drive, Ngong Road, Nairobi, Kenya
- USA
- Suite 1150, 1775 Eye Street NW, USA, Washington DC 20006, USA
- Investments
- High Yield
- Private Equity
- Real Estate
- Real Estate
- RiverRun Estates
- Cytonn Towers
- The Ridge
- Taraji Heights
- The Alma