Cytonn Monthly – October 2025
By Research Team, Nov 2, 2025
Executive Summary
Fixed Income
During the month of October 2025, T-bills were undersubscribed, with the overall average subscription rate coming in at 97.6%, lower than the subscription rate of 118.9% recorded in September 2025. The overall average subscription rates for the 91-day and 364-day papers decreased to 136.6% and 133.2% from 235.6% and 156.5% recorded in September 2025 respectively while the subscription rates for the 182-day paper increased to 46.2% from the 34.7% and recorded in September 2025. The average yields on the government papers were on a downward trajectory during the month, with the average 91-day, 182-day, and 364-day papers yields decreasing by 8.8 bps, 9.7 bps, and 14.3 bps to 7.9%, 7.9% and 9.4% respectively, from an average of 8.0%, 8.0% and 9.6% recorded the previous month. For the month of October, the government accepted a total of Kshs 93.4 bn of the Kshs 93.7 bn worth of bids received in T-Bills, translating to an acceptance rate of 99.6%, compared to an acceptance rate of 89.7% in the month of September;
During the week, T-bills were oversubscribed for the fourth consecutive week, with the overall subscription rate coming in at 101.1%, slightly lower than the subscription rate of 105.9% recorded the previous week. Investors’ preference for the shorter 91-day paper waned, with the paper receiving bids worth Kshs 1.9 bn against the offered Kshs 4.0 bn, translating to a subscription rate of 46.7%, significantly lower than the subscription rate of 325.0%, recorded the previous week. The subscription rates for the 182-day paper decreased to 15.6% from the 70.3% recorded the previous week, while that of the 364-day paper increased significantly to 208.2% from the 53.7% recorded the previous week. The government accepted a total of Kshs 24.2 bn worth of bids out of Kshs 24.3 bn bids received, translating to an acceptance rate of 99.97%. The yields on the government papers recorded a mixed performance with the yields on the 91-day paper decreasing the most by 2.0 bps to 7.81% from the 7.83% recorded the previous week, while the 364-day paper decreased by 0.6 bps to 9.34% from the 9.35% recorded the previous week. The yield on the 182-day paper increased by 3.5 bps to 7.90% from the 7.87% recorded the previous week;
Additionally, October 2025 bonds were oversubscribed, with the overall average subscription rate coming in at 118.9%, lower than the average subscription rate of 141.8% recorded in September 2025. The reopened bonds FXD1/2018/015 and FXD1/2021/020 with tenors to maturity of 7.7 years and 15.9 years respectively and fixed coupon rates of 12.7% and 13.4% respectively, received bids worth Kshs 118.9 bn against the offered Kshs 50.0 bn translating to an oversubscription rate of 237.8%. The government accepted bids worth Kshs 85.3 bn, translating to an acceptance rate of 71.7%. The weighted average yield for the accepted bids for the FXD1/2018/015 and FXD1/2021/020 came in at 12.7% and 13.5% respectively.
Equities
During the month of October, the equities market was on an upward trajectory, with NSE 25, NSE 10, NASI and NSE 20 gaining by 8.1%, 7.1%, 6.5% and 4.8% respectively. The equities market performance was mainly driven by gains recorded by large-cap stocks such as NCBA, Equity and EABL, of 27.5%, 14.2% and 9.8%, respectively. The performance was, however, weighed down by losses by large cap stocks such as Cooperative Bank of 1.4%;
During the week, the equities market was on an upward trajectory, with NSE 10 gaining the most by 5.8% while NASI, NSE 25 and NSE 20 gained by 4.7%, 4.3% and 2.5% respectively, taking the YTD performance to gains of 51.4%, 50.2%, 44.6% and 43.9% for NSE 20, NASI, NSE 25 and NSE 10 respectively. The week on week equities market performance was driven by gains recorded by large-cap stocks such as Equity Bank, Safaricom and KCB of 11.3%, 6.9%, and 5.6% respectively. The performance was however weighed down by losses recorded by large-cap stocks such as NCBA, Stanbic Bank and BAT of 3.3%, 1.1% and 0.1% respectively;
Also, during the month, the banking sector index declined by 8.1% to close at 152.1 from the 165.6 recorded at the start of the month. This was attributable to losses recorded by stocks such as Cooperative of 1.4% respectively. The performance was, however, supported by gains recorded by stocks such as NCBA, Equity and KCB of 27.5%, 14.2% and 8.4% respectively;
During the week, the banking sector index declined by 3.7% to 152.1 from 157.9 recorded the previous week. This is attributable to losses recorded by stocks such as NCBA and Stanbic of 3.3% and 1.1% respectively. The performance was, however, supported by gains recorded by stocks such as Equity Bank and KCB of 11.3% and 5.6% respectively;
During the week, Equity Group released Q3’2025 financial results, it’s Profit After Tax (PAT) increased by 32.2% to Kshs 54.1 bn, from Kshs 40.9 bn in Q3’2024. The performance was mainly driven by a 10.3% increase in Total Operating Income to Kshs 156.3 bn, from Kshs 141.7 bn in Q3’2024, coupled with the 0.03% decrease in Total Operating expense to Kshs 90.68 bn in Q3’2025, from Kshs 90.71 bn in Q3’2024. The decrease in Operating expenses was largely driven by the 8.2% decrease in loan loss provisions expense to Kshs 11.6 bn from Kshs 12.7 bn in Q3’2024;
During the week, Kenya Electricity Generating Company (KenGen), released its FY'2025 financial results for the period ended 31st June 2025, recording a profit after tax of Kshs 10.5 bn, a 54.2% increase from the Kshs 6.8 bn recorded in FY’2024, majorly attributable to the 10.6% decrease in operating expenses to Kshs 35.1 bn from Kshs 39.3 bn recorded in FY’2024, which was driven by cost optimization strategies and cutting edge-efficiency enhancements across the power plants.
Real Estate
During the week, the Kenya National Bureau of Statistics (KNBS) released the Leading Economic Indicators (LEI) August 2025 Reports, which highlighted the performance of major economic indicators;
During the week, Hilton has marked a significant milestone in Kenya with the launch of the AVA Hotel Nairobi, Tapestry Collection by Hilton in the upscale Lavington suburb of Nairobi. The 91-room property will be operated by Aleph Hospitality under Hilton’s Tapestry Collection brand, which focuses on lifestyle-driven, locally rooted hotels. The hotel will include modern amenities such as rooftop spaces, a swimming pool, dining outlets and meeting rooms, signaling the rising ambition of Kenya’s hospitality players to serve both business and high-end leisure travelers;
During the week, President William Ruto, launched the construction of the 81 km Kasoyo- Kampi Samaki Road in Baringo County, marking an important milestone for infrastructure development in the region. The road links the settlement of Kasoyo with Kampi Ya Samaki on the shores of Lake Baringo and aims to enhance connectivity, stimulate economic activity and bolster regional development;
Additionally, during the week, the Kenya Ports Authority has revealed its plans to establish a special cruise terminal at the Lamu Port in Kililana. Addressing journalists in Lamu after receiving 120 international tourists who were aboard the MV SH Diana, Lamu Port General Manager said cruise tourism had shown impressive growth at least six vessels making calls this year alone. The move marks a new chapter for Kenya’s maritime infrastructure, positioning Lamu not only as a cargo hub but also as a key gateway for leisure and tourism-related maritime traffic;
Also, during the week, the Asian Infrastructure Investment Bank (AIIB) is lining up its first project in Kenya, which has lined up its debut mega road investment in the country. The multilateral lender has invited bids for a consultancy to evaluate the upgrading of the 243-kilometre Mau Summit–Malaba Highway into a modern, tolled dual carriageway. This marks a significant step in diversifying Kenya’s infrastructure financing sources and underscores growing investor confidence in the country’s transport sector;
During the week, Mi Vida Homes announced plans to raise between Kshs 15.0 bn and 20.0 bn from both local and international institutional investors in the first quarter of 2026. This is considered a big stride in Kenya’s Real Estate sector because this is set to be earmarked as Kenya’s first hybrid Real Estate fund. A hybrid Real Estate fund describes an investment vehicle that is designed to pool capital from investors by combining both an Income and Development Real Estate Investment Trust (REIT);
On the Unquoted Securities Platform, Acorn D-REIT and I-REIT traded at Kshs 27.4 and Kshs 23.2 per unit, respectively, as per the last updated data on 24th October 2025. The performance represented a 37.0% and 16.0% gain for the D-REIT and I-REIT, respectively, from the Kshs 20.0 inception price. Additionally, ILAM Fahari I-REIT traded at Kshs 11.0 per share as of 24th October 2025, representing a 45.0% loss from the Kshs 20.0 inception price.
Investment Updates:
- Weekly Rates: Cytonn Money Market Fund closed the week at a yield of 12.1% p.a. To invest, dial *809# or download the Cytonn App from Google Play store here or from the Appstore here;
- We continue to offer Wealth Management Training every Monday, from 10:00 am to 12:00 pm. The training aims to grow financial literacy among the general public. To register for any of our Wealth Management Trainings, click here;
- If interested in our Private Wealth Management Training for your employees or investment group, please get in touch with us through wmt@cytonn.com;
- Cytonn Insurance Agency acts as an intermediary for those looking to secure their assets and loved ones’ future through insurance namely; Motor, Medical, Life, Property, WIBA, Credit and Fire and Burglary insurance covers. For assistance, get in touch with us through insuranceagency@cytonn.com;
- Cytonn Asset Managers Limited (CAML) continues to offer pension products to meet the needs of both individual clients who want to save for their retirement during their working years and Institutional clients that want to contribute on behalf of their employees to help them build their retirement pot. To more about our pension schemes, kindly get in touch with us through pensions@cytonn.com;
Money Markets, T-Bills Primary Auction:
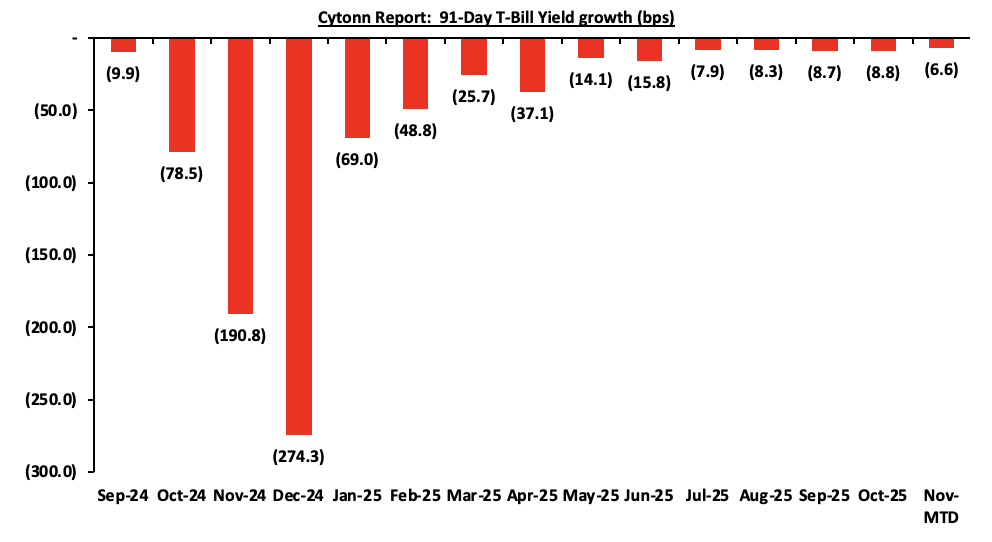
During the month of October 2025, T-bills were undersubscribed, with the overall average subscription rate coming in at 97.6%, lower than the subscription rate of 118.9% recorded in September 2025. The overall average subscription rates for the 91-day and 364-day papers decreased to 136.6% and 133.2% from 235.6% and 156.5% recorded in September 2025 respectively while the subscription rates for the 182-day paper increased to 46.2% from the 34.7% and recorded in September 2025. The average yields on the government papers were on a downward trajectory during the month, with the average 91-day, 182-day, and 364-day papers yields decreasing by 8.8 bps, 9.7 bps, and 14.3 bps to 7.9%, 7.9% and 9.4% respectively, from an average of 8.0%, 8.0% and 9.6% recorded the previous month. For the month of October, the government accepted a total of Kshs 93.4 bn of the Kshs 93.7 bn worth of bids received in T-Bills, translating to an acceptance rate of 99.6%, compared to an acceptance rate of 89.7% in the month of September;
The chart below shows the yield growth rate for the 91-day paper in 2024 and during the year:
This week, T-bills were oversubscribed for the fourth consecutive week, with the overall subscription rate coming in at 101.1%, slightly lower than the subscription rate of 105.9% recorded the previous week. Investors’ preference for the shorter 91-day paper waned, with the paper receiving bids worth Kshs 1.9 bn against the offered Kshs 4.0 bn, translating to a subscription rate of 46.7%, significantly lower than the subscription rate of 325.0%, recorded the previous week. The subscription rates for the 182-day paper decreased to 15.6% from the 70.3% recorded the previous week, while that of the 364-day paper increased significantly to 208.2% from the 53.7% recorded the previous week. The government accepted a total of Kshs 24.2 bn worth of bids out of Kshs 24.3 bn bids received, translating to an acceptance rate of 99.97%. The yields on the government papers recorded a mixed performance with the yields on the 91-day paper decreasing the most by 2.0 bps to 7.81% from the 7.83% recorded the previous week, while the 364-day paper decreased by 0.6 bps to 9.34% from the 9.35% recorded the previous week. The yield on the 182-day paper increased by 3.5 bps to 7.90% from the 7.87% recorded the previous week;
The charts below show the performance of the 91-day, 182-day and 364-day papers from January 2024 to November 2025: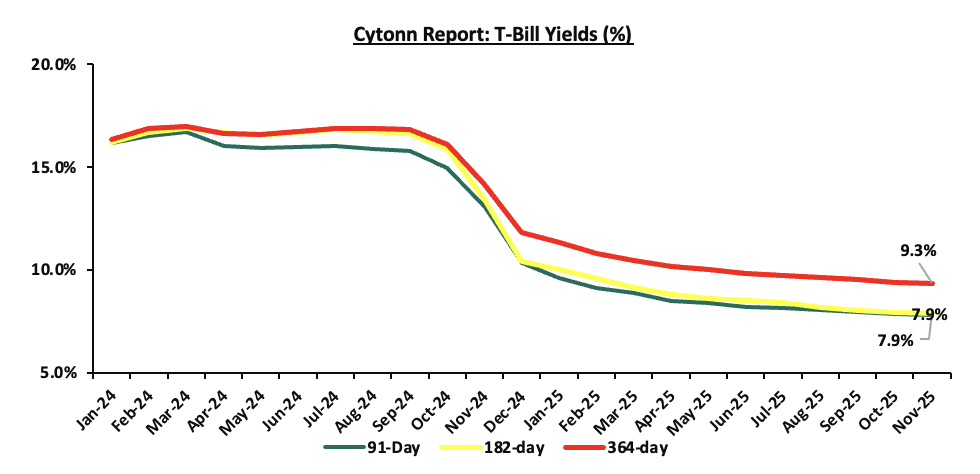
So far in the current FY’2025/26, government securities totaling Kshs 732.0 bn have been advertised. The government has accepted bids worth Kshs 917.1 bn, of which Kshs 426.5 bn and Kshs 490.5 bn were treasury bills and bonds, respectively. Total redemptions so far in FY’2025/26 equal to Kshs 440.8 bn, with treasury bills accounting for the entire amount. As a result, the government has a domestic borrowing surplus of Kshs 476.3 bn in FY’2025/26.
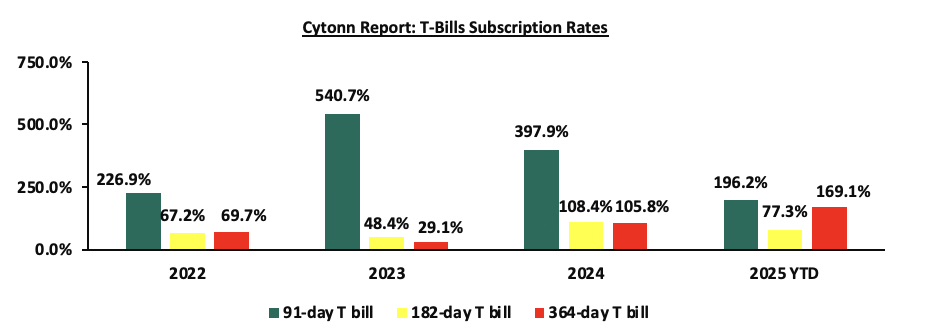
The chart below compares the overall average T-bill subscription rates obtained in 2022,2023, 2024 and 2025 Year-to-date (YTD):
Additionally, October 2025 bonds were oversubscribed, with the overall average subscription rate coming in at 118.9%, lower than the average subscription rate of 141.8% recorded in September 2025. The reopened bonds FXD1/2018/015 and FXD1/2021/020 with tenors to maturity of 7.7 years and 15.9 years respectively and fixed coupon rates of 12.7% and 13.4% respectively, received bids worth Kshs 118.9 bn against the offered Kshs 50.0 bn translating to an oversubscription rate of 237.8%. The government accepted bids worth Kshs 85.3 bn, translating to an acceptance rate of 71.7%. The weighted average yield for the accepted bids for the FXD1/2018/015 and FXD1/2021/020 came in at 12.7% and 13.5% respectively.
The table below provides more details on the bonds issued in October 2025:
|
Issue Date |
Bond Auctioned |
Effective Tenor to Maturity (Years) |
Coupon |
Amount offered (Kshs bn) |
Actual Amount Raised/Accepted (Kshs bn) |
Total bids received (Subscription) |
Average Accepted Yield |
Subscription Rate |
Acceptance Rate |
|
10/13/2025 |
FXD1/2018/015-Reopened |
7.7 |
12.7% |
50.0 |
31.6 |
45.0 |
12.7% |
237.8% |
70.2% |
|
FXD1/2021/020-Reopened |
15.9 |
13.4% |
53.7 |
73.9 |
13.5% |
72.7% |
|||
|
October 2025 Average |
11.8 |
13.1% |
50.0 |
85.3 |
118.9 |
13.1% |
118.9% |
71.4% |
|
|
September 2025 Average |
16.7 |
13.1% |
60.0 |
63.8 |
105.4 |
13.9% |
141.8% |
63.0% |
|
|
2024 Average
|
6.7 |
15.6% |
27.7 |
28.9 |
37.9 |
16.7% |
116.8% |
74.9% |
|
During the month, the government announced its second domestic treasury bond buyback of the year, aiming to buyback Kshs 30.0 bn out of the Kshs 76.5 bn outstanding amount for the FXD1/2023/003 with a fixed coupon rate of 14.2% and tenor to maturity of 0.6 years. The period of sale for the bond opened on Thursday, 23rd October 2025 and will close on 17th November 2025, with a settlement date of 19th November 2025. Our expectation is that the bond buyback will be undersubscribed, given the remaining short-term tenor to maturity of the bond, as most investors may prefer to wait till maturity rather than sell at a potential discount. Additionally, if the government’s buyback price is not attractive then investors may prefer not to sell leading to an undersubscription.
In the primary bond market, the government is looking to raise Kshs 40.0 bn through the reopened bonds; FXD1/2012/020 and FXD1/2022/015 with fixed coupon rates of 12.0% and 13.9% respectively and tenors to maturity of 7.0 years and 11.4 years respectively. The period of sale for the two bonds opened on Thursday, 23rd October 2025 and will close on 5th November 2025. Our bidding ranges for FXD1/2012/020 and FXD1/2022/015 are 12.50%-13.00% and 14.20%-14.70% respectively.
Secondary Bond Market:
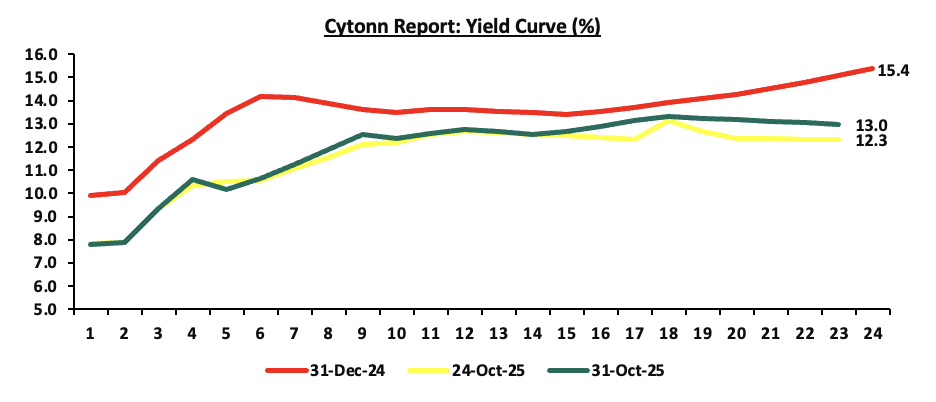
The yields on the government securities recorded a mixed performance during the month of October similar to September. Investors, apprehensive about the economic outlook in the long term, are demanding higher yields for bonds in the 11 to 22-year maturity range to compensate for the perceived risks as they anticipate potential fluctuations in economic conditions in the Kenyan market on the back of the government’s debt sustainability concerns. Notably, the yield curve has adjusted from a humped yield curve observed in most part of 2024, towards a normal upward sloping curve, with long-term bonds registering highest yields. The shift in sentiment indicates increased confidence in the short-term economic landscape, in comparison to the last two years. The chart below shows the yield curve movement during the period:
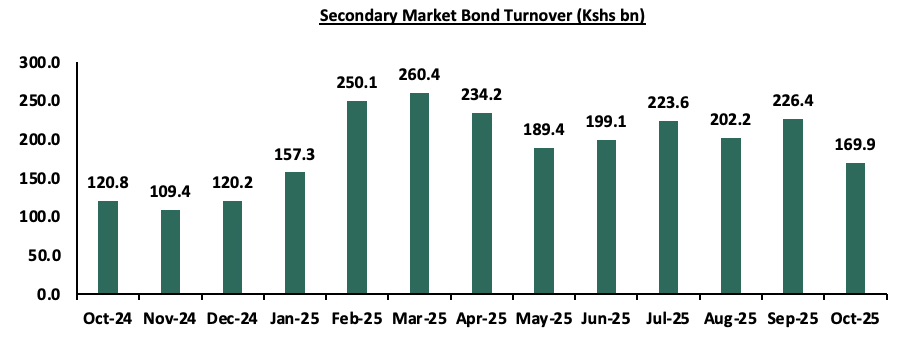
The secondary bond turnover decreased by 24.9% to Kshs 169.9 bn, from Kshs 226.4 bn recorded in September 2025, pointing towards decreased activities by commercial banks in the secondary bonds market for the month of October. On a year-on-year basis, the bond turnover increased by 40.7% from Kshs 120.8 bn worth of treasury bonds transacted over a similar period last year. The chart below shows the bond turnover over the past 12 months.
Money Market Performance:
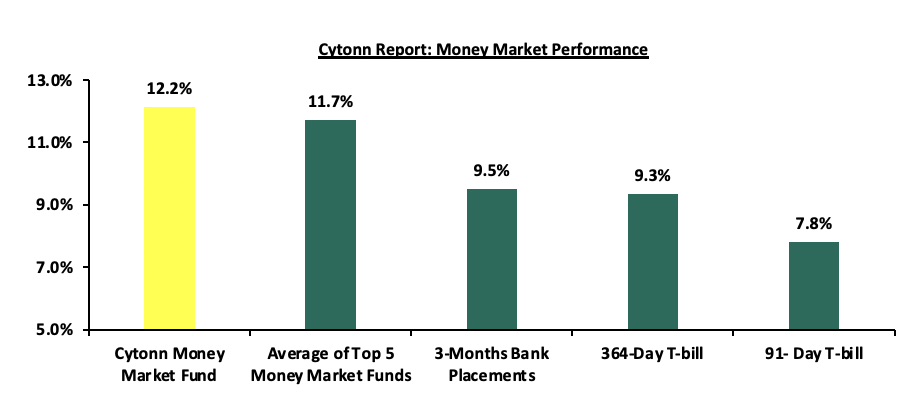
In the money markets, 3-month bank placements ended the week at 9.5% (based on what we have been offered by various banks). The yields on the 91-day paper and 364-day paper decreased by 2.0 bps and 0.6 bps to 7.81% and 9.34% respectively, from the 7.83% and 9.35% respectively recorded the previous week and the yield on the Cytonn Money Market Fund decreased by 41.0 bps to 12.2% from 12.6% recorded in the previous week, while the average yields on the Top 5 Money Market Funds decreased by 34.2 bps to 11.7% from the 12.1% recorded the previous week.
The table below shows the Money Market Fund Yields for Kenyan Fund Managers as published on 31st October 2025:
|
Money Market Fund Yield for Fund Managers as published on 31st October 2025 |
||
|
Rank |
Fund Manager |
Effective Annual Rate |
|
1 |
Cytonn Money Market Fund ( Dial *809# or download Cytonn App) |
12.2% |
|
2 |
Etica Money Market Fund |
11.9% |
|
3 |
Nabo Africa Money Market Fund |
11.8% |
|
4 |
Lofty-Corban Money Market Fund |
11.6% |
|
5 |
Enwealth Money Market Fund |
11.2% |
|
6 |
Orient Kasha Money Market Fund |
11.1% |
|
7 |
Jubilee Money Market Fund |
11.1% |
|
8 |
Kuza Money Market fund |
11.1% |
|
9 |
Ndovu Money Market Fund |
11.1% |
|
10 |
Gulfcap Money Market Fund |
10.9% |
|
11 |
Old Mutual Money Market Fund |
10.8% |
|
12 |
GenAfrica Money Market Fund |
10.8% |
|
13 |
British-American Money Market Fund |
10.7% |
|
14 |
Faulu Money Market Fund |
10.3% |
|
15 |
Arvocap Money Market Fund |
10.2% |
|
16 |
Madison Money Market Fund |
10.1% |
|
17 |
Dry Associates Money Market Fund |
9.9% |
|
18 |
CPF Money Market Fund |
9.7% |
|
19 |
Apollo Money Market Fund |
9.6% |
|
20 |
Sanlam Money Market Fund |
9.4% |
|
21 |
KCB Money Market Fund |
9.4% |
|
22 |
Mali Money Market Fund |
9.0% |
|
23 |
ICEA Lion Money Market Fund |
8.6% |
|
24 |
Co-op Money Market Fund |
8.6% |
|
25 |
CIC Money Market Fund |
8.5% |
|
26 |
Genghis Money Market Fund |
8.5% |
|
27 |
Mayfair Money Market Fund |
8.4% |
|
28 |
Absa Shilling Money Market Fund |
7.9% |
|
29 |
AA Kenya Shillings Fund |
7.1% |
|
30 |
Ziidi Money Market Fund |
6.4% |
|
31 |
Stanbic Money Market Fund |
6.4% |
|
32 |
Equity Money Market Fund |
5.1% |
Source: Business Daily
Liquidity:
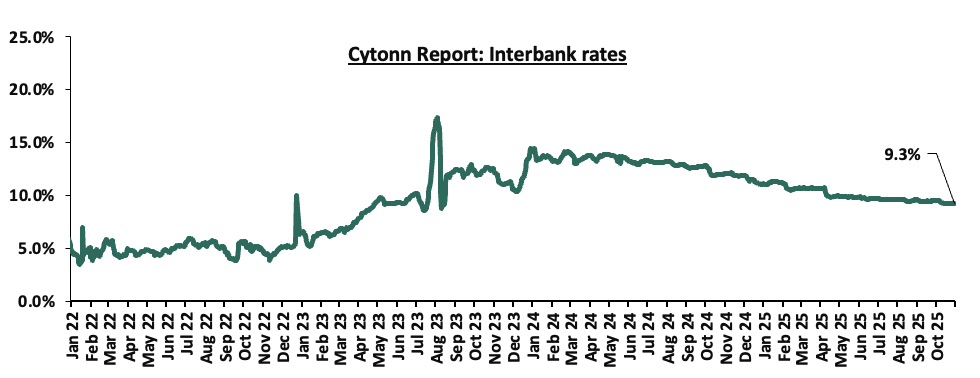
Liquidity in the money markets eased in the month of October 2025, with the average interbank rate decreasing by 0.2 points to 9.3% from 9.5% recorded the previous month. However, the average interbank volumes traded increased by 0.8% to Kshs 12.2 bn, from Kshs 12.1 bn recorded in September 2025. Additionally, during the week, liquidity in the money markets eased, with the average interbank rate decreasing by 0.7 bps, to remain relatively unchanged from the 9.3% from recorded the previous week, partly attributable to government payments that offset tax remittances. The average interbank volumes traded decreased by 22.5% to Kshs 11.3 bn from Kshs 14.5 bn recorded the previous week. The chart below shows the interbank rates in the market over the years:
Kenya Eurobonds:
During the month, the yields on the Eurobonds recorded a mixed performance, with the yield on the 7-year Eurobond issued in 2024 decreasing the most by 12.8 bps to 7.8% from 7.9% recorded at the beginning of the month. The yield on the 10-year Eurobond issued in 2018 increased the most by 12.8 bps to 6.0% from the 5.8% recorded at the beginning of the month. Similarly, during the week, the yields on the Eurobonds recorded a mixed performance with the yield on the 12-year Eurobond issued in 2019 decreasing the most by 20.0 bps to 8.1% from 8.3% recorded the previous week. The yield on the 10-year Eurobond issued in 2018 increased the most by 10.5 bps to 6.0% from the 5.9% recorded the previous week. The table below shows the summary performance of the Kenyan Eurobonds as of 30th October 2025;
|
Cytonn Report: Kenya Eurobond Performance |
|||||||
|
|
2018 |
2019 |
2021 |
2024 |
2025 |
||
|
Tenor |
10-year issue |
30-year issue |
7-year issue |
12-year issue |
13-year issue |
7-year issue |
11-year issue |
|
Amount Issued (USD) |
1.0 bn |
1.0 bn |
0.9 bn |
1.2 bn |
1.0 bn |
1.5 bn |
1.5 bn |
|
Years to Maturity |
2.5 |
22.5 |
1.7 |
6.7 |
8.8 |
5.5 |
10.5 |
|
Yields at Issue |
7.3% |
8.3% |
7.0% |
7.9% |
6.2% |
10.4% |
9.9% |
|
2-Jan-25 |
9.1% |
10.3% |
8.5% |
10.1% |
10.1% |
10.1% |
|
|
1-Oct-25 |
5.8% |
9.3% |
- |
8.1% |
8.4% |
7.9% |
|
|
23-Oct-25 |
5.9% |
9.3% |
- |
8.3% |
8.6% |
7.9% |
|
|
24-Oct-25 |
5.9% |
9.2% |
- |
8.1% |
8.5% |
7.9% |
|
|
27-Oct-25 |
5.8% |
9.1% |
- |
8.0% |
8.3% |
7.8% |
|
|
28-Oct-25 |
5.8% |
9.1% |
- |
8.0% |
8.3% |
7.8% |
|
|
29-Oct-25 |
5.8% |
9.1% |
- |
7.9% |
8.3% |
7.7% |
|
|
30-Oct-25 |
6.0% |
9.2% |
- |
8.1% |
8.4% |
7.8% |
|
|
Weekly Change |
0.1% |
(0.2%) |
- |
(0.2%) |
(0.2%) |
(0.1%) |
- |
|
MTD Change |
0.1% |
(0.1%) |
- |
(0.1%) |
0.0% |
(0.1%) |
- |
|
YTD Change |
(3.1%) |
(1.1%) |
- |
(2.0%) |
(1.7%) |
(2.3%) |
- |
Source: Central Bank of Kenya (CBK) and National Treasury
Kenya Shilling:
During the month, the Kenya Shilling depreciated marginally by 0.08 bps against the US Dollar, to remain relatively unchanged from the Kshs 129.2 recorded at the end of September.
During the week, the Kenya Shilling depreciated marginally against the US Dollar by 0.04 bps, to close the week at Kshs 129.2 and remain unchanged from the previous week. On a year-to-date basis, the shilling has appreciated by 5.2 bps against the dollar, lower than the 17.4% appreciation recorded in 2024.
We expect the shilling to be supported by:
- Diaspora remittances standing at a cumulative USD 5,080.0 mn in the twelve months to September 2025, 7.6% higher than the USD 4,722.6 mn recorded over the same period in 2024.These has continued to cushion the shilling against further depreciation. In the September 2025 diaspora remittances figures, North America remained the largest source of remittances to Kenya accounting for 58.6% in the period,
- The tourism inflow receipts which are projected to reach KSh 560.0 bn in 2025 up from KSh 452.2 bn in 2024 a 23.9% increase, and owing to tourist arrivals that improved by 9.9% to 2,424,382 in the 12 months to June 2025 from 2,206,469 in the 12 months to June 2024, and,
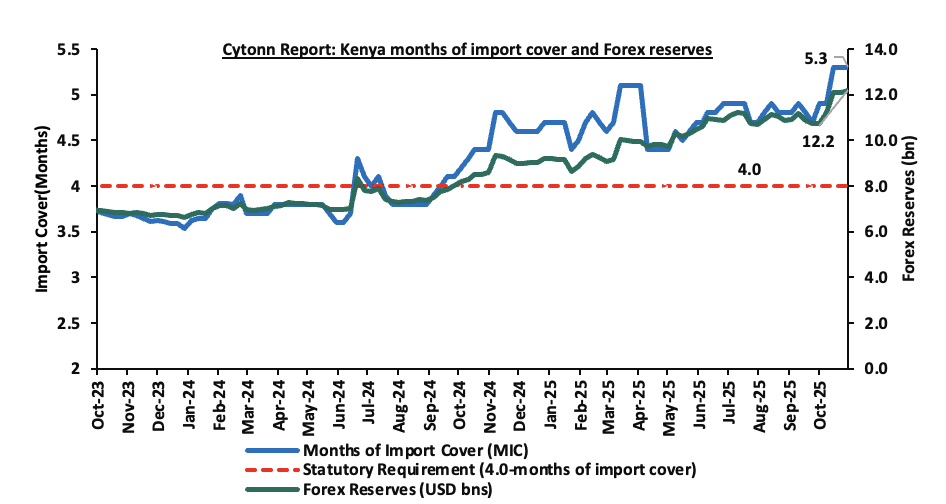
- Improved forex reserves currently at USD 12.2 bn (equivalent to 5.3-months of import cover), which is above the statutory requirement of maintaining at least 4.0-months of import cover and above the EAC region’s convergence criteria of 4.5-months of import cover.
The shilling is however expected to remain under pressure in 2025 as a result of:
- An ever-present current account deficit which came at 2.1% of GDP in the twelve months to August 2025, and,
- The need for government debt servicing, continues to put pressure on forex reserves given that 59.7% of Kenya’s external debt is US Dollar-denominated as of June 2025.
Key to note, Kenya’s forex reserves increased by 13.8% during the month of October 2025, to USD 12.2 bn, from the USD 10.7 bn recorded in the previous month, equivalent to 5.3 months of import cover and above the statutory requirement of maintaining at least 4.0-months of import cover. Additionally, during the month, the months of import cover increased to 5.3 months from 4.7 months recorded in the previous month. Additionally, Kenya’s forex reserves increased by 0.9% during the week to USD 12.2 bn from USD 12.1 bn recorded the previous week, equivalent to 5.3 months of import cover, and above the statutory requirement of maintaining at least 4.0-months of import cover.
The chart below summarizes the evolution of Kenya's months of import cover over the years:
Weekly Highlights
- Inflation Highlight October 2025
The year-on-year inflation in October 2025 remained unchanged from the 4.6% recorded in September 2025. The headline inflation was primarily driven by price increases in the following categories: Food & Non-Alcoholic Beverages at 8.0%, Transport at 4.8%, and Housing, Water, Electricity, Gas and Other Fuels at 1.9%. The month-on-month inflation rate stood at 0.2% in October 2025. The table below summarizes the performance of commodity indices both on a year-on-year and month-on-month basis:
|
Cytonn Report: Major Inflation Changes –October 2025 |
|||
|
Broad Commodity Group |
Price change m/m (October-2025/ September -2025) |
Price change y/y (October-2025/October-2024) |
Reason |
|
Food and non- alcoholic beverages |
0.2% |
8.0% |
The m/m increase was mainly driven by the increase in prices of Oranges, potatoes (Irish) and tomatoes of 4.2%, 1.6%, 1.2%, respectively. However, the increase was weighed down by prices of maize flour (sifted) and fortified maize flour decreased by 2.3% and 2.2%, respectively, while those of eggs (exotic/kienyenji), kale (sukuma wiki), beans, and sugar dropped by between 0.5% and 1.2%. |
|
Transport |
0.4% |
4.8% |
The transport index recorded a slight m/m increase mainly due to an increase in prices of passenger transport costs with the bus/matatu fare for travel between towns increased by 1.4%. However, the increase was weighed down by a 0.6% decline in the prices for international flights while prices of petrol and diesel remained unchanged. |
|
Housing, water, electricity, gas and other fuels |
0.3% |
1.9% |
The m/m increase was mainly driven by an increase in prices of 50kWh electricity and 200kWh electricity by 3.3% and 3.0% respectively. while single room house rent recorded an increase of 0.2%. However, the increase was weighed down by the decrease in the price of gas/LPG by 0.6%. |
|
Overall Inflation |
0.2% |
4.6% |
The m/m increase was mainly attributable to the 0.4% increase in transport |
In October 2025, overall inflation remained unchanged from the 4.6% recorded in September 2025 on a y/y basis, signalling mild upward price pressure in key sectors. Despite this, the inflation rate remained within the Central Bank of Kenya’s preferred range of 2.5%–7.5% for the twenty-eighth consecutive month, underscoring ongoing macroeconomic stability. The increase was primarily driven by an 8.0% y/y rise in food and non-alcoholic beverage prices, a 4.8% increase in transport costs and a 1.9% rise in housing, water, electricity, gas and other fuels. On a month-to-month basis, inflation was marginal at 0.2%, indicating relative price stability. Prices for Super Petrol and Diesel remained unchanged at Kshs 184.5 and 171.5 per litre respectively. Additionally, the recent reduction in the Central Bank Rate to 9.25% from 9.50% is expected to stimulate credit uptake and increase money supply, which could gradually exert upward pressure on inflation in the coming months as monetary easing transmits through the broader economy. Meanwhile, the Kenya Shilling maintained stability, recording a 0.08 bps month-to-date appreciation as of 31st October 2025 to remain relatively unchanged from the Kshs 129.2 recorded at the end of September and a 5.2 bps year-to-date gain to Kshs 129.2 as of 31st October 2025, from the Kshs 129.3 recorded at the beginning of the year. This stabilization in the exchange rate, combined with manageable fuel price increases, continues to anchor inflation expectations within the CBK’s target range.
The chart below shows the inflation rates for the past 5 years:
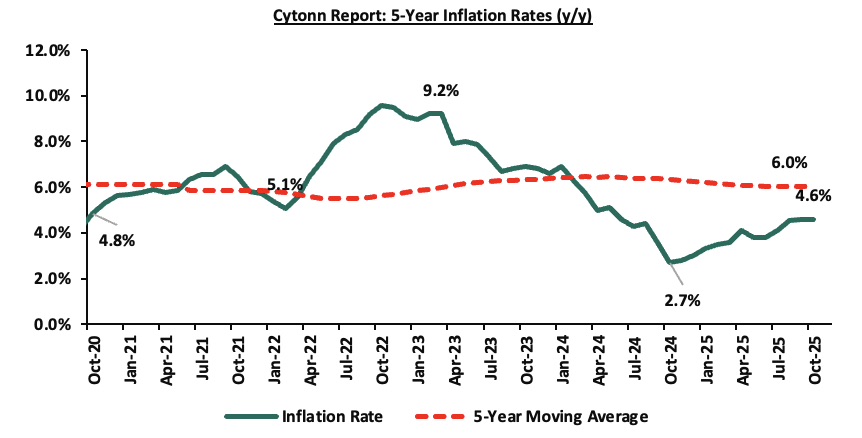
Going forward, we expect inflation to remain within the CBK’s preferred range of 2.5%-7.5%, mainly on the back of a stable currency and stable fuel prices. Additionally, favourable weather conditions will also contribute to stabilizing food prices, further supporting stable inflation rates. The risk, however, lies in the fuel prices which despite their stability still remain elevated compared to historical levels. Additionally, the Monetary Policy Committee cut the Central Bank Rate by 25.0 bps to 9.25% from 9.50% in its October 2025 meeting, with the aim of easing the monetary policy, while maintaining exchange rate stability, and will meet again in December 2025. This cut in the Central Bank Rate is likely to elevate inflationary pressures gradually as consumer spending rises from increased money supply. The committee is expected to adopt a more cautious approach to rate adjustments in the coming meetings in a bid to continue supporting the private sector, while also keeping an eye on the effect on the inflation and exchange rate.
Monthly Highlights:
- During the month, the monetary policy committee met on October 7th , 2025, to review the outcome of its previous policy decisions against a backdrop of elevated uncertainties to the global outlook for growth, lower sticky in advanced economies heightened trade tensions as well as persistent geopolitical tensions. The MPC decided to lower the CBR rate by 25.0 bps to 9.25%, from 9.50% in August 2025.For more information please see our Cytonn Weekly #41.
- During the month, The Energy and Petroleum Regulatory Authority (EPRA) released their monthly statement on the maximum retail fuel prices in Kenya, effective from 15th October 2025 to 14th November 2025. Notably, the maximum allowed prices for Super Petrol, Diesel and Kerosene remained unchanged from the previous pricing in September. Consequently, Super Petrol, Diesel and Kerosene will continue to retail at Kshs 184.5, Kshs 171.5 and Kshs 154.8 per litre respectively. For more information, please see our Cytonn Weekly#42
- During the month, the National Treasury gazetted the revenue and net expenditures for the third month of FY’2025/2026, ending 30th September 2025, highlighting that the total revenue collected as at the end of September 2025 amounted to Kshs 581.7 bn, equivalent to 21.1% of the original estimates of Kshs 2,754.7 bn for FY’2025/2026 and is 84.5% of the prorated estimates of Kshs 688.7 bn. For more information, please see our Cytonn Weekly#43
Rates in the Fixed Income market have been on a downward trend due to high liquidity in the money market which allowed the government to front load most of its borrowing. The government is 118.5% ahead of its prorated net domestic borrowing target of Kshs 218.0 bn, having a net borrowing position of Kshs 476.3 bn (inclusive of T-bills). However, we expect a stabilization of the yield curve in the short and medium term, with the government looking to increase its external borrowing to maintain the fiscal surplus, hence alleviating pressure in the domestic market. As such, we expect the yield curve to stabilize in the short to medium-term and hence investors are expected to shift towards the long-term papers to lock in the high returns
Market Performance:
During the month of October, the equities market was on an upward trajectory, with NSE 25, NSE 10, NASI and NSE 20 gaining by 8.1%, 7.1%, 6.5% and 4.8% respectively. The equities market performance was mainly driven by gains recorded by large-cap stocks such as NCBA, Equity and EABL, of 27.5%, 14.2% and 9.8%, respectively. The performance was, however, weighed down by losses by large cap stocks such as Cooperative Bank of 1.4%.
During the week, the equities market was on an upward trajectory, with NSE 10 gaining the most by 5.8% while NASI, NSE 25 and NSE 20 gained by 4.7%, 4.3% and 2.5% respectively, taking the YTD performance to gains of 51.4%, 50.2%, 44.6% and 43.9% for NSE 20, NASI, NSE 25 and NSE 10 respectively. The week on week equities market performance was driven by gains recorded by large-cap stocks such as Equity Bank, Safaricom and KCB of 11.3%, 6.9%, and 5.6% respectively. The performance was however weighed down by losses recorded by large-cap stocks such as NCBA, Stanbic Bank and BAT of 3.3%, 1.1% and 0.1% respectively.
Also, during the month, the banking sector index declined by 8.1% to close at 152.1 from the 165.6 recorded at the start of the month. This was attributable to losses recorded by stocks such as Cooperative of 1.4% respectively. The performance was, however, supported by gains recorded by stocks such as NCBA, Equity and KCB of 27.5%, 14.2% and 8.4% respectively
During the week, the banking sector index declined by 3.7% to 152.1 from 157.9 recorded the previous week. This is attributable to losses recorded by stocks such as NCBA and Stanbic of 3.3% and 1.1% respectively. The performance was, however, supported by gains recorded by stocks such as Equity Bank and KCB of 11.3% and 5.6% respectively;
Equities turnover decreased by 511% in the month of October to USD 88.0 mn from USD 180.0 mn recorded during the month of September 2025. Foreign investors remained net sellers, with a net selling position of USD 12.4 mn, from a net selling position of USD 38.4 mn recorded in September 2025.
During the week, equities turnover decreased by 37.9% to USD 20.0 mn from USD 32.2 mn recorded the previous week, taking the YTD total turnover to USD 872.1 mn. Foreign investors remained net sellers for the fourth consecutive week with a net selling position of USD 1.3 mn, from a net selling position of USD 12.7 mn recorded the previous week, taking the YTD foreign net selling position to USD 69.6 mn, compared to a net selling position of USD 2.3 mn recorded in 2024.
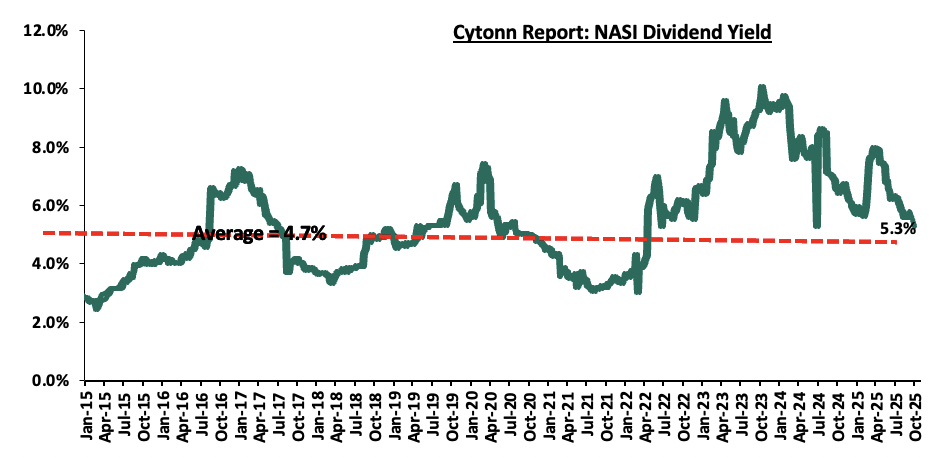
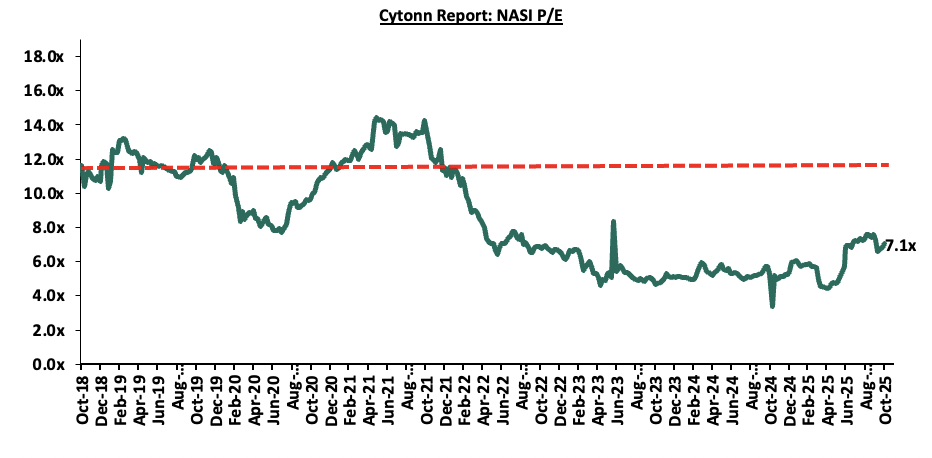
The market is currently trading at a price to earnings ratio (P/E) of 7.1x, 38.0% below the historical average of 11.4x, and a dividend yield of 5.3%, 0.6% points above the historical average of 4.7%. Key to note, NASI’s PEG ratio currently stands at 0.9x, an indication that the market is slightly undervalued relative to its future growth. A PEG ratio greater than 1.0x indicates the market may be overvalued while a PEG ratio less than 1.0x indicates that the market is undervalued.
The charts below indicate the historical P/E and dividend yields of the market;
Universe of Coverage:
|
Cytonn Report: Equities Universe of Coverage |
||||||||||||
|
Company |
Price as at 24/10/2025 |
Price as at 31/10/2025 |
w/w change |
m/m change |
YTD Change |
Year Open 2025 |
Target Price* |
Dividend Yield |
Upside/ Downside** |
P/TBv Multiple |
Recommendation |
|
|
Diamond Trust Bank |
104.0 |
105.0 |
1.0% |
0.5% |
57.3% |
66.8 |
128.3 |
6.7% |
28.8% |
0.4x |
Buy |
|
|
Standard Chartered Bank |
295.0 |
303.0 |
2.7% |
6.7% |
6.2% |
285.3 |
314.1 |
14.9% |
18.5% |
1.7x |
Accumulate |
|
|
I&M Group |
43.8 |
43.9 |
0.3% |
2.1% |
21.9% |
36.0 |
48.2 |
6.8% |
16.6% |
0.8x |
Accumulate |
|
|
ABSA Bank |
22.5 |
23.0 |
2.2% |
7.0% |
22.0% |
18.9 |
24.1 |
7.6% |
12.3% |
1.5x |
Accumulate |
|
|
Stanbic Holdings |
198.3 |
196.0 |
(1.1%) |
6.4% |
40.3% |
139.8 |
194.8 |
10.6% |
10.0% |
1.2x |
Hold |
|
|
Britam |
8.5 |
8.7 |
1.9% |
(2.9%) |
48.8% |
5.8 |
9.5 |
0.0% |
9.9% |
0.8x |
Hold |
|
|
KCB Group |
58.3 |
61.5 |
5.6% |
8.4% |
45.0% |
42.4 |
63.6 |
4.9% |
8.3% |
0.8x |
Hold |
|
|
Co-op Bank |
20.4 |
21.1 |
3.7% |
(1.4%) |
20.9% |
17.5 |
21.1 |
7.1% |
7.3% |
0.7x |
Hold |
|
|
Jubilee Holdings |
319.5 |
320.0 |
0.2% |
1.8% |
83.1% |
174.8 |
312.9 |
4.2% |
2.0% |
0.5x |
Lighten |
|
|
Equity Group |
59.5 |
66.3 |
11.3% |
14.2% |
38.0% |
48.0 |
61.2 |
6.4% |
(1.2%) |
1.1x |
Sell |
|
|
NCBA |
91.0 |
88.0 |
(3.3%) |
27.5% |
72.5% |
51.0 |
79.0 |
6.3% |
(4.0%) |
1.4x |
Sell |
|
|
CIC Group |
4.6 |
4.6 |
1.3% |
(4.3%) |
116.8% |
2.1 |
4.0 |
2.8% |
(10.3%) |
1.3x |
Sell |
|
|
*Target Price as per Cytonn Analyst estimates **Upside/ (Downside) is adjusted for Dividend Yield ***Dividend Yield is calculated using FY’2024 Dividends |
||||||||||||
Weekly Highlights
Earnings Release
- Equity Group’s Q3’2025 performance
Below is a summary of Equity Group’s Q3’2025 performance:
|
Balance Sheet Items |
Q3'2024 |
Q3'2025 |
y/y change |
|
Government Securities |
258.9 |
310.4 |
19.9% |
|
Net Loans and Advances |
800.1 |
859.8 |
7.5% |
|
Total Assets |
1703.1 |
1817.0 |
6.7% |
|
Customer Deposits |
1316.8 |
1345.5 |
2.2% |
|
Deposits/Branch |
3.7 |
3.3 |
(10.9%) |
|
Total Liabilities |
1476.1 |
1513.8 |
2.6% |
|
Shareholders’ Funds |
216.9 |
288.4 |
32.9% |
|
Balance Sheet Ratios |
Q3'2024 |
Q3'2025 |
% y/y change |
|
Loan to Deposit Ratio |
60.8% |
63.9% |
3.1% |
|
Government Securities to Deposit Ratio |
32.4% |
36.1% |
3.7% |
|
Return on average equity |
24.2% |
24.5% |
0.4% |
|
Return on average assets |
2.9% |
3.5% |
0.7% |
|
Income Statement (Kshs Bn) |
Q3'2024 |
Q3'2025 |
y/y change |
|
Net Interest Income |
80.6 |
93.6 |
16.1% |
|
Net non-Interest Income |
61.2 |
62.7 |
2.5% |
|
Total Operating income |
141.7 |
156.3 |
10.3% |
|
Loan Loss provision |
(12.7) |
(11.6) |
(8.2%) |
|
Total Operating expenses |
(90.7) |
(90.7) |
(0.03%) |
|
Profit before tax |
51.0 |
65.6 |
28.5% |
|
Profit after tax |
40.9 |
54.1 |
32.2% |
|
Core EPS |
10.4 |
13.8 |
32.7% |
|
Income Statement Ratios |
Q3'2024 |
Q3'2025 |
y/y change |
|
Yield from interest-earning assets |
11.7% |
11.3% |
(0.4%) |
|
Cost of funding |
4.1% |
3.7% |
(0.4%) |
|
Cost of risk |
8.9% |
7.4% |
(1.5%) |
|
Net Interest Margin |
7.7% |
7.9% |
0.2% |
|
Net Interest Income as % of operating income |
56.9% |
59.9% |
3.0% |
|
Non-Funded Income as a % of operating income |
43.1% |
40.1% |
(3.0%) |
|
Cost to Income Ratio |
64.0% |
58.0% |
(6.0%) |
|
CIR without LLP |
55.1% |
50.6% |
(4.5%) |
|
Cost to Assets |
4.6% |
4.4% |
(0.2%) |
|
Capital Adequacy Ratios |
Q3'2024 |
Q3'2025 |
% points change |
|
Core Capital/Total Liabilities |
16.9% |
19.1% |
2.2% |
|
Minimum Statutory ratio |
8.0% |
8.0% |
0.0% |
|
Excess |
8.9% |
11.1% |
2.2% |
|
Core Capital/Total Risk Weighted Assets |
15.9% |
16.6% |
0.7% |
|
Minimum Statutory ratio |
10.5% |
10.5% |
0.0% |
|
Excess |
5.4% |
6.1% |
0.7% |
|
Total Capital/Total Risk Weighted Assets |
18.3% |
18.3% |
0.0% |
|
Minimum Statutory ratio |
14.5% |
14.5% |
0.0% |
|
Excess |
3.8% |
3.8% |
0.0% |
|
Liquidity Ratio |
55.0% |
61.0% |
6.0% |
|
Minimum Statutory ratio |
20.0% |
20.0% |
0.0% |
|
Excess |
35.0% |
41.0% |
6.0% |
Key Take-Outs:
- Increased earnings - Core earnings per grew by 32.7% to Kshs 13.8, from Kshs 10.4 in Q3’2024, driven by the 10.3% increase in total operating income to Kshs 156.3 bn, from Kshs 141.7 bn in Q3’2024, coupled with the 0.03% decrease in total operating expenses to Kshs 90.68 bn from Kshs 90.71 bn in Q3’2024,
- Improved asset quality – The bank’s Asset Quality improved, with Gross decreasing to 13.6% in Q3’2025, from 14.4% in Q3’2024, attributable to a 3.1% increase in Gross non-performing loans to Kshs 129.2 bn, from Kshs 125.3 bn in Q3’2024, which was outpaced to the 9.2% increase in gross loans to Kshs 951.7 bn, from Kshs 871.3 bn recorded in Q3’2024,
- Expanded Balanced sheet - The balance sheet recorded an expansion as total assets increased by 6.7% to Kshs 1,817.0 bn, from Kshs 1,703.1 bn in Q3’2024, mainly driven by a 19.9% increase in government securities holdings to Kshs 310.4 bn, from 258.9 bn in Q3’2024, coupled with a 7.5% increase in net loans and advances to Kshs 859.8 bn, from Kshs 800.1 bn in Q3’2024,
- Increased lending- Customer net loans and advances increased by 7.5% to Kshs 859.8 bn, from Kshs 800.1 bn in Q3’2024.
For a more detailed analysis, please see our Equity Group’s Q3’2025 Earnings Note
- Kenya Electricity Generating Company (KenGen) FY’2025 Financial Performance
During the week, Kenya Electricity Generating Company (KenGen), released its FY'2025 financial results for the period ended 31st June 2025, recording a profit after tax of Kshs 10.5 bn, a 54.2% increase from the Kshs 6.8 bn recorded in FY’2024, majorly attributable to the 10.6% decrease in operating expenses to Kshs 35.1 bn from Kshs 39.3 bn recorded in FY’2024, which was driven by cost optimization strategies and cutting edge-efficiency enhancements across the power plants. However, net revenue decreased by 3.8% to Kshs 46.5 bn in FY’2025, from Kshs 48.3 bn in FY’2024 mainly driven by the 0.4% decrease in topline revenue to Kshs 56.1 bn from Kshs 56.3 bn in FY’2024. Notably, finance costs reduced by 19.7% to Kshs 2.3 bn, from Kshs 2.8 bn in FY’2024, showcasing improved capital efficiency and optimized debt management. The tables below show the breakdown of KenGen’s financial performance;
|
Cytonn Report: Kenya Electricity Generating Company (KenGen) FY'2025 Perfomance |
|
||
|
Income Statement |
FY'2024 Kshs (bn) |
FY'2025 Kshs (bn) |
% Change |
|
Revenue |
56.3 |
56.1 |
(0.4%) |
|
Fuel & Water Costs |
(8.0) |
(9.6) |
20.5% |
|
Revenue Net Reimbursable Expenses |
48.3 |
46.5 |
(3.8%) |
|
Other Income |
1.3 |
0.9 |
(34.4%) |
|
Gains/(Losses) on Net Forex & Fair Valuation of Financial assets |
(0.7) |
1.5 |
301.2% |
|
Expenses |
(39.3) |
(35.1) |
(10.6%) |
|
Operating Profit |
9.6 |
13.6 |
42.6% |
|
Finance Income |
4.2 |
4.1 |
(2.2%) |
|
Finance Cost |
(2.8) |
(2.3) |
(19.7%) |
|
Profit/(Loss) Before Tax |
10.9 |
15.5 |
41.3% |
|
Income Tax |
(4.2) |
(5.0) |
20.3% |
|
Profit/(Loss) After Tax |
6.8 |
10.5 |
54.2% |
|
Earnings Per Share (EPS) |
1.0 |
1.6 |
54.4% |
|
Dividend Per Share (DPS) |
0.7 |
0.9 |
38.5% |
|
Dividend Payout ratio |
63.1% |
56.6% |
(10.2%) |
|
Dividend Yield |
16.6% |
9.0% |
(45.9%) |
source: Kenya Electricity Generating Company (KenGen) FY’2025 Financial Report,
|
Cytonn Report: Kenya Electricity Generating Company (KenGen) FY'2025 Perfomance |
|
||
|
Balance Sheet |
FY'2024 Kshs (bn) |
FY'2025 Kshs (bn) |
% Change |
|
Non-Current Assets |
443.1 |
452.1 |
2.0% |
|
Current Assets |
48.2 |
53.5 |
11.0% |
|
Total Assets |
491.3 |
505.6 |
2.9% |
|
Non-Current Liabilities |
194.4 |
200.6 |
3.2% |
|
Current Liabilities |
18.8 |
20.4 |
8.5% |
|
Total Liabilities |
213.2 |
221.0 |
3.7% |
|
Total Equity |
278.1 |
284.5 |
2.3% |
Source: Kenya Electricity Generating Company (KenGen) FY’2025 Financial Report
Key take outs from the financial performance include;
- Net revenue decreased by 3.8% to Kshs 46.5 bn in FY’2025, from Kshs 48.3 bn in FY’2024 mainly driven by the 0.4% decrease in topline revenue to Kshs 56.1 bn from Kshs 56.3 bn in FY’2024. The decline was further weighed down by a 20.5% increase in fuel and water costs to Kshs 9.6 bn from Kshs 8.0 bn in FY’2024.
- Income tax expense increased by 20.3% to Kshs 5.0 bn from Kshs 4.2 bn in FY’2024, attributed to the increased profits,
- Operating profit increased by 42.6% to Kshs 13.6 bn in FY’2025 from Kshs 9.6 bn in FY’2024, largely driven by the 10.6% decline in expenses to Kshs 35.1 bn in FY’2025, from Kshs 39.3 bn in FY’2024 accompanied by a 301.2% increase in gains by net forex and financial assets at a fair value to Kshs 1.5 bn in FY’2025, a reversal of the loss of Kshs 0.7 bn recorded in FY’2024. The significant 301.2% increase in the gains on net forex and fair valuation of financial assets was largely driven by the 0.2% appreciation of the Kenyan Shilling against the US Dollar during the period under review,
- The balance sheet recorded an expansion as total assets increased by 2.9% to Kshs 505.6 bn in FY’2025 from Kshs 491.3 bn in FY’2024, attributable to the 2.0% increase in the non-current assets to Kshs 452.1 bn from Kshs 443.1 bn in FY’2024 coupled with the 11.0% increase in the current assets to Kshs 53.5 from Kshs 48.2 bn in FY’2024,
- The current liabilities increased by 8.5% to Kshs 20.4 bn in FY’2025, from Kshs 18.8 bn recorded in FY’2024,
- Earnings per share increased by 54.4% to Kshs 1.6 in FY’2025, from Kshs 1.0 in FY’2024, mainly due to the 54.2% increase in the company’s profit after tax to Kshs 10.5 bn in FY’2025 from Kshs 6.8 bn in FY’2024, and,
- The board of directors have recommended a first and final dividend of Kshs. 0.9 per ordinary share for the period which is an increase of 38.5% from the Kshs.0.7 per ordinary share declared in FY’2024. The dividend yield and dividend payout ratio declined to 9.6% and 56.6% in FY’ 2025 from the 16.6% and 63.1% respectively recorded in FY’ 2024.
Monthly Highlights
- During the month, the Nairobi Securities Exchange (NSE) launched the NSE Banking Sector Share Index (NSE BSI) on 1st October 2025 to track the performance of all listed commercial banks in Kenya. This index provides investors with a transparent benchmark to measure the performance of banking stocks and serves as a basis for structured products and investment strategies. For more information, please see our Cytonn Q3’2025 Market Review
- During the month, Kenya Power & Lighting Company Plc (KPLC) released its FY’2025 financial results, recording an 18.7% decline in profitability. The company posted a profit after tax (PAT) of Kshs 24.5 bn, down from Kshs 30.1 bn in FY’2024. The decline in performance was mainly attributable to a 7.3% decline in gross profit to Kshs 74.6 bn, from Kshs 80.5 bn in FY’2024, following a 5.1% decrease in revenue to Kshs 219.3 bn from Kshs 231.1 which outpaced the 3.9% reduction in cost of sales to Kshs 144.7 bn from Kshs 150.6 bn. For more information, please see our Cytonn Weekly #41/2025
We are “Bullish” on the Equities markets in the short term due to current cheap valuations, lower yields on short-term government papers and expected global and local economic recovery, and, “Neutral” in the long term due to persistent foreign investor outflows. With the market currently trading at a discount to its future growth (PEG Ratio at 0.9x), we believe that investors should reposition towards value stocks with strong earnings growth and that are trading at discounts to their intrinsic value. We expect the current high foreign investors sell-offs to continue weighing down the economic outlook in the short term.
- Industry Report
- August Leading Economic Indicators (LEI)
During the week, the Kenya National Bureau of Statistics (KNBS) released the Leading Economic Indicators (LEI) August 2025 Report, which highlighted the performance of major economic indicators.
Key highlights related to the Real Estate sector include:
- In August 2025, cement consumption increased to 0.9 bn metric tonnes, a 17.2% y/y increase from 0.8 bn in August 2024. On a month-on month basis, cement consumption grew marginally by 2.2%, underscoring resilience in construction demand. The performance was anchored by (i) continued private sector construction activity in urban hubs like Nairobi, Mombasa, and Kisumu, (ii) government-led infrastructure investments under the Bottom-Up Economic Transformation Agenda (BETA), including roads, affordable housing, water, and sanitation projects, and (iii) public works initiatives in rural and semi-urban areas, which both support livelihoods and expand critical infrastructure.
The chart below shows cement consumption in metric tonnes in Kenya between Q1’2023 and August 2025.
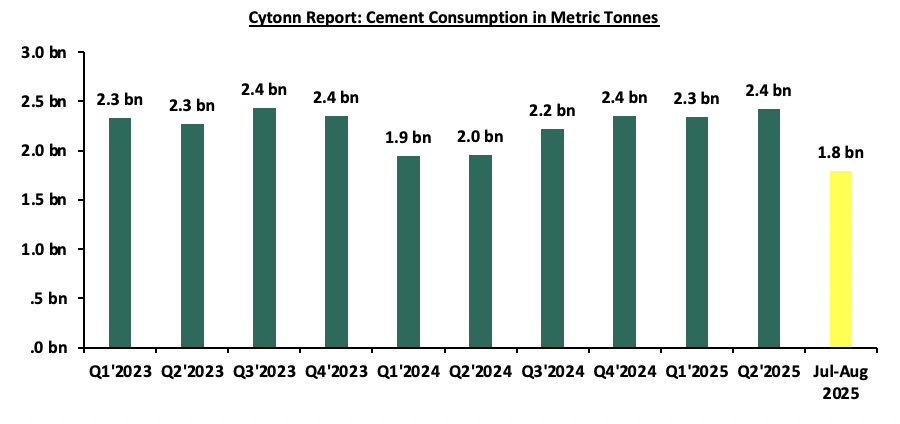
Source: Kenya National Bureau of Statistics (KNBS)
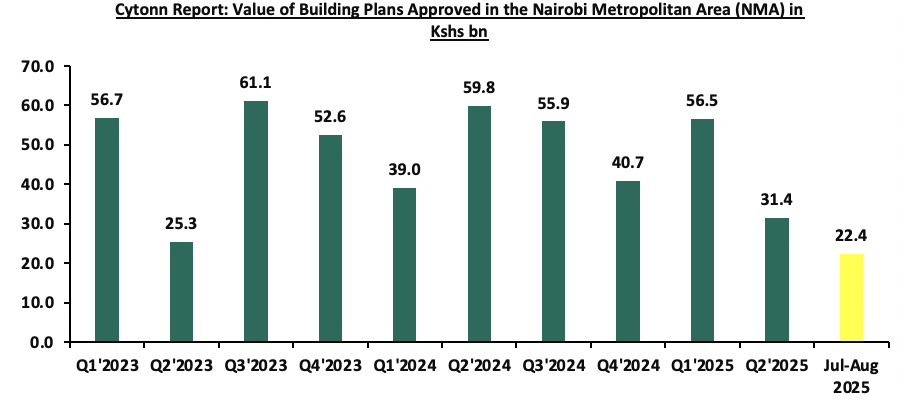
- In August 2025, the value of building plans approved in the Nairobi Metropolitan Area declined by 30.9% on a year-on-year basis, to Kshs 11.2 bn from Kshs 16.2 bn in August 2024. This can be attributed to increase in construction costs, where according to KNBS Construction Input Price Index, material indices had notable increases included steel and reinforced bars at 5.2% and sand at 3.6%. However, there was a 0.2% marginal increase on a month-to-month basis to Kshs 11.19 bn in August 2025 from Kshs 11.16 bn in July 2025. This can be attributed to targeted housing schemes where the the government through the Affordable Housing Programme increase demand for construction, particularly in the lower- and middle-income segments.
The chart below shows the building plans approved in billions in Kenya between Q1’2023 and August 2025.
Source: Kenya National Bureau of Statistics (KNBS)
Notable Industry highlights during the month:
- During the month, the Financial Reporting Centre (FRC) issued a directive requiring all Real Estate agents in Kenya to register with the Centre by 14th November 2025. The order aims to strengthen compliance with Anti-Money Laundering and Counterterrorism Financing regulations, ensuring that the real estate sector aligns with National and International financial transparency standards. For more information, please see our Cytonn Weekly #43/2025
- Hospitality Sector
- Hilton launches AVA Hotel Nairobi, Tapestry Collection
During the week, Hilton has marked a significant milestone in Kenya with the launch of the AVA Hotel Nairobi, Tapestry Collection by Hilton in the upscale Lavington suburb of Nairobi. The 91-room property will be operated by Aleph Hospitality under Hilton’s Tapestry Collection brand, which focuses on lifestyle-driven, locally rooted hotels. The hotel will include modern amenities such as rooftop spaces, a swimming pool, dining outlets and meeting rooms, signaling the rising ambition of Kenya’s hospitality players to serve both business and high-end leisure travellers.
This will have a positive impact on Kenya’s Hospitality Sector. For instance,
- Upgrading local skills and operations: International brand standards brought by Hilton and Aleph Hospitality mean higher expectations for service, operations and guest experience. This pushes local operators to elevate their game and opens pathways for training, systems and best-practice transfer.
- Diverse accommodation offering: With the Tapestry brand targeting experiences and authenticity rather than just standard luxury, this signals a move toward differentiated hotel products in Nairobi and beyond, helping Kenya to cater to evolving guest preferences.
- Enhanced brand-led investment: Hilton’s entry into Kenya’s lifestyle-hotel space demonstrates confidence in the country’s tourism and business-travel prospects. International investors and management companies are increasingly viewing Kenya as a viable destination for premium hospitality assets.
By introducing a differentiated hotel product and international operational standards, the AVA Hotel Nairobi positions Kenya for higher-value tourism and business stays. If local stakeholders leverage this momentum, through infrastructure support, skills development and destination enhancement, the hotel becomes both a landmark and a launching pad for the next wave of hospitality investment across the region.
There were two notable highlights during the month;
- During the month, Kenya Airways (KQ) and Qatar Airways announced the launch of a codeshare agreement that opens up 19 new destinations across Africa and Asia. The partnership, which took effect from October 26, 2025, will allow both airlines to market and sell seats on each other’s flights, enhancing route connectivity, convenience, and access for passengers. For more information, please see our Cytonn Weekly #43/2025
- During the month, Kenya and Senegal signed a reciprocal visa exemption agreement allowing citizens of both countries to travel visa-free for stays not exceeding 90 days. The agreement is part of ongoing efforts to strengthen bilateral relations, promote trade, tourism and cultural exchange, and enhance regional integration between East and West Africa. For more information, please see our Cytonn Weekly #43/2025
We expect the hospitality sector to record positive performance, supported by the codeshare agreement between Kenya Airways and Qatar Airport which will open up 19 new destinations across Africa and Asia and the reciprocal visa exemption agreement between Kenya and Senegal and Hilton launching the AVA Hotel in Nairobi. However, inconsistent infrastructure in rural areas and financial constraints in urban markets remain key challenges that could limit the sector’s optimal growth.
- Land Sector Sector
There was one notable highlight during the month;
- During the month, the President assented to the National Land Commission (Amendment) Act, 2025, which seeks to enhance the efficiency, transparency, and accountability of the National Land Commission (NLC). The amendments mainly focus on the review of grants and dispositions of public land, addressing historical land injustices, and improving the Commission’s financial autonomy. The Act comes into effect on 4th November 2025. For more information, please see our Cytonn Weekly #43/2025.
We expect the land sector to record improved performance, supported by the assention of the National Land Commission Act of 2025 by the President. This move will strengthen and enhance the Commission’s ability to be efficient, transparent and accountable. However, challenges such as incomplete and inconsistent land records will continue to be a major challenge for the land sector in Kenya.
- Infrastructure Sector
- Construction of the 81 km Kasoyo-Kampi Samaki Road in Baringo County
During the week, President William Ruto, launched the construction of the 81 km Kasoyo- Kampi Samaki Road in Baringo County, marking an important milestone for infrastructure development in the region. The road links the settlement of Kasoyo with Kampi-Ya-Samaki on the shores of Lake Baringo and aims to enhance connectivity, stimulate economic activity and bolster regional development.
This will have immense benefits on Kenya’s infrastructure sector. For instance,
- Improved connectivity and reduced travel times, where the new road will provide a direct route for communities along the project corridor, improving access to markets, schools, health-facilities and tourism nodes. By reducing travel times, transport costs fall, and daily quality of life improves for local residents.
- There will be job creation and local engagement during construction. Construction of the road will employ local labour, contractors and service providers, boosting short-term employment and building technical capacity in the region. For the broader infrastructure industry, it signals that even remote regions are being prioritized for road upgrades.
- Stimulus for regional economic growth: With improved road infrastructure, local producers such as farmers gain easier access to broader markets. This fosters trade, allows for quicker transport of perishable goods, and encourages investment in value-added activities. For the infrastructure sector, this becomes a visible case of road investment generating economic returns.
For Kenya’s infrastructure sector, it signals a shift in developmental focus and underscores the growing potential in regional road networks. As the new road begins to deliver its benefits, the real work starts: maintaining, leveraging and replicating such infrastructure investments to sustain momentum and ensure long-term impact.
- Establishment of a special cruise terminal at the Lamu Port in Kililana
During the week, the Kenya Ports Authority (KPA) has revealed its plans to establish a special cruise terminal at the Lamu Port in Kililana. The arrival of 120 international tourists aboard the MV SH Diana highlighted the steady rise of cruise tourism in Lamu, with at least six vessels having docked at the port this year, a sign of the growing appeal of Kenya’s coastal destinations. The move marks a new chapter for Kenya’s maritime infrastructure, positioning Lamu not only as a cargo hub but also as a key gateway for leisure and tourism-related maritime traffic.
This will have immense benefits on the infrastructure sector in Kenya, as the project promises several ripple effects. For instance,
- This will stimulate demand for supporting facilities such as access roads and improved hotels and accommodation. The construction phase is also expected to generate local employment and create opportunities for contractors, engineers, and logistics providers.
- The planned terminal positions Lamu as a regional cruise tourism hub, complementing the existing Mombasa Port Cruise Terminal. This diversification reduces congestion risks, distributes economic activity across counties, and strengthens Kenya’s competitiveness in the Western Indian Ocean tourism circuit. Over time, improved port connectivity could attract private investment in resorts, marinas, and local transport networks, deepening integration between infrastructure and tourism development.
If executed efficiently, the Lamu Cruise Terminal could anchor a new phase of coastal transformation — one where modern infrastructure connects global travelers to Kenya’s cultural and natural treasures while driving long-term economic resilience. This development will impact Real estate sector by driving demand for coastal properties, hospitality investments, and mixed-use developments around Lamu. As cruise tourism grows, investors are likely to channel capital into hotels, serviced apartments, retail spaces, and leisure facilities to cater to international visitors.
- AIIB lines up its first project in Kenya
During the week, the Asian Infrastructure Investment Bank (AIIB) is lining up its first project in Kenya, which has lined up its debut mega road investment in the country. The multilateral lender has invited bids for a consultancy to evaluate the upgrading of the 243-kilometre Mau Summit–Malaba Highway into a modern, tolled dual carriageway. This marks a significant step in diversifying Kenya’s infrastructure financing sources and underscores growing investor confidence in the country’s transport sector.
This will have beneficial implications on the Kenya’s infrastructure sector. For instance,
- There will be acceleration of high-impact projects, where the Mau Summit–Malaba corridor is a critical link in the Northern Corridor and the Trans-African Highway Network. Upgrading it to four-lanes with tolling will significantly reduce transit times and improve logistics across East Africa.
- A shift in funding modalities, the AIIB’s choice to deploy its maiden Kenyan investment through a PPP model signals a move toward more innovative financing structures. This may encourage further use of market-linked financing rather than purely budget-funded infrastructure.
- Competitiveness and regional integration: A more efficient highway network means Kenya strengthens its role as a regional transport hub. For the infrastructure industry, contractors, engineers, service providers, this means new opportunities.
If successful, it could set a blueprint for future large-scale projects, unlocking faster execution, higher standards and broader industry participation. The real measure of success will lie not only in asphalt laid but in improved connectivity, industrial growth and sustainable infrastructure outcomes across the country. This development will impact Real Estate sector in Kenya by opening up new growth corridors along the highway, spurring demand for residential, commercial, and industrial developments near major interchanges and transit hubs. Improved accessibility will increase land values, attract logistics parks, housing estates, and roadside businesses, transforming previously underdeveloped areas into thriving investment zones that support Kenya’s broader urbanization and regional integration goals.
There was one notable highlight during the month;
- During the month, the National Treasury announced a plan to raise Kshs 540.0 bn through infrastructure bonds for expansion of the Standard Gauge Railway (SGR) and the Jomo Kenyatta International Airport (JKIA), less than a year after it cancelled a deal with the Adani Group. The breakdown of the bonds will be as follows; Kshs 387.0 bn will be for the extension of the SGR line from Naivasha to Malaba and Kshs 154.8 bn for the expansion of JKIA through a securitised bond. For more information, please see our Cytonn Weekly #41/2025
We expect the combination of new road projects like Kasoyo–Kampi Samaki, the establishment of a special cruise terminal at Lamu and the planned Kshs 540.0 bn infrastructure bond programme to stimulate momentum across Kenya’s infrastructure sector; attracting contractors, financiers and supply-chain players into regional corridors. However, the sector still faces familiar headwinds such as slow execution, land acquisition disputes, cost overruns, weak maintenance culture, and reliance on debt-heavy financing, which could dilute the intended impact if not addressed.
- Mixed-use development Sector
There was one notable highlight during the month;
- During the month, Business Bay Square developer announced plans to invest Kshs 65.0 bn in a 60-acre mixed-use development at Tatu City. The project marks a strategic expansion by the Eastleigh-based investor into large-scale ventures beyond Nairobi’s central business district. The ambitious development will comprise residential units, office spaces, retail outlets, warehouses, and a mosque. Construction is expected to commence within the next year and will span approximately a decade under the Tatu City Special Economic Zone framework. For more information, please see our Cytonn Weekly # 42/2025.
We expect the sector to gain further strength from initiatives such as the Kshs 65.0 billion Business Bay Square investment at Tatu City, which will boost growth momentum and reflect rising investor confidence in large-scale, integrated urban developments beyond Nairobi’s central business district. The project’s inclusion under the Special Economic Zone framework should attract both local and foreign tenants through tax incentives and streamlined approvals, positioning Tatu City as a model for sustainable, master-planned growth. However, challenges such as infrastructure connectivity, long project timelines, and fluctuating construction costs could test delivery and returns.
- Real Estate Investments Trusts
- Mi Vida to raise 15.0-20.0 bn in first quarter in 2026
During the week, Mi Vida Homes announced plans to raise between Kshs 15.0 bn and 20.0 bn from both local and international institutional investors in the first quarter of 2026. This is considered a big stride in Kenya’s Real Estate sector because this is set to be earmarked as Kenya’s first hybrid real estate fund. A hybrid Real Estate fund describes an investment vehicle that is designed to pool capital from investors by combining both an Income and Development Real Estate Investment Trust (REIT).
A REIT is a regulated investment vehicle that allows individual investors to pool their money to invest in large-scale properties such as shopping malls and apartment buildings, providing a means to invest when they would have been out of reach on an individual capacity. Moreover, Development REITs focus on financing the acquisition of land, construction and development of properties with the end goal being profitability by selling or leasing to investors, while Income REITs allow individual players to invest in completed units and earn revenue mainly through rental income.
This will have immense benefits on the Residential sector in Kenya. For instance;
- Increased capital flow and supply, where raising Kshs 20.0 bn means there will be more capital for residential development. Eventually, this would lead to more units being built, hence more development activity.
- There is a shift in investor profile and market dynamics. With the increased involvement of institutional investors, the residential sector will start to attract non-traditional investors such as pension schemes. Over time, this may increase transparency, standardisation and open up the residential market in Kenya to global capital flows.
- This could encourage more REITs to be more innovative in how residential property is funded and developed. For policy makers, this may encourage them to consider more supportive regulation such as tax exemptions on construction materials for affordable projects, to accelerate growth.
The success of Mi Vida’s planned housing fund could serve as a signal to policymakers to accelerate reforms that make institutional capital more comfortable with residential exposure. Kenya’s residential sector could transition from a fragmented, developer-driven market to a more regulated, capital-market-anchored ecosystem, with deeper liquidity, better governance, and more supply in the price bands where demand is strongest.
- REITS Weekly Performance
On the Unquoted Securities Platform, Acorn D-REIT and I-REIT traded at Kshs 27.4 and Kshs 23.2 per unit, respectively, as per the last updated data on 24th October 2025. The performance represented a 33.4% and 14.5% gain for the D-REIT and I-REIT, respectively, from the Kshs 20.0 inception price. The volumes traded for the D-REIT and I-REIT came in at Kshs 12.8 mn and Kshs 40.6 mn shares, respectively, with a turnover of Kshs 323.5 mn and Kshs 791.5 mn, respectively, since inception in February 2021. Additionally, ILAM Fahari I-REIT traded at Kshs 11.0 per share as of 24th October 2025, representing a 45.0% loss from the Kshs 20.0 inception price. The volume traded to date came in at 1.2 mn shares for the I-REIT, with a turnover of Kshs 1.5 mn since inception in November 2015.
REITs offer various benefits, such as tax exemptions, diversified portfolios, and stable long-term profits. However, the ongoing decline in the performance of Kenyan REITs and the restructuring of their business portfolios are hindering significant previous investments. Additional general challenges include:
- Insufficient understanding of the investment instrument among investors leading to a slower uptake of REIT products,
- Lengthy approval processes for REIT creation,
- High minimum capital requirements of Kshs 100.0 mn for REIT trustees compared to Kshs 10.0 mn for pension funds Trustees, essentially limiting the licensed REIT Trustee to banks only
- The rigidity of choice between either a D-REIT or and I-REIT forces managers to form two REITs, rather than having one Hybrid REIT that can allocate between development and income earning properties
- Limiting the type of legal entity that can form a REIT to only a trust company, as opposed to allowing other entities such as partnerships, and companies,
- We need to give time before REITS are required to list – they would be allowed to stay private for a few years before the requirement to list given that not all companies maybe comfortable with listing on day one, and,
- Minimum subscription amounts or offer parcels set at Kshs 0.1 mn for D-REITs and Kshs 5.0 mn for restricted I-REITs. The significant capital requirements still make REITs relatively inaccessible to smaller retail investors compared to other investment vehicles like unit trusts or government bonds, all of which continue to limit the performance of Kenyan REITs.
We expect the economy to record steady performance, supported by sustained growth in key indicators as highlighted by the August 2025 Leading Economic Indicators report, and reinforced by policy measures such as the Affordable Housing Regulations, 2025, which are set to expand access to rural housing finance. Additionally, the positive performance of Acorn’s D-REIT and I-REIT reflects rising investor confidence in real estate-backed securities. However, the continued underperformance of ILAM Fahari I-REIT underscores challenges of low liquidity and weak investor sentiment in some segments of the listed real estate market.
We expect the performance of Kenya’s Real Estate sector to remain resilient, supported by several factors: i) increased investments in the residential sector, MI Vida’s plans to to raise between Kshs 15.0 bn and 20.0 bn from both local and international institutional investors in the first quarter of 2026. , ii) heightened activity in the hospitality sector driven by Hilton’s launch of the of the AVA Hotel Nairobi, Tapestry Collection by Hilton in the upscale Lavington suburb of Nairobi, iii) sustained infrastructure development initiatives, including the construction of the 81 km Kasoyo- Kampi Samaki Road in Baringo County, KPA’s plans to establish a special cruise terminal at the Lamu Port in Kililana and AIIB’s infrastructure project in Kenya, and iv) improving investor confidence in structured real estate securities, evidenced by gains in Acorn’s D-REIT and I-REIT. However, challenges such as rising construction costs, infrastructure constraints, weak investor appetite in listed REITs such as ILAM Fahari I-REIT, oversupply in select real estate classes, and high capital demands will continue to impede the sector’s optimal performance.
Disclaimer: The views expressed in this publication are those of the writers where particulars are not warranted. This publication, which is in compliance with Section 2 of the Capital Markets Authority Act Cap 485A, is meant for general information only and is not a warranty, representation, advice, or solicitation of any nature. Readers are advised in all circumstances to seek the advice of a registered investment advisor.

- Talk to us
- Kenya
- P.O Box 20695 - 00200, Nairobi, Kenya
- Cell +254709101200
- Tel +254709101200
- WhatsApp +254741676635
- United States
- +254709101200
- DOWNLOAD OUR APP
-


- Kenya
- 8th Floor, Pinetree Plaza, Kaburu Drive, Ngong Road, Nairobi, Kenya
- USA
- Suite 1150, 1775 Eye Street NW, USA, Washington DC 20006, USA
- Investments
- High Yield
- Private Equity
- Real Estate
- Real Estate
- RiverRun Estates
- Cytonn Towers
- The Ridge
- Taraji Heights
- The Alma