Cytonn Monthly – August 2021
By Research Team, Sep 5, 2021
Executive Summary
Fixed Income
During the month of August, T-bills recorded an undersubscription, with the overall subscription rate coming in at 36.5%, down from 106.6% recorded in July as investors shifted their interest to the bonds market in search of higher returns. Overall subscription rates for the 364-day, 182-day and 91-day papers came in at 49.6%, 44.2% and 20.2%, down from 50.8%, 119.7% and 213.4% in July 2021. The yields on the 91-day, 182-day and 364-day papers increased by 26.4 bps, 24.0 bps and 6.0 bps to 6.7%, 7.2% and 7.6%, respectively. The government reopened three bonds namely; FXD3/2019/10, FXD1/2018/20 and FXD1/2021/20, in a bid to raise Kshs 60.0 bn for budgetary support. The bonds were oversubscribed with the subscription rate coming in at 174.4% attributable to the high liquidity in the market and investors’ appetite for higher yields and from the amounts received of Kshs 104.6 bn, the government accepted Kshs 80.3 bn.
The inflation rate for the month of August increased to 6.57% from 6.55% in July, mainly driven by the increase in the prices of food and non-alcoholic beverages;
Equities
During the month of August, the equities market was on an upward trajectory, with NASI, NSE 20 and NSE 25 gaining by 2.7%, 2.4%, and 3.3%, respectively. The equities market performance was driven by gains recorded by banking stocks such as ABSA, Equity Group, SCBK and KCB Group of 10.2%, 8.9%, 6.8% and 6.1%, respectively. The gains were however weighed down by losses recorded by other large cap stocks such as EABL and Bamburi, which declined by 2.1% and 1.2%, respectively. During the month, KCB Group announced that it had completed the 62.1% acquisition of Banque Populaire du Rwanda Plc (BPR) at a Price to Book Value (P/Bv) of 1.1x, after receiving all the required regulatory approvals. The listed banking sector recently released their H1’2021 results, recording a 140.1% weighted average growth in core Earnings per Share (EPS) for H1’2021, compared to a weighted average decline of 33.6% in H1’2020. The good performance can be attributed to an improving business environment which led to a decline in the overall provisions. The performance is however largely skewed by the strong performance from ABSA Bank, KCB Group and Equity Group which reported increases in their EPS of 846.0%, 101.9% and 97.7%, respectively;
Real Estate
During the month, six industry reports were released, namely; Knight Frank’s Kenya Market Update H1’2021, Kenya National Bureau of Statistics’ (KNBS) Leading Economic Indicators June 2021, Hass Consult Q2’2021 House Price Index and Hass Consult Q2’2021 Land Price Index by Hass Consult, Central Bank of Kenya’s (CBK) Monetary Policy Committee Hotel Survey-July 2021, and, Kenya Roads Board’s (KRB) Annual Public Roads Programme 2021/2022 report. In the retail sector, Chandarana Food Plus, a local retail chain, opened a new outlet in Eldoret’s new Highland Mall, while South African Game Stores retail chain announced plans to sell its three Kenyan based outlets located in the Waterfront Karen, Garden City Mall, and Kisumu’s Mega City Mall, to undisclosed potential buyers. In the listed real estate, ILAM Fahari I-REIT closed the month trading at an average price of Kshs 6.7 per share, a 12.1% increase in the Year-to-Date (YTD) performance from Kshs 5.8 per share;
Investment Updates:
- Weekly Rates:
- Cytonn Money Market Fund closed the week at a yield of 10.68%. To invest, just dial *809#;
- Cytonn High Yield Fund closed the week at a yield of 15.58% p.a. To invest, email us at sales@cytonn.com and to withdraw the interest you just dial *809#;
- We continue to offer Wealth Management Training daily, from 9:00 am to 11:00 am, through our Cytonn Foundation. The training aims to grow financial literacy among the general public. To register for any of our Wealth Management Trainings, click here;
- If interested in our Private Wealth Management Training for your employees or investment group, please get in touch with us through wmt@cytonn.com;
- As of 1st of September 2021, Cytonn CHYS and CPN Investors have converted Ksh 2.5 billion of their investment funds from the two illiquid funds into real estate, translating to a 20% resolution of the debt owed by the two funds. For more information, please see Cytonn CHYS and CPN Conversion 2.5 bn Real Estate article;
- Cytonn Insurance Agency acts as an intermediary for those looking to secure their assets and loved ones’ future through insurance namely; Motor, Medical, Life, Property, WIBA, Credit and Fire and Burglary insurance covers. For assistance, get in touch with us through insuranceagency@cytonn.com;
- Cytonnaire Savings and Credit Co-operative Society Limited (SACCO) provides a savings and investments avenue to help you in your financial planning journey. To enjoy competitive investment returns, kindly get in touch with us through clientservices@cytonn.com;
Real Estate Updates:
- For an exclusive tour of Cytonn’s real estate developments, visit: Sharp Investor's Tour, and for more information, email us at sales@cytonn.com;
- Phase 3 of The Alma is now ready for occupation. To rent please email properties@cytonn.com;
- We have 8 investment-ready projects, offering attractive development and buyer targeted returns. See further details here: Summary of Investment-ready Projects;
- For recent news about the group, see our news section here.
Hospitality Updates:
- We currently have promotions for Staycations, visit cysuites.com/offers for details or email us at sales@cysuites.com;
- Share a meal with a friend during the Sunday Brunch at The Hive Restaurant at Cysuites Hotel and Apartment. Every Sunday from 11.00 AM to 4.00 PM at a price of Kshs 2,500 for Adults and Kshs 1,500 for children under 12 years;
Money Markets, T-Bills & T-Bonds Primary Auction:
During the month of August, T-bills recorded an undersubscription, with the overall subscription rate coming in at 36.5%, down from 106.6% recorded in July, as investors shifted their interest to the bonds market in search of higher returns. Investors’ demand shifted to the 364-day paper which recorded the highest subscription rate of 49.6%, down from 50.8% recorded the previous month. On the other hand, the subscription rate for the 91-day and 182-day papers declined to 20.2% and 44.2%, from 213.4% and 119.7% recorded the previous month, respectively. The yields on the 91-day, 182-day and 364-day papers increased by 26.4 bps, 24.0 bps and 6.0 bps to 6.7%, 7.2% and 7.6%, respectively. For the month of August, the government accepted a total of Kshs 83.9 bn, out of the Kshs 85.9 bn worth of bids received as they sought to contain the rates. This translated to a 97.7% acceptance rate.
During the week, T-bills were slightly undersubscribed, with the overall subscription rate coming in at 99.5%, up from the 36.5% recorded the previous week attributable to the eased liquidity in the market as evidenced by the 0.1% points decline in the interbank rates. The 91-day paper recorded the highest subscription rate of 100.8% an increase from the 20.2% recorded the previous week, receiving bids worth Kshs 4.03 bn against the offered Kshs 4.00 bn. The subscription rate for the 182-day and the 364-day papers increased to 99.5% and 98.9%, from 44.2% and 49.6% recorded the previous week, respectively. The yields on the 91-day, 182-day and 364-day papers increased by 3.3 bps, 3.1 bps and 2.5 bps to 6.8%, 7.2% and 7.5%, respectively. The government accepted all Kshs 23.9 bn bids received, translating to an acceptance rate of 100.0%.
In the Primary Bond Market, the government offered three bonds namely; FXD3/2019/10, FXD1/2018/20 and FXD1/2021/20 for the month of August, which recorded a subscription rate of 174.4% attributable to the high liquidity in the market and the investors’ appetite for higher yields. The government sought to raise Kshs 60.0 bn in the three bonds and accepted Kshs 80.3 bn out of the Kshs 104.6 bn worth of bids received, translating to an acceptance rate of 76.7%. Investors preferred the longer dated paper, FXD1/2021/20 which received bids worth Kshs 43.5 bn. FXD3/2019/10 received bids worth Kshs 38.3 bn while FXD1/2018/20 received bids worth Kshs 22.8 bn. The coupons for the three bonds were 11.5%, 13.2% and 13.4%, and the weighted average yield rates during the issues were 12.3%, 13.3% and 13.5% for FXD3/2019/10, FXD1/2018/20 and FXD1/2021/20, respectively.
For the month of September, the government is seeking to raise Kshs 75.0 bn for infrastructure projects by opening an infrastructure bond, IFB1/2021/21, with a tenor of 21 years whose offer period ends on 7th September 2021. Key to note, the bond’s coupon rate will be market determined. Given the eased liquidity in the market coupled with the government’s increased appetite for domestic borrowing as well as the attractive tax-free nature of the infrastructure bond, we anticipate an oversubscription and a higher acceptance rate. Our recommended bidding range for the bond is: 11.8%-12.0% within which bonds of a similar tenor are trading and given that this is a tax free bond it translates to a return of around 14.0%.
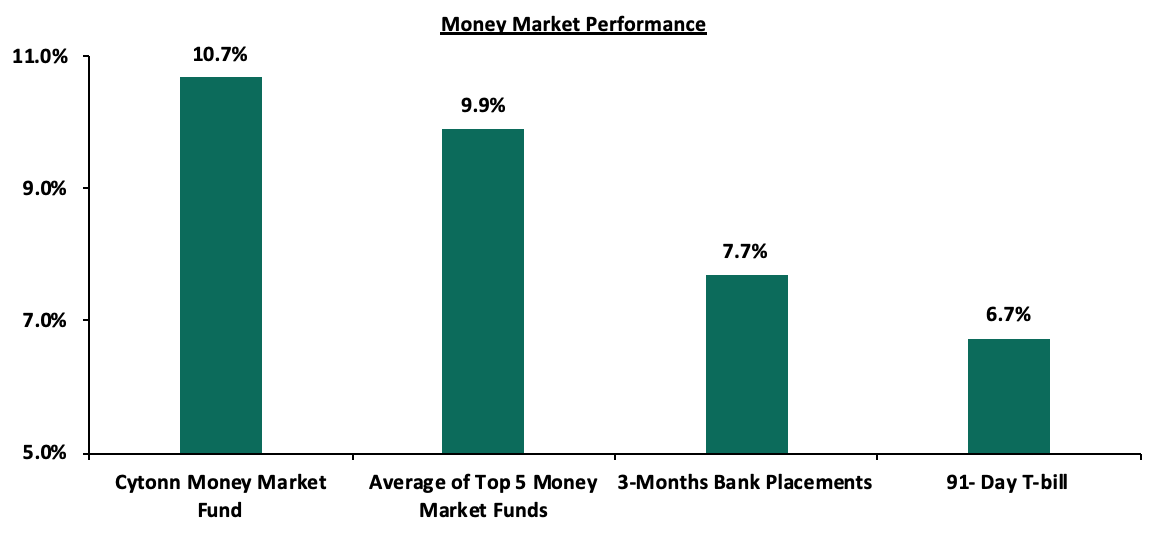
In the money markets, 3-month bank placements ended the week at 7.7% (based on what we have been offered by various banks), while the yield on the 91-day T-bill increased by 3.3 bps to 6.8%. The average yield of the Top 5 Money Market Funds declined by 0.8% points to 9.9% from 10.7% recorded the previous week. The yield on the Cytonn Money Market Fund increased by 0.1% points to 10.7%, from 10.6% recorded last week.
The table below shows the Money Market Fund Yields for Kenyan Fund Managers as published on 3rd September 2021:
|
Money Market Fund Yield for Fund Managers as published on 3rd September 2021 |
|||
|
Rank |
Fund Manager |
Daily Yield |
Effective Annual Rate |
|
1 |
Cytonn Money Market Fund |
10.15% |
10.68% |
|
2 |
Nabo Africa Money Market Fund |
9.70% |
10.18% |
|
3 |
Zimele Money Market Fund |
9.56% |
9.91% |
|
4 |
Madison Money Market Fund |
9.06% |
9.48% |
|
5 |
Sanlam Money Market Fund |
8.87% |
9.28% |
|
6 |
CIC Money Market Fund |
8.70% |
9.01% |
|
7 |
Apollo Money Market Fund |
9.10% |
8.95% |
|
8 |
Dry Associates Money Market Fund |
8.44% |
8.77% |
|
9 |
Co-op Money Market Fund |
8.32% |
8.68% |
|
10 |
Orient Kasha Money Market Fund |
8.16% |
8.50% |
|
11 |
British-American Money Market Fund |
8.12% |
8.43% |
|
12 |
ICEA Lion Money Market Fund |
8.05% |
8.38% |
|
13 |
NCBA Money Market Fund |
8.03% |
8.34% |
|
14 |
GenCapHela Imara Money Market Fund |
8.00% |
8.33% |
|
15 |
Old Mutual Money Market Fund |
7.43% |
7.19% |
|
16 |
AA Kenya Shillings Fund |
6.53% |
6.73% |
Source: Business Daily
Secondary Bond Market:
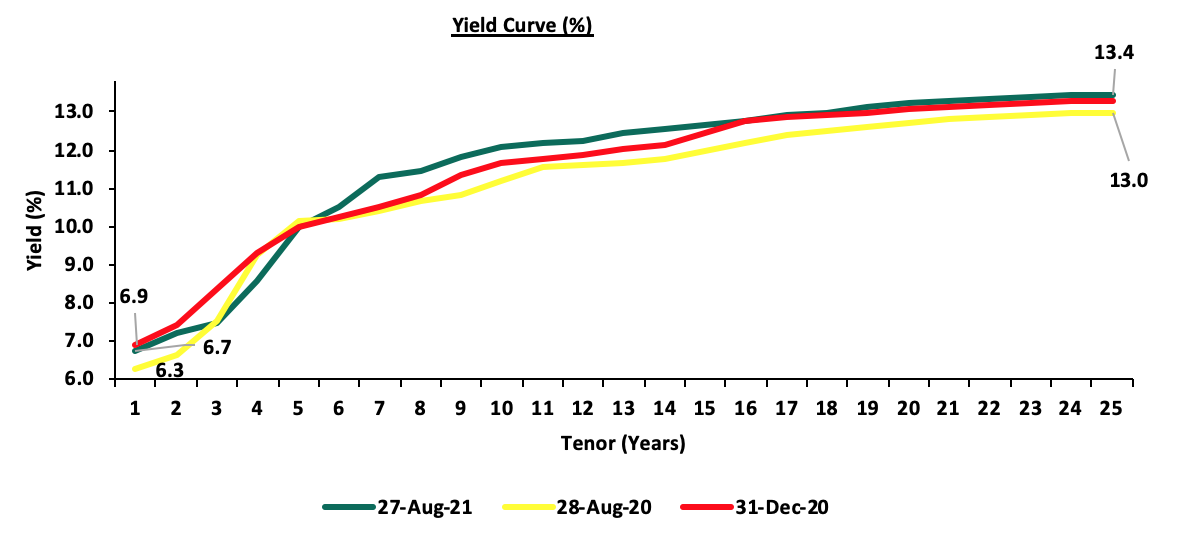
In the month of August, the yields on government securities in the secondary market remained relatively stable with the FTSE NSE bond index increasing marginally by 0.1%, to close the month at Kshs 96.6, bringing the YTD performance to a decline of 1.4%. The secondary bond turnover declined by 9.1% to Kshs 83.1 bn, from Kshs 91.4 bn recorded in July. On a year on year basis, bonds turnover increased by 47.8% to Kshs 625.5 bn from Kshs 423.3 bn worth of T-bonds transacted over a similar period last year. The chart below is the yield curve movement during the period;
Liquidity:
The money markets remained liquid in the month of August, with the average interbank rate declining to 3.2%, from 3.9% recorded in July mainly supported by government payments inclusive of Kshs 305.9 bn Term Auction deposits maturities (TADs). During the week, liquidity in the money market eased, with the average interbank rate declining marginally to 3.4%, from 3.5% recorded the previous week, due to government payments, TADs maturities worth Kshs 43.0 bn which offset the settlements of government securities and tax remittances. The average interbank volumes traded increased by 45.7% to Kshs 11.2 bn, from Kshs 7.7 bn recorded the previous week.
Kenya Eurobonds:
During the month, the yields on the Eurobonds recorded mixed performance with the 10-year Eurobond issued in 2014, 10-year and 30-year issued in 2018 and 12-year bonds issued in 2019 and 2021 all declining by 0.2% points to 3.1%, 5.0%, 7.1%, and 6.0%, respectively. On the other hand, the 7-year Eurobond issued in 2019 remained unchanged at 4.6%.
During the week, the yields on the Eurobonds were on a downward trajectory with the yields on the 10-year Eurobond issued in 2014 and 2018 decreasing by 0.1% and 0.4% points to 3.1% and 4.9%, respectively while the yields on the 30-year Eurobond issued in 2018, 7-year and 12-year Eurobonds issued in 2019 all declined by 0.2% to 7.1%, 4.6% and 6.0%, respectively. The 12- year Eurobond issued in 2021 declined by 0.3% to 5.9%. Below is a summary of the performance:
|
Kenya Eurobond Performance |
||||||
|
|
2014 |
2018 |
2019 |
2021 |
||
|
Date |
10-year issue |
10-year issue |
30-year issue |
7-year issue |
12-year issue |
12-year issue |
|
31-Dec-20 |
3.9% |
5.2% |
7.0% |
4.9% |
5.9% |
- |
|
31-Jul-21 |
3.3% |
5.2% |
7.3% |
4.6% |
6.2% |
6.2% |
|
27-Aug-21 |
3.2% |
5.3% |
7.3% |
4.8% |
6.2% |
6.2% |
|
30-Aug-21 |
3.0% |
5.1% |
7.2% |
4.8% |
6.2% |
6.0% |
|
31-Aug-21 |
3.1% |
5.0% |
7.1% |
4.6% |
6.0% |
5.9% |
|
01-Se[-21 |
3.1% |
4.9% |
7.1% |
4.6% |
6.0% |
5.9% |
|
02-Sep-21 |
3.0% |
4.9% |
7.1% |
4.6% |
6.0% |
5.9% |
|
03-Sep-21 |
3.1% |
4.9% |
7.1% |
4.6% |
6.0% |
5.9% |
|
Weekly Change |
(0.1%) |
(0.4%) |
(0.2%) |
(0.2%) |
(0.2%) |
(0.3%) |
|
MTD Change |
0.0% |
(0.1%) |
0.0% |
0.0% |
0.0% |
0.0% |
|
YTD Change |
(0.8%) |
(0.3%) |
0.1% |
(0.3%) |
0.1% |
- |
Source: Reuters
Kenya Shilling:
During the month, the Kenya Shilling depreciated by 1.2% against the US Dollar to close the month at Kshs 109.9, from Kshs 108.6 recorded at the end of July 2021, mostly attributable to increased dollar demand from general importers outweighing the supply of dollars from importers.
During the week, the Kenyan shilling depreciated by 0.2% against the US dollar to close the week at Kshs 109.9, from Kshs 109.8 recorded the previous week, mainly attributable to increased dollar demand from general importers. On a YTD basis, the shilling has depreciated by 0.7% against the dollar, in comparison to the 7.7% depreciation recorded in 2020. We expect the shilling to remain under pressure for the remainder of 2021 as a result of:
- Rising uncertainties in the global market due to the Coronavirus pandemic, which has seen investors continue to prefer holding their investments in dollars and other hard currencies and commodities,
- The widened current account position which increased by 0.5% points to 5.4% of GDP in the 12 months to July 2021 from 4.9% of GDP for a similar period in 2020, and,
- Demand from energy importers as they beef up their hard currency positions in the prevailing elevated global oil prices.
The shilling is however expected to be supported by:
- The Forex reserves, currently at USD 8.9 bn (equivalent to 5.4 months of import cover), which is above the statutory requirement of maintaining at least 4.0 months of import cover, and the EAC region’s convergence criteria of 4.5-months of import cover, and,
- Improving diaspora remittances evidenced by a 21.6% y/y increase to USD 336.7 mn in July 2021, from USD 277.0 mn recorded over the same period in 2020, which has continued to cushion the shilling against further depreciation.
Weekly Highlights:
- August Inflation
The y/y inflation for the month of August increased marginally to 6.57%, from the 6.55% recorded in July, in line with our expectations. This is the highest reading since the pandemic begun. The increase was mainly attributable to the increase in the y/y food and non-alcoholic beverages, transport, Housing, water, electricity, gas and other Fuels inflation prices which increased by 10.7%, 7.9 and 5.1% respectively . Food and non-alcoholic beverages index has had the greatest increase year on year as well as on a month on month basis due to the increased food prices as food supply is lower given the erratic weather.
However, the increase was mitigated by a decline in the transport inflation. The table below shows a summary of both the year on year and month on month commodity groups’ performance;
|
Major Inflation Changes – August 2021 |
|||
|
Broad Commodity Group |
Price change m/m (August-21/July-21) |
Price change y/y (August-21/August-20) |
Reason |
|
Food & Non-Alcoholic Beverages |
0.5% |
10.7% |
The m/m increase was mainly contributed by increase in prices of cabbages, spinach and oranges among other food items. The increase was however mitigated by a decline in prices of potatoes and onions |
|
Housing, Water, Electricity, Gas and other Fuel |
0.3% |
5.1% |
The m/m increase was as a result of increase in the price cooking fuel and house rent despite the slight decrease in the price of electricity
|
|
Transport Cost |
(0.3%) |
7.9% |
The m/m decrease in bus fare of country and city public service vehicles following the return to carrying of full capacity for public service vehicles in the month of August 2021 |
|
Overall Inflation |
0.1% |
6.6% |
The m/m increase was due to a 0.5% increase in the food and non-alcoholic beverages as compared to the 0.5% decline in the month of June |
Source: KNBS
Going forward, we expect the inflation to remain within the government’s set range of 2.5% - 7.5%. However, we also anticipate Inflation pressures to remain elevated in the short term mainly driven by increases in food prices, and the impact of the increase in tariffs and taxes as we foresee a concurrent contribution to the increase in the headline inflation, despite the government’s interventions through unchanged fuel prices. The rising inflation remains a concern as the IMF has already cautioned the government against exceeding the set target rate as this will increase the risk of an inability to access further credit facilities from the international lender. We anticipate continued pressure on the government to keep the inflation under control before the next IMF evaluation test date which is in December 2021. Additionally, the recently issued communication by KRA on inflation adjustment on Specific Rates of Excise Duty effective from 1st October 2021 will cause an upward pressure on the inflation rate in the coming months, as the burden will be passed to the consumers.
Monthly Highlights:
- The National Treasury gazetted the revenue and net expenditures for the first month of FY’2021/2022, ending 31st July 2021, highlighting that the total revenue collected as at the end of July 2021 amounted to Kshs 267.1 bn, equivalent to 8.4% of the FY’2021/2022 target of Kshs 3.2 tn while the total expenditure amounted to Kshs 170.4 bn, equivalent to 5.3% of the budget of Kshs 3.2 tn. For more information, see our Cytonn Weekly #33/2021, and,
- The headline Purchasing Managers’ Index (PMI) for the month of July 2021 decreased to 50.6 from the 51.0 recorded in June 2021, which was a second decline in a row, indicating that the business conditions in the Kenyan private sector recorded an expansion but at a slower rate than that seen in June 2021. For more information, see our Cytonn Weekly #31/2021.
Rates in the fixed income market have remained relatively stable due the sufficient levels of liquidity in the money market, coupled with the discipline by the Central Bank to reject expensive bids. The government is 33.8% ahead of its prorated borrowing target of Kshs 126.6 bn having borrowed Kshs 169.5 bn of the Kshs 658.5 bn borrowing for the FY’2021/2022. We expect a gradual economic recovery going into FY’2021/2022 as evidenced by the KRA July collections of Kshs 267.1 bn compared to the monthly prorated amount of Kshs 266.0 bn. However, despite the projected high budget deficit of 7.5% and the lower credit rating from S&P Global to 'B' from 'B+', we believe that the monetary support from the IMF and World Bank will mean that the interest rate environment may stabilize since the government will not be desperate for cash.
Markets Performance
During the month of August, the equities market was on an upward trajectory, with NASI, NSE 20 and NSE 25 gaining by 2.7%, 2.4%, and 3.3%, respectively. The equities market performance was driven by gains recorded by banking stocks such as ABSA, Equity Group, SCBK and KCB Group of 10.2%, 8.9%, 6.8% and 6.1%, respectively. The gains were however weighed down by losses recorded by other large cap stocks such as EABL and Bamburi, which declined by 2.1% and 1.2%, respectively.
During the week, the equities market was on a downward trajectory, with NASI, NSE 25 and NSE 20 declining by 4.1%, 3.9% and 0.4%, respectively, taking their YTD performance to gains of 18.0%, 15.3% and 8.2% for NASI, NSE 25 and NSE 20, respectively. The equities market performance was mainly driven by losses recorded by large cap stocks such as Equity Group, Safaricom and ABSA Bank, which declined by 8.0%, 5.0% and 4.1%, respectively. The losses were however mitigated by gains recorded by other large cap stocks such as NCBA which gained by 2.8%.
Equities turnover increased by 26.3% during the month to USD 108.3 mn, from USD 85.8 mn recorded in July 2021. Foreign investors remained net buyers during the month, with a net buying position of USD 15.7 mn, compared to July’s net buying position of USD 1.4 mn.
During the week, equities turnover declined by 15.8% to USD 18.1 mn, from USD 21.5 mn recorded the previous week, taking the YTD turnover to USD 844.4 mn. Foreign investors turned net sellers, with a net selling position of USD 1.9 mn, from a net buying position of USD 5.1 mn recorded the previous week, taking the YTD net selling position to USD 11.3 mn.
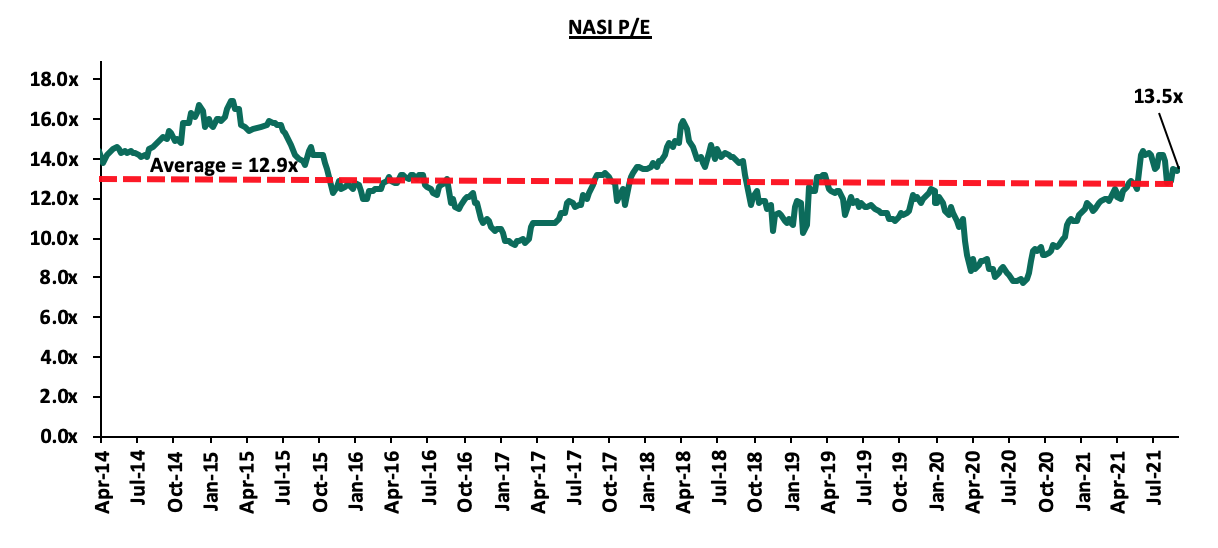
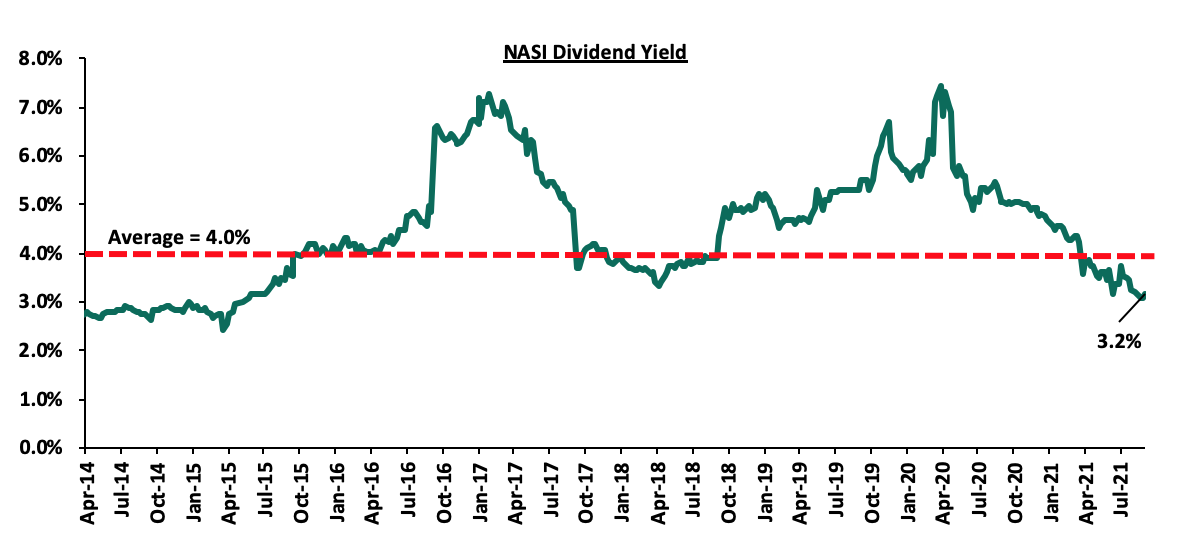
The market is currently trading at a price to earnings ratio (P/E) of 13.5x, 4.4% above the historical average of 12.9x, and a dividend yield of 3.2%, 0.8% points below the historical average of 4.0%. Key to note, NASI’s PEG ratio currently stands at 1.0x, an indication that the market is trading at par to its future earnings growth. Basically, a PEG ratio greater than 1.0x indicates the market may be overvalued while a PEG ratio less than 1.0x indicates that the market is undervalued. The current PEG ratio of 1.0x indicates that NASI’s prices are fairly priced to their growth potential. This ratio has been on the decline for highs of 1.6x in early 2021, pointing towards the bourse’s strong performance this year so far which has since matched what investors are willing to pay for the listed companies’ future growth. We believe that investors should reposition towards individual companies with a strong earnings growth and are trading at discounts to their intrinsic value. Excluding Safaricom, whose market cap is at 61.2% of the bourse, the market is trading at a P/E ratio of 12.2x and a PEG ratio of 2.5x. The current P/E valuation of 13.5x is 75.3% above the most recent trough valuation of 7.7x experienced in the first week of August 2020. The charts below indicate the historical P/E and dividend yields of the market.
Monthly Highlights
- KCB Group announced that it had completed the 62.1% acquisition of Banque Populaire du Rwanda Plc (BPR) using a Price to Book Value (P/Bv) of 1.1x, after receiving all the required regulatory approvals. According to the latest BPR financials released as of June 2021, the bank had a book value of Rwf 52.9 bn (Kshs 5.8 bn), and thus at the trading multiple of 1.1x, we expect KCB Group to have spent an estimated Kshs 6.3 bn to acquire BPR Rwanda. Additionally, KCB Group will take over 135 branches from BPR, taking its total branches to 489, from 354 branches as of June 2021. For more information, please see our Cytonn Weekly #34/2021, and,
- The Cabinet Secretary for the National Treasury and Planning, through the Capital Markets Authority (CMA), recently published two draft regulations; the Capital Markets (Collective Investment Schemes) Regulations 2021and the Capital Markets (Collective Investment Schemes) (Alternative Investment Funds) Regulations 2021. The proposed regulations seek to update the current Collective Investment Scheme regulations given the change in market dynamics since the last published Regulations in 2001, as well as address emerging issues. The draft regulations have been published with the aim of seeking comments from the stakeholders and the general public by 24th September 2021. The proposed Alternative Investment Funds’ (AIFs) regulations seek to create a regulatory environment for privately pooled funds whose investors seek higher returns by investing in alternative asset classes and have set the maximum number of investors in a single AIF to 20 investors with the minimum investment amount being set at Kshs 1.0 mn. We shall be releasing a note on the new regulations within the coming week.
Earnings Releases
During the week, NCBA Group and I&M Holdings released their H1’2021 financial results. Below is a summary of their performance;
- NCBA Group
|
NCBA Group H1’2021 Key Highlights |
|||
|
Balance Sheet |
|||
|
Balance Sheet items |
H1’2020 (Kshs bn) |
H1’2021 (Kshs bn) |
y/y change |
|
Government Securities |
169.0 |
190.8 |
12.9% |
|
Net Loans and Advances |
248.3 |
239.6 |
(3.5%) |
|
Total Assets |
514.0 |
542.6 |
5.6% |
|
Customer Deposits |
390.5 |
437.3 |
12.0% |
|
Deposits Per Branch |
4.8 |
4.6 |
4.3% |
|
Total Liabilities |
443.7 |
468.2 |
5.5% |
|
Shareholders’ Funds |
70.1 |
74.3 |
6.0% |
|
Income Statement |
|||
|
Income Statement Items |
H1’2020 (Kshs bn) |
H1’2021 (Kshs bn) |
y/y change |
|
Net Interest Income |
11.2 |
13.4 |
19.7% |
|
Net non-Interest Income |
10.1 |
10.7 |
6.2% |
|
Total Operating income |
21.3 |
24.1 |
13.4% |
|
Loan Loss provision |
7.6 |
5.9 |
(22.4%) |
|
Total Operating expenses |
17.0 |
16.3 |
(3.9%) |
|
Profit before tax |
3.9 |
7.4 |
89.8% |
|
Profit after tax |
2.6 |
4.7 |
76.9% |
|
Core EPS |
1.6 |
2.8 |
76.9% |
|
Key Ratios |
|||
|
Ratios |
H1’2020 |
H1’2021 |
% point change |
|
Yield from interest-earning assets |
10.9% |
10.2% |
(0.7%) |
|
Cost of funding |
5.3% |
4.2% |
(1.1%) |
|
Net Interest Margin |
5.7% |
6.1% |
0.4% |
|
Non- Performing Loans (NPL) Ratio |
14.5% |
16.7% |
2.2% |
|
NPL Coverage |
53.2% |
68.0% |
14.8% |
|
Cost to Income with LLP |
79.8% |
67.7% |
12.1% |
|
Loan to Deposit Ratio |
63.6% |
54.8% |
(8.8%) |
|
Return on average assets |
3.3% |
1.2% |
(2.1%) |
|
Return on average equity |
23.7% |
9.1% |
(14.6%) |
|
Equity to Assets |
13.6% |
13.7% |
0.1% |
|
Capital Adequacy Ratios |
|||
|
Ratios |
H1'2020 |
H1'2021 |
% point change |
|
Core Capital/Total Liabilities |
16.9% |
16.8% |
(0.1%) |
|
Minimum Statutory ratio |
8.0% |
8.0% |
0.0% |
|
Excess |
8.9% |
8.8% |
(0.1%) |
|
Core Capital/Total Risk Weighted Assets |
18.5% |
19.2% |
0.7% |
|
Minimum Statutory ratio |
10.5% |
10.5% |
0.0% |
|
Excess |
8.0% |
8.7% |
0.7% |
|
Total Capital/Total Risk Weighted Assets |
18.5% |
19.4% |
0.9% |
|
Minimum Statutory ratio |
14.5% |
14.5% |
0.0% |
|
Excess |
4.0% |
4.9% |
0.9% |
Key take-outs from the earnings release include;
- Core earnings per share rose by 76.9% to Kshs 2.8, from Kshs 1.6 in H1’2020, in line with our projections of Kshs 2.8. The performance was driven by the 13.4% growth in total operating income to Kshs 24.1 bn, from Kshs 21.3 bn in H1’2020, coupled with the 3.9% decline in total operating expenses to Kshs 16.3 bn, from 17.0 bn in H1’2020,
- Interest income rose by 8.7% to Kshs 22.5 bn, from Kshs 20.7 bn in H1’2020 mainly driven by a 13.6% growth in interest income from government securities to Kshs 9.3 bn, from Kshs 8.2 bn in H1’2020, coupled with a 7.7% rise in interest income from loans and advances to Kshs 13.0 bn, from Kshs 12.0 bn in H1’2020. However, the growth was weighed down by a 59.1% decline in interest income from deposits and placements with banking institutions to Kshs 173.2 mn, from Kshs 423.5 mn in H1’2020,
- The Yield on Interest-Earning Assets (YIEA) decreased by 0.7% points to 10.2% in H1’2021, from 10.9% in H1’2020, attributable to the faster 6.9% growth in average interest-earning assets to Kshs 453.1 bn, from Kshs 423.9 bn in H1’2020, which outpaced the 0.3% decline in trailing interest income,
- Interest expense declined by 4.4% to Kshs 9.0 bn, from Kshs 9.5 bn in H1’2020, mainly attributable to a 69.2% decline in interest expense on placements from banking institutions to Kshs 70.1 mn, from Kshs 227.5 mn in H1’2020. The decline was weighed down by a 4.6% growth in interest expense on customer deposits to Kshs 8.8 bn, from Kshs 8.4 bn in H1’2020,
- Cost of funds decreased by 1.1% point to 4.2% from 5.3% in H1’2020 owing to the 15.3% decline in trailing interest expense coupled with the 6.9% growth in average interest bearing liabilities, an indication that the Bank was able to mobilize cheaper deposits,
- Total operating income rose by 13.4% to Kshs 24.3 bn in H1’2021, from Kshs 21.3 bn in H1’2020 driven by a 19.7% increase in Net Interest Income (NII) to Kshs 13.4 bn, from Kshs 11.2 bn recorded in H1’2020, coupled with a 6.2% increase in Non-Funded Income (NFI) to Kshs 10.7 bn, from the Kshs 10.1 bn recorded in H1’2020,
- The balance sheet recorded an expansion with total assets growing by 5.6% to Kshs 542.6 bn, from Kshs 514.0 bn in H1’2020. This growth was largely driven by a 12.9% increase in investments in government securities to Kshs 190.8 bn, from the Kshs 169.0 bn recorded in H1’2020, coupled with a 100.3% increase in bank placements to Kshs 39.1 bn, from Kshs 19.5 bn in H1’2020. On the other hand, the loan book contracted by 3.5% to Kshs 239.6 bn, from Kshs 248.3 bn in H1’2020, partly attributable to the bank’s cautious lending due to elevated credit risk,
- Total liabilities rose by 5.5% to Kshs 468.2 bn, from Kshs 443.7 bn in H1’2020, driven by a 12.0% growth in customer deposits to Kshs 437.3 bn, from Kshs 390.5 bn in H1’2020. The growth in the group’s total liabilities was mitigated by the 45.4% decline in Placements liabilities to Kshs 7.1 bn recorded in H1’2021, from Kshs 13.1 bn in H1’2020,
- Deposits per branch declined by 4.3% to Kshs 4.6 bn, from Kshs 4.8 bn in H1’2021, with the number of branches increasing by 14 to 96 branches from 82 branches in H1’2020. The group intends to open 9 more branches in Kenya by the end of 2021,
- Gross non-performing loans (NPLs) rose by 16.5% to Kshs 45.0 bn in H1’2021, from Kshs 38.7 bn in H1’2020 taking the NPL ratio to 16.7% in H1’2021, from 14.5% in H1’2020, the highest it has ever been. The deterioration in the group’s asset quality is mainly attributable to the faster 16.5% increase in NPLs that outpaced the 1.2% increase in gross loans. The bank lends to SMEs and offers construction loans, sectors which were hard hit by the pandemic hence the increase in NPLs,
- With the General loan loss provisions increasing by 62.5% to Kshs 23.0 bn, from Kshs 14.2 bn in H1’2020, higher than the 16.5% growth in gross NPLs, the NPL coverage rose to 68.0% in H1’2021, from 53.2% in H1’2020,
- NCBA Group is currently sufficiently capitalized with a core capital to risk weighted assets ratio of 19.2%, 8.7% above the statutory requirement. In addition, the total capital to risk weighted assets ratio was 19.4%, exceeding the statutory requirement by 4.9%. Adjusting for IFRS 9, the core capital to risk weighted assets stood at 19.4%, while total capital to risk weighted assets came in at 19.6%.
For a comprehensive analysis, please see our NCBA Group H1’2021 Earnings Note
- I&M Holdings
|
I&M Holdings H1’2021 Key Highlights |
|||
|
Balance Sheet |
|||
|
Balance Sheet Items |
H1’2020 (Kshs bn) |
H1’2021 (Kshs bn) |
y/y change |
|
Government Securities |
72.2 |
103.5 |
43.3% |
|
Net Loans and Advances |
184.6 |
204.5 |
10.8% |
|
Total Assets |
340.6 |
382.6 |
12.3% |
|
Customer Deposits |
252.5 |
276.8 |
9.6% |
|
Deposits per branch |
3.8 |
4.2 |
11.3% |
|
Total Liabilities |
278.6 |
312.5 |
12.2% |
|
Shareholders’ Funds |
58.7 |
65.9 |
12.2% |
|
Income Statement |
|||
|
Income Statement Items |
H1’2020 (Kshs bn) |
H1’2021 (Kshs bn) |
y/y change |
|
Net Interest Income |
6.9 |
8.9 |
28.1% |
|
Net non-Interest Income |
4.2 |
3.9 |
(6.4%) |
|
Total Operating income |
11.1 |
12.8 |
15.1% |
|
Loan Loss provision |
(1.0) |
(1.1) |
2.1% |
|
Total Operating expenses |
(6.1) |
(7.2) |
19.0% |
|
Profit before tax |
4.5 |
5.9 |
30.5% |
|
Profit after tax |
3.2 |
4.2 |
33.2% |
|
Core EPS |
1.8 |
2.4 |
32.2% |
|
Key Ratios |
|||
|
Income statement ratios |
H1'2020 |
H1'2021 |
% point change |
|
Yield from interest-earning assets |
9.8% |
9.5% |
(0.3%) |
|
Cost of funding |
4.6% |
4.1% |
(0.5%) |
|
Net Interest Margin |
5.5% |
5.7% |
0.2% |
|
Non-Performing Loans (NPL) Ratio |
11.1% |
10.4% |
(0.7%) |
|
NPL Coverage |
63.1% |
67.2% |
4.1% |
|
Cost to Income With LLP |
54.4% |
56.3% |
1.9% |
|
Loan to Deposit Ratio |
73.1% |
73.9% |
0.8% |
|
Cost to Income Without LLP |
45.1% |
48.1% |
3.0% |
|
Return on average equity |
16.3% |
14.5% |
(1.8%) |
|
Return on average assets |
2.8% |
2.5% |
(0.3%) |
|
Equity to assets |
17.2% |
17.2% |
0.0% |
|
Capital Adequacy Ratios |
H1'2020 |
H1'2021 |
% Points change |
|
Core Capital/Total Liabilities |
19.9% |
20.7% |
0.8% |
|
Minimum Statutory ratio |
8.0% |
8.0% |
0.0% |
|
Excess |
11.9% |
12.7% |
0.8% |
|
Core Capital/Total Risk Weighted Assets |
16.3% |
15.9% |
(0.4%) |
|
Minimum Statutory ratio |
10.5% |
10.5% |
0.0% |
|
Excess |
5.8% |
5.4% |
(0.4%) |
|
Total Capital/Total Risk Weighted Assets |
21.4% |
20.7% |
(0.7%) |
|
Minimum Statutory ratio |
14.5% |
14.5% |
0.0% |
|
Excess |
6.9% |
6.2% |
(0.7%) |
Key take-outs from the earnings release include;
- Core earnings per share increased by 32.2% to Kshs 2.4, from Kshs 1.8 in H1’2020, higher than our expectations of a 25.8% increase to Kshs 2.3. The increase was mainly driven by a 28.1% increase in Net Interest Income (NII) to Kshs 8.9 bn, from Kshs 6.9 bn in H1’2020,
- Interest income rose by 11.6% to Kshs 14.6 bn, from Kshs 13.1 bn in H1’2020 driven by a 92.6% growth in interest income from government securities to Kshs 4.1 bn, from Kshs 2.1 bn in H1’2020. The growth in interest income was however weighed down by a 38.5% decline in interest income from placements to Kshs 0.1 bn, from Kshs 0.2 bn in H1’2020, coupled with a 3.6% decline in interest income from loans and advances to Kshs 10.4 bn, from Kshs 10.8 bn in H1’2020,
- The Yield on Interest-Earning Assets (YIEA) declined to 9.5%, from 9.8% in H1’2020, largely attributable to the 9.5% growth in average interest earning assets, which grew faster than the 6.4% growth in trailing Interest Income,
- Interest expense declined by 6.9% to Kshs 5.8 bn, from Kshs 6.2 bn in H1’2020, following an 11.8% decline in Interest expense on deposits to Kshs 4.8 bn, from Kshs 5.4 bn in H1’2020. The decline in interest expense was however weighed down by a 55.2% growth in the interest expense on placements to Kshs 0.5 bn, from Kshs 0.4 bn in H1’2020,
- Cost of funds declined by 0.5% points to 4.1%, from 4.6% recorded in H1’2020, following a 3.0% decline in trailing interest expense, coupled with a 9.3% increase in average interest bearing liabilities,
- Total operating expenses rose by 19.0% to Kshs 7.2 bn, from Kshs 6.1 bn in H1’2020, largely driven by a 17.0% increase in staff costs to Kshs 2.7 bn, from Kshs 2.3 bn in H1’2020. Loan Loss Provisions (LLP) increased by 2.1% to Kshs 1.1 bn, from Kshs 1.0 bn, on account of the bank’s exposure to Real Estate and Personal/Household loans, which continue to be adversely affected by the poor operating environment brought about by COVID-19,
- The balance sheet recorded an expansion as total assets grew by 12.3% to Kshs 382.6 bn, from Kshs 340.6 bn in H1’2020. The growth was supported by a 43.3% increase in government securities to Kshs 103.5 bn, from Kshs 72.2 bn in H1’2020, coupled with a 10.8% loan book expansion to Kshs 204.5 bn, from Kshs 184.6 bn in H1’2020. The increased allocation to government securities seen during the period was partly attributable to the elevated credit risk associated with lending to customers following the adverse effects of the ongoing pandemic on the operating environment,
- Total liabilities rose by 12.2% to Kshs 312.5 bn, from Kshs 278.6 bn in H1’2020, driven by an 86.7% increase in borrowings to Kshs 18.6 bn, from Kshs 10.0 bn in H1’2020, with the increase in borrowings mainly attributable to a USD 50.0 mn (Kshs 5.4 bn) and USD 10.0 mn (Kshs 1.1 bn) loan from The International Finance Corporation (IFC) to I&M Bank Kenya and I&M Bank Rwanda respectively, coupled with a 9.6% rise in customer deposits to Kshs 276.8 bn, from Kshs 252.5 bn in H1’2020,
- Deposits per branch increased by 11.3% to Kshs 4.2 bn from Kshs 3.8 bn in H1’2020, with the number of branches declining to 66 from 67 branches in H1’2020,
- Gross non-performing loans increased by 3.8% to Kshs 22.9 bn in H1’2021, from Kshs 22.1 bn in H1’2020. The banks’ asset quality improved, with the NPL ratio declining to 10.4% in H1’2021, from 11.1% in H1’2020, attributable to the faster 10.8% increase in Gross Loans, which outpaced the 3.8% growth in gross Non-Performing loans,
- The NPL coverage also improved to 67.2% in H1’2021, from 63.1% in H1’2020, as general Loan Loss Provisions increased by 19.1% to Kshs 11.6 bn, from Kshs 9.8 bn in H1’2020, and,
- I&M Holdings Plc remains sufficiently capitalized with a core capital to risk-weighted assets ratio of 15.9%, 5.4% points above the statutory requirement. In addition, the total capital to risk-weighted assets ratio came in at 20.7%, exceeding the statutory requirement by 6.2% points. Adjusting for IFRS 9, the core capital to risk-weighted assets stood at 15.9%, while total capital to risk-weighted assets came in at 20.8%.
For a comprehensive analysis, please see our I&M Holdings H1’2021 Earnings Note
Asset Quality
The table below is a summary of the asset quality for the companies that have released:
|
H1'2020 NPL Ratio** |
H1'2021 NPL Ratio* |
H1'2020 NPL Coverage** |
H1'2021 NPL Coverage* |
% point change in NPL Ratio |
% point change in NPL Coverage |
|
|
ABSA Bank Kenya |
8.0% |
7.9% |
63.6% |
70.9% |
(0.1%) |
7.3% |
|
Co-operative Bank of Kenya |
11.8% |
15.2% |
54.6% |
63.5% |
3.4% |
8.9% |
|
Diamond Trust Bank |
8.3% |
10.4% |
51.2% |
41.8% |
2.1% |
(9.4%) |
|
Equity Group |
11.0% |
11.4% |
48.5% |
63.2% |
0.4% |
14.7% |
|
HF Group |
26.7% |
22.6% |
43.1% |
65.1% |
(4.1%) |
22.0% |
|
I&M Holdings |
11.1% |
10.4% |
63.1% |
67.2% |
(0.7%) |
4.1% |
|
KCB |
13.8% |
14.4% |
56.9% |
61.6% |
0.6% |
4.7% |
|
NCBA Group |
14.5% |
16.7% |
53.2% |
68.0% |
2.2% |
14.8% |
|
Stanbic Bank |
12.1% |
9.5% |
59.3% |
51.0% |
(2.6%) |
(8.3%) |
|
Standard Chartered Bank Kenya |
13.9% |
15.1% |
78.2% |
80.1% |
1.2% |
1.9% |
|
Mkt Weighted Average |
11.6% |
14.8% |
57.8% |
61.0% |
3.2% |
3.2% |
|
*Market cap weighted as at 03/09/2021 |
||||||
|
**Market cap weighted as at 28/08/2020 |
||||||
Key take-outs from the table include;
- Asset quality for the listed banks deteriorated during the period, with the weighted average NPL ratio rising by 3.2% points to a market cap weighted average of 14.8%, from an average of 11.6% for the listed banking sector in H1’2020. The deterioration in asset quality was as a result of increased non-performing loans due to the increased credit risk as a consequence of the subdued business environment occasioned COVID-19 pandemic. This could mean provisional requirements remain relatively high compared to similar trading periods before COVID-19, and,
- NPL Coverage for the listed banks increased to a market cap weighted average of 61.0% in H1’2021, from 57.8% recorded in H1’2020, as the banks increased their provisioning levels due to the difficult economic conditions caused by the pandemic. Banks are expected to continue over-provisioning in 2021, albeit at a slower pace than in 2020.
- Housing Finance (HF) Group saw a significant improvement in their NPL coverage ratio to 65.1% in H1’2021 from 43.1% recorded in H1’2020, while Diamond Trust Bank (DTB-K) recorded the largest decline in NPL coverage of 9.4% points to 41.8% in H1’2021, which is the lowest in the industry.
Summary Performance
All the listed banks have now released their H1’2021 earnings and we shall be releasing our Banking Report in the coming week. The summary of the financial performance of the banks is shown below;
|
Bank |
Core EPS Growth |
Interest Income Growth |
Interest Expense Growth |
Net Interest Income Growth |
Net Interest Margin |
Non-Funded Income Growth |
NFI to Total Operating Income |
Growth in Total Fees & Commissions |
Deposit Growth |
Growth in Government Securities |
Loan to Deposit Ratio |
Loan Growth |
Return on Average Equity |
|
ABSA |
846.0% |
(0.8%) |
(20.4%) |
6.1% |
7.0% |
6.1% |
32.8% |
10.7% |
6.1% |
(9.4%) |
82.9% |
8.4% |
19.3% |
|
KCB |
101.9% |
13.9% |
3.8% |
17.2% |
8.7% |
5.9% |
28.9% |
(2.2%) |
3.7% |
2.2% |
77.2% |
8.4% |
19.2% |
|
Equity |
97.7% |
30.3% |
42.0% |
26.5% |
7.6% |
44.2% |
40.0% |
42.5% |
50.7% |
11.8% |
61.6% |
28.9% |
21.4% |
|
NCBA |
76.9% |
8.7% |
(4.4%) |
19.7% |
0.4% |
6.2% |
44.4% |
(1.0%) |
12.0% |
12.90% |
54.8% |
(3.5%) |
(14.6%) |
|
SCBK |
37.5% |
(7.5%) |
(24.5%) |
(3.0%) |
6.4% |
13.5% |
35.4% |
19.8% |
8.5% |
(3.2%) |
46.80% |
(3.0%) |
13.70% |
|
Stanbic |
37.2% |
2.1% |
(9.9%) |
9.5% |
4.4% |
10.5% |
44.3% |
3.0% |
(9.4%) |
(2.7%) |
79.9% |
(11.7%) |
11.9% |
|
I&M |
32.2% |
11.6% |
(6.9%) |
28.1% |
5.7% |
(6.4%) |
30.5% |
(6.4%) |
9.6% |
43.30% |
73.9% |
10.8% |
14.5% |
|
DTBK |
20.1% |
5.7% |
5.7% |
5.7% |
5.2% |
5.5% |
25.3% |
(0.9%) |
11.9% |
19.7% |
65.1% |
1.4% |
6.4% |
|
Co-op |
2.3% |
19.0% |
20.9% |
18.3% |
8.6% |
24.3% |
35.4% |
17.8% |
6.0% |
48.7% |
73.9% |
10.7% |
12.7% |
|
HF Group |
(17.4%) |
(15.8%) |
(22.3%) |
(6.8%) |
4.2% |
13.8% |
26.1% |
34.6% |
(3.5%) |
1.9% |
93.3% |
7.5% |
(21.2%) |
|
H1'21 Mkt Weighted Average* |
140.1% |
15.1% |
11.2% |
17.3% |
7.0% |
19.9% |
35.7% |
16.5% |
18.5% |
11.4% |
68.7% |
11.7% |
15.3% |
|
H1'20 Mkt Weighted Average** |
(33.6%) |
10.4% |
10.0% |
10.9% |
7.0% |
(1.1%) |
35.2% |
(3.4%) |
18.5% |
25.9% |
71.5% |
14.5% |
15.4% |
|
*Market cap weighted as at 27/08/2021 |
|||||||||||||
|
**Market cap weighted as at 28/08/2020 |
|||||||||||||
Key takeaways from the table above include:
- For the first half of 2021, core Earnings per Share (EPS) recorded a weighted average growth of 140.1%, compared to a weighted average decline of 33.6% in H1’2020 for the listed banking sector. The performance is however largely skewed by the strong performance from ABSA, KCB and Equity Group,
- The Banks have recorded a weighted average deposit growth of 18.5%, same as recorded in H1’2020,
- Interest expense grew at a faster pace, by 11.2%, compared to the 10.0% growth in H1’2020 while cost of funds declined, coming in at a weighted average of 2.5% in H1’2021, from 2.9% in H1’2020, owing to the faster growth in average interest-bearing liabilities, an indication that the listed banks were able to mobilize cheaper deposits,
- Average loan growth came in at 11.7%, lower than the 14.5% growth recorded in H1’2020. The loan growth was however faster than the 10.3% growth in government securities, an indication that the banks’ are gradually going back to lending as the economy continues to rebound,
- Interest income grew by 15.1%, compared to a growth of 10.4% recorded in H1’2020. Notably, the weighted average Yield on Interest Earning Assets (YIEA) for the listed banks increased to 9.9%, from the 9.7% recorded in H1’2020 for the listed banking sector, an indication of the increased allocation to higher-yielding government securities by the sector during the period. Consequently, the Net Interest Margin (NIM) now stands at 7.0%, same as recorded as was recorded in H1’2020 for the whole listed banking sector, and,
- Non-Funded Income grew by 19.9%, compared to the 1.1% decline recorded in H1’2020. This can be attributable to the faster growth in the fees and commission which grew by 16.5% compared to a decline of 3.4% in H1’2020, and points to the diversification of income in the banking sector.
We shall be releasing our H1'2021 Banking Report on 12th September 2021.
Universe of Coverage:
We are currently reviewing our target prices for the banking sector coverage ahead of our H1’2021 Banking Report.
|
Company |
Price as at 27/08/2021 |
Price as at 03/09/2021 |
w/w change |
m/m change |
YTD Change |
Year Open 2021 |
Target Price* |
Dividend Yield |
Upside/ Downside** |
P/TBv Multiple |
Recommendation |
|
Kenya Reinsurance |
2.5 |
2.5 |
0.8% |
(3.5%) |
8.2% |
2.3 |
3.1 |
8.0% |
32.0% |
0.3x |
Buy |
|
Sanlam |
11.3 |
10.5 |
(7.1%) |
(4.5%) |
(19.2%) |
26.6 |
29.5 |
0.0% |
18.1% |
0.9x |
Accumulate |
|
Liberty Holdings |
8.6 |
8.3 |
(3.3%) |
(1.1%) |
7.8% |
85.0 |
89.1 |
0.0% |
1.2% |
0.6x |
Lighten |
|
Jubilee Holdings |
360.0 |
360.0 |
0.0% |
(1.3%) |
30.6% |
275.8 |
330.9 |
2.5% |
(5.6%) |
0.7x |
Sell |
|
Britam |
8.1 |
8.3 |
2.2% |
4.1% |
18.6% |
3.1 |
3.2 |
0.0% |
(19.3%) |
1.5x |
Sell |
|
CIC Group |
2.8 |
2.8 |
3.3% |
(7.1%) |
34.6% |
2.1 |
1.8 |
0.0% |
(36.6%) |
1.0x |
Sell |
|
Target Price as per Cytonn Analyst estimates as at Q1’2021 **Upside/ (Downside) is adjusted for Dividend Yield ***For Disclosure, these are stocks in which Cytonn and/or its affiliates are invested in |
|||||||||||
We are “Neutral” on the Equities markets in the short term. With the market currently trading at par with its future growth (PEG Ratio at 1.0x), we believe that investors should reposition towards companies with a strong earnings growth and are trading at discounts to their intrinsic value. Additionally, we expect the recent discovery of new strains of COVID-19 coupled with the introduction of strict lockdown measures in major economies to continue dampening the economic outlook.
- Industry Reports
During the month, the Kenya Roads Board (KRB), the agency overseeing development and maintenance of roads in Kenya, released the Annual Public Roads Programme 2021/2022 report and the following were the key take outs;
- Kenya’s good road networks increased from 10.0% in 2009 to 18.2% in 2018, while the poor road networks decreased to 37.0% in 2018, from the 58.9% recorded in 2009, both signifying the government’s efforts to better the infrastructure roads sector in Kenya through implementation and development of various project such as the ongoing Nairobi Expressway and Western Bypass,
- A total of Kshs 55.0 bn is set to be disbursed to various agencies namely; Kenya National Highway Authority (KeNHA), Kenya Urban Roads Authority (KURA), Kenya Rural Roads Authority (KeRRA), Kenya Wildlife Service (KWS), and Roads Sector Investment Programme Gaps (RSIPG), for the purpose of restoration and maintenance of public roads. This represents a 22.0% points increase in the funds allocated for the maintenance of roads for the FY’2021/22 compared to the Kshs 45.1 bn spent in the FY’2020/21, and an indication that more roads are expected to be renovated,
- KeNHA, KURA, KeRRA, KWS, and RSIPG are each set to receive Kshs 26.6 bn, Kshs 6.7 bn, Kshs 14.6 bn, Kshs 0.7 bn, and Kshs 6.5 bn, respectively, for revamping and maintaining their respective road projects, with the total road network to be covered under the Annual Public Roads Programme (APRP) 2021/22 being 48.4 Km, which represents 99.0% of the classified national trunk road network and 30.0% of the total national road network, and,
- Kenya’s road network coverage is currently at 161,451 Km valued at Kshs 3.5 tn, which is even higher than the total 3.0 tn budget for FY’2021/22, indicating heavy investment on the infrastructure sector.
The government of Kenya continues to focus on the implementation and conclusion of various road projects in the country in order to make Kenya an intra-regional hub for trade in East Africa. Some of the projects in the pipeline include; i) the Nairobi Expressway expected to be completed in February 2021, ii) the Western Bypass, iii) Nairobi-Nakuru Mau Summit Highway project, and, iv) Lamu Port-South Sudan-Ethiopia Transport (LAPSSET) corridor whose first berth was completed and launched in May 2021. Upon disbursement of the funds, we expect improved conditions of road networks in the country following renovations, easier access to areas thus sparking trade and investment opportunities in the country, increasing tourism activities, and boost in property prices of surrounding regions.
The graph below shows the budget allocation to the infrastructure sector over the last nine financial years;
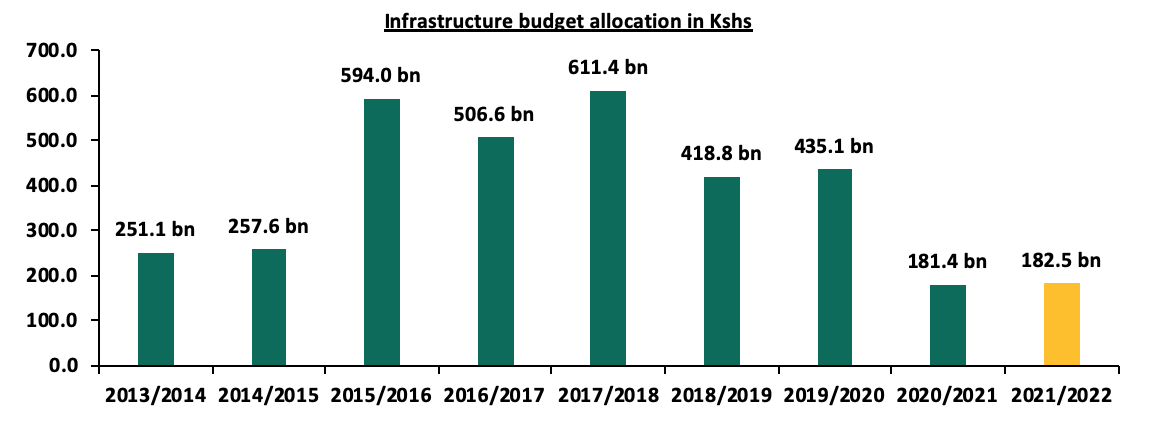
Source: National Treasury of Kenya
Other industry reports released during the month include:
|
# |
Theme |
Report |
Key Take-outs |
|
1 |
General Real Estate |
· The average selling prices for prime residential buildings realized a 0.1% y/y marginal improvement, whereas the commercial office and retail sectors recorded rental rate declines of 1.8% and 4.8%, respectively, from Kshs 457.4 per SQFT and Kshs 122.0 per SQFT recorded in FY’2020 to Kshs 435.6 per SQFT and Kshs 119.8 per SQFT, respectively, in H1’2021. For more information, see Cytonn Weekly #32/2021. |
|
|
· International arrivals through Jomo Kenyatta International Airport (JKIA) and Moi International Airport (MIA) registered an improvement from 1,177 visitors in Q2’2020 to 113,307 in Q2’2021, and, · Cement consumption registered a 26.9% increase to 3.3 mn metric tonnes between January and May 2021 from 2.6 mn metric tonnes in the same period in 2020. For more information, see Cytonn Weekly #33/2021. |
|||
|
2 |
Residential Sector |
· House prices realized an overall 0.1% q/q and 1.7% y/y price declines. For more information, see Cytonn Weekly #33/2021. |
|
|
3 |
Hospitality Sector |
· The number of operational hotels in June 2021 increased by 2.0% points to 96.0% from the 94.0% recorded in the May 2021. For more information, see Cytonn Weekly #31/2021. |
|
|
4 |
Land Sector |
· Land prices within Nairobi’s suburbs and satellite towns registered a 0.3% q/q and 1.1% q/q improvement. For more information, see Cytonn Weekly #33/2021. |
The real estate performance is expected to continue being boosted by; i) ongoing construction activities in the residential and infrastructure sectors facilitating uptake of land, ii) roll out of vaccines boosting confidence in flight travels thus enhancing international arrivals and operations of hotels, and, iii) continued development and uptake of retail spaces by both local and international retailers. However, performance of real estate sector is expected to be weighed down by poor performance in the commercial office sector attributed to working from home strategy still being embraced by majority of firms as a cost effective measure thus causing a decline in the demand for physical spaces and the overall rental yields.
- Residential Sector
Notable highlights during the month include;
- Stima Savings and Credit Cooperative (SACCO) Limited launched its Affordable Housing Mortgage Scheme in partnership with the Kenya Mortgage Refinance Company (KMRC), a treasury backed lender, targeting both individuals in formal and informal employment. The purpose of the scheme is to offer affordable mortgages to members of the SACCO with bespoke terms. For more information, see Cytonn Weekly #34/2021,
- The National Housing Corporation (NHC), a state owned firm, announced plans to build 2,000 affordable housing units in various parts of Kiambu County, in addition to also signing a land lease agreement with Konza City that will see the firm develop 5,000 units beginning November 2021. For more information, see Cytonn Weekly #32/2021,
- Centum Real Estate through its subsidiary Vipingo Development Limited (VDL) completed the construction of its 10-acre Palm Ridge Estate phase one project worth Kshs 1.5 bn in Kilifi County. The phase one of the project consisted of 330 apartments units of 1, 2 and 3 bedrooms. For more information, see Cytonn Weekly #32/2021, and,
- Centum Real Estate also partnered with NCBA Bank Kenya to provide mortgage financing for both qualified salaried and self-employed Kenyans to access over 5,000 units under development by the firm. For more information, see Cytonn Weekly #31/2021.
The residential sector continues to register increased activities hence we expect its performance to improve attributed to; i) availability of home loans, ii) the relatively high population growth rate at 2.3% p.a against the global average of 1.1% p.a according to the World Bank, which initiate more demand for housing, iii) government’s focus on the affordable homes initiative, and iv) improved infrastructure developments boosting home investment opportunities and prices.
- Retail Sector
During the week, Chandarana Food Plus, a local retail chain, opened a new outlet in Eldoret’s new Highland Mall. This is the first outlet opened this year by the retailer and the second to be opened in Eldoret town, bringing its number of operating stores to 21. The retailer also announced plans to open two more stores by the end of the year in Nakuru and Naivasha, in its race to keep up with the existing competition from rivals such as Naivas, QuickMart and Carrefour supermarkets which have each opened 6, 4, and 5 stores this year, respectively. The decision to take up space in Eldoret is driven by; i) strategic location of the mall along the Uganda Road facilitating easier access to the store by clients and suppliers, ii) positive demographics initiating demand for their products as Uasin Gishu county where Eldoret town lies recorded an increase in population to 1.6 mn in 2019 from 0.1 mn in 2009, according to the Kenya National Bureau of Statistics, and, iii) stiff competition for market share by close rivals. In terms of performance, according to our Kenya Retail Report 2020, Eldoret’s registered high rental rates of Kshs 130.0 per SQFT against the market average of Kshs 115.1 per SQFT. Despite this, the retailer still chose Eldoret as its new location due to the strategic location of the mall along the busy Uganda road providing easy access, coupled with the rising demand for goods and services as a result of the rising population.
The table below shows a summary of the performance of the retail sector in key urban cities in Kenya;
|
Summary Performance of Key Urban Cities in Kenya |
|||
|
Region |
Rent/SQFT 2020 |
Occupancy% 2020 |
Rental Yield |
|
Mount Kenya |
125.0 |
78.0% |
7.7% |
|
Nairobi |
168.5 |
74.5% |
7.5% |
|
Mombasa |
114.4 |
76.3% |
6.6% |
|
Kisumu |
97.2 |
74.0% |
6.3% |
|
Eldoret |
130.0 |
80.2% |
5.9% |
|
Nakuru |
55.7 |
76.6% |
5.9% |
|
Average |
115.1 |
76.6% |
6.7% |
Source: Cytonn Research 2020
Additionally, South African Game Stores retail chain announced plans to sell its three Kenyan based outlets located in the Waterfront Karen, Garden City Mall, and Kisumu’s Mega City Mall, to undisclosed potential buyers. This will mean the retailer completely exiting the Kenyan market, having first tapped into the Kenyan market in 2015. The decision by the international retailer to exit the Kenyan market is driven by the losses generated as a result of the tough business environment caused by the ongoing pandemic, as well as the difficulties in cracking the local market due to existing competition from other retailers. The move by the retailer also follows the planned exit of other international retailers such as ShopRite due to the constrained consumer spending patterns, decline in revenue and existing competition from local retailers such as Naivas. In our view, the decision of the retailer to sell its outlets instead of closure, coupled with the reopening of the economy spurring trade activities is expected to cushion the performance of the Kenyan retail market.
The table below shows the summary of the number of stores of the Key local and international retailer supermarket chains in Kenya;
|
Main Local and International Retail Supermarket Chains |
|||||||||
|
Name of Retailer |
Category |
Highest number of branches that have ever existed as at FY’2018 |
Highest number of branches that have ever existed as at FY’2019 |
Highest number of branches that have ever existed as at FY’2020 |
Number of branches opened in 2021 |
Closed branches |
Current number of Branches |
Number of branches expected to be opened |
Projected number of branches FY’2021 |
|
Naivas |
Local |
46 |
61 |
69 |
6 |
0 |
75 |
4 |
79 |
|
QuickMart |
Local |
10 |
29 |
37 |
4 |
0 |
41 |
4 |
45 |
|
Chandarana Foodplus |
Local |
14 |
19 |
20 |
1 |
0 |
21 |
2 |
23 |
|
Carrefour |
International |
6 |
7 |
9 |
5 |
0 |
14 |
2 |
16 |
|
Cleanshelf |
Local |
9 |
10 |
11 |
1 |
0 |
12 |
0 |
12 |
|
Tuskys |
Local |
53 |
64 |
64 |
0 |
61 |
3 |
0 |
3 |
|
Game Stores |
International |
2 |
2 |
3 |
0 |
0 |
3 |
0 |
0 |
|
Uchumi |
Local |
37 |
37 |
37 |
0 |
35 |
2 |
0 |
2 |
|
Choppies |
International |
13 |
15 |
15 |
0 |
13 |
2 |
0 |
2 |
|
Shoprite |
International |
2 |
4 |
4 |
0 |
3 |
1 |
0 |
1 |
|
Nakumatt |
Local |
65 |
65 |
65 |
0 |
65 |
0 |
0 |
0 |
|
Total |
257 |
313 |
334 |
17 |
177 |
174 |
12 |
183 |
|
Source: Online Research
Notable highlight during the month include;
- French retailer Carrefour, opened an outlet at the Southfield Mall in Embakasi Nairobi, taking up about 32,000 SQFT of retail space on two floors previously occupied by Choppies Supermarket. For more information, see Cytonn Weekly #34/2021.
The aggressive move by local and international retailers taking prime retail spaces, as well as others opting to sell their stores instead of closure is expected to cushion the performance of the retail sector against the existing oversupply currently at 2.0 mn SQFT in the Kenyan retail market. This is in addition to other driving factors such the high urbanization and population growth rates of 4.0% p.a and 2.3% p.a, respectively against the global average of 1.9% p.a and 1.1% p.a, respectively according to World Bank, and the improving infrastructure construction activities making it easier to access various locations and boosting trade activities as well.
- Hospitality Sector
Notable highlights during the month include;
- The Ministry of Tourism through the Tourism Fund Corporation announced plans to engage in Public Private Partnership (PPP) deal to complete the construction of Crab Utalii Hotel worth Kshs 5.9 bn, on a 20.0 are piece of land in Vipingo Kilifi County. For more information, see Cytonn Weekly #33/2021, and,
- The United States of America (USA) raised Kenya’s travel advisory alert from level two to level three, amidst concerns of the increasing Covid 19-Delta variant. For more information, see Cytonn Weekly #32/2021.
The hospitality sector which was the most hit real estate sector has been registering a significant growth in its activities and its overall performance is expected to be further driven by; i) reopening of the economy coupled with the roll out of vaccines boosting confidence in international travels, ii) introduction of charter flights to boost international arrivals, and, iii) the World Rally Championship expected to be hosted in Kenya annually until 2026 thereby boosting visitor arrivals and performance of the hotel industry. However, its performance is expected to be weighed down by the slow but rising tourism numbers as a result of top source tourist markets for Kenya such as USA and UK having issued travel advisories to Kenya.
- Infrastructure
Notable highlight during the month include;
- The national government through the Kenya Rural Roads Authority (KeRRA) began the tarmacking of the 55.0 Km Msau-Mbale-Werugha-Mgange-Bura road project at a cost of Kshs 2.0 bn in Taita Taveta County. Additionally, the Kenya Rural Roads Authority (KeRRA) announced plans to construct the 78.0 Km Kamukunji-Kisanana-Kipkitur-Lake Bogoria road worth Kshs 3.7 bn in Baringo County through Intex Construction Limited, a local contractor. For more information, see Cytonn Weekly #33/2021.
We expect continued construction and revamp activities to be witnessed in the infrastructure sector due to government’s aggressive focus to initiate and conclude projects through various strategies such as PPP’s, coupled with the increased budget allocation and for the sector by 0.6% to Kshs 182.0 bn in FY’2021/22 from Kshs 181.5 bn in FY’2020/21.
- Statutory Reviews
Notable highlight during the month include;
- The government of Kenya, through the Ministry of Lands and Physical Planning, published the Draft National Land Surveying and Mapping Policy, 2021 to guide the practice of land surveying and mapping in various sectors of the economy. For more information, see Cytonn Weekly #34/2021.
- Listed Real Estate
In the Nairobi Stock Exchange, the ILAM Fahari I-REIT closed the month trading at an average price of Kshs 6.7 per share, representing a 12.1% Year-to-Date (YTD) increase from Kshs 5.8 per share. However, the performance also represented a 3.0% Month-to-Date (MTD) and 67.5% Inception-to-Date (ITD) declines from Kshs 6.7 and Kshs 20.0, respectively. The REIT is expected to continue recording subdued performance due to; i) a general lack of knowledge on the financing instrument, ii) general lack of interest of the REIT by investors, iii) High minimum investments amounts set at Kshs 5.0 mn, and, iv) lengthy approval processes to get all the necessary requirements thus discourage those interested in investing in it. The graph below shows the REIT’s performance from November 2015 to June 2021:
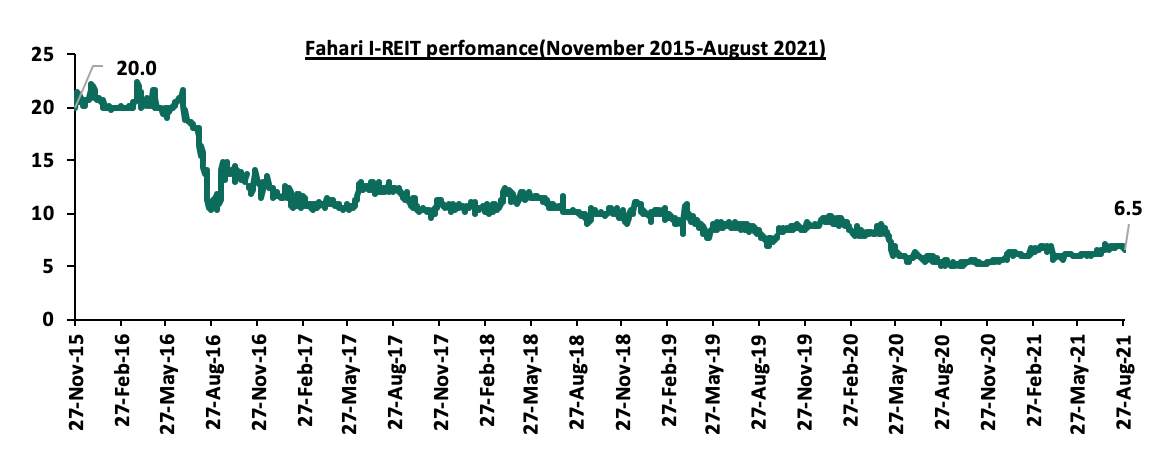
We expect the Kenyan real estate sector to continue recording various increased activities hence drive its growth supported by factors such as; i) government’s continued focus on the infrastructure and affordable home projects, ii) provision of home loans, iii) retailer’s aggressive expansion drive taking up prime spaces, iv) slowly rising numbers of international visitors, and, v) establishment of statutory laws to guide the sector’s activities and overall performance. Despite this, there are challenges expected to impede performance of the sector such as the low demand for physical office spaces, and lack of investor appetite in listed REITs.
Disclaimer: The views expressed in this publication are those of the writers where particulars are not warranted. This publication, which is in compliance with Section 2 of the Capital Markets Authority Act Cap 485A, is meant for general information only and is not a warranty, representation, advice or solicitation of any nature. Readers are advised in all circumstances to seek the advice of a registered investment advisor.

- Talk to us
- Kenya
- P.O Box 20695 - 00200, Nairobi, Kenya
- Cell +254709101200
- Tel +254709101200
- WhatsApp +254741676635
- United States
- +254709101200
- DOWNLOAD OUR APP
-


- Kenya
- 8th Floor, Pinetree Plaza, Kaburu Drive, Ngong Road, Nairobi, Kenya
- USA
- Suite 1150, 1775 Eye Street NW, USA, Washington DC 20006, USA
- Investments
- High Yield
- Private Equity
- Real Estate
- Real Estate
- RiverRun Estates
- Cytonn Towers
- The Ridge
- Taraji Heights
- The Alma