Cytonn Monthly - November 2022
By Research Team, Dec 4, 2022
Executive Summary
Fixed Income
During the month of November, T-bills were oversubscribed, with the overall rate increasing to 167.7% from 91.9% recorded in the month of October 2022, partly attributable to eased liquidity with the average interbank rate declining to 4.6% from 5.1% recorded in October. The overall subscription rate for the 364-day, 182-day and 91-day papers significantly increased to 105.2%, 112.2% and 462.4% from 29.0%, 61.7% and 324.2% respectively recorded in October 2022. Average yields on the government papers recorded mixed performance, with the average yields on the 91-day and 364-day papers increasing by 13.0 bps and 25.1 bps to 9.2% and 10.2%, from 9.1% and 9.9% respectively recorded in October, while yields on the 182-day paper remained relatively unchanged at 9.7%. For the month of November, the government continued to reject expensive bids, accepting a total of Kshs 129.3 bn of the Kshs 161.0 bn worth of bids received, translating to an acceptance rate of 80.3%. The November 2022 bonds were oversubscribed, with IFB1/2022/14 receiving bids worth Kshs 91.8 bn against the offered Kshs 60.0 bn, translating to a subscription rate of 153.1% with a subsequent tap sale receiving bids worth Kshs 19.1 bn against the offered Kshs 5.0 bn, translating to a subscription rate of 382.7%.
During the week, T-bills were undersubscribed for the first time in five weeks, with the overall subscription rate declining to 82.4%, from the 113.4% recorded the previous week. The lower subscription is partly attributable to tightened liquidity in the money market with the average interbank rate increasing to 5.1% from 4.8% recorded the previous week. Investor’s preference for the shorter 91-day paper persisted, with the paper receiving bids worth Kshs 13.2 bn against the offered Kshs 4.0 bn, translating to a subscription rate of 330.7%, up from 316.8% recorded the previous week. The subscription rates for the 364-day and 182-day papers declined to 26.4% and 39.2% from 76.9% and 68.5%, respectively recorded the previous week. The yields on the government papers were on an upward trajectory, with the yields on the 364-day, 182-day and 91-day papers increasing by 0.6 bps, 1.9 bps and 3.8 bps to 10.2%, 9.8% and 9.3%, respectively.
In the Primary Bond Market, the Central Bank of Kenya released the results for a switch auction of three treasury bills issues No. 2494/091, 2454/182 and 2380/364 and T-Bond issue No. FXD1/2021/2 to an infrastructure bond issue No. IFB1/2022/6, with an effective tenor to maturity of 6.0 years in a bid to raise Kshs 87.8 bn to meet upcoming maturities. The bond was undersubscribed having received bids worth Kshs 52.9 bn translating to a subscription rate of 60.3%, partly attributable to investors avoiding the duration risk and tightened liquidity in the money market;
Also during the week, the Kenya National Bureau of Statistics (KNBS) released the y/y inflation for the month of November 2022 highlighting that the inflation rate declined to 9.5%, from the 9.6% recorded in October 2022, against our expectations of an increase within the range of 9.7%-10.1%;
Equities
During the month of November, the equities market was on a downward trajectory, with NASI, NSE 20, and NSE 25 declining by 1.8%, 2.4%, and 1.1%, respectively. The equities market performance was driven by losses recorded by large cap stocks such as Bamburi, Safaricom and Equity Group of 6.0%, 3.0%, and 2.2%, respectively. The losses were however mitigated by gains recorded by banking stocks such as NCBA Group, Standard Chartered Bank of Kenya (SCBK) and ABSA of 5.4%, 4.3%, and 3.6%, respectively.
During the week, the equities market was on a downward trajectory, with NASI, NSE 20 and NSE 25 declining by 0.7%, 0.1%, and 0.8%, respectively, taking YTD performance to losses of 24.3%, 13.8% and 17.9% for NASI, NSE 20 and NSE 25 respectively. The equities market performance was mainly driven by losses recorded by stocks such as Bamburi, Co-operative Bank, Equity Group and Safaricom of 5.7%, 3.2%, 2.0% and 1.2% respectively. The losses were however mitigated by gains recorded by stocks such as Standard Chartered Bank Kenya (SCBK), Diamond Trust Bank (DTB-K), BAT and ABSA of 2.3%, 2.1%, 1.6% and 1.3% respectively;
During the week, the Central Bank of Kenya (CBK) released the Quarterly Economic Review for the period ending 30th September 2022, highlighting that the banking sector remained stable and resilient during the period, on the back of strong liquidity and capital adequacy. Additionally, Centum Investment Company PLC issued a share buyback notice to shareholders, proposing to buy back of up to 10.0% (66.5 mn shares) of its issued and paid-up share capital in accordance with Part XVI, Section 447 of the Companies Act, 2015 of the Laws of Kenya;
Additionally, HF Group and ABSA Bank released their Q3’2022 financial results and recorded an increase in core earnings per share of 110.8% and 30.1% respectively;
Real Estate
During the month, the Central Bank of Kenya (CBK) released the Quarterly Economic Review Q3’2022 highlighting that the gross loans advanced to the Real Estate sector increased by 0.2% to Kshs 467.0 bn in Q3’2022, from Kshs 466.0 bn in Q2’2022 representing a 0.9% y/y increase from Kshs 463.0 bn in Q3’2021. Additionally, Hass Consult released two Industry reports namely; the House Price Index Q3’2022 Report and the Land Price Index Q3’2022 Report, while Knight Frank released the Prime Global Cities Index Q3’2022 Report;
In the Real Estate Investment Trusts (REITs) segment, Fahari I-REIT closed the week trading at an average price of Kshs 6.5 per share on the Nairobi Stock Exchange, a 2.9% increase from Kshs 6.3 per share recorded the previous week, while Acorn D-REIT and I-REIT closed the week trading at Kshs 23.8 and Kshs 20.9 per unit, respectively, on the Unquoted Securities Platform as at 25th November 2022, a 19.2% and 4.4% gain for the D-REIT and I-REIT, respectively, from the Kshs 20.0 inception price;
Investment Updates:
- Weekly Rates:
- Cytonn Money Market Fund closed the week at a yield of 10.76%. To invest, dial *809# or download the Cytonn App from Google Playstore here or from the Appstore here;
- Cytonn High Yield Fund closed the week at a yield of 13.94% p.a. To invest, email us at sales@cytonn.com and to withdraw the interest, dial *809# or download the Cytonn App from Google Playstore here or from the Appstore here;
- We continue to offer Wealth Management Training every Wednesday and every third Saturday of the month, from 9:00 am to 11:00 am, through our Cytonn Foundation. The training aims to grow financial literacy among the general public. To register for any of our Wealth Management Trainings, click here;
- If interested in our Private Wealth Management Training for your employees or investment group, please get in touch with us through wmt@cytonn.com;
- Any CHYS and CPN investors still looking to convert are welcome to consider one of the five projects currently available for assignment, click here for the latest term sheet;
- Cytonn Insurance Agency acts as an intermediary for those looking to secure their assets and loved ones’ future through insurance namely; Motor, Medical, Life, Property, WIBA, Credit and Fire and Burglary insurance covers. For assistance, get in touch with us through insuranceagency@cytonn.com;
- Cytonnaire Savings and Credit Co-operative Society Limited (SACCO) provides a savings and investments avenue to help you in your financial planning journey. To enjoy competitive investment returns, kindly get in touch with us through clientservices@cytonn.com;
Real Estate Updates:
- For an exclusive tour of Cytonn’s real estate developments, visit: Sharp Investor's Tour, and for more information, email us at sales@cytonn.com;
- Phase 3 of The Alma is now ready for occupation and the show house is open daily. To rent please email properties@cytonn.com;
- We have 8 investment-ready projects, offering attractive development and buyer targeted returns; See further details here: Summary of Investment-ready Projects;
- For Third Party Real Estate Consultancy Services, email us at rdo@cytonn.com;
- For recent news about the group, see our news section here;
Hospitality Updates:
- We currently have promotions for Staycations. Visit cysuites.com/offers for details or email us at sales@cysuites.com;
Money Markets, T-Bills Primary Auction:
During the month of November, T-bills were oversubscribed, with the overall rate increasing to 167.7% from 91.9% recorded in the month of October 2022, partly attributable to eased liquidity during the period with the average interbank rate declining to 4.6% from 5.1% recorded in October. The overall subscription rate for the 364-day, 182-day and 91-day papers significantly increased to 105.2%, 112.2% and 462.4% from 29.0%, 61.7% and 324.2% respectively recorded in October 2022. The average yields on the government papers recorded mixed performance, with the average yields on the 91-day and 364-day papers increasing by 13.0 bps and 25.1 bps to 9.2% and 10.2%, from 9.1% and 9.9% respectively recorded in October 2022, while yields on the 182-day paper remained relatively unchanged at 9.7%. For the month of November, the government continued to reject expensive bids, accepting a total of Kshs 129.3 bn of the Kshs 161.0 bn worth of bids received, translating to an acceptance rate of 80.3%.
During the week, T-bills were undersubscribed for the first time in five weeks, with the overall subscription rate declining to 82.4%, from the 113.4% recorded the previous week. The lower subscription is partly attributable to tightened liquidity in the money market with the average interbank rate increasing to 5.1% from 4.8% recorded the previous week. Investor’s preference for the shorter 91-day paper persisted, with the paper receiving bids worth Kshs 13.2 bn against the offered Kshs 4.0 bn, translating to a subscription rate of 330.7%, up from 316.8% recorded the previous week. The subscription rates for the 364-day and 182-day papers declined to 26.4% and 39.2% from 76.9% and 68.5%, respectively recorded the previous week. The yields on the government papers were on an upward trajectory, with the yields on the 364-day, 182-day and 91-day papers increasing by 0.6 bps, 1.9 bps and 3.8 bps to 10.2%, 9.8% and 9.3%, respectively.
In the Primary Bond Market, the Central Bank of Kenya released the results for a switch auction of three treasury bills issues No. 2494/091, 2454/182 and 2380/364 and T-Bond issue No. FXD1/2021/2 to an infrastructure bond issue No. IFB1/2022/6, with an effective tenor to maturity of 6.0 years in a bid to raise Kshs 87.8 bn to meet upcoming maturities. The bond was undersubscribed having received bids worth Kshs 52.9 bn translating to a subscription rate of 60.3%, partly attributable to investors avoiding the duration risk and tightened liquidity in the money market. The government accepted bids worth Kshs 49.1 bn translating to an acceptance rate of 92.8%. The coupon rate and the market average yield for the bond both came at 13.2%.
The November 2022 bonds were oversubscribed, with IFB1/2022/14 receiving bids worth Kshs 91.8 bn against the offered Kshs 60.0 bn, translating to a subscription rate of 153.1% with a subsequent tap sale received bids worth Kshs 19.1 bn against the offered Kshs 5.0 bn, translating to a subscription rate of 382.7%. The table below provides more details on the bonds issued during the month of November:
|
Issue Date |
Bond Auctioned |
Effective Tenor to Maturity (Years) |
Coupon |
Amount offered (Kshs bn) |
Actual Amount Raised (Kshs bn) |
Total bids received |
Average Accepted Yield |
Subscription Rate |
Acceptance Rate |
|
|
11/14/2022 |
IFB1/2022/14 |
14.0 |
13.9% |
60.0 |
75.6 |
91.8 |
13.9% |
153.1% |
82.3% |
|
|
11/28/2022 |
IFB1/2022/14-Tap Sale |
14.0 |
13.9% |
5.0 |
19.1 |
19.1 |
13.9% |
382.7% |
100.0% |
|
|
Nov 2022 Average |
|
14.0 |
13.9% |
32.5 |
47.4 |
55.5 |
13.9% |
267.9% |
91.1% |
|
|
Oct 2022 Average |
|
14.1 |
13.3% |
30.0 |
14.4 |
16.8 |
13.8% |
60.7% |
86.1% |
|
Secondary Bond Market:
The yield on the government securities increased during the month compared to the same period in 2021 as a result of the elevated inflationary pressures leading to investors demanding higher premiums. The chart below shows the yield curve movement during the period: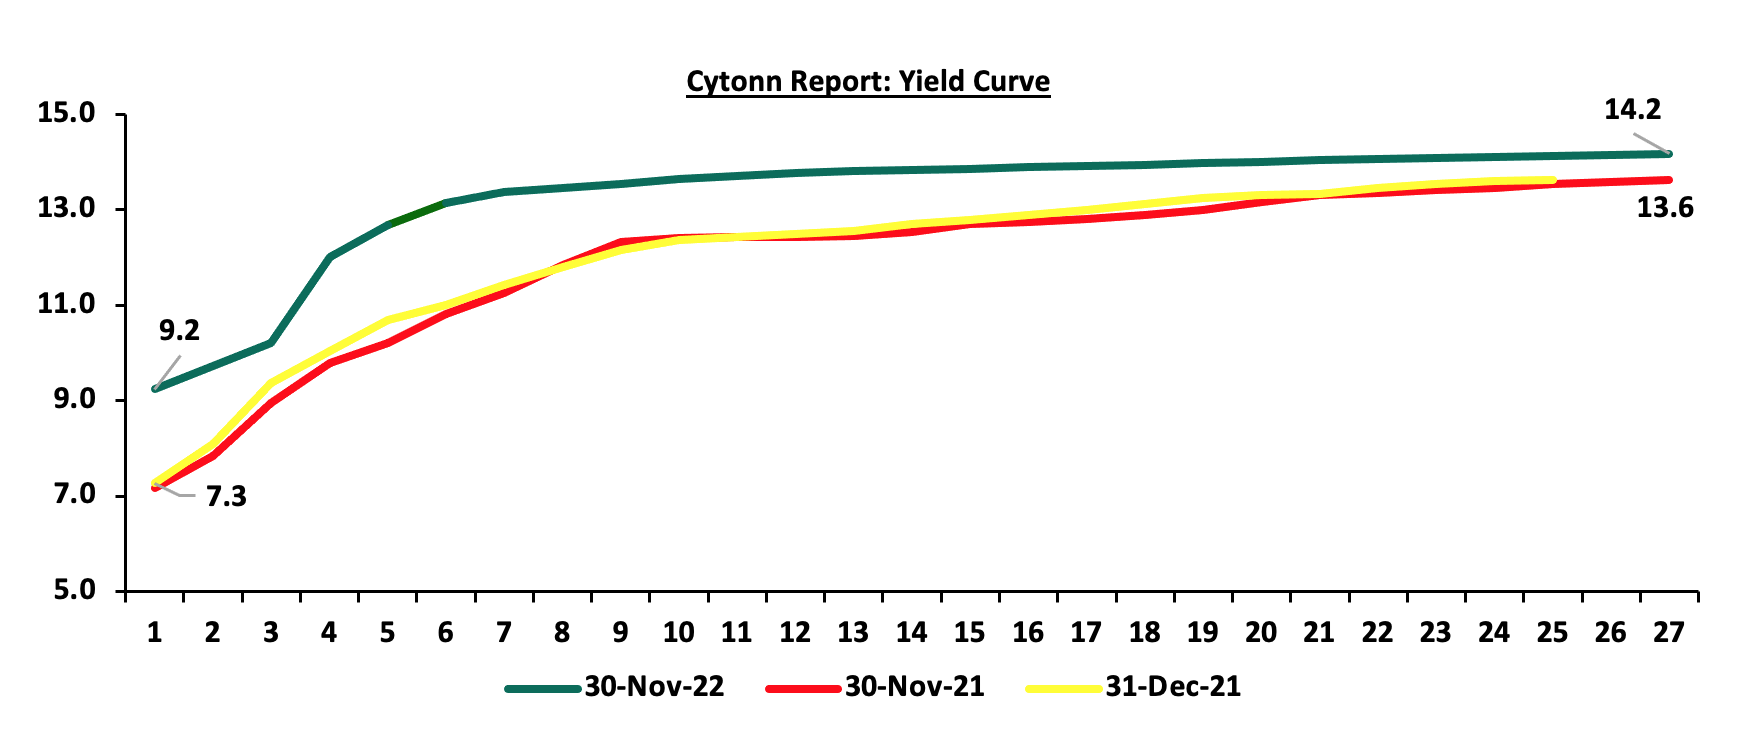
The secondary bond turnover declined by 5.3% to Kshs 54.5 bn, from Kshs 57.6 bn recorded in October 2022, pointing towards reduced activity by commercial banks in the secondary bonds market. On a year on year basis, the bonds turnover declined by 20.6% to Kshs 688.9 bn, from Kshs 867.7 bn worth of treasury bonds transacted over a similar period last year. 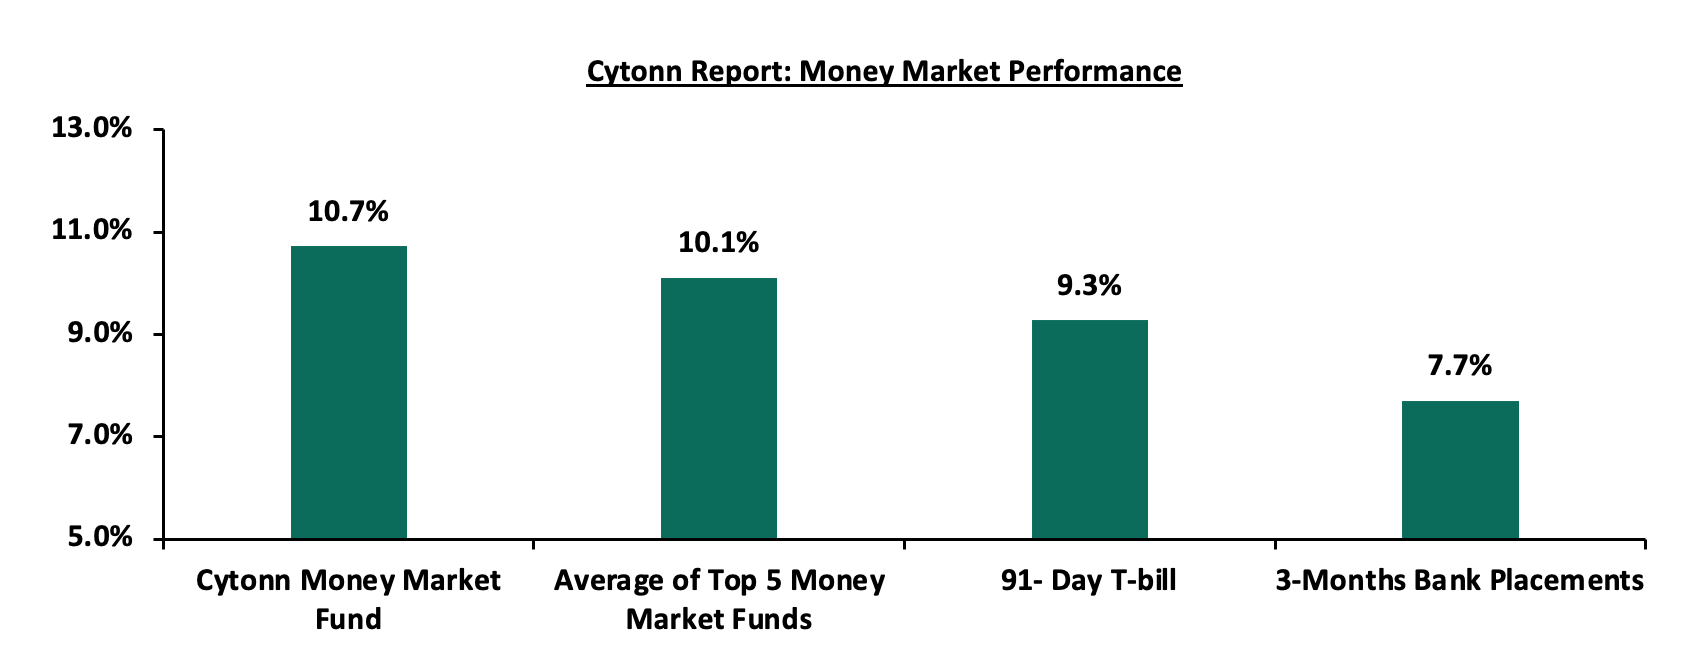
In the money markets, 3-month bank placements ended the week at 7.7% (based on what we have been offered by various banks), while the yield on the 91-day T-bill increased by 3.8 bps to 9.3%. The average yield of the Top 5 Money Market Funds and the Cytonn Money Market Fund remained unchanged at 10.1% and 10.7%, respectively
The table below shows the Money Market Fund Yields for Kenyan Fund Managers as published on 2nd December 2022:
|
Cytonn Report: Money Market Fund Yield for Fund Managers as published on 2nd December 2022 |
||
|
Rank |
Fund Manager |
Effective Annual Rate |
|
1 |
GenCap Hela Imara Money Market Fund |
10.8% |
|
2 |
Cytonn Money Market Fund |
10.7% |
|
3 |
Zimele Money Market Fund |
9.9% |
|
4 |
NCBA Money Market Fund |
9.6% |
|
5 |
Sanlam Money Market Fund |
9.5% |
|
6 |
Apollo Money Market Fund |
9.5% |
|
7 |
Madison Money Market Fund |
9.4% |
|
8 |
Nabo Africa Money Market Fund |
9.4% |
|
9 |
Dry Associates Money Market Fund |
9.2% |
|
10 |
Old Mutual Money Market Fund |
9.2% |
|
11 |
Co-op Money Market Fund |
9.2% |
|
12 |
CIC Money Market Fund |
9.1% |
|
13 |
British-American Money Market Fund |
8.9% |
|
14 |
AA Kenya Shillings Fund |
8.8% |
|
15 |
ICEA Lion Money Market Fund |
8.6% |
|
16 |
Orient Kasha Money Market Fund |
8.6% |
|
17 |
Absa Shilling Money Market Fund |
7.7% |
|
18 |
Equity Money Market Fund |
5.4% |
Source: Business Daily
Liquidity:
Liquidity in the money markets eased in the month of November 2022, with the average interbank rate declining to 4.6%, from 5.1%, recorded in October 2022. However, during the week, liquidity in the money markets tightened, with the average interbank rate increasing to 5.1% from 4.8% recorded the previous week, partly attributable to tax remittances that offset government payments. The average interbank volumes traded increased by 3.4% to Kshs 21.7 bn from Kshs 21.0 bn recorded the previous week.
Kenya Eurobonds:
During the month, the yields on the Eurobonds were on a downward trajectory despite the prevailing uncertainties surrounding the increasing inflationary pressures and local currency depreciation. The yield on the 7-year Eurobond issued in 2019 was the largest decliner having declined by 4.0% points to 10.7% from 14.7%, recorded in October 2022.
During the week, the yields on Eurobonds were also on a downward trajectory with the yield on the 10-year Eurobond issued in 2014 recording the largest declines having declined by 1.2% points to 11.6% from 12.8%, recorded the previous week. The table below shows the summary of the performance of the Kenyan Eurobonds as of 1st December 2022;
|
Cytonn Report: Kenya Eurobonds Performance |
||||||
|
|
2014 |
2018 |
2019 |
2021 |
||
|
Date |
10-year issue |
10-year issue |
30-year issue |
7-year issue |
12-year issue |
12-year issue |
|
3-Jan-22 |
4.4% |
8.1% |
8.1% |
5.6% |
6.7% |
6.6% |
|
31-Oct-22 |
15.6% |
13.9% |
13.2% |
14.7% |
14.1% |
12.7% |
|
24-Nov-22 |
12.8% |
10.4% |
11.0% |
11.0% |
10.8% |
9.9% |
|
25-Nov-22 |
12.2% |
10.3% |
10.9% |
10.9% |
10.5% |
9.7% |
|
28-Nov-22 |
12.4% |
10.3% |
10.9% |
10.9% |
10.5% |
9.7% |
|
29-Nov-22 |
12.1% |
10.1% |
10.8% |
10.7% |
10.4% |
9.6% |
|
30-Nov-22 |
12.0% |
10.1% |
10.8% |
10.7% |
10.4% |
9.6% |
|
1-Dec-22 |
11.6% |
9.9% |
10.6% |
10.3% |
10.2% |
9.3% |
|
Weekly Change |
(1.2%) |
(0.5%) |
(0.4%) |
(0.7%) |
(0.6%) |
(0.6%) |
|
MTM Change |
(3.6%) |
(3.8%) |
(2.4%) |
(4.0%) |
(3.7%) |
(3.1%) |
|
YTD Change |
7.2% |
1.8% |
2.5% |
4.7% |
3.5% |
2.7% |
Source: Central Bank of Kenya (CBK)
Kenya Shilling:
During the month, the Kenya Shilling depreciated by 0.9% against the US Dollar, to close the month at Kshs 122.4, from Kshs 121.3 recorded at the end of October 2022, partly attributable to the increased dollar demand from importers, especially oil and energy sectors against a slower supply of hard currency.
During the week, the Kenyan shilling depreciated by 0.2% against the US dollar to close the week at Kshs 122.5, from Kshs 122.3 recorded the previous week, partly attributable to increased dollar demand from importers, especially oil and energy sectors against a slower supply of hard currency. On a year to date basis, the shilling has depreciated by 8.3% against the dollar, higher than the 3.6% depreciation recorded in 2021. We expect the shilling to remain under pressure in 2022 as a result of:
- High global crude oil prices on the back of persistent supply chain bottlenecks coupled with high demand,
- An ever-present current account deficit estimated at 5.5% of GDP in the 12 months to October 2022, same as what was recorded in a similar period in 2021,
- The need for Government debt servicing which continues to put pressure on forex reserves given that 69.7% of Kenya’s External debt was US Dollar denominated as of September 2022, and,
- A continued hike in the USA Fed interest rates in 2022 to a range of 3.75%-4.00% in November 2022 has strengthened the dollar against other currencies by causing capital outflows from other global emerging markets.
The shilling is however expected to be supported by:
- Improved diaspora remittances standing at a cumulative USD 3.3 bn as of October 2022, representing a 9.1% y/y increase from USD 3.1 bn recorded over the same period in 2021, and,
- Sufficient Forex reserves currently at USD 7.1 bn (equivalent to 4.0 months of import cover), which is at par with the statutory requirement of maintaining at least 4.0-months of import cover, however it’s important to note that Forex reserves have dropped by 19.8% YTD from USD 8.8 bn. The chart below summarizes the evolution of Kenya months of import cover over the last 10 years;
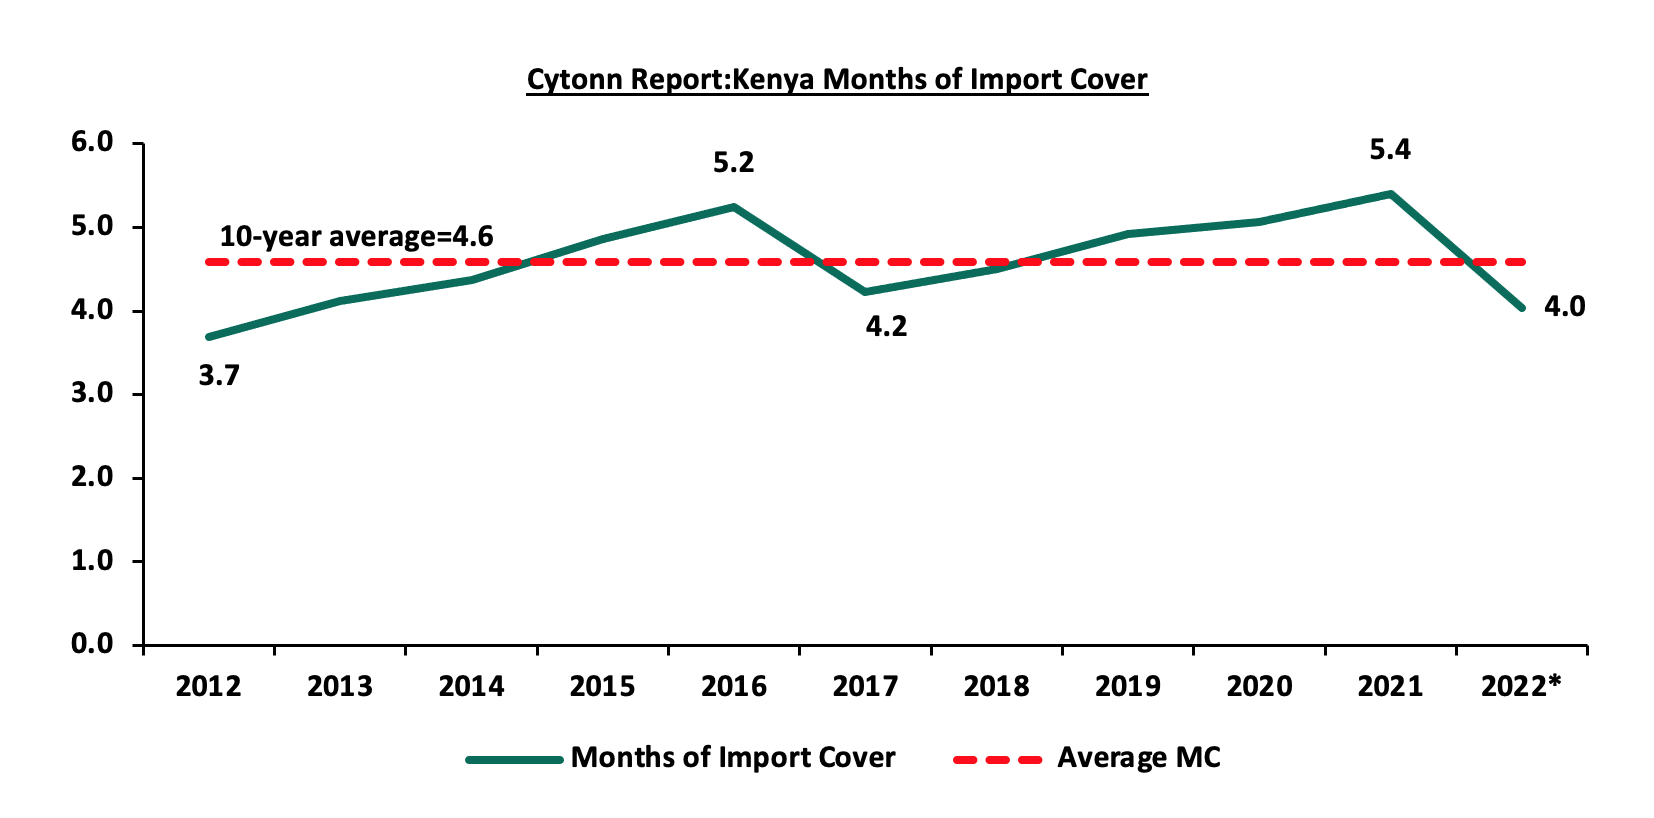
*Figure as of December 2022
Weekly Highlights:
- November 2022 Inflation
The y/y inflation for the month of November 2022 declined to 9.5%, from the 9.6% recorded in October 2022, against our expectations of an increase within a range of 9.7%-10.1% mainly driven by the elevated food and fuel prices. The table below shows a summary of both the year on year and month on month commodity groups’ performance:
Major Inflation Changes – November 2022
Broad Commodity Group
Price change m/m (October-2022/November-2022)
Price change y/y (Novemer-2021/November-2021)
Reason
Food and Non-Alcoholic Beverages
0.6%
15.4%
The m/m increase was mainly driven by increase in price commodities such as cabbages, potatoes, Kales and beans. The increase was, however, mitigated by drop in prices of commodities such as cooking oil, tomatoes and fortified maize flour.
Housing, Water, Electricity, Gas and Other Fuel
(0.4%)
6.1%
The m/m change was mainly due to drop in prices of 50 Kilowatts electricity units, 200 Kilowatts electricity units, gas and Kerosene
Transport cost
(0.1%)
11.7%
The change was mainly driven by drop in prices of diesel and petrol by 0.6%. However, the prices were still high
Overall Inflation
0.3%
9.5%
The m/m was mainly driven by 0.6% increase in food and non-alcoholic beverages
Source: Kenya National Bureau of Statistics (KNBS)
Despite the slight decline in inflation rate, we expect the inflationary pressures to remain elevated in the short term, mainly on the back of high fuel prices which despite a decline of 0.7% in Kerosene and 0.6% for both diesel and Super petrol prices for the period between 15th November and 14th December 2022, the prices still remain elevated. With fuel being a major input in most businesses, we expect the high fuel prices to continue contributing to the elevated cost of production consequently elevating prices of commodities. Notably, the Monetary Policy Committee raised the Central Bank Rate to 8.75% in the month of November, from the previous 8.25% with the aim of anchoring the inflation rate. However, we are of the view that the inflationary pressures are mainly due to external shocks, and stabilization largely depends on how soon the global supply chain is restored.
Monthly Highlights:
- Stanbic Bank released its monthly Purchasing Manager’s Index (PMI), highlighting that the index for the month of October dropped to 50.2 from 51.7 recorded in September 2022, a seven-month high. Key to note, the drop was largely attributable to the rising costs of living leading to slow growth in demand for consumer goods. For more information, please see our Cytonn Monthly-October 2022,
- The International Monetary Fund (IMF) announcedthat it had reached a staff level agreement with Kenyan authorities on the fourth review of the 38-months Extended Fund Facility (EFF) and Extended Credit Facility (ECF) financing for Kenya which will allow Kenya to access financing of USD 433.0 bn (Kshs 52.7 bn) once the formal review is completed. For more information, please see our Cytonn Weekly #45/2022,
- The National Treasury gazettedthe revenue and net expenditures for the first four months of FY’2022/2023, ending 31st October 2022, highlighting that the total revenue collected as at the end of October 2022 amounted to Kshs 636.4 bn, equivalent to 89.2% of the prorated estimates of Kshs 713.9 bn. For more information, please see our Cytonn Weekly #46/2022, and,
- According to Ghana’s Ministry of Finance, Ghana’s Public Debt stood at USD 54.5 bn, equivalent to 77.5% of GDP as of May 2022 with external debt to GDP at 39.9% while that of the domestic debt at 37.5%. As such, the country is expected to be under high debt distress and this has been exacerbated by the high level of inflation which is at an all-time high of 40.4%, coupled with continued depreciation of the Cedi. For more information, please see our Cytonn Weekly #47/2022.
Rates in the Fixed Income market have remained relatively stable due to the relatively ample liquidity in the money market. The government is 28.8% ahead of its prorated borrowing target of Kshs 246.1 bn having borrowed Kshs 317.1 bn of the Kshs 581.7 bn borrowing target for the FY’2022/2023. We expect sustained gradual economic recovery as evidenced by the revenue collections of Kshs 636.4 bn in the FY’2022/2023 as at the end of October, equivalent to a 29.7% of its target of 2.1 tn. Despite the performance, we believe that the projected budget deficit of 6.2% is relatively ambitious given the downside risks and deteriorating business environment occasioned by high inflationary pressures. We however expect the support from the IMF and World Bank to finance some of the government projects and thus help maintain a stable interest rate environment since the government is not desperate for cash. Owing to this, our view is that investors should be biased towards short-term fixed-income securities to reduce duration risk.
Markets Performance
During the month of November, the equities market was on a downward trajectory, with NASI, NSE 20, and NSE 25 declining by 1.8%, 2.4%, and 1.1%, respectively. The equities market performance was driven by losses recorded by large cap stocks such as Bamburi, Safaricom and Equity Group of 6.0%, 3.0%, and 2.2%, respectively. The losses were however mitigated by gains recorded by banking stocks such as NCBA Group, Standard Chartered Bank of Kenya (SCBK) and ABSA of 5.4%, 4.3%, and 3.6%, respectively.
During the week, the equities market was on a downward trajectory, with NASI, NSE 20 and NSE 25 declining by 0.7%, 0.1%, and 0.8%, respectively, taking YTD performance to losses of 24.3%, 13.8% and 17.9% for NASI, NSE 20 and NSE 25 respectively. The equities market performance was mainly driven by losses recorded by stocks such as Bamburi, Co-operative Bank, Equity Group and Safaricom of 5.7%, 3.2%, 2.0%, and 1.2%, respectively. The losses were however mitigated by gains recorded by stocks such as Standard Chartered Bank Kenya (SCBK), Diamond Trust Bank (DTB-K), BAT and ABSA of 2.3%, 2.1%, 1.6%, and 1.3%, respectively.
Equities turnover increased by 8.3% in the month of November to USD 52.7 mn, from USD 48.7 mn recorded in October 2022. Additionally, foreign investors remained net sellers, with a net selling position of USD 7.3 mn, compared to October’s net selling position of USD 19.2 mn.
During the week, equities turnover declined by 9.1% to USD 10.5 mn from USD 11.5 mn recorded the previous week, taking the YTD turnover to USD 761.1 mn. Notably, foreign investors turned net buyers, with a net buying position of USD 0.1 mn, from a net selling position of USD 3.9 mn recorded the previous week, taking the YTD net selling position to USD 187.9 mn.
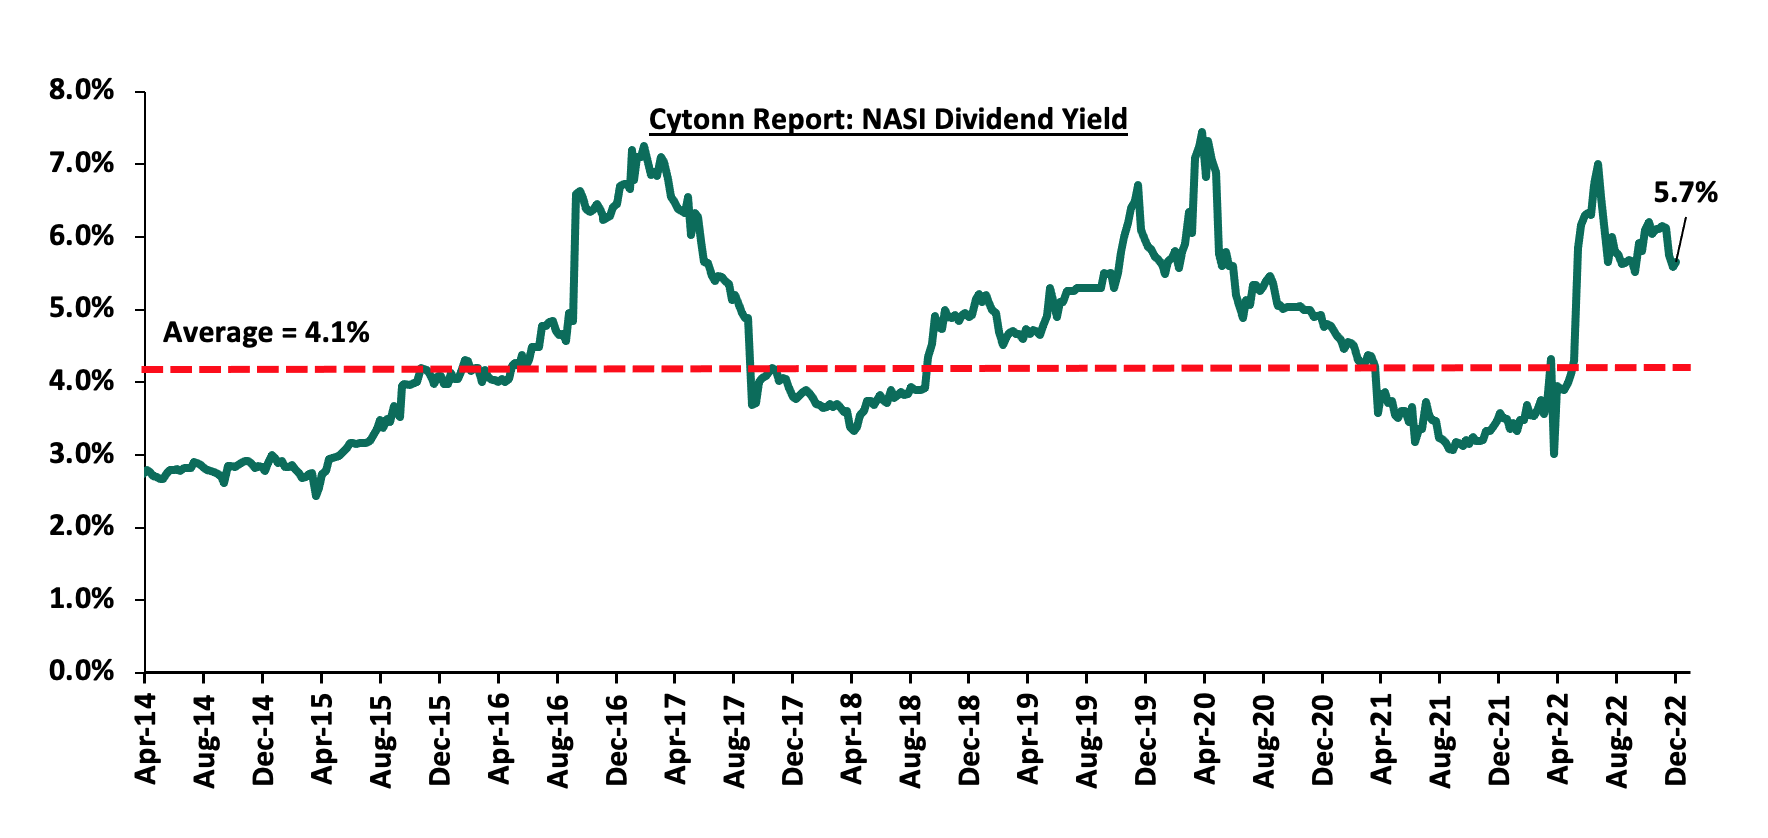
The market is currently trading at a price to earnings ratio (P/E) of 6.6x, 47.4% below the historical average of 12.6x, and a dividend yield of 5.7%, 1.6% points above the historical average of 4.1%. Key to note, NASI’s PEG ratio currently stands at 0.9x, an indication that the market is undervalued relative to its future growth. A PEG ratio greater than 1.0x indicates the market may be overvalued while a PEG ratio less than 1.0x indicates that the market is undervalued. The charts below indicate the historical P/E and dividend yields of the market;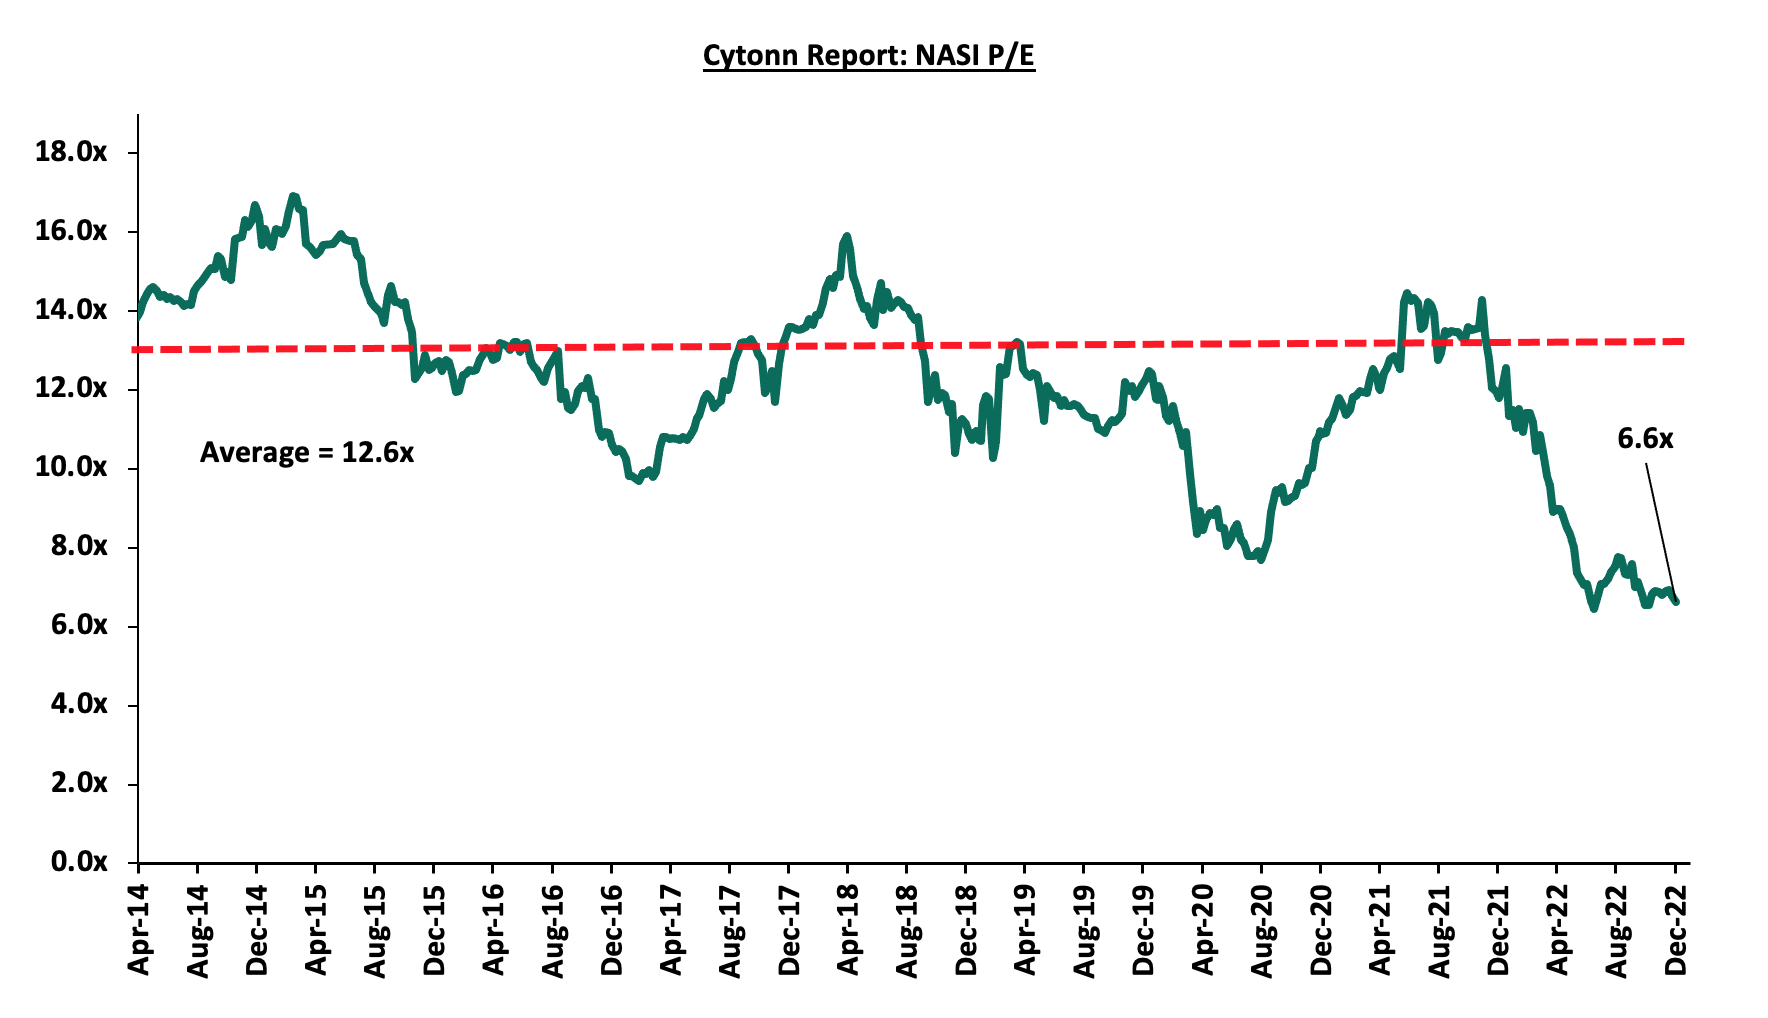
Monthly Highlights
- Safaricom Plc released its H1’2023financial results for the period ending 30th September 2022, highlighting that the profit after tax declined by 18.6% to Kshs 30.2 bn, from 37.1 bn recorded in H1’2022, largely attributable to a 32.2% increase in operating expenses to Kshs 31.0 bn from Kshs 23.4 bn recorded in H1’2022 due to commencement of operations in Ethiopia. For more information, please see our Cytonn Weekly #45/2022,
- The International Finance Corporation (IFC) disclosed that it would extend USD 100.0 mn (Kshs 12.2 bn) to Diamond Trust Bank (DTB) under the WCS COVID-19 FIGE response facility in form of a senior debt investment with 24-month maturity and renewable once on an aggregate of up to 36 months. The loan facility was aimed providing loans to Small and Medium Enterprises (SMEs) in Kenya operating in sectors such as Real Estate, Trade and Agriculture among others which are yet to fully recover from the effect of the pandemic. For more information, please see our Cytonn Weekly #46/2022,and,
- The Central Bank of Kenya released the Commercial Banks’ Credit Survey Reportfor the quarter ended September 2022, highlighting that banking sector’s loan book recorded a 12.6% y/y growth, with gross loans increasing to Kshs 3.6 tn in September 2022, from Kshs 3.2 tn in September 2021. On a q/q basis, the loan book increased by 2.9% from Kshs 3.5 tn in June 2022. For more information, please see our Cytonn Weekly #46/2022.
Weekly Highlight:
- Q3’2022 Quarterly Economic Review
During the week, the Central Bank of Kenya (CBK) released the Quarterly Economic Review for the period ending 30th September 2022, highlighting that the banking sector remained stable and resilient during the period, on the back of strong liquidity and capital adequacy. According to the report, the sector’s total assets increased by 2.6% to Kshs 6.4 tn in September 2022, from Kshs 6.2 tn in June 2022. The increase was mainly attributable to a 2.9% increase in loans and advances to Kshs 3.6 tn, from Kshs 3.5 tn recorded in Q2’2022. Additionally, balances held the CBK recorded a 13.6% increase equivalent to Kshs 32.8 bn while other assets increased by 14.5% equivalent to Kshs 44.1 bn, in the period under review. On a yearly basis, total assets increased by 10.3% to Kshs 6.4 tn, from Kshs 5.8 tn in Q3’2021. Notably, loans and advances accounted for 51.2% of total assets in Q3’2022, which was an increase from 50.8% of total assets in Q2’2022.
The banking sector recorded a 7.2% increase in Profit before Tax (PBT) q/q with the increase in profitability mainly attributable to a higher increase in quarterly income by Kshs 10.4 bn against a relatively lower increase in quarterly expenses by Kshs 5.9 bn. On a yearly basis, PBT increased by 36.7%, to Kshs 67.1 bn, from Kshs 49.1 bn recorded in Q3’2021. Additionally;
- The sector’s Return on Asset (ROA) rose marginally to 3.1%, from 3.0% in Q2’2022. Year on year, ROA increased by 0.5% points to 3.1% in Q3’2022, from 2.6% in Q3’2021. Additionally, Return On Equity (ROE) recorded 0.4% points increase to 27.2% in Q3’2022, from 26.8% in Q2’2022, and, a 5.2% points increase from 22.0% recorded in Q3’2021,
- Lending increased by 2.9% to Kshs 3.6 tn in Q3’2022, from Kshs 3.5 tn in Q2’2022, attributable to an increase in credit advanced to individual borrowers as well as for working capital purposes in sectors such as agriculture, trade, transport and communication, which increased by 7.8%, 6.7% and 3.8%, respectively. On a yearly basis, lending was up by 12.6% to Kshs 3.6 tn, from Kshs 3.2 tn in Q3’2021,
- Deposits recorded a 0.2% increase (Kshs 9.8 bn) to Kshs 4.63 tn in Q3’2022, from Kshs 4.62 tn in Q2’2022, attributable to a 0.8% increase in local currency deposits which increased to Kshs 3.5 tn in Q3’2022. Notably, on a yearly basis, deposits increased by 6.5% to Kshs 4.6 tn in Q3’2022, from Kshs 4.3 tn in Q3’2021. Key to note, customer deposits remain the main source of funding for banks, accounting for 72.1% of the sector’s total liabilities and shareholder’s funds as at Q3’2022, 1.8% points lower than the 73.9% recorded in Q2’2022 and a further 2.5% points decline from the 74.6% recorded in Q3’2021,
- Credit risk remained elevated in the sector despite the gross NPLs to gross loans ratio declining to 13.7% in Q3’2022 from 14.7% in Q2’2022. The decline in gross NPL ratio was driven by a faster 4.4% decrease in gross Non-Performing Loans (NPLs) to Kshs 491.8 bn in Q3’2022 from 514.4 bn in Q2’2022 relative to a slower 2.5% increase in gross loans in the period under review. Building and Construction, Tourism, Manufacturing, Real Estate, Financial Services, Transport and Communication and Trade sectors registered decreases in NPLs by 51.4%, translating to Kshs 24.6 bn as a result of a repayments. Notably, Energy and water, Agriculture, Mining and Quarrying, and Households sectors registered increase in NPLs attributable to delayed payments. Key to note, the asset quality marginally deteriorated on a year on year basis as the gross NPL ratio increased by 0.1% points to 13.7% in Q3’2022 from 13.6% in Q3’2021,
- The sector’s NPL coverage ratio increased to 44.1% in Q3’2022, from 43.3% in Q2’2022, attributable to a faster 4.4% decrease in gross Non-Performing Loan, coupled with a slower 3.2% decline in total provisions to Kshs 232.9 bn, from Kshs 240.5 bn in Q2’2022. We expect increased provisioning levels owing the elevated credit risks brought by the tough operating environments,
- The banking sector remained adequately capitalized, with the aggregate Core Capital to Total Risk weighted Assets ratio remaining unchanged at 16.1%, similar to what was recorded in Q2’2022, but 0.2% lower than the 16.3% recorded in Q3’2021. The core capital to Total Risk-Weighted Assets ratio was 5.6% points above the CBK’s minimum statutory ratio of 10.5%. On the other hand, Total Capital to Total Risk-Weighted Asset ratio, increased slightly by 0.2% points to 19.0%in Q3’2022, from 18.8% recorded in both Q2’2022 and Q3’2021. The Q3’2022 Total Capital to Total Risk-Weighted Assets ratio was 4.5% points above the CBK’s minimum statutory ratio of 14.5%. Key to note, the increase in capital ratios were mainly due to higher increase in core capital and total capital of 3.5% and 3.3%, respectively relative to a 2.5% growth in total risk weighted assets during the period under review, and,
- The sector remained sufficiently liquid during the period under review, despite the liquidity ratio decreasing to 51.5% in Q3’2022, from 52.5% in Q2’2022. Year on year, the ratio decreased by 5.2% points from 56.7% recorded in Q3’2021. This was a 31.5% points above the minimum statutory level of 20.0%. The decrease in the banking sector’s liquidity is attributable to 0.3% increase in short term liabilities, as compared to a 1.5% decrease in total liquid assets between the periods under review.
Despite the deterioration of the business environment in Q3’2022 with the average Purchasing Managers Index (PMI) coming in at 47.4 in the period, as compared to an average of 50.7 in a similar period last year, the banking sector profitability grew at 7.2% indicating resilience. We expect the sector’s profitability to be boosted by the expected adoption of risk based pricing models coupled with the easing credit risk evidenced by the decline in the sector’s gross NPL ratio to 13.7%, from 14.7% in Q2’2022.
- Centum Investments Limited share buy-back
During the week, Centum Investment Company PLC issued a share buyback notice to shareholders, proposing to buy back of up to 10.0% (66.5 mn shares) of its issued and paid-up share capital in accordance with Part XVI, Section 447 of the Companies Act, 2015 of the Laws of Kenya, and the Capital Markets Authority (CMA) guidelines. The buyback, an on-market transaction, is set to see the company reduce its outstanding shares to 598.9 mn shares, from the current 665.4 mn shares, with the shares bought classified as treasury stock subsequent to shareholder approval. Key to note, the buyback program will run for a period of 18 months from the date of shareholders’ resolution to adopt the program.
The Board approved maximum price for the buyback of Kshs 9.0 per share and a minimum price of Kshs 0.5 per share, in accordance with the CMA Guidelines on Share Buybacks for Listed Companies which caps the maximum price capped at 10.0% above the weighted average price of Kshs 8.2 in the 30 days prior to the board resolution on approving the buyback. The buyback is aimed at providing liquidity to shareholders who want to sell their stake while enhancing Net Asset Value (NAV) per share for investors who will hold their stakes. Key to note, Centum Investment Company will be the second company in the Nairobi Securities Exchange (NSE) to undertake a share repurchase program, after Nation Media Group (NMG), as highlighted in our Cytonn Monthly May 2021.
We expect the buyback to offer liquidity of Centum shares in Nairobi stock Exchange Market and improve the performance of firm’s share price which has registered a 45.3% year to date decline to Kshs 8.0 as at 30th November 2022, from an opening price of Kshs 14.7 in January 2022. The decline in the number of Centum Investment’s outstanding shares is expected to anchor NAV and increase the earnings per share for investors who opt to hold their stake. On a yearly basis Centum’s earnings per share have registered a 32.6% decline to losses of Kshs 1.2 in September 2022, from losses of kshs 0.9 in September 2021. Key to note, Centum Investments has registered dismal performance for the six-month period ending Sept 2022 as shown in the table below:
|
Cytonn Report: Centum Investment H1'2023 Financial Performance |
|||
|
H1'2022 (Kshs bn) |
H1'2023 (Kshs bn) |
y/y change |
|
|
Operating profit |
0.3 |
0.4 |
62.0% |
|
Interest expense |
(1.3) |
(1.1) |
(13.1%) |
|
Unrealized forex revaluation loss |
0.0 |
(0.5) |
977.1% |
|
Gain on disposal of subsidiary |
407.0 |
0.0 |
(100.0%) |
|
Loss after tax |
(0.7) |
(1.3) |
94.9% |
|
Earnings Per Share (Kshs) |
(0.9) |
(1.2) |
32.6% |
|
NAV |
59.8 |
62.1 |
|
Source: Centum H1’2023 results
We expect more listed companies to follow Centum Investments and initiate share repurchases given the increased selloffs in the Nairobi Securities exchange resulting in undervaluation of stock prices.
- Earnings Release
During the week, ABSA Bank and HF Group released their Q3’2022 financial results. Below is a summary of their performance;
- ABSA Bank
|
Balance Sheet Items |
Q3’2021 |
Q3’2022 |
y/y change |
|
Government Securities |
126.6 |
139.8 |
10.5% |
|
Net Loans and Advances |
229.1 |
289.4 |
26.4% |
|
Total Assets |
411.4 |
481.3 |
17.0% |
|
Customer Deposits |
268.8 |
281.1 |
4.6% |
|
Deposits per Branch |
3.2 |
3.4 |
7.1% |
|
Total Liabilities |
356.8 |
421.1 |
18.0% |
|
Shareholder's Funds |
54.6 |
60.3 |
10.3% |
|
Balance sheet ratios |
Q3’2021 |
Q3’2022 |
% point change |
|
Loan to Deposit Ratio |
85.2% |
103.0% |
17.8% |
|
Return on average equity |
21.1% |
23.2% |
2.1% |
|
Return on average assets |
2.6% |
3.0% |
0.4% |
|
Income Statement Items |
Q3’2021 |
Q3’2022 |
y/y change |
|
Net Interest Income |
18.6 |
23.3 |
25.3% |
|
Net non-Interest Income |
8.7 |
10.2 |
16.4% |
|
Total Operating income |
27.3 |
33.4 |
22.5% |
|
Loan Loss provision |
(3.4) |
(5.0) |
47.9% |
|
Total Operating expenses |
(15.4) |
(18.3) |
18.5% |
|
Profit before tax |
11.9 |
15.1 |
27.6% |
|
Profit after tax |
8.2 |
10.7 |
30.1% |
|
Core EPS |
1.5 |
2.0 |
30.1% |
|
Income statement ratios |
Q3’2021 |
Q3’2022 |
% point change |
|
Yield from interest-earning assets |
8.9% |
9.6% |
0.7% |
|
Cost of funding |
2.6% |
2.8% |
0.2% |
|
Net Interest Spread |
6.3% |
6.8% |
0.5% |
|
Cost of risk |
12.5% |
15.0% |
2.5% |
|
Net Interest Margin |
7.0% |
7.6% |
0.6% |
|
Cost to Income |
56.6% |
54.7% |
(1.9%) |
|
Cost to income (Without LLPs) |
44.1% |
39.7% |
(4.4%) |
|
Cost to Assets |
2.9% |
2.8% |
(0.1%) |
|
Net Interest Income as % of operating income |
68.0% |
69.6% |
1.6% |
|
Non-Funded Income as a % of operating income |
32.0% |
30.4% |
(1.6%) |
|
Capital Adequacy Ratios |
Q3’2021 |
Q3’2022 |
% Points change |
|
Core Capital/Total Liabilities |
17.9% |
18.8% |
0.9% |
|
Minimum Statutory ratio |
8.0% |
8.0% |
|
|
Excess |
9.9% |
10.8% |
0.9% |
|
Core Capital/Total Risk Weighted Assets |
14.7% |
13.8% |
(0.9%) |
|
Minimum Statutory ratio |
10.5% |
10.5% |
|
|
Excess |
4.2% |
3.3% |
(0.9%) |
|
Total Capital/Total Risk Weighted Assets |
17.3% |
16.2% |
(1.1%) |
|
Minimum Statutory ratio |
14.5% |
14.5% |
|
|
Excess |
2.8% |
1.7% |
(1.1%) |
|
Liquidity Ratio |
39.7% |
25.8% |
(13.9%) |
|
Minimum Statutory ratio |
20.0% |
20.0% |
|
|
Excess |
19.7% |
5.8% |
(13.9%) |
|
Adjusted Core Capital/Total Liabilities |
18.0% |
18.9% |
0.9% |
|
Adjusted Core Capital/Total RWA |
14.8% |
13.9% |
(0.9%) |
|
Adjusted Total Capital/Total RWA |
17.4% |
16.3% |
(1.1%) |
Key take-outs from the earnings release include;
- Earnings Growth: Core earnings per share increased by 30.1% to Kshs 2.0 in Q3’2022, from Kshs 1.5 in Q3’2021, higher than our projections of a 18.2% growth to Ksh 1.8. The performance was driven by a 22.5% increase in total operating income to Kshs 33.4 bn, from Kshs 27.3 bn recorded in Q3’2021. However, the growth was weighed down by the 18.5% increase in total operating expenses, to Kshs 18.3 bn, from Kshs 15.4 bn recorded in Q3’2021,
- Improvement in Asset Quality - The bank’s asset quality improved, with the NPL ratio declining by 1.5% points to 6.6% in Q3’2022, from 8.1% in Q3’2021, owing to the faster 25.3% growth in Gross Loans, as compared to the 2.0% increase in Gross Non-Performing Loans (NPLs). Key to note, the NPL ratio also declined by 0.6% points from 7.1% recorded in H1’2022, mainly attributable to the Bank’s credit management strategies which include restructuring of non-performing loans,
- Increased Provisioning – The Bank increased its Loans Loss Provision (LLPs) by 47.9% to Kshs 5.0 bn in Q3’2022, from Kshs 3.4 bn recorded in Q3’2021 aimed at mitigating increased credit risk on the back of the deteriorating business environment as a result of the high inflationary pressures. Additionally, the NPL coverage increased to 80.0%, from 74.5% in Q3’2021 as a result of a 10.3% increase in general provisions, which outpaced the 2.0% growth in Gross non-performing loans. This points towards increased provisioning by the bank amidst the tough operating environment on the back of the elevated cost of living,
- Improved efficiency levels – The Banks’s cost to income ratio without LLP improved, declining by 4.4% to 39.7%, from 44.1% in Q3’2021, an indication of improved efficiency, and,
- Improved Lending – The Bank increased its lending in Q3’2022 with Loans and advanced recording a 26.4% growth, highlighting the Bank’s aggressive lending despite the tough operating business environment.
For a comprehensive analysis, please see our ABSA Bank’s Q3’2022 Earnings Note
- HF Group
|
Balance Sheet Items |
Q3'2021 |
Q3'2022 |
y/y change |
|
Net loans |
34.6 |
35.2 |
1.7% |
|
Government Securities |
5.4 |
8.2 |
51.2% |
|
Total Assets |
52.2 |
55.1 |
5.6% |
|
Customer Deposits |
37.5 |
38.8 |
3.5% |
|
Deposits Per Branch |
1.7 |
1.8 |
3.5% |
|
Total Liabilities |
44.2 |
47.2 |
6.8% |
|
Shareholder's Funds |
8.0 |
7.9 |
(0.7%) |
|
Balance Sheet Ratios |
Q3'2021 |
Q3'2022 |
y/y change |
|
Loan to deposit ratio |
92.2% |
90.7% |
(1.5%) |
|
Return on Average Equity |
(19.0%) |
0.5% |
19.5% |
|
Return on Average Assets |
(2.9%) |
0.1% |
3.0% |
|
Income Statement |
Q3'2021 |
Q3'2022 |
y/y change |
|
Net Interest Income |
1.4 |
1.6 |
13.9% |
|
Net non-Interest Income |
0.5 |
0.8 |
66.1% |
|
Total Operating income |
1.8 |
2.3 |
26.8% |
|
Loan Loss provision |
(0.2) |
(0.1) |
(12.8%) |
|
Total Operating expenses |
(2.4) |
(2.2) |
(4.7%) |
|
Profit before tax |
(0.5) |
0.1 |
114.0% |
|
Profit after tax |
(0.6) |
0.1 |
110.8% |
|
Core EPS |
(1.5) |
0.2 |
110.8% |
|
Income Statement Ratios |
Q3'2021 |
Q3'2022 |
y/y change |
|
Yield from interest-earning assets |
8.6% |
9.7% |
1.1% |
|
Cost of funding |
4.6% |
4.9% |
0.3% |
|
Net Interest Spread |
4.1% |
4.8% |
0.7% |
|
Net Interest Margin |
3.9% |
4.7% |
0.8% |
|
Cost of Risk |
9.3% |
6.4% |
(2.9%) |
|
Net Interest Income as % of operating income |
75.3% |
67.6% |
(7.7%) |
|
Non-Funded Income as a % of operating income |
24.7% |
32.4% |
7.7% |
|
Cost to Income Ratio |
128.6% |
96.7% |
(31.9%) |
|
Cost to Income (Without LLPs) |
119.4% |
90.3% |
(29.1%) |
|
Capital Adequacy Ratios |
Q3'2021 |
Q3'2022 |
y/y change |
|
Core Capital/Total Liabilities |
9.7% |
7.8% |
(1.9%) |
|
Minimum Statutory ratio |
8.0% |
8.0% |
|
|
Excess |
1.7% |
(0.2%) |
(1.9%) |
|
Core Capital/Total Risk Weighted Assets |
9.5% |
8.2% |
(1.3%) |
|
Minimum Statutory ratio |
10.5% |
10.5% |
|
|
Excess |
(1.0%) |
(2.3%) |
(1.3%) |
|
Total Capital/Total Risk Weighted Assets |
13.3% |
12.2% |
(1.1%) |
|
Minimum Statutory ratio |
14.5% |
14.5% |
|
|
Excess |
(1.2%) |
(2.3%) |
(1.1%) |
|
Liquidity Ratio |
22.5% |
23.5% |
1.0% |
|
Minimum Statutory ratio |
20.0% |
20.0% |
|
|
Excess |
2.5% |
3.5% |
1.0% |
|
Adjusted core capital/ total deposit liabilities |
9.9% |
7.9% |
(2.0%) |
|
Adjusted core capital/ total risk weighted assets |
9.6% |
8.3% |
(1.3%) |
|
Adjusted total capital/ total risk weighted assets |
13.4% |
12.3% |
(1.1%) |
Key take-outs from the earnings release include;
- Earnings Growth: Core earnings per share rose by 110.8% to Kshs 0.2, from a loss of Kshs 1.5 in Q3’2021, higher than our expectations of a 108.8% increase to Kshs 0.1, with the variance stemming from the 26.8% increase in total operating income, which was higher than our projection of a 17.0% increase. The performance was mainly driven by the 26.8% growth in total operating income to Kshs 2.3 bn, from Kshs 1.8 bn in Q3’2021, coupled with a 4.7% decline in total operating expenses to Kshs 2.2 bn, from Kshs 2.4 bn in Q3’2021,
- Improved Asset Quality - The group’s asset quality improved significantly, with the NPL ratio improving to 20.3% in Q3’2022, from 22.0% in Q3’2021, attributable to the 5.9% decline in gross non-performing loans to Kshs 8.5 bn, from Kshs 9.0 bn in Q3’2021, coupled with 2.3% growth in Gross loans during the quarter. The asset quality improvement was driven by the easing credit risk in the Real Estate sector with gross Non-Performing Loans in Real Estate declining by 4.7% to Kshs 75.6 bn in Q3’2022, from Kshs 79.4 bn at the end Q2’2022. However, on a q/q basis, HF Group’s Asset quality deteriorated by 0.2% points to 20.3%, from 20.1% recorded in Q2’2022, and,
- Improving Efficiency – Cost to Income Ratio (CIR) improved by 31.9% points to 96.7%, from 128.6% in Q3’2021, attributable to the 26.8% increase in total operating income to Kshs 2.3 bn in Q3’2022, from Kshs 1.8 bn in Q3’2021, coupled with the 4.7% decline in total operating expenses to Kshs 1.2 bn in Q3’2022, from Kshs 2.4 bn recorded in Q3’2021. Key to note, this is the third consecutive quarter that HF Group’s total operating expenses have been lower than its total operating income, evidenced by a Cost to Income ratio of below 0%. However, the ratio is still high compared to the listed banking sector average, which stood at 60.6% as of Q3’2022,
For a comprehensive analysis, please see our HF Group’s Q3’2022 Earnings Note
Asset Quality
The table below is a summary of the asset quality for the listed banks:
|
Q3'2021 NPL Ratio** |
Q3'2022 NPL Ratio* |
Q3'2021 NPL Coverage** |
Q3'2022 NPL Coverage* |
% point change in NPL Ratio |
% point change in NPL Coverage |
|
|
HF Group |
22.0% |
20.3% |
68.9% |
70.9% |
(1.7%) |
2.0% |
|
KCB Group |
13.7% |
17.8% |
63.4% |
52.8% |
4.1% |
(10.6%) |
|
Standard Chartered Bank Kenya |
15.3% |
15.4% |
82.8% |
82.4% |
0.1% |
(0.4%) |
|
Co-operative Bank of Kenya |
14.6% |
14.0% |
65.5% |
69.3% |
(0.6%) |
3.8% |
|
NCBA Group |
17.0% |
12.7% |
70.2% |
65.3% |
(4.3%) |
(4.9%) |
|
Diamond Trust Bank |
11.9% |
12.7% |
40.0% |
45.2% |
0.8% |
5.2% |
|
Stanbic Bank |
11.5% |
10.1% |
54.9% |
63.4% |
(1.4%) |
8.5% |
|
Equity Group |
9.5% |
9.5% |
60.6% |
63.0% |
- |
2.4% |
|
I&M Holdings |
10.2% |
9.5% |
70.6% |
75.4% |
(0.7%) |
4.8% |
|
ABSA Bank Kenya |
8.1% |
6.6% |
74.5% |
80.0% |
(1.5%) |
5.5% |
|
Mkt Weighted Average |
12.2% |
12.3% |
65.6% |
65.6% |
0.1% |
(0.0%) |
|
*Market cap weighted as at 02/12/2022 |
||||||
|
**Market cap weighted as at 10/12/2021 |
||||||
Key take-outs from the table include;
- Asset quality for the listed banks deteriorated during the period, with the weighted average NPL ratio increasing by 0.1% points to a market cap weighted average of 12.3%, from an average of 12.2% in Q3’2021. This marginal deterioration in the asset quality was driven by deterioration in KCB’s NPL ratio to 17.8% in Q3’2022 from 14.0% in Q3’2021, following reclassification of 9 large accounts as NPLs in H1’2022 and,
- NPL Coverage for the listed banks remained unchanged at a market cap weighted average of 65.6% in Q3’2022, similar to what was recorded in Q3’2021, mainly attributable to increased NPL coverage of ABSA, Diamond Trust Bank, and Stanbic Bank offsetting the reduced NPL coverage by KCB Group and NCBA Group
Summary performance
The table below highlights the performance of the listed banks, showing the performance using several metrics, and the key take-outs of the performance;
|
Bank |
Core EPS Growth |
Interest Income Growth |
Interest Expense Growth |
Net Interest Income Growth |
Net Interest Margin |
Non-Funded Income Growth |
NFI to Total Operating Income |
Growth in Total Fees & Commissions |
Deposit Growth |
Growth in Government Securities |
Loan to Deposit Ratio |
Loan Growth |
Return on Average Equity |
|
HF |
110.8% |
6.8% |
0.7% |
13.9% |
4.7% |
66.1% |
32.4% |
(3.6%) |
3.5% |
51.2% |
90.7% |
1.7% |
0.5% |
|
NCBA |
96.2% |
13.3% |
10.8% |
15.1% |
6.0% |
40.1% |
49.2% |
5.2% |
3.2% |
9.1% |
57.6% |
11.7% |
21.2% |
|
Co-op |
47.0% |
10.5% |
7.2% |
11.7% |
8.2% |
28.3% |
38.6% |
31.7% |
4.9% |
(5.7%) |
77.6% |
9.4% |
22.5% |
|
SCBK |
37.1% |
4.1% |
(12.6%) |
7.3% |
6.3% |
16.1% |
35.7% |
(13.4%) |
10.7% |
13.2% |
47.6% |
3.3% |
21.0% |
|
Stanbic |
36.8% |
3.1% |
19.2% |
26.8% |
5.6% |
37.5% |
44.6% |
8.1% |
25.6% |
38.3% |
88.6% |
34.1% |
25.1% |
|
ABSA |
30.1% |
24.7% |
22.4% |
25.3% |
7.6% |
16.4% |
30.4% |
(1.2%) |
4.6% |
10.5% |
103.0% |
26.4% |
23.2% |
|
Equity |
27.9% |
25.6% |
31.3% |
23.6% |
7.3% |
32.0% |
41.4% |
28.6% |
15.1% |
(0.1%) |
66.9% |
20.6% |
31.3% |
|
I&M |
25.1% |
17.3% |
20.0% |
15.6% |
6.6% |
43.0% |
35.4% |
26.0% |
6.7% |
(2.6%) |
75.1% |
11.4% |
13.9% |
|
KCB |
21.4% |
13.6% |
28.4% |
9.1% |
8.1% |
30.2% |
33.2% |
17.3% |
7.4% |
6.9% |
80.1% |
16.4% |
22.6% |
|
DTB |
21.1% |
15.4% |
17.2% |
43.5% |
5.7% |
43.5% |
29.0% |
24.5% |
11.1% |
17.4% |
67.7% |
18.5% |
8.0% |
|
Q3'22 Mkt Weighted Average* |
36.3% |
16.4% |
19.7% |
17.6% |
7.2% |
30.1% |
38.1% |
16.3% |
10.1% |
6.5% |
73.7% |
17.1% |
24.2% |
|
Q3'21 Mkt Weighted Average** |
102.0% |
15.9% |
14.9% |
16.9% |
7.3% |
14.3% |
35.2% |
11.4% |
14.3% |
11.7% |
69.7% |
12.4% |
18.7% |
|
*Market cap weighted as at 02/12/2022 |
|||||||||||||
|
**Market cap weighted as at 10/12/2021 |
|||||||||||||
Key take-outs from the table include:
- The listed banks recorded a 36.3% weighted average growth in core Earnings per Share (EPS), compared to a weighted average increase of 102.0% in Q3’2021,
- The Banks recorded a weighted average deposit growth of 10.1%, slower than the 14.3% growth recorded in Q3’2021, an indication of reduced investment risk in the business environment,
- Interest income grew by 16.4%, compared from a growth of 15.9% recorded in Q3’2021, with Net Interest Margin (NIM) standing at 7.2%, 0.1% points lower than the 7.3% recorded in Q3’2021, and,
- Non-Funded Income grew by 30.1%, compared to the 14.3% growth recorded in Q3’2021.
We will be releasing our banking report on 11th December 2022.
Universe of coverage:
|
Company |
Price as at 25/11/2022 |
Price as at 02/12/2022 |
w/w change |
m/m change |
YTD Change |
Year Open 2022 |
Target Price* |
Dividend Yield |
Upside/ Downside** |
P/TBv Multiple |
Recommendation |
|
|
Jubilee Holdings |
200.0 |
197.5 |
(1.3%) |
(13.0%) |
(37.6%) |
316.8 |
305.9 |
0.5% |
55.4% |
0.4x |
Buy |
|
|
KCB Group*** |
37.6 |
37.8 |
0.4% |
0.9% |
(17.1%) |
45.6 |
53.5 |
2.6% |
44.4% |
0.6x |
Buy |
|
|
Liberty Holdings |
4.8 |
4.7 |
(2.3%) |
(14.8%) |
(33.4%) |
7.1 |
6.8 |
0.0% |
43.6% |
0.4x |
Buy |
|
|
Equity Group*** |
46.0 |
45.1 |
(2.0%) |
(2.2%) |
(14.6%) |
52.8 |
59.7 |
6.7% |
39.1% |
1.1x |
Buy |
|
|
Kenya Reinsurance |
1.9 |
1.9 |
0.5% |
(9.8%) |
(17.9%) |
2.3 |
2.5 |
5.3% |
38.8% |
0.2x |
Buy |
|
|
Co-op Bank*** |
12.5 |
12.1 |
(3.2%) |
1.7% |
(7.3%) |
13.0 |
15.6 |
8.3% |
37.8% |
0.7x |
Buy |
|
|
Britam |
5.5 |
5.3 |
(4.0%) |
(3.9%) |
(29.9%) |
7.6 |
7.1 |
0.0% |
34.3% |
0.9x |
Buy |
|
|
Sanlam |
8.8 |
9.0 |
2.7% |
5.6% |
(22.1%) |
11.6 |
11.9 |
0.0% |
32.3% |
0.9x |
Buy |
|
|
I&M Group*** |
17.0 |
16.8 |
(1.5%) |
0.0% |
(21.7%) |
21.4 |
20.5 |
9.0% |
31.6% |
0.4x |
Buy |
|
|
Diamond Trust Bank*** |
47.0 |
48.0 |
2.1% |
2.0% |
(19.3%) |
59.5 |
59.5 |
6.3% |
30.2% |
0.2x |
Buy |
|
|
ABSA Bank*** |
11.7 |
11.8 |
1.3% |
3.6% |
0.4% |
11.8 |
14.9 |
1.7% |
28.0% |
1.0x |
Buy |
|
|
CIC Group |
1.9 |
1.8 |
(4.7%) |
(3.5%) |
(16.1%) |
2.2 |
2.3 |
0.0% |
27.5% |
0.7x |
Buy |
|
|
NCBA*** |
32.9 |
33.0 |
0.5% |
5.4% |
29.7% |
25.5 |
35.2 |
6.1% |
12.6% |
0.8x |
Accumulate |
|
|
Stanbic Holdings |
95.0 |
98.0 |
3.2% |
(2.9%) |
12.6% |
87.0 |
99.9 |
9.2% |
11.1% |
0.7x |
Accumulate |
|
|
Standard Chartered*** |
143.0 |
146.3 |
2.3% |
4.3% |
12.5% |
130.0 |
155.0 |
4.1% |
10.1% |
0.9x |
Accumulate |
|
|
HF Group |
3.2 |
3.4 |
4.0% |
6.6% |
(11.3%) |
3.8 |
3.5 |
0.0% |
3.9% |
0.2x |
Lighten |
|
|
Target Price as per Cytonn Analyst estimates **Upside/ (Downside) is adjusted for Dividend Yield ***For Disclosure, these are stocks in which Cytonn and/or its affiliates are invested in |
||||||||||||
We are “Neutral” on the Equities markets in the short term due to the current adverse operating environment and huge foreign investor outflows, and, “Bullish” in the long term due to current cheap valuations and expected global and local economic recovery.
With the market currently trading at a discount to its future growth (PEG Ratio at 0.9x), we believe that investors should reposition towards value stocks with strong earnings growth and that are trading at discounts to their intrinsic value. We expect the current high foreign investors sell-offs to continue weighing down the economic outlook in the short term.
- Industry Report
During the week, the Central Bank of Kenya (CBK) released the Quarterly Economic Review Q3’2022, a report highlighting the status and performance of Kenya’s economy. The following were the key take outs from the report, with regards to the Real Estate and related sectors;
- The y/y gross loans advanced to the Real Estate sector increased by 0.9% to Kshs 467.0 bn in Q3’2022, from Kshs 463.0 bn in Q3’2021. The advanced loans also represented a 0.2% q/q increase from Kshs 466.0 bn realized in Q2’2022. The increase was mainly on the back of increased construction activities in select Real Estate sectors such as the mixed use and residential sectors, further fuelled by government’s drive to provide affordable housing to Kenyans,
- The gross loans advanced to the Hospitality sector increased by 0.9% to Kshs 114.0 bn in Q3’2022, from Kshs 113.0 bn in Q2’2022. This was attributed to increased need for operational capital in the sector driven by; i) reopening of hotels and facilities owing to continued recovery of the sector which led to an increase in hotel bed occupancies, ii) aggressive marketing initiatives both locally and internationally by industry players through strategies such as the annual Magical Kenya Travel Expo, and, iii) completion of acquisitions and mergers amid expansionary efforts by players seeking market dominance in the sector,
- Gross loans advanced to the Building and Construction sector increased by 0.7% to Kshs 143.0 bn in Q3’2022, from Kshs 142.0 bn in Q2’2022. This also represented a 16.3% y/y increase from Kshs 123.0 bn realized in Q3’2021. The growth was mainly driven by continuous construction activities particularly in the housing and infrastructure sectors, coupled with the increased construction costs necessitating the need for more funding, and,
- The Gross Non-Performing Loans in the Real Estate sector decreased by 4.8% to Kshs 75.6 bn in Q3’2022, translating to a 16.2% non-performing loans ratio, from Kshs 79.4 bn recorded in Q2’2022. This was attributed to increased Real Estate loan repayments within the period driven by; i) increased business activity during the period coupled with slight reduction in fuel prices that improved the financial position of borrowers, ii) restructuring of non-performing loans through private treaties by lenders and borrowers for short selling of properties to recoup amounts, and, iii) writing-off bad debts that lenders deemed irredeemable. However, on a y/y basis, the performance represented a 9.2% increase from Kshs 69.2 bn realized in Q3’2021, attributed to increased Real Estate loan default rates amidst increased inflation rate of goods and services.
The graph below shows the total Real Estate non-performing loans against the total loans advanced to the sector from Q1’2019 to Q3’2022;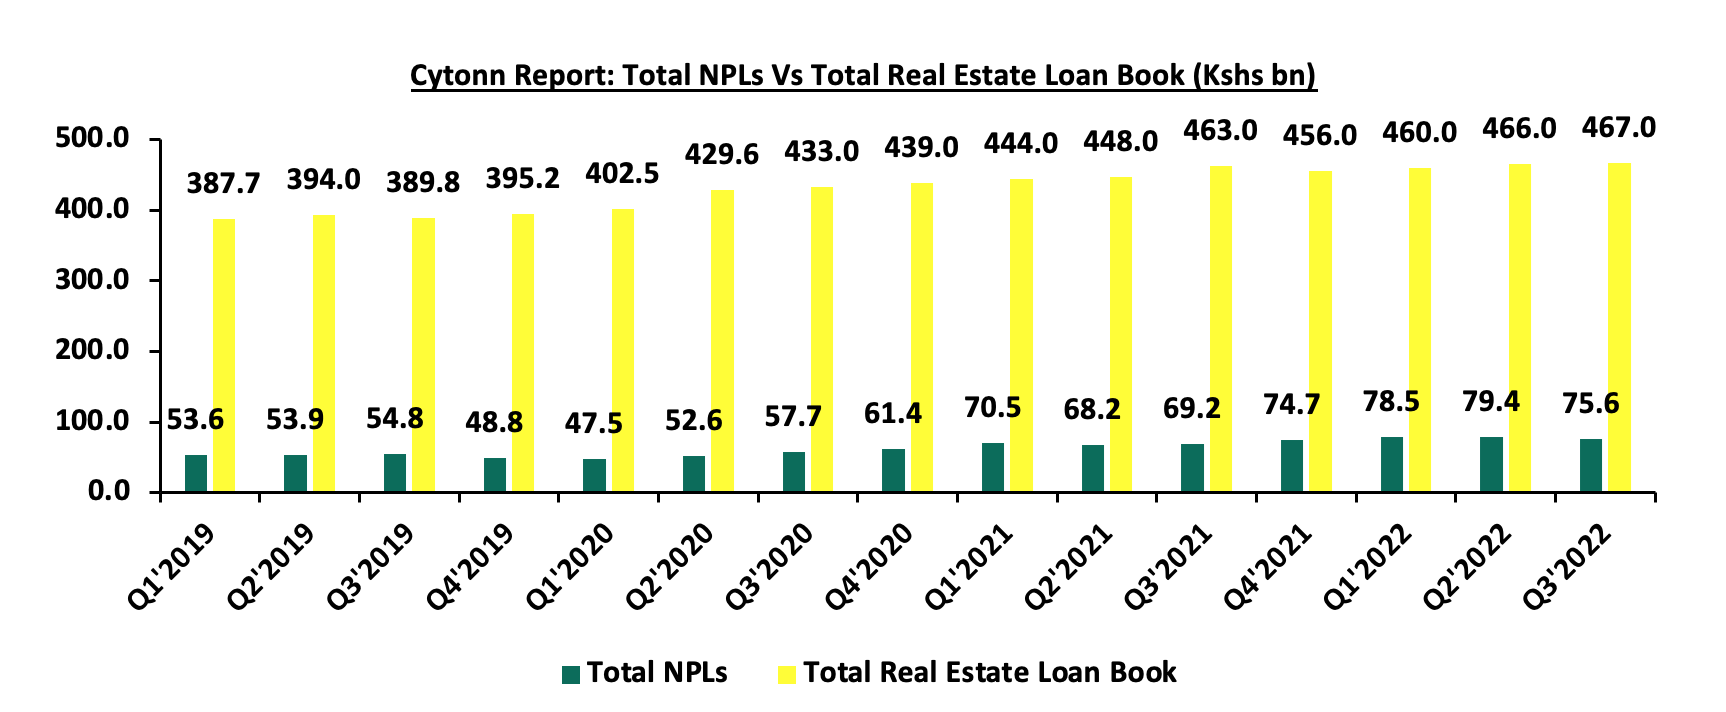
Source: Central Bank of Kenya (CBK)
Other industry reports released during the month include:
|
Cytonn Report: Real Estate November 2022 Industry Reports summary |
|||
|
# |
Theme |
Report |
Key Take-outs |
|
1 |
General Real Estate |
Prime Global Cities Index Q3’2022 Report by Knight Frank |
· The average selling prices for houses in the sampled prime cities globally recorded a capital appreciation of 6.6% q/q and 6.1% y/y, and, · Nairobi being the only ranked African city came in at position 29, 4 positions higher from Q2’2022 where it was ranked position 33 out of the 45 countries, with a 2.9% y/y change, and a 0.5% q/q change in residential prices. For more information, see our Cytonn Weekly #45/2022. |
|
2 |
Residential Sector |
House Price Index Q3’2022 Report by Hass Consult |
· The average q/q selling prices for houses increased by 0.8% in Q3’2022 compared to a 0.2% increase in Q2’2022, and, · The overall asking rents of housing units in the NMA slightly decreased by 0.2% q/q and increased by 2.1% y/y, compared to a 0.1% q/q increase and 3.5% y/y growth recorded in Q3’2021. For more information, see our Cytonn Weekly #45/2022. |
|
3 |
Land Sector |
Land Price Index Q3’2022 Report by Hass Consult |
· The average q/q and y/y selling prices for land in the Nairobi suburbs depreciated by 0.8% and 0.1% respectively, and, · The average q/q and y/y selling prices for land in the satellite towns of Nairobi increased by 1.6% and 9.5%, respectively, fuelled by their affordability. For more information, see our Cytonn Weekly #45/2022. |
We expect Kenya’s Real Estate sector performance to be driven by; i) continued focus by the government to undertake Real Estate housing projects which will increase activity in the residential sector, ii) reopening of hotels and facilities on the back of increased visitor arrivals, which has increased investor confidence thereby cushioning the hospitality sector, and, iii) ongoing initiation and completion of infrastructural developments which is geared to open up areas for investment thereby increasing property transactions. However, the slow growth in the loans advanced to the Real Estate sector indicates a funding challenge caused by insufficient access to credit facilities in the sector, as lenders avert risk of default. In spite of this, the slight increase in loan repayments as evidenced by the decline in non-performing loans in the Real Estate sector is expected to boost confidence to financing institutions to increase lending to the sector, thereby boosting activity.
- Residential Sector
Notable highlights during the month include;
- The national government, through the Permanent Secretary for State Department for Housing and Urban Development, Charles Hinga, announced plans to commence the construction of 42,000 affordable housing units within the next two months. The projects will be developed in; Makongeni, Starehe, and Shauri Moyo in Nairobi County, Ruiru in Kiambu County, and, Mavoko in Machakos County. For more information, see Cytonn Weekly #47/2022,
- Shelter Afrique, a Pan-African development financier based in Nairobi’s Upperhill District approved an additional 5-year corporate loan worth Kshs 1.6 bn towards Nigeria’s Mixta Real Estate Plc, to finance the construction of housing projects in Cote d’Ivoire, Senegal and Morocco. For more information, see Cytonn Weekly #47/2022,
- The County Government of Nakuru announced plans to complete the construction of 605 affordable housing units in Bondeni Estate, Nakuru County by December 2023. For more information, see Cytonn Weekly #45/2022, and,
- Student housing developer Acorn Holdings received Kshs 1.8 bn from the sale of Qwetu Aberdare Heights I hostel located in Ruaraka. With the funds from the sale, Acorn settled part of the debt worth Kshs 800.2 mn to investors, thereby bringing the value of its outstanding bonds down to Kshs 2.6 bn. For more information, see Cytonn Weekly #45/2022.
- Retail Sector
Notable highlights during the month include;
- Local retailer Naivas Supermarket opened a new outlet at Ruai, opposite Ruai Market, bringing the total number of operating outlets to 89. For more information, see Cytonn Weekly #46/2022, and,
- Carrefour Supermarket, a French based retail chain opened a new store at Comet House along Monrovia Street, bringing the total number of operating outlets to 19. For more information, see Cytonn Weekly #45/2022.
- Hospitality Sector
During the month, Global hospitality chain Hilton Hotel, announced plans to open a new hotel in Westlands dubbed Kwetu Nairobi in February 2023. For more information, see Cytonn Weekly #46/2022.
- Mixed Use Developments (MUDs)
During the month, Mi Vida Homes announced plans to begin the construction of two projects at Garden City in April 2022; the 2nd phase of their mid-market apartments dubbed Amaiya, and, affordable housing units dubbed 237 Garden City. For more information, see Cytonn Weekly #45/2022.
- Infrastructure
During the month, African Infrastructure Investment Managers (AIIM), one of Africa’s leading infrastructure private equity managers, committed Kshs 4.1 bn to Kenya’s Road Annuity Programme for the development of road infrastructure in the country to be done through the AIIM’s pan African AIIF4 Fund. For more information, see Cytonn Weekly #47/2022.
- Statutory Reviews
During the month, Nairobi City Hall issued a notice on the increment of land rates to 0.115% of the current value of undeveloped land in Nairobi County based on the 2019 Draft Valuation roll, from 1st January 2023, in line with the Nairobi City Finance Act 2022. For more information, see Cytonn Weekly #47/2022.
- Real Estate Investment Trusts (REITs)
In the Nairobi Stock Exchange, ILAM Fahari I-REIT closed the week trading at an average price of Kshs 6.5 per share. The performance represented a 2.9% gain from Kshs 6.3 per share recorded the previous week, taking it to a 0.9% Year-to-Date (YTD) gain. However, the performance represented a 67.6% Inception-to-Date (ITD) decline from Kshs 20.0. The graph below shows Fahari I-REIT’s performance from November 2015 to 2nd December 2022;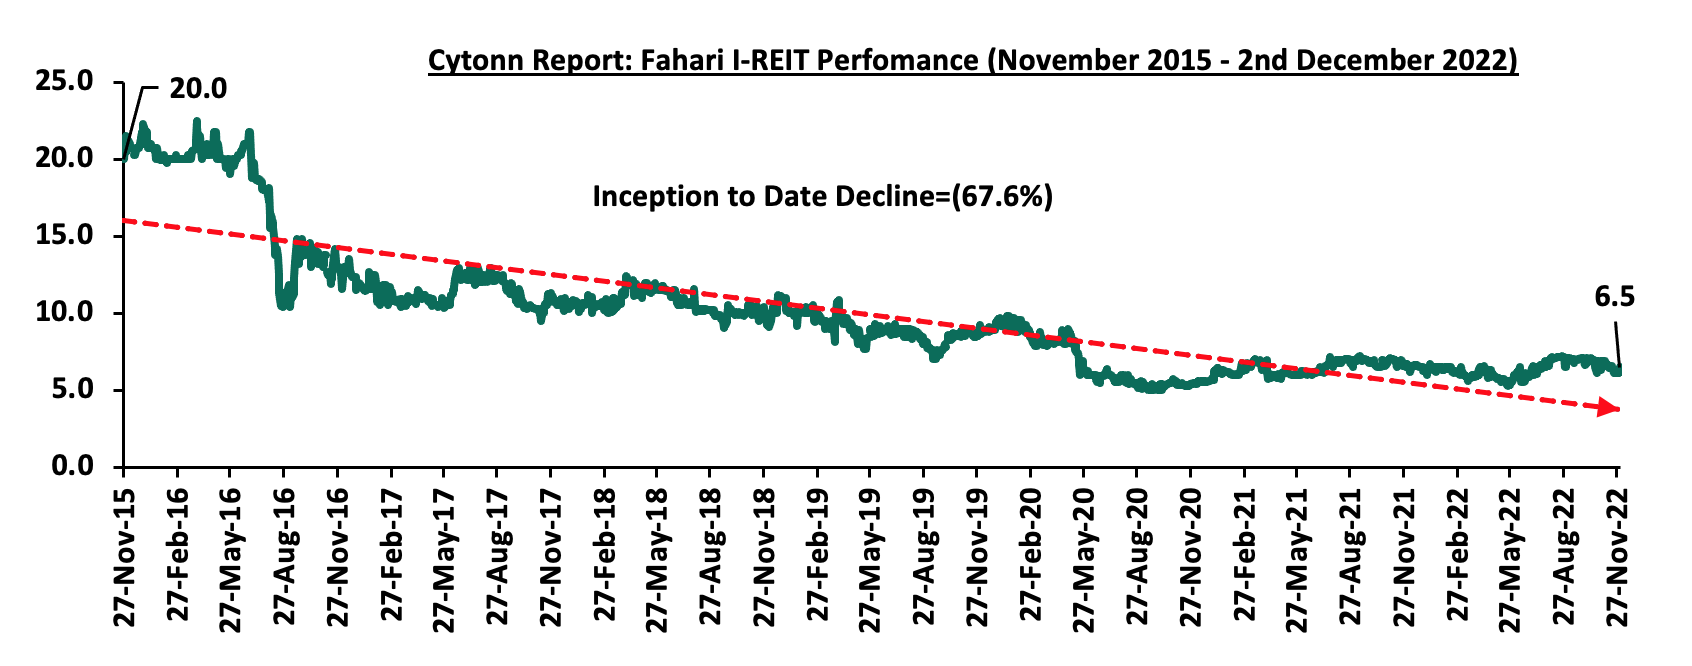
In the Unquoted Securities Platform, Acorn D-REIT and I-REIT closed the week at Kshs 23.8 and Kshs 20.9 per unit, respectively, as at 25th November 2022. The performance represented a 19.2% and 4.4% gain for the D-REIT and I-REIT, respectively, from the Kshs 20.0 inception price. The volumes traded for the D-REIT and I-REIT came in at 5.5 mn and 15.1 mn shares, respectively, with a turnover of Kshs 117.0 mn and Kshs 313.1 mn, respectively, since its Inception in February 2021.
Kenya’s Real Estate sector is expected to be on an upward trajectory driven by; i) continued efforts by the government to provide affordable housing which will boost the performance of the residential sector, ii) rapid expansion drive by both local and international retailers which boosts the performance of the retail sector, iii) reopening and expansion of the hospitality sector on the back of the recovery of economy, coupled with the improved investor confidence in the sector, iv) high investor appetite for MUDs owing to their convenience, and, v) efforts to improve infrastructure across the country which will open up areas for investment. However, the performance of the Real Estate sector is expected to be weighed down by; i) rising construction costs amid inflationary pressures in the economy, ii) existing oversupply of physical spaces in select sectors, and, iii) low investor appetite in listed Real Estate due to high investment amounts.
Disclaimer: The views expressed in this publication are those of the writers where particulars are not warranted. This publication, which is in compliance with Section 2 of the Capital Markets Authority Act Cap 485A, is meant for general information only and is not a warranty, representation, advice or solicitation of any nature. Readers are advised in all circumstances to seek the advice of a registered investment advisor

- Talk to us
- Kenya
- P.O Box 20695 - 00200, Nairobi, Kenya
- Cell +254709101200
- Tel +254709101200
- WhatsApp +254741676635
- United States
- +254709101200
- DOWNLOAD OUR APP
-


- Kenya
- 8th Floor, Pinetree Plaza, Kaburu Drive, Ngong Road, Nairobi, Kenya
- USA
- Suite 1150, 1775 Eye Street NW, USA, Washington DC 20006, USA
- Investments
- High Yield
- Private Equity
- Real Estate
- Real Estate
- RiverRun Estates
- Cytonn Towers
- The Ridge
- Taraji Heights
- The Alma