Cytonn Monthly October 2019
By Research Team, Nov 3, 2019
Executive Summary
Fixed Income
During the month of October, T-bill auctions recorded an undersubscription, with the overall rate coming in at 84.5%, compared to 105.4% recorded in the month of September 2019. The subscription rates for the 91-day came in at 122.0%, which was lower than the 128.6% recorded in September. The subscription rates for the 182-day and 364-day came in at 27.1% and 195.5%, higher than the 23.5% and 127.3%, recorded in September, respectively. The yields on the 91-day paper increased by 0.1% points to 6.4%, from 6.3%, while the yield on the 182-day paper and 364-day paper remained stable at 7.2% and 9.8%, respectively in October. The y/y inflation for the month of October increased to 4.95%, from 3.8% recorded in September mainly due to a 0.5% increase in the food and non-alcoholic drinks’ index, due to an increase in prices of significant food items including maize grain-loose, maize flour-sifted and tomatoes, which increased by 5.8%, 4.6% and 4.4%, respectively. During the week, World Bank Group released the Kenya Economic Update October 2019. According to the report, the country’s total debt stock rose by 16.0% to Kshs 5.8 tn in June 2019, from Kshs 5.0 tn in the year to June 2018, with the domestic debt accounting for 48.0% of the total debt (Kshs 2.8 tn) while foreign debt amounted to 52.0% (Kshs 3.0 tn);
Equities
During the month of October, the equities market was on an upward trend, with NASI, NSE 20, and NSE 25 increasing by 9.7%, 8.8%, and 13.0%, respectively. The increase recorded in NASI was driven by gains in large-cap bank stocks such as NCBA Group, Equity Group, and KCB Group, which gained by 30.7%, 24.2%, and 23.2%, respectively, owing to expectations of the repeal of the interest rate cap. During the week, the Capital Markets Authority released the Capital Markets Soundness Report (CMSR) for Q3’ 2019. This report analyses the Kenyan Capital Markets industry focusing on the various policy issues, which may be a promoter or threat to its growth. For the equities section they discuss elements such as NSE 20 and NASI indexes volatility, turnover ratio, foreign investor turnover, net foreign portfolio flow, and market concentration. During the month, President Uhuru Kenyatta submitted a memorandum to the Speaker of the National Assembly detailing his refusal to assent to the Finance Bill 2019, and recommending a repeal of the interest rate cap;
Real Estate
During the month, various real estate industry reports were released, namely the Hass Property Sales and Land Index Q3’2019 Reports, the World Bank’s Doing Business Report 2020, and the JLL Spotlight on Africa Q4’2019 Report. In the residential sector, various projects were launched including affordable housing projects for Nyeri County and Nairobi’s Eastlands Regeneration. In the commercial office sector, Kofisi, a co-working spaces provider opened up in Karen, while two local pension schemes announced plans to purchase commercial properties for investment purposes. In the retail sector, various retailers announced expansion plans including Naivas, Java, and Artcaffe, while Botswana-based retailer, Choppies, announced possible plans of exiting the market. In the hospitality scene, South African-based hotel group, City Lodge, launched its final phase of the Two Rivers-based City Lodge Hotel, as various Kenyan Hotels also bagged seven awards at the World Luxury Hotel Awards 2019, in Finland. Finally, in the infrastructure sector, the President of Kenya, H.E Uhuru Kenyatta, launched two major projects in Nairobi, namely the construction of the Jomo Kenyatta International Airport – James Gichuru Express Highway, and the operationalization of the Standard Gauge Railway Phase 2, which connects Nairobi to Naivasha.
- You can now make instant withdrawals from your Cytonn Money Market Fund account, just dial *809#
- Caleb Mugendi, Asst. Head of Investments, was on Metropol TV to discuss rate caps. Watch Caleb here
- David King’oo, Senior Risk and Compliance Associate, was on CNBC to talk about the Illegality of the current tax imposed by the Kenya Revenue Authority (KRA) on second hand cars after the High Court of Mombasa recently declared it illegal. Watch David here
- Phase 1 of The Alma is now 100% sold with early buyers having achieved up to 55% capital appreciation. We are now running a promotion in Phase 2: Buy a unit in Phase 2 with a 15-year payment plan and 0% deposit. For inquiries, please email us on mailto@cytonn.com. The site is open between 8 am - 5 pm, 7-days a week for site visits;
- Cytonn Money Market Fund closed the week at an average yield of 11.0% p.a. To subscribe, just dial *809#;
- For an exclusive tour of Cytonn’s real estate developments, visit: Sharp Investor's Tour and for more information, email us at sales@cytonn.com;
- We continue to hold weekly workshops and site visits on how to build wealth through real estate investments. The weekly workshops and site visits target both investors looking to invest in real estate directly and those interested in high yield investment products to familiarize themselves with how we support our high yields. Watch progress videos and pictures of The Alma, Amara Ridge, and The Ridge;
- We continue to see very strong interest in our weekly Private Wealth Management Training (largely covering financial planning and structured products). The training is at no cost and is open only to pre-screened participants. We also continue to see institutions and investment groups interested in the training for their teams. Cytonn Foundation, under its financial literacy pillar, runs the Wealth Management Training. If interested in our Private Wealth Management Training for your employees or investment group, please get in touch with us through wmt@cytonn.com. To view the Wealth Management Training topics, click here;
- Join us on Saturday 9th November 2019 from 9:00 am to 11:00 am at the Chancery for a detailed, informative and interactive session on REITs. To sign up for this session, click here
- Are you an SME interested in learning about pensions? Join us as we delve into retirement solutions suitable for you and your business at The Chancery, 6th Floor along Valley Road on 14th November from 9:00 am to 11:00 am. To confirm your attendance, kindly RSVP at cytonn.com/pensionstraining
- For recent news about the company, see our news section here;
- We have 10 investment-ready projects, offering attractive development and buyer targeted returns. See further details here: Summary of Investment-Ready Projects
Money Markets, T-Bills & T-Bonds Primary Auction:
During the month of October, T-bill auctions recorded an undersubscription, with the overall rate coming in at 84.5%, compared to 105.4% recorded in the month of September 2019. The subscription rates for the 91-day came in at 122.0%, which was lower than the 128.6% recorded in September. The subscription rates for the 182-day and 364-day came in at 27.1% and 195.5%, higher than the 23.5% and 127.3%, recorded in September, respectively. The yields on the 91-day increased by 0.1% points to 6.4%, from 6.3%, while the yield on the 182-day paper and 364-day paper, recorded no change in the yields remaining stable at 7.2% and 9.8%, respectively in October. The T-bills acceptance rate came in at 71.4% during the month, compared to 67.9% recorded in September, with the government accepting a total of Kshs 57.9 bn of the Kshs 81.1 bn worth of bids received.
The Central Bank remained disciplined in rejecting expensive bids in order to ensure the stability of interest rates.
During the week, T-bills were oversubscribed, with the subscription rate coming in at 114.3%, up from 72.8% the previous week. The oversubscription is partly attributable to favourable liquidity in the money market during the week. The yield on the 91-day, 182-day, and 364-day papers remained unchanged at 6.4%, 7.2% and 9.8%. The acceptance rate dropped to 86.5% from 94.3%, recorded the previous week, with the government accepting Kshs 23.7 bn of the Kshs 27.4 bn bids received.
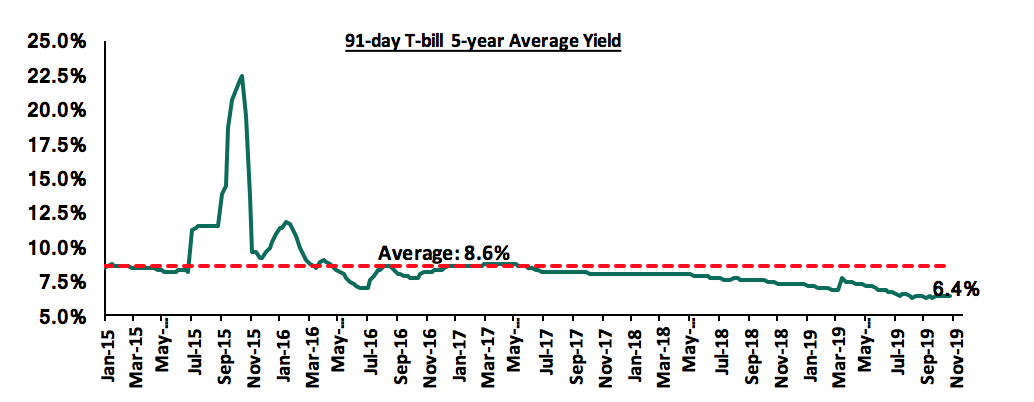
The 91-day T-bill is currently trading at a yield of 6.4%, which is below its 5-year average of 8.6%. The lower yield on the 91-day paper is mainly attributable to the low-interest rate environment that has persisted since the passing of the law capping interest rates.
For the month of October, the National Treasury issued a tax-exempt 16-year Kshs 60.0 bn infrastructure bond (IFB1/2019/16) with market-determined coupon rates for the purpose of financing the infrastructure projects in the FY 2019/20 budget estimates. The bond was oversubscribed as per our expectations due to its tax-free incentive that translates to higher returns, receiving bids totaling Kshs 86.9 bn of the Kshs 60.0 bn on offer, translating to a subscription rate of 144.9%. The weighted average rate of accepted bids was at 12.4% in line with our expectations of 12.3% - 12.5%.
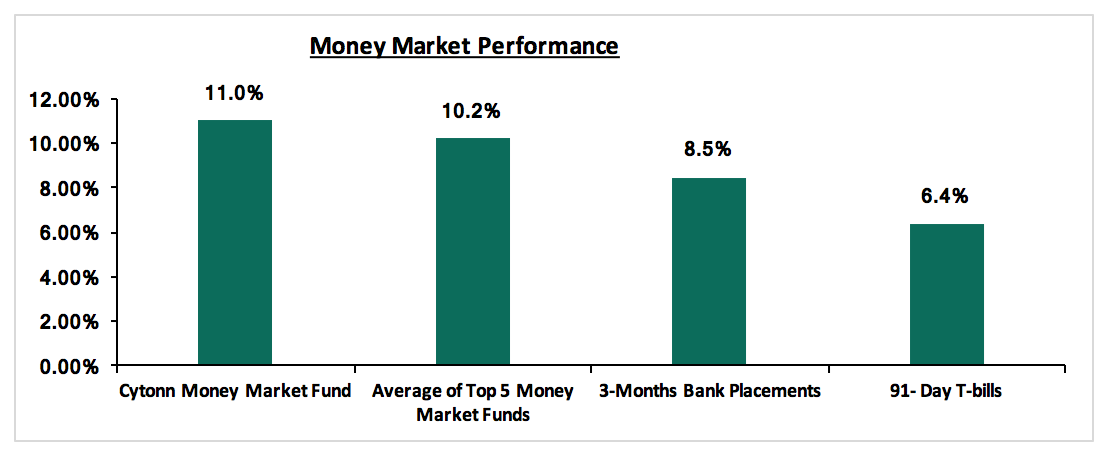
In the money markets, 3-month bank placements ended the week at 8.5% (based on what we have been offered by various banks), the 91-day T-bill came in at 6.4%, while the average of Top 5 Money Market Funds came in at 10.2%, which was a 0.1% increase from 10.1% recorded in the previous week. The Cytonn Money Market Fund closed the week at 11.0%, from 10.9% recorded the previous week.
Secondary Bond Market:
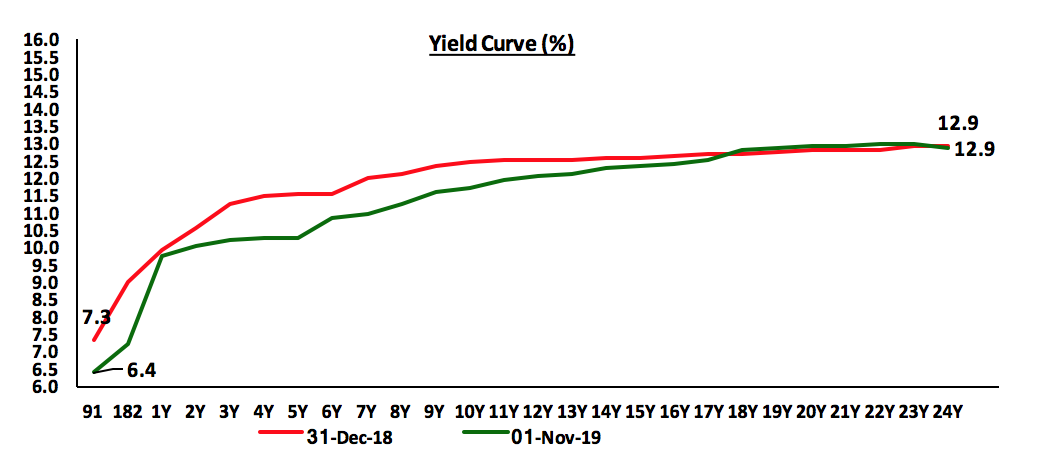
The yields on government securities in the secondary market remained relatively stable during the month of October, as the Central Bank of Kenya continued to reject expensive bids in the primary market. On a YTD basis, government securities on the secondary market have gained with yields declining across the board, which has, in turn, led to price appreciation.
Liquidity:
Liquidity in the money markets remained favourable during the month of October despite the average interbank rate rising to 7.0%, from 6.5% recorded in September, supported by Government open market activities, which offset tax payments. During the week, the average interbank rate dropped to 6.4% from 6.9% recorded the previous week, pointing to increasing liquidity in the money markets. The average interbank volumes rose by 33.5% to Kshs 17.4 bn, from Kshs 13.1 bn recorded the previous week.
Kenya Eurobonds:
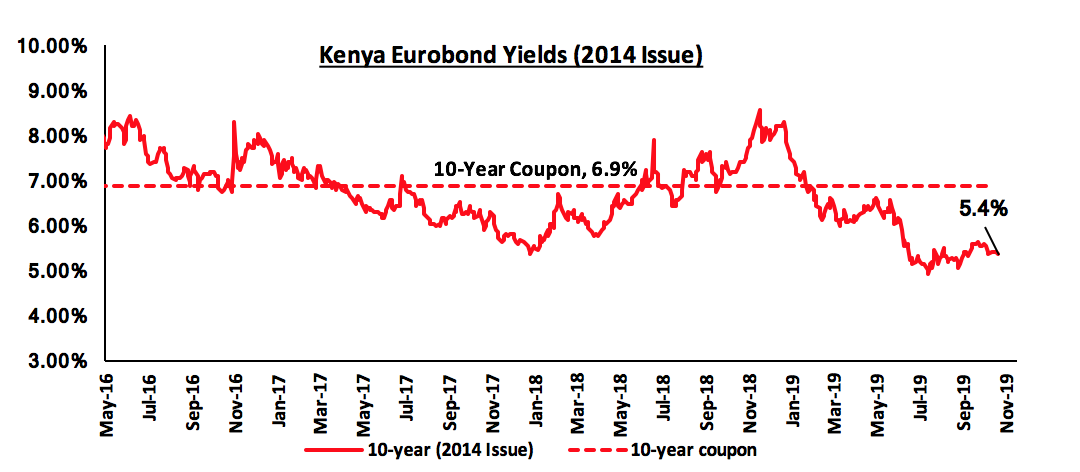
According to Reuters, the yield on the 10-year Eurobond issued in June 2014 decreased by 0.2% points to 5.4% in October, from 5.6% in September 2019. During the week, the yield on the 10-year Eurobond remained stable at 5.4% similar to the previous week.
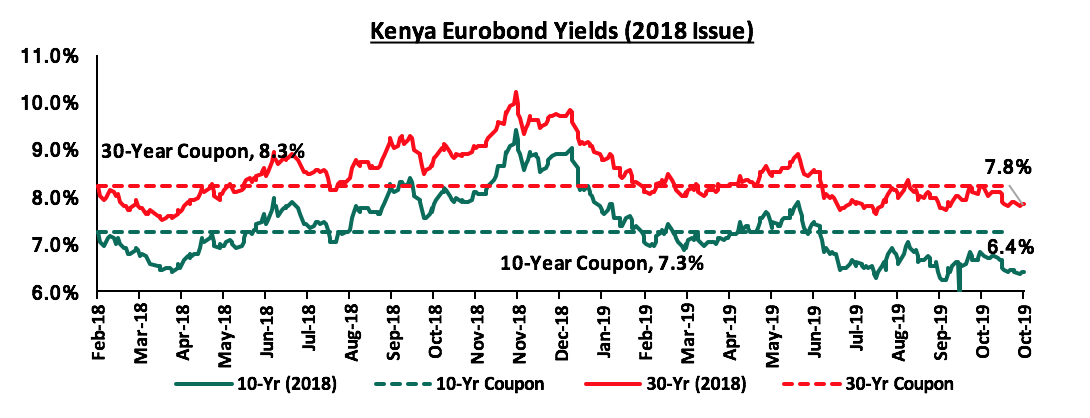
During the month, the yields on the 10-year and 30-year Eurobond issued in February 2018 both declined by 0.3% points to close at 6.4% from 6.7% in September and at 7.8% from 8.1% in September, respectively. During the week, the yield on the 10-year and 30-year Eurobond remained unchanged at 6.4 and 7.8%, respectively.
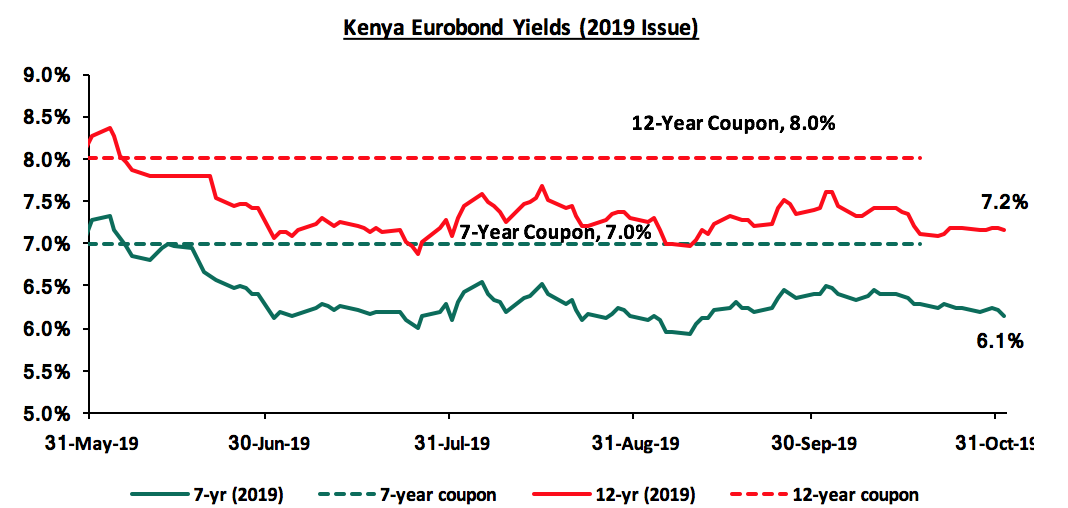
During the month, the yields on the newly issued dual-tranche Eurobond with 7-years declined by 0.2% points to 6.2% from 6.4% in September 2019. The 12-year Eurobond also declined by 0.2% points to 7.2% from 7.4% recorded in September 2019. During the week, the yields on the 7-year Eurobond declined by 0.2% points to 6.1% from 6.3% the previous week, while the 12-year Eurobond remained unchanged at 7.2%.
Kenya Shilling:
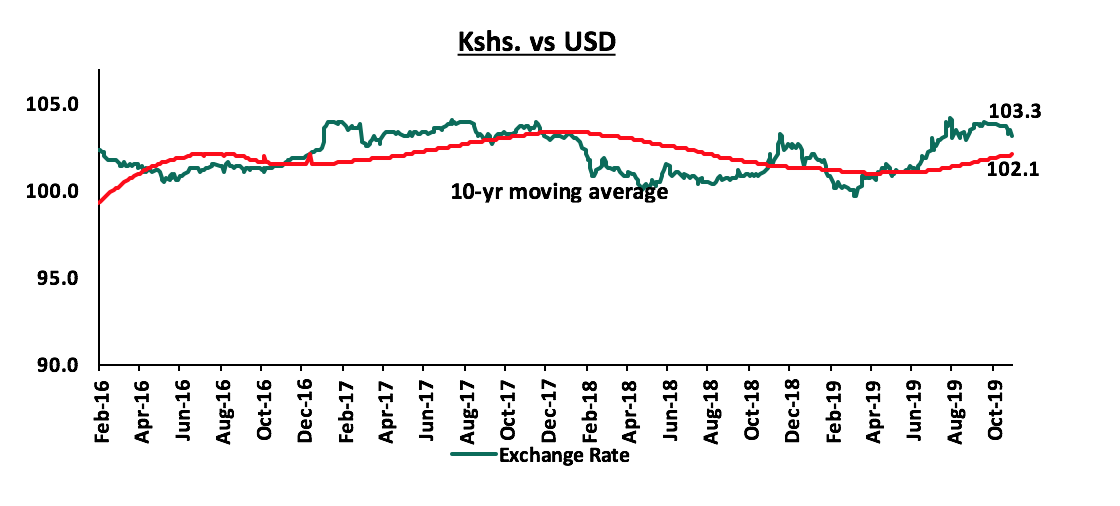
The Kenya Shilling appreciated by 0.7% against the US Dollar during the month of October to Kshs 103.2 from Kshs 103.9 at the end of September, supported by inflows from diaspora remittances and portfolio investors buying government debt. During the week, the Kenya Shilling remained stable against the US Dollar to close at Kshs 103.3, which was similar to the value recorded in the previous week. On a YTD basis, the shilling has depreciated by 1.4% against the US Dollar, in comparison to the 1.3% appreciation in 2018. In our view, the shilling should remain relatively stable against the dollar in the short term, supported by:
- The narrowing of the current account deficit, with preliminary data indicating that Kenya’s current account deficit improved by 11.8% during Q2’2019, coming in at a deficit of Kshs 107.6 bn, from Kshs 122.0 bn in Q2’2018, equivalent to (6.2%) of GDP, from (7.6%) recorded in Q2’2018. This was mainly driven by the narrowing of the country’s merchandise trade deficit by 1.7% and a rise in secondary income (transfers) balance by 5.1%,
- Improving diaspora remittances, which have increased cumulatively by 8.0% in the 12-months to September 2019 to USD 2.8 bn, from USD 2.6 bn recorded in a similar period of review in 2018. The rise is due to:
- Increased uptake of financial products by the diaspora due to financial services firms, particularly banks, targeting the diaspora, and,
- New partnerships between international money remittance providers and local commercial banks making the process more convenient,
- CBK’s supportive activities in the money market, such as repurchase agreements and selling of dollars, and,
- High levels of forex reserves, currently at USD 9.0 bn (equivalent to 5.6-months of import cover), above the statutory requirement of maintaining at least 4.0-months of import cover, and the EAC region’s convergence criteria of 4.5-months of import cover.
Inflation:
|
Major Inflation Changes in the Month of October 2019 |
|||
|
Broad Commodity Group |
Price change m/m (October-19/August-19) |
Price change y/y (October-19/October-18) |
Reason |
|
Food & Non-Alcoholic Beverages |
0.5% |
8.7% |
The m/m increase was due to an increase in prices of commodities such as maize flour- sifted and tomatoes |
|
Transport Cost |
(0.3%) |
2.5% |
The m/m decline was mainly on account of the reduction in pump prices of diesel and petrol by 1.0% and 4.2%, respectively. |
|
Housing, Water, Electricity, Gas and other Fuels |
0.1% |
0.9% |
The m/m increase was mainly as a result of an increase in prices of some cooking fuels following the 0.4% increase in kerosene prices |
|
Overall Inflation |
0.3% |
4.95% |
The m/m increase was due to a 0.5% increase in the food index which has a CPI weight of 36.0% |
The y/y inflation for the month of October increased to 4.95%, from 3.8% recorded in September, which exceeded our projections of an increase to 4.4%-4.8%. Month-on-month inflation also increased by 0.3%, which was attributable to:
- A 0.5% increase in the food and non-alcoholic drinks’ index, due to an increase in prices of significant food items including maize grain-loose, maize flour-sifted and tomatoes which increased by 5.8%, 4.6% and 4.4 %, respectively
- A 0.1% increase in the housing, water, electricity, gas and other fuels index, as a result of an increase in prices of some cooking fuels such as kerosene which increased by 0.4%, and
- A 0.3% decline in the transport index on account of the reduction in
pump prices of diesel and petrol by 1.0% and 4.2%, respectively.
Monthly Highlight:
During the week, World Bank Group released the Kenya Economic Update October 2019. Below are the key take-outs from the report:
- Economic Growth: Kenya’s economic growth is estimated to be 5.8% in 2019 supported by a pickup of the economy in H2’2019, evidenced by (i) the nascent recovery in private sector credit, which grew by 6.3% in August, (ii) positive business sentiment, and (iii) the improved weather conditions expected to boost agricultural activities. However, risks of fiscal slippage and incidences of drought are expected to negatively affect the economy going forward. Externally, spill over effects from ongoing global slowdown could affect the demand.
Below is a table showing average projected GDP growth for Kenya in 2019 with an upward readjustment of the World Bank; noteworthy being that the highest projection is by the Central Bank of Kenya at 6.3%. We shall be updating this table should projections change and shall highlight who had the most accurate projection at the end of the year.
|
Kenya 2019 Annual GDP Growth Outlook |
|||||
|
No. |
Organization |
Q1'2019 |
Q2'2019 |
Q3’2019 |
Q4’2019 |
|
1. |
Central Bank of Kenya |
6.3% |
6.3% |
6.3% |
6.3% |
|
2. |
Euromonitor International |
5.9% |
5.9% |
6.3% |
6.3% |
|
3. |
Citigroup Global Markets |
6.1% |
6.1% |
6.1% |
6.1% |
|
4. |
PNB Paribas |
6.0% |
6.0% |
6.1% |
6.1% |
|
5. |
The National Treasury |
6.2% |
6.2% |
6.0% |
6.0% |
|
6. |
African Development Bank (AfDB) |
6.0% |
6.0% |
6.0% |
6.0% |
|
7. |
UK HSBC |
6.0% |
6.0% |
6.0% |
6.0% |
|
8. |
Cytonn Investments Management Plc |
5.8% |
5.8% |
5.8% |
5.8% |
|
9. |
World Bank* |
5.8% |
5.7% |
5.7% |
5.8% |
|
10. |
Euler Hermes |
5.7% |
5.7% |
5.7% |
5.7% |
|
11. |
International Monetary Fund (IMF) |
6.1% |
5.8% |
5.6% |
5.6% |
|
12. |
Focus Economics |
5.8% |
5.8% |
5.6% |
5.6% |
|
13. |
JPMorgan |
5.7% |
5.7% |
5.6% |
5.6% |
|
14. |
Oxford Economics |
5.6% |
5.6% |
5.6% |
5.6% |
|
|
Average |
5.9% |
5.9% |
5.9% |
5.9% |
*Revised Growth rates for Q4’2019
- Inflation and Monetary Policy: Headline inflation averaged 5.2% as a result of low energy prices, which offset the food inflation in H1’2019. Core inflation decreased in September due to subdued demand pressures. The low inflation levels have been supported by a stable currency,
- Current Account: Current account deficit narrowed to 4.0% of GDP in the year to August, supported by lower imports, diaspora remittance inflows and improved tourism. The current account deficit continues to be financed by borrowings and an increase in foreign reserves,
- Government Debt: The country’s total debt stock rose by 16.0% to Kshs 5.8 tn in June 2019 from Kshs 5.0 tn in the year to June 2018, with the domestic debt accounting for 48.0% of the total debt (2.8 tn) while foreign debt amounted to 52.0% (Kshs 3.0 tn). The country continues to access international markets to refinance its external debt. Some of the activities included a Eurobond issuance of USD 2.1 bn to refinance the payments from the first Eurobond of USD 750.0 mn, with the balance going to budgetary support. Domestic interest payments to tax revenue has increased to 18.2% from 16.3% recorded last year. With 43.0% of the domestic debt expected to mature within a year, the government is expected to face challenges in the rollover of the bonds as a result of low subscription rates, and if the repeal of the interest rate cap is approved, operating in a country with no interest rate caps would reduce lending to the government. The country’s total debt at Kshs 5.8 tn, is 62.3% of GDP, which is above the 50.0% debt to GDP threshold, but below the 70.0% debt to GDP level that signifies a country in debt distress. External debt currently accounts for 52.0% of the total debt stock. Going forward, we expect the debt service obligations to continue to impose fiscal pressures on the country with the need to repay the debt obligations both domestically and externally. The raising of the borrowing ceiling to Kshs 9 tn would drive the country into debt distress levels owing to the country’s current debt position, as highlighted in our Debt Sustainability note.
In conclusion, the macroeconomic environment in Kenya remains stable with low inflation and a manageable current account deficit. However, interest rate caps have reduced the effectiveness of the monetary policy transmission and constrained the operating environment for the banking sector. If the interest rate cap is removed, the potency of the monetary policy will be restored. Despite a reduction in the fiscal deficit from 9.1% of GDP in FY 2016/17 to 7.4% of GDP in FY 2017/18, the fiscal deficit expanded to 7.7% in FY 2018/19 compared to a target deficit of 6.8% of GDP. The fiscal deficit at 0.9% points above the target is due to revenue shortfalls and expenditure pressures.
Rates in the fixed income market have remained relatively stable as the government rejects expensive bids. Despite the rise in net revenue collections in Q1’2019 by 13.1% to Kshs 372.3 bn from Kshs 329.2 bn recorded in a similar period last year, we still don’t expect the government to meet the Kshs 2.1 tn revenue target for FY’2019/2020, creating uncertainty in the interest rate environment as additional borrowing from the domestic market goes to plug the deficit. Putting into consideration the possible repeal of the interest rate cap, we expect improved private sector credit growth in the country, especially access to credit by MSMEs. This will lead to increased competition for bank funds from both the private and public sectors, thereby reducing liquidity in the money market, resulting in upward pressure on interest rates. Owing to this, we will be updating our Fixed Income House View.
Markets Performance
During the month of October, the equities market was on an upward trend, with NASI, NSE 20, and NSE 25 increasing by 9.7%, 8.8%, and 13.0%, respectively. The increase recorded in NASI was driven by gains in large-cap bank stocks such as NCBA Group, Equity Group, KCB Group and Co-operative Bank, which recorded gains of 30.7%, 24.2%, 23.2% and 22.3%, respectively, owing to expectations of the repeal of the interest rate cap. For this week, the market was on an upward trend, with NASI, NSE 20, and NSE 25 increasing by 9.5 %, 9.8%, and 13.2%, respectively, taking their YTD performance to gains/(losses) of 17.0%, (3.5%) and 14.9%, respectively. The improvement in NASI was largely due to gains recorded in large-cap counters such as Co-operative Bank, KCB Group, and NCBA, which recorded gains of 26.4% and 20.8%, and 17.4%, respectively.
Equities turnover increased by 55.3% during the month to USD 157.8 mn, from USD 101.6 mn in September 2019. Foreign investors became net sellers for the month, with a net selling position of USD 14.8 mn, compared to September’s net buying position of USD 6.6 mn. For this week, equities turnover increased by 82.2% to USD 71.1 mn, from USD 39.0 mn the previous week, bringing the year to date (YTD) turnover to USD 1,242.1 mn. Foreign investors remained net sellers for the week, with a net selling position of USD 4.7 mn, a 65.6% increase from last week’s net selling position of USD 2.8 mn.
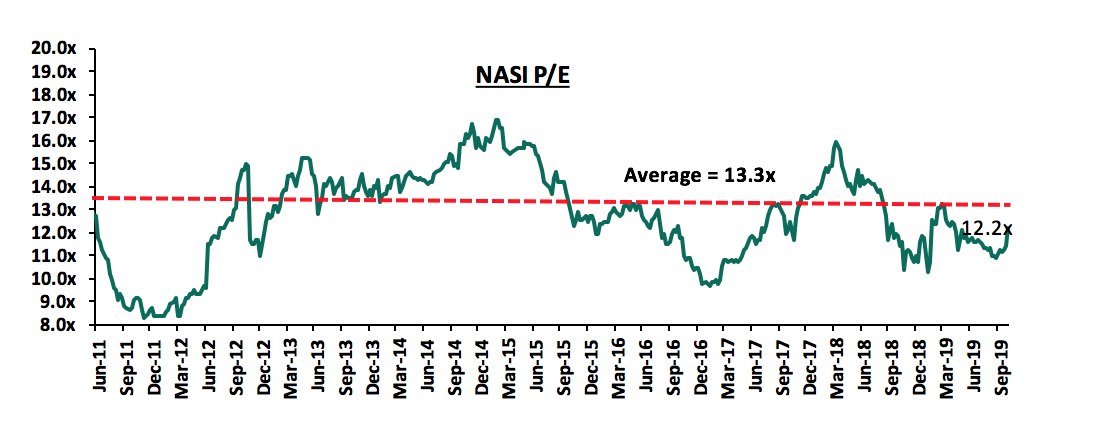
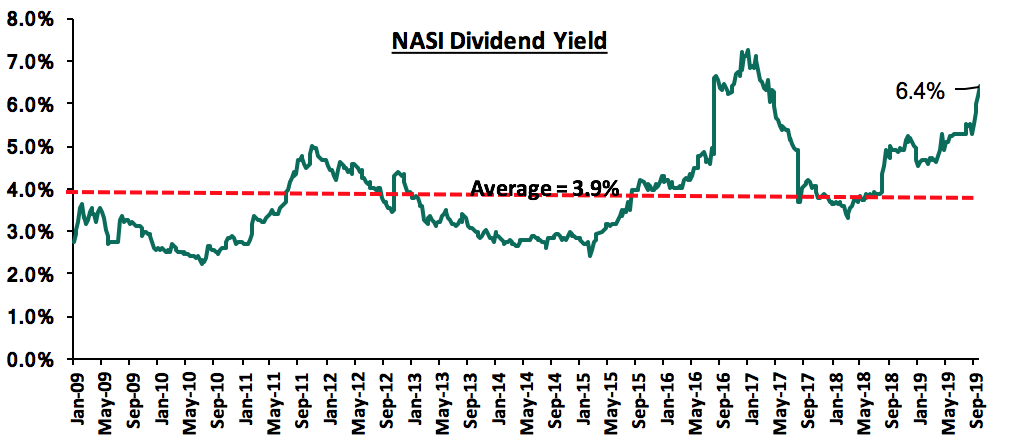
The market is currently trading at a price to earnings ratio (P/E) of 12.2x, 8.3% below the historical average of 13.3x, and a dividend yield of 6.4%, above the historical average of 3.9%. With the market trading at valuations below the historical average, we believe there is value in the market. The current P/E valuation of 12.2x is 25.9% above the most recent trough valuation of 9.7x experienced in the first week of February 2017, and 47.1% above the previous trough valuation of 8.3x experienced in December 2011. The charts below indicate the historical P/E and dividend yields of the market.
Monthly Highlights
During the week, Capital Markets Authority (CMA) released the Capital Markets Soundness Report (CMSR) for Q3’ 2019. This report analyses the Kenyan Capital Markets industry focusing on the various policy issues that may be a promoter or threat to its growth. For the equities section, they discuss elements such as NSE 20 and NASI indexes volatility, turnover ratio, foreign investor turnover, net foreign portfolio flow, and market concentration. These components were used to assess the equity market depth in Kenya.
- Indices Volatility: For the indexes volatility, NSE 20’s index volatility stood at an average of 0.45% in Q3’2019, which is an increase from an average of 0.43% in Q3’2018. On the other hand, NASI’s volatility stood at an average of 0.5% in Q3’2019, a decrease from 0.7% in Q3’2018. While this level of volatility is considered low, as it is less than 10.0%, the CMA still expects it to reduce further with the commencement of trading of financial derivatives such as index futures on NEXT. This is a key accomplishment on the part of CMA as in their soundness report last year they expected to lower the indexes volatility by introducing market makers, derivatives, direct market access and securities lending and borrowing,
- Turnover: In the turnover ratio, the Kenyan equities market stood at 1.4% in Q3’2019, which was an improvement from 0.5% in Q3 2018, showing an increase in trading activity. To improve this further, CMA is developing an operational framework that will support securities lending and borrowing. Correspondingly, the authority intends to engage market stakeholders on formalization of the margin of lending in future. In comparison, the foreign investor turnover as a percentage of total turnover stood at an average of 64.9% in Q3’2019, which shows a slight improvement from the 64.8% as at Q3’2018. While this indicates a medium penetration of foreign investors, CMA intends to reduce this ratio by working on a strategy to on-board more local investors. As well, net foreign portfolio flows showed an inflow of Kshs 262.0 mn in Q3’2019 compared to an outflow of Kshs 6,705.0 mn in Q3’2018. This performance can be attributed to the proposed foreign income tax amnesty allowing individuals to repatriate income, thus attracting diaspora inflows, and
- Market Concentration: During Q3 2019, the top companies by market capitalization proved their dominance in the market as they accounted for an average of 70.8%, which is an increase from 68.0% in Q3’2018. This shows a high concentration which has been maintained both times at above 50.0%. These top companies include Safaricom, Equity Group, KCB Group, EABL and Co-op Bank. This presents limited diversification at the bourse, which poses a risk to the market. To address this, CMA is actively promoting market depth through innovation and product development. As well, if they continue working on the privatization program we can expect an increase in new listings, which could increase liquidity and promote diversification.
In our view, efforts by the government and the CMA to improve the soundness of the capital markets will improve market depth, access to foreign exchange, market transparency and capacity of local investors as assessed in the Absa 2019 Africa Financial Markets Index .
During the month, President Uhuru Kenyatta submitted a memorandum to the Speaker of the National Assembly detailing his refusal to assent to the Finance Bill 2019. The President, instead, recommended a repeal of the interest rate cap. In the memorandum, the President cited that while the purpose of the capping was to address the wide concerns about affordability and availability of credit to Kenyans, the capping of interest rates instead caused unintended consequences that are significant and damaging to the economy and Micro, Small and Medium Enterprises (MSMEs). In the memo, the president highlighted that the re-introduction of Clause 45 of the Bill by the National Assembly would worsen the unintended effects brought about by the cap such as;
- The reduction of credit to the private sector, particularly MSMEs,
- A decline in economic growth,
- The weakening of the effectiveness of a monetary policy,
- The reduction of loan advances by banks,
- The growing number of shylocks and other unregulated lenders in the financial sector, and,
- Problems such as the withdrawal of banks’ lending to specific segments of the market.
For a more detailed analysis, please see Cytonn Weekly #42/2019
Universe of Coverage
|
Banks |
Price at 30/9/2019 |
Price at 31/10/2019 |
Price at 25/10/2019 |
Price at 1/11/2019 |
m/m change |
w/w change |
Target Price |
Upside/ Downside |
P/TBv Multiple |
Recommendation |
|
Sanlam |
18.8 |
17.2 |
17.1 |
16.0 |
(8.5%) |
(6.2%) |
29.0 |
81.3% |
0.8x |
Buy |
|
I&M Holdings |
45.0 |
50.5 |
45.2 |
47.0 |
12.2% |
4.1% |
79.8 |
77.5% |
0.8x |
Buy |
|
Diamond Trust Bank |
114 |
117.75 |
115.0 |
116.0 |
3.3% |
0.9% |
175.6 |
53.7% |
0.6x |
Buy |
|
Britam |
7.1 |
7.0 |
6.9 |
7.0 |
(0.8%) |
1.2% |
8.8 |
30.7% |
0.7x |
Buy |
|
CIC Group |
3.1 |
3.0 |
3.0 |
3.0 |
(1.0%) |
2.4% |
3.8 |
29.2% |
1.2x |
Buy |
|
KCB Group |
42.0 |
51.8 |
44.1 |
53.3 |
23.2% |
20.7% |
61.4 |
23.6% |
1.4x |
Buy |
|
Kenya Reinsurance |
2.9 |
3.2 |
3.0 |
3.2 |
9.7% |
4.6% |
3.8 |
23.5% |
0.1x |
Buy |
|
Liberty Holdings |
9.7 |
9.7 |
10.4 |
9.7 |
(0.2%) |
(6.7%) |
11.3 |
21.6% |
0.7x |
Buy |
|
Equity Group |
37.5 |
46.5 |
40.0 |
46.5 |
24.2% |
16.4% |
53.0 |
19.3% |
1.9x |
Accumulate |
|
Jubilee holdings |
350.0 |
336.0 |
350.0 |
360.0 |
(4.0%) |
2.9% |
418.5 |
18.8% |
1.0x |
Accumulate |
|
Co-operative Bank |
11.9 |
14.6 |
12.5 |
15.8 |
22.3% |
26.4% |
15.0 |
3.3% |
1.4x |
Lighten |
|
Barclays Bank |
11.0 |
13.3 |
11.5 |
13.5 |
21.5% |
17.4% |
12.6 |
3.2% |
1.8x |
Lighten |
|
Standard Chartered |
199.8 |
205.3 |
198.5 |
214.8 |
2.8% |
8.2% |
208.0 |
3.1% |
1.7x |
Lighten |
|
NCBA Group |
30.0 |
39.2 |
33.6 |
39.5 |
30.7% |
17.4% |
37.9 |
(0.6%) |
0.8x |
Sell |
|
Stanbic Holdings |
96.0 |
106.5 |
101.8 |
110.5 |
10.9% |
8.6% |
100.5 |
(2.9%) |
1.2x |
Sell |
|
HF Group |
7.0 |
6.6 |
6.7 |
7.2 |
(6.0%) |
7.8% |
2.8 |
(61.7%) |
0.3x |
Sell |
|
*Target Price as per Cytonn Analyst estimates **Upside / (Downside) is adjusted for Dividend Yield ***Banks in which Cytonn and/or its affiliates are invested in |
||||||||||
We are “Positive” on equities for investors as the sustained price declines has seen the market P/E decline to below its historical average. We expect increased market activity, and possibly increased inflows from foreign investors, as they take advantage of the attractive valuations, to support the positive performance.
I. Industry Reports
During the month, Hass Consult, a local real estate agency, released the Hass Property Sales and Rental Index Q3’2019. As per the report, the residential sector continues to be influenced by weak private sector credit growth, which has constrained access to financing for homebuyers and developers alike. Overall, the market recorded a q/q price growth of 0.9% and an annual depreciation of 3.4%, with semi-detached houses leading the market with an annual price growth of 6.0% and a q/q growth of 3.4%. Other key take-outs were:
- In the detached units market, Nyari Estate and Ridgeways recorded the highest annual price growth in the suburbs category, at 12.4% and 10.6%, and a q/q change of 2.1% and 3.9%, respectively; while in Satellite Towns, Kiambu and Limuru posted the highest annual growth at 8.8% and 7.1%, and a q/q growth at 1.3% and 1.0%, respectively. This is in comparison to the detached markets overall performance with a price depreciation of 7.0% and a marginal q/q growth of 0.3%. Juja registered the lowest growth with prices depreciating at an average annual and quarterly rate of 7.8% and 3.0%, respectively,
- In terms of rents, detached houses in Kilimani and Ngong recorded the highest annual increase in asking rents at 3.2% and 4.7%, respectively,
- In the apartments market, Upperhill and Westlands registered the highest annual growth in asking prices at 5.7% and 2.5%, respectively, and a q/q growth of 1.3% and 0.1%, respectively. This is in comparison to average depreciation of the overall apartments market at annual and q/q rates of 1.7% and 0.5%, respectively,
- Apartments in Lang’ata registered the highest annual growth in asking rents at 14.9% and q/q growth at 2.2%,
- In Satellite Towns, apartments saw the highest price growth in Athi River and Kitengela at 11.6% and 10.1%, respectively. However, Athi River and Kiambu recorded the highest q/q price growth at 3.2% and 2.4%, respectively, and,
- Ngong and Thika Satellite Towns registered the highest annual growth in rents at 15.8% and 13.3% while Ruaka posted the highest q/q rent growth at 1.7%.
The report is in tandem with the Cytonn Q3’2019 Markets Review, according to which, while prices depreciated across the market by 0.2% with the tough economic environment exerting pressure on the prices and market uptake, rental yields notably improved across the residential market with apartments recording average rental yields of 5.2%, in comparison to 4.9% in H1’2019, whereas detached markets recorded an average of 4.6%, in comparison to 3.9% in H1’2019, largely attributable to increase in occupancy rates as homebuyers took advantage of the pricing discounts as demand for affordability continue to aggravate. We expect appetite for the rental market to continue growing, especially in the high-end and upper mid-end markets. The growing appetite for affordable homes should stimulate uptake in the lower mid-end markets in areas such as Athi River, Thindigua and Ruaka as they continue to exhibit high demand from end buyers, due to their proximity to commercial nodes such as the CBD, Westlands, and Upperhill.
The firm also released the Hass Land Index Q3’2019. According to the report, land prices over the quarter rose marginally amidst anticipations of the repeal of the interest rate cap, which is expected to see increased lending to the private sector, thus stimulating the general economy. The key take-outs from the land report were as follows:
- Land prices in Nairobi suburbs rose marginally over the quarter at 0.2% and annually at 1.7%. Loresho registered the highest annual growth at 9.4%, while Kitisuru recorded the highest quarterly growth at 2.7%. Both areas continue to benefit from the Westlands Link Road, which has made the areas more accessible. On the tail end, Upperhill recorded the lowest annual growth with prices depreciating by 2.6% on the back of waning demand as developers slowed down on construction activity following an office space glut in the node, and,
- The highest increase in land prices was recorded in Satellite Towns, which recorded an annual growth of 5.1% and a q/q growth of 1.4%. Syokimau posted the highest annual growth at 10.6% while Tigoni recorded the highest growth over the quarter at 1.4%. The lowest growth was recorded in Kiambu where land prices depreciated at an average annual rate of 1.7%.
This is in line with our Cytonn Q3’2019 Markets Review, according to which land in satellite areas recorded the highest annual appreciation at 6.1%, in comparison to Nairobi suburbs’ average of 0.8%. We expect the continued focus on affordable housing to boost land prices in Satellite Towns such as Ruiru, Ruaka and Utawala supported by the ongoing infrastructural improvements.
Other reports released during the month included:
- Jones Lang LaSalle (JLL) Q4’2019 Spotlight on Africa Report, which tracks vital trends impacting hotel investment in Sub-Saharan Africa. According to the report, hotel investors in Sub-Saharan Africa are likely to attract investment for hotel projects that are set up as mixed-use developments. This is as transactions for mixed-use properties increased by 42.0% whereas other sectors such as Office, Retail, Industrial and Hotels, as single-use, declined by 4.0%, 20.0%, 6.0%, and 18.0%, respectively. For analysis, see Cytonn Weekly #43/2019
- The World Bank’s ‘Doing Business Report 2020’, a report that compares business regulation across economies from 190 countries. According to the report, Kenya’s ranking in terms of property registration dropped twelve positions to #134 in 2019 from #122 in 2018 attributed to additional payment slip generation, and increased online consent application and title search fees. In terms of construction permits, the country improved twenty-three ranks to position #105 in 2019 from position #128 in 2018 attributed to increased transparency by making building permit requirements publicly available online. For analysis, see Cytonn Weekly #43/2019.
II. Residential Sector
- During the month, the Kenya Mortgage Refinance Company invited bids for the design, configuration, installation, and hosting of a Mortgage Refinance Information System. This follows a long-term loan facility of approximately Kshs 10.4 bn from the African Development Bank (AfDB) to the Kenyan Government for on-lending to the refinancing company. Once fully operational, KMRC is expected to deepen the Kenyan capital markets and mobilize local savings for the purposes of long-term mortgage financing and housing development in the country. According to AfDB, the institution is expected to stimulate the local mortgage market by 4,000 new mortgages, directly impacting 24,000 beneficiaries. For more on the KMRC, see our Kenya Mortgage Refinancing Company Update;
- The County Government of Nakuru also invited bids from local and international developers and financiers for the development of the Naivasha Affordable Housing Project (NAHP). The project is expected to see 2,400 units delivered to the market on a 55-acre parcel of land in Naivasha, along the Nairobi-Nakuru Highway. The project targets income earners within the bracket of between Kshs 15,000 and 150,000. This is a step towards realization of the Government’s Affordable Housing Initiative, and is in line with other affordable housing projects unveiled in areas such as Mavoko, Nyeri, and Kiambu,
- During the month, the Ministry of Transport, Infrastructure, Housing and Urban Development and the Nairobi City County Government unveiled plans for Nairobi’s Eastlands Regeneration. The Urban Renewal for Eastlands, Nairobi Project is set to run up to 2036, having begun in 2016 and will see approximately 177,139 units put up under a more diverse densification plan for the 3,123-acres part of Nairobi County. In the detailed plan for the low-income area, which is characterized by dilapidated housing, poor and inadequate infrastructure, uncontrolled development, as well as congestion, 70.0% of the units will be accessed through tenant purchase schemes while 30.0% will be under a sales option. The plan is geared towards alleviating housing shortage in Nairobi and the country at large, and is a step in the right direction towards ensuring formal and decent housing for low income earners. For more, see Cytonn Weekly #41/2019,
- Tilisi Developments Plc, a real estate developer, announced plans to begin construction of 186 high-end villas on a 41-acre parcel of land within the Tilisi masterplan development located in Rironi, Limuru area. The project will consist of 3-bed, 4-bed and 5-bed villas of 212 SQM, 232 SQM, and 585 SQM, and priced at Kshs 18.5 mn, Kshs 20.0 mn and Kshs 59.0 mn, respectively, translating to an average of Kshs 91,442 per SQM. For analysis, see Cytonn Weekly #43/2019, and,
- In line with the Kenyan Government’s target to have at least 2,000 affordable housing units at county level, Nyeri County Government announced plans of developing its first affordable housing units, a public-private partnership project between Tekimamo Company Ltd, a Teachers’ Sacco based in Nyeri County, and Sampesa Agency, a property development and management firm, which will see sixty-four two-bedroom units put up at an estimated cost of Kshs 143.6 mn, exclusive of land, which belongs to the Sacco. For analysis, see Cytonn Weekly #41/2019
Amidst the affordability concerns in Kenya, we expect the affordable housing sector to continue shaping up, attracting local and international investments. We also expect the overall residential market to improve especially on the back of anticipated growth of private sector lending once the interest rate cap is repealed.
III. Commercial Office Sector
- During the month, Kofisi, a subsidiary of Sunbird Group, opened a new office in Karen. The company, which is an aspirational work spaces provider, has offices in Lagos, Dar es Salaam, Kampala, London, and Johannesburg, with other local branches in Upperhill and Westlands. For analysis, see Cytonn Weekly #41/2019, and,
- An undisclosed pension scheme through GenAfrica Asset Managers, announced plans of purchasing a developed commercial property at Kshs 600.0 mn or below for rental income purposes. This also follows Southern Eastern Kenya University Pension scheme invitation for bids from property owners in a bid to purchase investment commercial property budgeted at Kshs 60.0 mn, signalling a growing trend of pension schemes increasing their real estate investment portfolios attributable to the sector’s attractive returns in comparison to traditional asset classes. For analysis, see Cytonn Weekly #41/2019
We expect to see a slowdown in commercial office space building activity, with the current stock being converted to modern concepts such as co-working spaces in a bid to attract tenancy and institutional buyers as concepts such as serviced offices attract relatively high rental yields of up to 13.4% in comparison to mainstream offices which generate average rental yields of 8.0%.
IV. Retail Sector
- During the month, Naivas Supermarket announced plans to open four additional branches in the next few months, bringing the total number of outlets to fifty-nine. The additional branches will be situated in Mombasa, Embu, near Yaya Centre and along the Eastern Bypass. The move is in line with the retailer’s expansion strategy aimed at tapping into the Nairobi outskirts and urban cities in the wake of increased competition from international retailers such as Carrefour and Shoprite, and local players such as Quickmart. For analysis, see Cytonn Weekly #42/2019
- Botswana-based Choppies announced plans of exiting its Nanyuki Mall branch, which is to be taken up by local retailer Tuskys. The closure of Choppies branches and its planned exit from the Kenyan market is a result of stock shortage and corporate governance issues facing the retailer hailing from its parent companies in Botswana and Zimbabwe. For analysis, see Cytonn Weekly #41/2019
- In the face of stiff competition among retailers, during the month, Java introduced a new restaurant business line to its existing portfolio, which includes the coffeehouse, Planet Yoghurt, and 360 Degrees Pizza, to now include fried chicken in a new restaurant, Kukito, which is located in Nairobi, along Kimathi Street. The new opening marks Java’s 77th store in East Africa and also follows Java’s announcement to open more express outlets in schools and hospitals likes of which it operates in United States International University (USIU) off Thika Road, and Aga Khan and MP Shah Hospitals in Nairobi. This is as other retailers, namely Artcaffe, continue to step up the competition setting up new stores in the CBD. For analysis, see Cytonn Weekly #41/2019
We expect the retail sector to remain vibrant on the back of a growing middle class and increased retailer expansion, which means more space uptake for developers.
V. Hospitality Sector
- South African hotel group, City Lodge opened the last phase of its City Lodge Hotel, which is located at Two Rivers, along Limuru Road. The 171-room hotel, which was constructed at a cost of Kshs 2.0 bn, marks the third facility under City Lodge’s Kenyan portfolio, after 127-room Fairview Hotel and 84-room Town Lodge, both located in Upperhill. Kenya’s hospitality sector continues to attract international investment due to relatively high demand for international quality accommodation facilities from international leisure and business tourists, and continued infrastructural improvements such as the Northern Bypass and the recently launched JKIA-James Gichuru Express Highway,
- Also during the month, seven Kenyan hotels received various awards at the World Luxury Hotel Awards 2019 in Finland, attesting to Kenya’s competitiveness on the global stage in terms of international quality hospitality facilities, thus making a top global tourist destination. The awards included Best Luxury City Hotel, Best Luxury Beach Resort, and Best Luxury Hotel Group to Sarova Stanley, Sarova White Sands Beach Resort & Spa, and Sun Multinational, respectively. For analysis, see Cytonn Weekly #43/2019, and,
- Also during the month, the Tourism Cabinet Secretary, Hon. Najib Balala, inaugurated the National Convention Bureau. The main mandate of the bureau includes serving as the focal point of the Meetings, Incentives, Conventions, and Exhibitions (MICE) activities, as well as marketing and selling Kenya as a business events destination.
We expect the hospitality sector’s performance to remain on an upward trajectory supported by increased interest from international investors, and a vibrant tourism sector.
VI. Infrastructure Sector
- President Uhuru Kenyatta, launched Phase 2 of the Standard Gauge Railway (SGR) project, bringing to operationalization the rail between Nairobi and Suswa, Naivasha. The 120.5 km (Phase 2A) project, will cut across Nairobi, Kajiado, Nakuru, and Narok with four passenger stations - Ongata Rongai, Ngong, Mai Mahiu and Suswa. For analysis, see Cytonn Weekly #42/2019, and,
- The President also launched the construction of the Jomo Kenyatta International Airport (JKIA) -Westlands Expressway, an 18.6-kilometer road project, which will start at JKIA and terminate at James Gichuru, along Waiyaki Way Road, in Westlands. For analysis, see Cytonn Weekly #42/2019
With the Government’s Kenya economic transformation agenda, we expect to see more infrastructural projects being unveiled, which in turn will boost the real estate sector’s performance and also lead to opening up of more areas for real estate development.
VII. Listed Real Estate
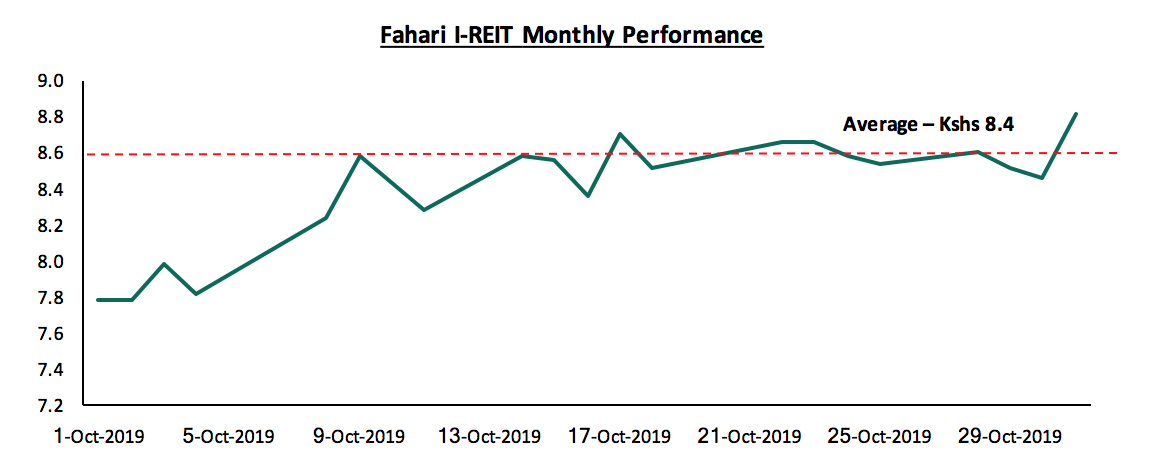
During the month, the Fahari I-REIT closed the month at Kshs 8.8, a 13.2% increase from the month’s opening price of Kshs 7.8. On average, during the month, the I-REIT traded at an average of Kshs 8.4, 5.9% lower than its YTD average of Kshs 8.9. The I-REIT’s performance and continued drop in its value is as a result of poor market perception and thus, low investor appetite.
We anticipate an improvement in the real estate sector on the back of (i) steady economic growth, with the World Bank projecting a 6.0% GDP growth in 2020, (ii) continued infrastructural improvements, and (iii) stable economy and private sector credit growth once the interest cap law is repealed.
Disclaimer: The views expressed in this publication are those of the writers where particulars are not warranted. This publication is meant for general information only and is not a warranty, representation, advice or solicitation of any nature. Readers are advised in all circumstances to seek the advice of a registered investment advisor.

- Talk to us
- Kenya
- P.O Box 20695 - 00200, Nairobi, Kenya
- Cell +254709101200
- Tel +254709101200
- WhatsApp +254741676635
- United States
- +254709101200
- DOWNLOAD OUR APP
-


- Kenya
- 8th Floor, Pinetree Plaza, Kaburu Drive, Ngong Road, Nairobi, Kenya
- USA
- Suite 1150, 1775 Eye Street NW, USA, Washington DC 20006, USA
- Investments
- High Yield
- Private Equity
- Real Estate
- Real Estate
- RiverRun Estates
- Cytonn Towers
- The Ridge
- Taraji Heights
- The Alma