Kenya Listed Banks Report Q1’2024, & Cytonn Weekly #24/2024
By Research Team, Jun 16, 2024
Executive Summary
Fixed Income
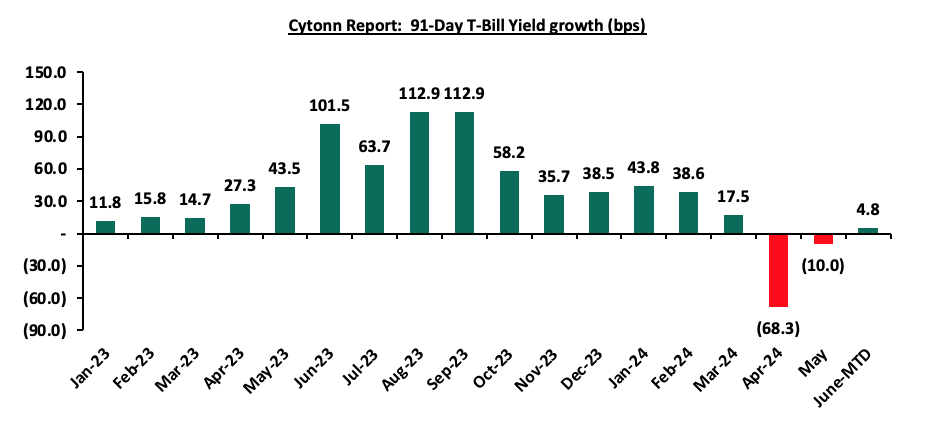
During the week, T-bills were undersubscribed for the first time in seven weeks, with the overall undersubscription rate coming in at 94.7%, a reversal from the oversubscription rate of 151.0% recorded the previous week. Investors’ preference for the shorter 91-day paper persisted, with the paper receiving bids worth Kshs 10.3 bn against the offered Kshs 4.0 bn, translating to an oversubscription rate of 257.2%, albeit lower than the oversubscription rate of 626.5% recorded the previous week. The subscription rate for the 182-day paper increased to 99.3% from the 59.7% recorded the previous week, while the subscription rate for the 364-day paper decreased to 25.0%, from the 52.0% recorded the previous week. The government accepted a total of Kshs 21.2 bn worth of bids out of Kshs 22.7 bn bids received, translating to an acceptance rate of 93.4%. The yields on the government papers were on an upward trajectory, with the yields on the 91-day, 182-day, and 364-day papers increasing by 0.7 bps, 5.9 bps, and 2.3 bps to 15.97%, 16.70%, and 16.75% from 15.97%, 16.64% and 16.73% respectively recorded the previous week;
During the week, the Central Bank of Kenya released the auction results for the re-opened bond FXD1/2023/005 with a tenor to maturity of 4.1 years, and a fixed coupon rate of 16.8% and FXD1/2023/010 with a tenor to maturity of 8.7 years, and a fixed coupon rate of 14.2%. The bonds were oversubscribed with the overall subscription rate coming in at 138.5%, receiving bids worth Kshs 41.6 bn against the offered Kshs 30.0 bn. The government accepted bids worth Kshs 30.2 bn, translating to an acceptance rate of 72.6%. The weighted average yield of accepted bids for the FXD1/2023/005 and the FXD1/2023/010 came in at 18.2% and 16.4% respectively, which was slightly above our expected bidding range. Notably, the FXD1/2023/003 registered a decrease from the 18.4% registered in February when it was last re-opened. With the Inflation rate at 5.1% as of May 2024, the real return of the FXD1/2023/005 and the FXD1/2023/010 is 13.1% and 11.3% respectively;
Also, during the week, The International Monetary Fund (IMF) team and Kenyan authorities reached a staff-level agreement for the seventh reviews of Kenya’s economic program supported by the IMF’s Extended Fund Facility (EFF) and Extended Credit Facility (ECF), and the second Review under the Resilience Sustainability Facility (RSF). Notably, the discussions considered Kenya’s request for an augmentation under the EFF/ECF arrangement and the RSF, which if approved by the IMF executive board, will lead to a potential total commitment of more than USD 3.6 bn during the program's duration. Furthermore, the IMF team and Kenyan authorities agreed on a set of comprehensive policies and reforms needed to complete the seventh review, entailing corrective measures to safeguard debt sustainability, and fiscal discipline following a slip in the FY’2023/24 budget, where the government is expected to miss out on its revenue targets;
Additionally, during the week, The Energy and Petroleum Regulatory Authority (EPRA) released their monthly statement on the maximum retail fuel prices in Kenya, effective from 15th June 2024 to 14th July 2024. Notably, the maximum allowed price for Super Petrol, Diesel and Kerosene decreased by Kshs 3.0, Kshs 6.1, and Kshs 5.7 each respectively, and will retail at Kshs 192.8, Kshs 179.2 and Kshs 168.7 per litre respectively from the May 2024 prices of Kshs 189.8, Kshs 173.1 and Kshs 163.1 respectively;
Finally, During the week, the National Treasury gazetted the revenue and net expenditures for the eleventh month of FY’2023/2024, ending 31st May 2024, highlighting that the total revenue collected as at the end of May 2024 amounted to Kshs 2,025.6 bn, equivalent to 78.6% of the revised estimates of Kshs 2,576.8 bn for FY’2023/2024 and is 85.8% of the prorated estimates of Kshs 2,362.0 bn.
Equities
During the week, the equities market was on a downward trajectory, with NSE 25 and NSE 10 declining the most by 1.2% while NSE 20, and NASI declined by 1.0%, and 0.8% respectively taking the YTD performance to gains of 27.0%, 23.6%, 23.5% and 15.6% for NSE 10, NASI, NSE 25, and NSE 20 respectively. The equities market performance was driven by losses recorded by large-cap stocks such as Co-op Bank, KCB Group, and EABL of 2.9%, 2.7%, and 2.7% respectively. The performance was, however, supported by gains recorded by large-cap stocks such as Standard Chartered Bank, ABSA Bank, and Equity Group of 4.6%, 1.1, and 0.5% respectively;
Real Estate
On the Unquoted Securities Platform, Acorn D-REIT and I-REIT traded at Kshs 24.5 and Kshs 22.0 per unit, respectively, as of 14th June 2024. The performance represented a 22.5% and 10.0% gain for the D-REIT and I-REIT, respectively, from the Kshs 20.0 inception price;
Focus of the Week
Following the release of the Q1’2024 results by Kenyan listed banks, the Cytonn Financial Services Research Team undertook an analysis on the financial performance of the listed banks and identified the key factors that shaped the performance of the sector;
Investment Updates:
- Weekly Rates:
- Cytonn Money Market Fund closed the week at a yield of 17.61% p.a. To invest, dial *809# or download the Cytonn App from Google Play store here or from the Appstore here;
- We continue to offer Wealth Management Training every Monday, from 10:00 am to 12:00 pm. The training aims to grow financial literacy among the general public. To register for any of our Wealth Management Trainings, click here;
- If interested in our Private Wealth Management Training for your employees or investment group, please get in touch with us through wmt@cytonn.com;
- Cytonn Insurance Agency acts as an intermediary for those looking to secure their assets and loved ones’ future through insurance namely; Motor, Medical, Life, Property, WIBA, Credit and Fire and Burglary insurance covers. For assistance, get in touch with us through insuranceagency@cytonn.com;
- Cytonn Asset Managers Limited (CAML) continues to offer pension products to meet the needs of both individual clients who want to save for their retirement during their working years and Institutional clients that want to contribute on behalf of their employees to help them build their retirement pot. To more about our pension schemes, kindly get in touch with us through pensions@cytonn.com;
Real Estate Updates:
- For more information on Cytonn’s real estate developments, email us at sales@cytonn.com;
- Phase 3 of The Alma is now ready for occupation and the show house is open daily. To join the waiting list to rent, please email properties@cytonn.com;
- For Third Party Real Estate Consultancy Services, email us at rdo@cytonn.com;
- For recent news about the group, see our news section here;
Hospitality Updates:
- We currently have promotions for Staycations. Visit cysuites.com/offers for details or email us at sales@cysuites.com;
Money Markets, T-Bills Primary Auction:
During the week, T-bills were undersubscribed for the first time in seven weeks, with the overall undersubscription rate coming in at 94.7%, a reversal from the oversubscription rate of 151.0% recorded the previous week. Investors’ preference for the shorter 91-day paper persisted, with the paper receiving bids worth Kshs 10.3 bn against the offered Kshs 4.0 bn, translating to an oversubscription rate of 257.2%, albeit lower than the oversubscription rate of 626.5% recorded the previous week. The subscription rate for the 182-day paper increased to 99.3% from the 59.7% recorded the previous week, while the subscription rate for the 364-day paper decreased to 25.0%, from the 52.0% recorded the previous week. The government accepted a total of Kshs 21.2 bn worth of bids out of Kshs 22.7 bn bids received, translating to an acceptance rate of 93.4%. The yields on the government papers were on an upward trajectory, with the yields on the 91-day, 182-day, and 364-day papers increasing by 0.7 bps, 5.9 bps, and 2.3 bps to 15.97%, 16.70%, and 16.75% from 15.97%, 16.64% and 16.73% respectively recorded the previous week. The chart below shows the yield growth rate for the 91-day paper over the period:
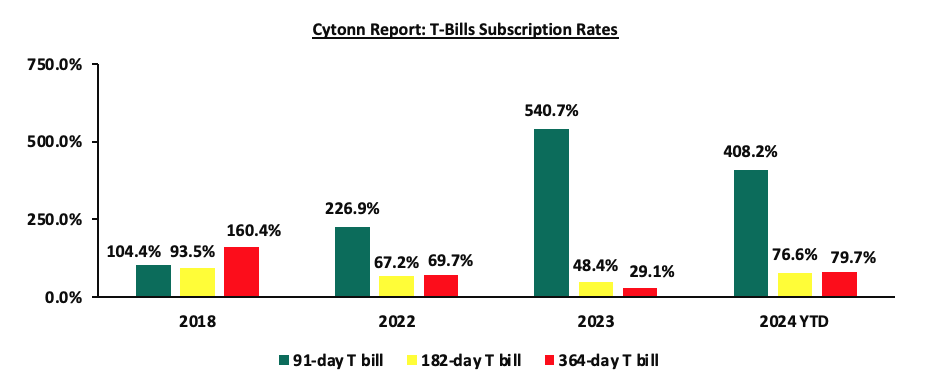
The chart below compares the overall average T-bill subscription rates obtained in 2018, 2022, 2023, and 2024 Year-to-date (YTD):
During the week, the Central Bank of Kenya released the auction results for the re-opened bond FXD1/2023/005 with a tenor to maturity of 4.1 years, and a fixed coupon rate of 16.8% and FXD1/2023/010 with a tenor to maturity of 8.7 years, and a fixed coupon rate of 14.2%. The bonds were oversubscribed with the overall subscription rate coming in at 138.5%, receiving bids worth Kshs 41.6 bn against the offered Kshs 30.0 bn. The government accepted bids worth Kshs 30.2 bn, translating to an acceptance rate of 72.6%. The weighted average yield of accepted bids for the FXD1/2023/005 and the FXD1/2023/010 came in at 18.2% and 16.4% respectively, which was slightly above our expected bidding range. Notably, the FXD1/2023/003 registered a decrease from the 18.4% registered in February when it was last re-opened. With the Inflation rate at 5.1% as of May 2024, the real return of the FXD1/2023/005 and the FXD1/2023/010 is 13.1% and 11.3% respectively.
Money Market Performance:
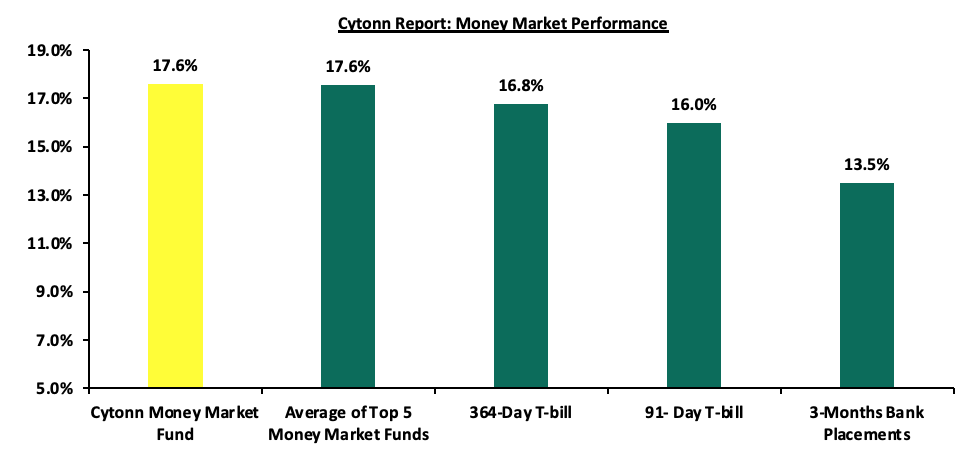
In the money markets, 3-month bank placements ended the week at 13.5% (based on what we have been offered by various banks), and the yields on the government papers were on an upward trajectory, with the yields on the 91-day and 364-day papers increasing by 0.7 bps and 2.3 bps to 15.97% and 16.75% from 15.97% and 16.73% respectively recorded the previous week. The yields on the Cytonn Money Market Fund increased marginally by 2.0 bps to 17.61% from 17.59% recorded the previous week, while the average yields on the Top 5 Money Market Funds decreased by 5.4 bps to 17.56% from the 17.62% recorded the previous week.
The table below shows the Money Market Fund Yields for Kenyan Fund Managers as published on 14th June 2024:
|
Cytonn Report: Money Market Fund Yield for Fund Managers as published on 14th June 2024 |
||
|
Rank |
Fund Manager |
Effective Annual Rate |
|
1 |
Lofty-Corban Money Market Fund |
18.3% |
|
2 |
Etica Money Market Fund |
18.0% |
|
3 |
Cytonn Money Market Fund (Dial *809# or download the Cytonn App) |
17.6% |
|
4 |
Kuza Money Market fund |
17.2% |
|
5 |
GenAfrica Money Market Fund |
16.8% |
|
6 |
Nabo Africa Money Market Fund |
16.4% |
|
7 |
Enwealth Money Market Fund |
15.8% |
|
8 |
Co-op Money Market Fund |
15.7% |
|
9 |
KCB Money Market Fund |
15.6% |
|
10 |
GenCap Hela Imara Money Market Fund |
15.6% |
|
11 |
Apollo Money Market Fund |
15.5% |
|
12 |
Jubilee Money Market Fund |
15.5% |
|
13 |
Madison Money Market Fund |
15.5% |
|
14 |
Mali Money Market Fund |
15.2% |
|
15 |
AA Kenya Shillings Fund |
15.2% |
|
16 |
Mayfair Money Market Fund |
15.1% |
|
17 |
Sanlam Money Market Fund |
15.1% |
|
18 |
Absa Shilling Money Market Fund |
14.9% |
|
19 |
Orient Kasha Money Market Fund |
14.1% |
|
20 |
Dry Associates Money Market Fund |
14.1% |
|
21 |
Old Mutual Money Market Fund |
13.5% |
|
22 |
CIC Money Market Fund |
13.2% |
|
23 |
ICEA Lion Money Market Fund |
12.3% |
|
24 |
Equity Money Market Fund |
11.8% |
|
25 |
British-American Money Market Fund |
9.8% |
Source: Business Daily
Liquidity:
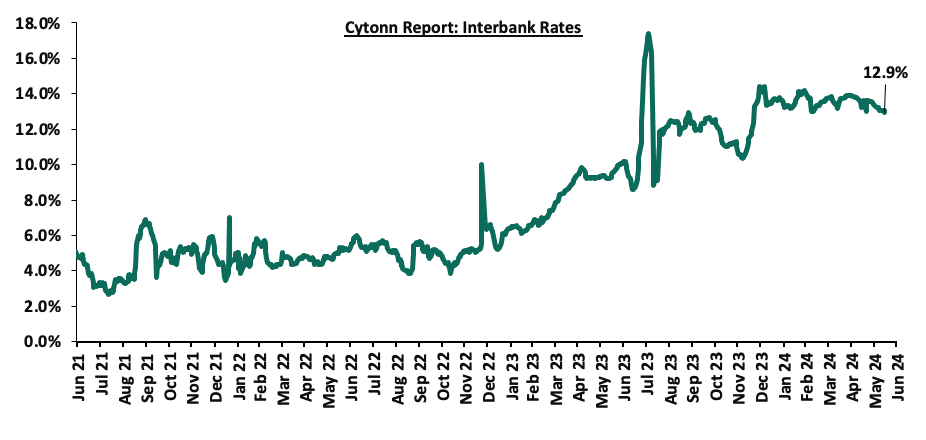
During the week, liquidity in the money markets eased, with the average interbank rate decreasing by 13.9 bps, to 13.0% from the 13.2% recorded the previous week, partly attributable to government payments that offset tax remittances. The average interbank volumes traded decreased by 34.9% to Kshs 19.6 bn from Kshs 30.1 bn recorded the previous week. The chart below shows the interbank rates in the market over the years:
Kenya Eurobonds:
During the week, the yields on Eurobonds were on an upward trajectory, with the yields on the 7-year Eurobond issued in 2019 increasing the most by 31.5 bps to 9.3% from 9.0% recorded the previous week. The table below shows the summary of the performance of the Kenyan Eurobonds as of 13th June 2024;
|
Cytonn Report: Kenya Eurobonds Performance |
||||||
|
|
2018 |
2019 |
2021 |
2024 |
||
|
Tenor |
10-year issue |
30-year issue |
7-year issue |
12-year issue |
13-year issue |
7-year issue |
|
Amount Issued (USD) |
1.0 bn |
1.0 bn |
0.9 bn |
1.2 bn |
1.0 bn |
1.5 bn |
|
Years to Maturity |
3.7 |
23.7 |
2.9 |
7.9 |
10.0 |
6.7 |
|
Yields at Issue |
7.3% |
8.3% |
7.0% |
7.9% |
6.2% |
10.4% |
|
1-Jan-24 |
9.8% |
10.2% |
10.1% |
9.9% |
9.5% |
|
|
3-Jun-24 |
9.2% |
10.1% |
9.0% |
9.7% |
9.8% |
9.7% |
|
7-Jun-24 |
9.2% |
10.2% |
9.0% |
9.8% |
9.8% |
9.7% |
|
10-Jun-24 |
9.3% |
10.3% |
9.1% |
9.8% |
9.9% |
9.8% |
|
11-Jun-24 |
9.3% |
10.3% |
9.2% |
9.9% |
9.9% |
9.9% |
|
12-Jun-24 |
9.2% |
10.3% |
9.0% |
9.8% |
9.8% |
9.8% |
|
13-Jun-24 |
9.4% |
10.4% |
9.3% |
10.0% |
10.1% |
10.0% |
|
Weekly Change |
0.3% |
0.3% |
0.3% |
0.2% |
0.2% |
0.3% |
|
MTD Change |
0.2% |
0.4% |
0.3% |
0.3% |
0.3% |
0.2% |
|
YTD Change |
(0.4%) |
0.2% |
(0.8%) |
0.1% |
0.6% |
- |
Source: Central Bank of Kenya (CBK) and National Treasury
Kenya Shilling:
During the week, the Kenya Shilling appreciated against the US Dollar by 1.1%, to close at Kshs 128.7, from Kshs 130.0 recorded the previous week. On a year-to-date basis, the shilling has appreciated by 18.0% against the dollar, in contrast to the 26.8% depreciation recorded in 2023.
We expect the shilling to be supported by:
- Diaspora remittances standing at a cumulative USD 4,509.0 mn in the 12 months to May 2024, 12.8% higher than the USD 3,997.0 mn recorded over the same period in 2023, which has continued to cushion the shilling against further depreciation. In the May 2024 diaspora remittances figures, America remained the largest source of remittances to Kenya accounting for 48.0% in the period, and,
- The tourism inflow receipts which came in at USD 352.5 bn in 2023, a 31.5% increase from USD 268.1 bn inflow receipts recorded in 2022, and owing to tourist arrivals that improved by 27.2% to 2.1 mn in the 12 months to March 2024, from 1.6 mn recorded during a similar period in 2023.
The shilling is however expected to remain under pressure in 2024 as a result of:
- An ever-present current account deficit which came at 4.0% of GDP in FY’2023 from 5.1% recorded in FY’2022,
- The need for government debt servicing, continues to put pressure on forex reserves given that 67.3% of Kenya’s external debt was US Dollar denominated as of December 2023, and,
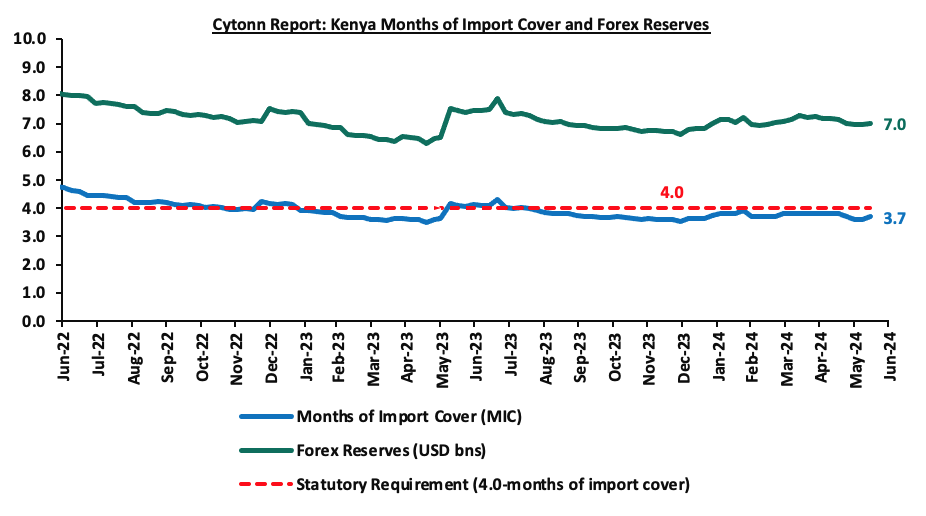
- Dwindling forex reserves, currently at USD 7.0 mn (equivalent to 3.7 months of import cover), which is below the statutory requirement of maintaining at least 4.0 months of import cover.
Key to note, Kenya’s forex reserves increased by 0.4% during the week to remain relatively unchanged from the USD 7.0 bn recorded the previous week, equivalent to 3.7 months of import cover, an increase from the 3.6 months recorded the previous week, and remained below the statutory requirement of maintaining at least 4.0-months of import cover. The chart below summarizes the evolution of Kenya's months of import cover over the years:
Weekly Highlights
- International Monetary Fund (IMF) Loan Facility
During the week, The International Monetary Fund (IMF) team and Kenyan authorities reached a staff-level agreement for the seventh reviews of Kenya’s economic program supported by the IMF’s Extended Fund Facility (EFF) and Extended Credit Facility (ECF), and the second Review under the Resilience Sustainability Facility (RSF). Notably, the discussions considered Kenya’s request for an augmentation under the EFF/ECF arrangement and the RSF, which if approved by the IMF executive board, will lead to a potential total commitment of more than USD 3.6 bn during the program's duration. Furthermore, the IMF team and Kenyan authorities agreed on a set of comprehensive policies and reforms needed to complete the seventh review, entailing corrective measures to safeguard debt sustainability, and fiscal discipline following a slip in FY’2023/24 budget, where the government in expected to miss out on its revenue targets.
This follows successful sixth reviews held in February 2024, in which the IMF Executive Board approved augmentations of access of USD 941.2 mn (Kshs 151.3 bn) under the Extended Fund Facility (EFF) and the Extended Credit Facility (ECF) arrangements, and the first review under the 20-month Resilience and Sustainability Facility (RSF) arrangement, approved in July 2023.
Approval of this agreement by the executive board will allow for the disbursement of USD 976.0 mn (Kshs 125.6 bn) under the EFF/ECF arrangements - which includes an access of USD 156.0 mn (Kshs 20.0 bn) as zero interest concessional resource under the ECF agreement - and brings total disbursements under the EFF/ECF arrangements to USD 3.7 bn (Kshs 470.5 b). The approval will also allow for disbursement of USD 120.0 mn (Kshs 15.4 bn) under the RSF arrangement, taking the total disbursement under this program to USD 180.2 mn (Kshs 23.2 bn).
In conducting reviews, the IMF Team noted that Kenya’s buyback of a significant share of the 2024 Eurobond using proceeds from a new issuance alleviated near-term exceptional balance of payment needs and, therefore, agreed to bring cumulative access under the EFF/ECF arrangements within the normal limits and a recalibration of access towards the more concessional financing under the ECF, consistent with the Fund’s policy on blended access.
The team also noted that despite positive developments in the economy, a significant shortfall in tax revenue collection and deterioration in the primary fiscal balance in FY’2023/24 relative to program targets is expected to keep domestic borrowing needs elevated. As a result, they mentioned, interest payments have increased, putting pressure on public debt even after the latter benefited from a strengthened shilling.
|
Cytonn Report: International Monetary Fund (IMF) EFF and ECF Financing Programme |
||
|
Date |
Amount Received (USD mn) |
Amount Received(Kshs bn, 1 USD= Kshs 128.7) |
|
Apr-21 |
307.5 |
39.6 |
|
Jun-21 |
407.0 |
52.4 |
|
Dec-21 |
258.1 |
33.2 |
|
Jul-22 |
235.6 |
30.3 |
|
Nov-22 |
433.0 |
55.7 |
|
Jul-23 |
415.4 |
53.4 |
|
Jan-24 |
624.5 |
80.3 |
|
Jun-24 |
976.0 |
125.6 |
|
Total Amount Received |
3,657.1 |
470.5 |
|
Amount Pending |
222.9 |
28.7 |
|
*Funds expected upon IMF management and executive board disbursement |
||
|
Cytonn Report: International Monetary Fund (IMF) RSF Financing Programme |
||
|
Date |
Amount Received (USD mn) |
Amount Received(Kshs bn, 1 USD = Kshs 128.7) |
|
Jan-24 |
60.2 |
7.7 |
|
Jun-24 |
120.0 |
15.4 |
|
Total Amount Received |
180.2 |
23.2 |
|
Amount Pending |
361.2 |
46.5 |
|
*Funds expected upon IMF management and executive board disbursement |
||
This comes as a boost as the Kenyan government goes through the budget proposal for FY’2024/25, which stands at Kshs 3.9 tn, with a deficit of Kshs 514.7 bn. This financing, if approved, will go a long way in solving some of the liquidity issues faced by the government including debt servicing, pending bills payments, and the public sector wage bill. The disbursements under the RSF program are also expected to give a boost to the climate agenda, whose progress the IMF team noted was quite strong. Finally, the loan disbursement will support the country’s Medium Term Debt Strategy, which aims to optimize the use of concessional loans and reduce the use of costly commercial loans, and the new administration’s plans to cut public expenditure to reduce the budget deficit.
- Fuel Prices effective 15th June 2024 to 14th July 2024
During the week, The Energy and Petroleum Regulatory Authority (EPRA) released their monthly statement on the maximum retail fuel prices in Kenya, effective from 15th June 2024 to 14th July 2024. Notably, the maximum allowed price for Super Petrol, Diesel, and Kerosene decreased by Kshs 3.0, Kshs 6.1, and Kshs 5.7 each respectively, and will retail at Kshs 192.8, Kshs 179.2 and Kshs 168.7 per litre respectively from the May 2024 prices of Kshs 189.8, Kshs 173.1 and Kshs 163.1 respectively.
Other key take-outs from the performance include;
- The average landing costs per cubic meter for Super Petrol, Diesel, and Kerosene decreased by 2.0%, 3.9%, and 6.8% respectively to USD 751.0, USD 691.0, and USD 679.1 respectively from USD 765.9, USD 719.2 and USD 729.0 recorded in April 2024, and,
- The Kenyan shilling appreciated against the US Dollar by 1.4% to Kshs 132.7 in May 2024, compared to the mean monthly exchange rate of Kshs 134.6 recorded in April 2024.
We note that fuel prices in the country have decreased largely attributed to the government's efforts to stabilize pump prices through the petroleum pump price stabilization mechanism which has so far expended Kshs 9.9 bn in the FY’2023/24 to cushion the increases applied to the petroleum pump prices, coupled with the ongoing appreciation of the Kenyan Shilling against the dollar and other major currencies, as well as a decrease in international fuel prices. Nevertheless, fuel prices in the country still remain under pressure from the high taxation of petroleum products as provided in the Finance Act 2023. We expect that fuel prices will drop in the coming months as a result of the government's efforts to mitigate the cost of petroleum through the pump price stabilization mechanism and strengthening of the Kenyan Shilling against the United States Dollar, having gained by 18.0% against the dollar on a year-to-date basis. As such, we expect the business environment in the country to improve as fuel is a major input cost, as well as further ease in inflationary pressures, with the inflation rate expected to remain within the CBK’s preferred target range of 2.5%-7.5%.
- Exchequer Highlight
The National Treasury gazetted the revenue and net expenditures for the eleventh month of FY’2023/2024, ending 31st May 2024. Below is a summary of the performance:
|
FY'2023/2024 Budget Outturn - As at 31st May 2024 |
||||||
|
Amounts in Kshs billions unless stated otherwise |
||||||
|
Item |
12-months Original Estimates |
Revised Estimates |
Actual Receipts/Release |
Percentage Achieved of the Revised Estimates |
Prorated |
% achieved of the Prorated |
|
Opening Balance |
|
|
2.6 |
|
|
|
|
Tax Revenue |
2,495.8 |
2,495.83 |
1,928.8 |
77.3% |
2,287.8 |
84.3% |
|
Non-Tax Revenue |
75.3 |
80.9 |
94.2 |
116.3% |
74.2 |
126.9% |
|
Total Revenue |
2,571.2 |
2,576.8 |
2,025.6 |
78.6% |
2,362.0 |
85.8% |
|
External Loans & Grants |
870.2 |
849.8 |
527.5 |
62.1% |
779.0 |
67.7% |
|
Domestic Borrowings |
688.2 |
851.9 |
704.7 |
82.7% |
780.9 |
90.2% |
|
Other Domestic Financing |
3.2 |
3.2 |
3.5 |
111.1% |
2.9 |
121.2% |
|
Total Financing |
1,561.6 |
1,704.9 |
1,235.7 |
72.5% |
1,562.8 |
79.1% |
|
Recurrent Exchequer issues |
1,302.8 |
1,360.1 |
1,112.8 |
81.8% |
1,246.8 |
89.3% |
|
CFS Exchequer Issues |
1,963.7 |
2,078.8 |
1,594.7 |
76.7% |
1,905.6 |
83.7% |
|
Development Expenditure & Net Lending |
480.8 |
457.2 |
261.1 |
57.1% |
419.1 |
62.3% |
|
County Governments + Contingencies |
385.4 |
385.4 |
287.1 |
74.5% |
353.3 |
81.3% |
|
Total Expenditure |
4,132.7 |
4,281.6 |
3,255.8 |
76.0% |
3,924.8 |
83.0% |
|
Fiscal Deficit excluding Grants |
1,561.6 |
1,704.9 |
1,230.2 |
72.2% |
1,562.8 |
78.7% |
|
Total Borrowing |
1,558.4 |
1,701.7 |
1,232.2 |
72.4% |
1,559.9 |
79.0% |
Amounts in Kshs bns unless stated otherwise
The Key take-outs from the release include;
- Total revenue collected as at the end of May 2024 amounted to Kshs 2,025.6 bn, equivalent to 78.6% of the revised estimates of Kshs 2,576.8 bn for FY’2023/2024 and is 85.8% of the prorated estimates of Kshs 2,362.0 bn. Cumulatively, tax revenues amounted to Kshs 1,928.8 bn, equivalent to 77.3% of the revised estimates of Kshs 2,495.8 bn and 84.3% of the prorated estimates of Kshs 2,287.8 bn,
- Total financing amounted to Kshs 1,235.7 bn, equivalent to 72.5% of the revised estimates of Kshs 1,704.9 bn and is equivalent to 79.1% of the prorated estimates of Kshs 1,562.8 bn. Additionally, domestic borrowing amounted to Kshs 704.7 bn, equivalent to 82.7% of the revised estimates of Kshs 851.9 bn and is 90.2% of the prorated estimates of Kshs 780.9 bn,
- The total expenditure amounted to Kshs 3,255.8 bn, equivalent to 76.0% of the revised estimates of Kshs 4,281.6 bn, and is 83.0% of the prorated target expenditure estimates of Kshs 3,924.8 bn. Additionally, the net disbursements to recurrent expenditures came in at Kshs 1,112.8 bn, equivalent to 81.8% of the revised estimates of Kshs 1,360.1 and 89.3% of the prorated estimates of Kshs 1,246.8 bn,
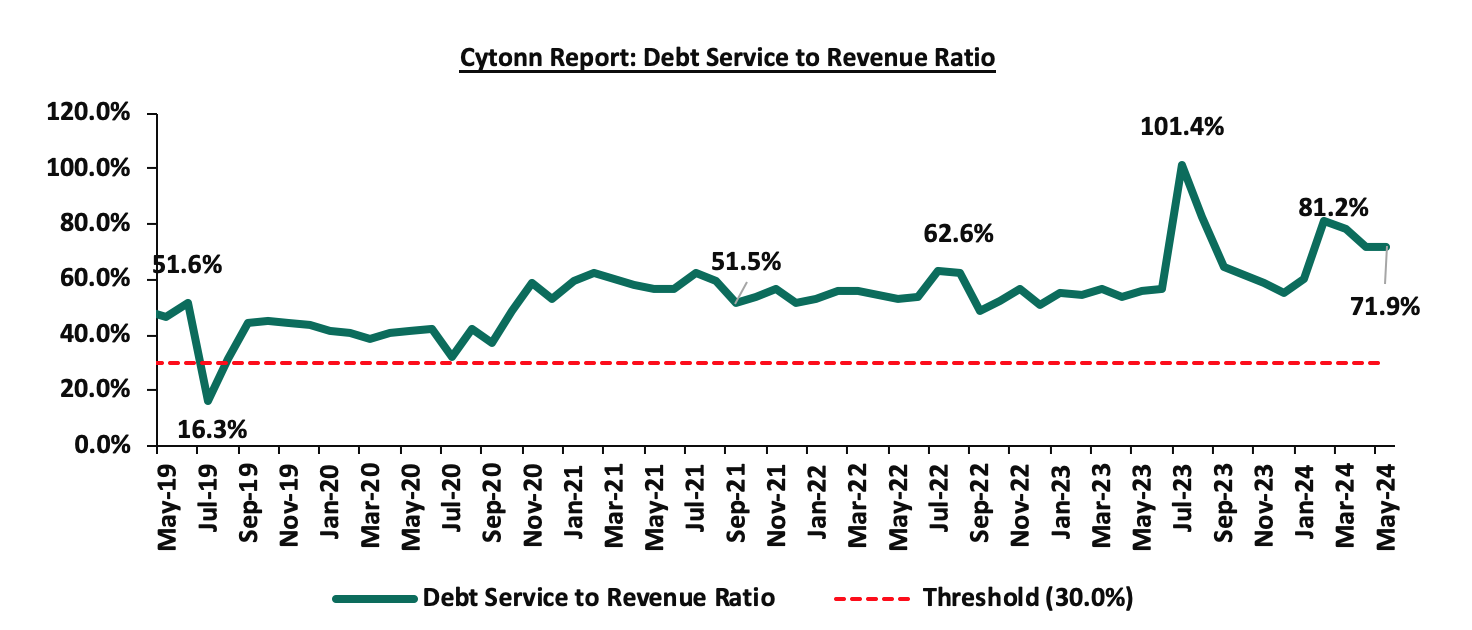
- Consolidated Fund Services (CFS) Exchequer issues came in at Kshs 1,594.7 bn, equivalent to 76.7% of the revised estimates of Kshs 2,078.8 bn, and are 83.7% of the prorated amount of Kshs 1,905.6 bn. The cumulative public debt servicing cost amounted to Kshs 1,455.8 bn which is 78.0% of the revised estimates of Kshs 1,866.0 bn, and is 85.1% of the prorated estimates of Kshs 1,710.5 bn. Additionally, the Kshs 1,455.8 bn debt servicing cost is equivalent to 71.9% of the actual revenues collected as at the end of May 2024. The chart below shows the debt serving to revenue ratio;
- Total Borrowings as at the end of May 2024 amounted to Kshs 1,232.2 bn, equivalent to 72.4% of the revised estimates of Kshs 1,701.7 bn for FY’2023/2024 and are 79.0% of the prorated estimates of Kshs 1,559.9 bn. The cumulative domestic borrowing of Kshs 851.9 bn comprises of Net Domestic Borrowing Kshs 471.4 bn and Internal Debt Redemptions (Rollovers) Kshs 380.5 bn.
The government has been unable to meet its prorated revenue targets for the eleven months of the FY’2023/2024, attaining 85.8% of the revenue targets in May 2024, mainly on the back of the tough economic situation exacerbated by the inflationary pressures which increased by 0.1% points in April to 5.1% from the 5.0% recorded in April, cost of living remains elevated in the country, which continues to impede revenue collection despite an improvement in business environment with the PMI coming in at 51.8 in May from the 50.1 recorded in April 2024. In light of this, the government is yet to fully benefit from the strategies put in place to improve revenue collection such as expanding the revenue base and sealing tax leakages, and suspension of tax relief payments. The coming months' revenue collection performance will largely depend on how quickly the country's business climate stabilizes. This stabilization is expected to be aided by the ongoing appreciation of the Shilling, which gained by 2.3% against the dollar in the month of May, and a further ease in inflationary pressures in the country.
Rates in the Fixed Income market have been on an upward trend given the continued high demand for cash by the government and the occasional liquidity tightness in the money market. The government is 44.5% ahead of its prorated net domestic borrowing target of Kshs 385.8 bn, and 36.9% ahead of the total domestic net borrowing target of Kshs 407.0 bn for FY’2023/2024, having a net borrowing position of Kshs 557.3 bn. However, we expect a downward readjustment of the yield curve in the short and medium term, with the government looking to increase its external borrowing to maintain the fiscal surplus, hence alleviating pressure in the domestic market. As such, we expect the yield curve to normalize in the medium to long-term and hence investors are expected to shift towards the long-term papers to lock in the high returns.
Market Performance:
During the week, the equities market was on a downward trajectory, with NSE 25 and NSE 10 declining the most by 1.2% while NSE 20 and NASI declined by 1.0%, and 0.8% respectively taking the YTD performance to gains of 27.0%, 23.6%, 23.5% and 15.6% for NSE 10, NASI, NSE 25, and NSE 20 respectively. The equities market performance was driven by losses recorded by large-cap stocks such as Co-op Bank, KCB Group, and EABL of 2.9%, 2.7%, and 2.7% respectively. The performance was, however, supported by gains recorded by large-cap stocks such as Standard Chartered Bank, ABSA Bank, and Equity Group of 4.6%, 1.1, and 0.5% respectively.
During the week, equities turnover decreased by 24.8% to USD 10.3 mn from USD 13.8 mn recorded the previous week, taking the YTD total turnover to USD 332.0 mn. Foreign investors remained net buyers for the fourth consecutive week with a net buying position of USD 1.9 mn, from a net buying position of USD 1.5 mn recorded the previous week, taking the YTD foreign net buying position to USD 6.5 mn.
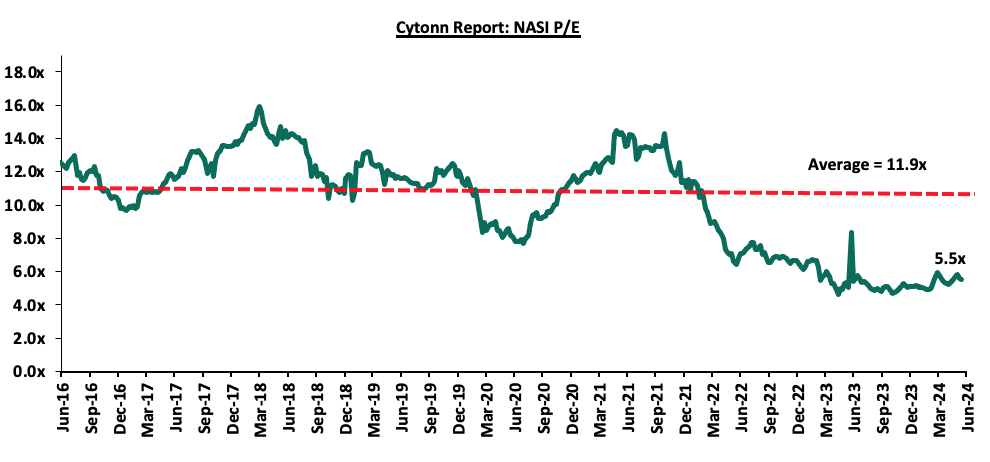
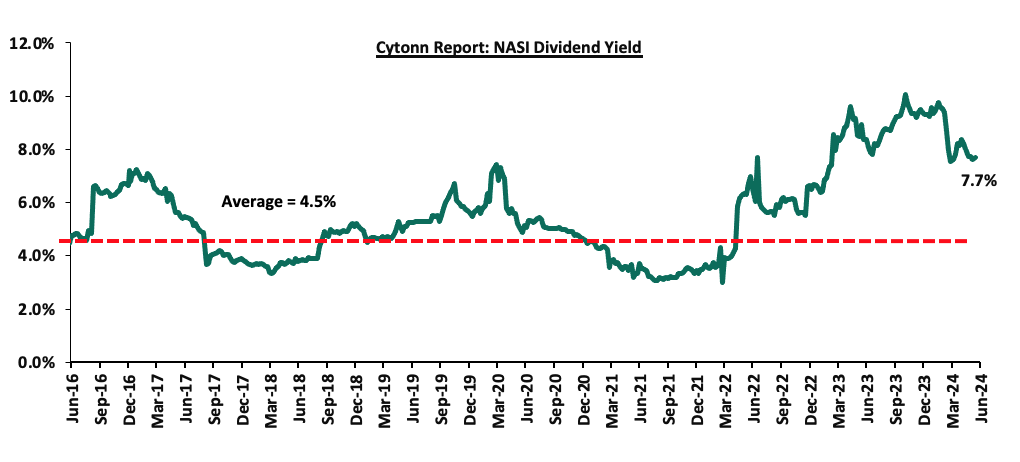
The market is currently trading at a price-to-earnings ratio (P/E) of 5.5x, 53.7% below the historical average of 11.9x. The dividend yield stands at 7.7%, 3.2% points above the historical average of 4.5%. Key to note, NASI’s PEG ratio currently stands at 0.7x, an indication that the market is undervalued relative to its future growth. A PEG ratio greater than 1.0x indicates the market is overvalued while a PEG ratio less than 1.0x indicates that the market is undervalued. The charts below indicate the historical P/E and dividend yields of the market;
Universe of Coverage:
|
Cytonn Report: Equities Universe of Coverage |
||||||||||
|
Company |
Price as at 07/06/2024 |
Price as at 14/06/2024 |
w/w change |
YTD Change |
Year Open 2024 |
Target Price* |
Dividend Yield |
Upside/ Downside** |
P/TBv Multiple |
Recommendation |
|
Jubilee Holdings |
184.5 |
180.0 |
(2.4%) |
(2.7%) |
185.0 |
260.7 |
7.9% |
52.8% |
0.3x |
Buy |
|
Diamond Trust Bank*** |
47.3 |
46.1 |
(2.5%) |
3.0% |
44.8 |
65.2 |
10.8% |
52.3% |
0.2x |
Buy |
|
NCBA*** |
41.9 |
40.8 |
(2.6%) |
5.0% |
38.9 |
55.2 |
11.6% |
46.9% |
0.8x |
Buy |
|
Sanlam |
5.8 |
6.0 |
2.7% |
0.0% |
6.0 |
8.8 |
0.0% |
46.9% |
1.7x |
Buy |
|
Equity Group*** |
43.7 |
43.9 |
0.5% |
28.4% |
34.2 |
60.2 |
9.1% |
46.2% |
0.9x |
Buy |
|
Co-op Bank*** |
13.8 |
13.4 |
(2.9%) |
18.1% |
11.4 |
17.2 |
11.2% |
39.6% |
0.6x |
Buy |
|
Stanbic Holdings |
119.0 |
117.3 |
(1.5%) |
10.6% |
106.0 |
145.3 |
13.1% |
37.0% |
0.8x |
Buy |
|
I&M Group*** |
21.5 |
20.6 |
(4.2%) |
18.1% |
17.5 |
25.5 |
12.4% |
36.2% |
0.4x |
Buy |
|
Kenya Reinsurance |
2.6 |
2.8 |
7.3% |
51.4% |
1.9 |
3.5 |
10.7% |
35.7% |
0.2x |
Buy |
|
ABSA Bank*** |
13.8 |
13.9 |
1.1% |
20.3% |
11.6 |
17.3 |
11.2% |
35.6% |
1.1x |
Buy |
|
CIC Group |
2.2 |
2.2 |
(1.4%) |
(4.8%) |
2.3 |
2.8 |
6.0% |
34.4% |
0.7x |
Buy |
|
Standard Chartered*** |
189.0 |
197.8 |
4.6% |
23.4% |
160.3 |
233.1 |
14.7% |
32.5% |
1.3x |
Buy |
|
KCB Group*** |
36.5 |
35.5 |
(2.7%) |
61.5% |
22.0 |
46.7 |
0.0% |
31.6% |
0.5x |
Buy |
|
Britam |
6.0 |
6.0 |
0.7% |
16.7% |
5.1 |
7.5 |
0.0% |
25.0% |
0.8x |
Buy |
|
Liberty Holdings |
5.8 |
5.9 |
1.4% |
52.3% |
3.9 |
6.1 |
6.3% |
10.1% |
0.4x |
Accumulate |
|
HF Group |
4.5 |
4.2 |
(6.4%) |
22.6% |
3.5 |
4.5 |
0.0% |
6.4% |
0.2x |
Hold |
|
Target Price as per Cytonn Analyst estimates **Upside/ (Downside) is adjusted for Dividend Yield ***For Disclosure, these are stocks in which Cytonn and/or its affiliates are invested in |
||||||||||
We are “Neutral” on the Equities markets in the short term due to the current tough operating environment and huge foreign investor outflows, and, “Bullish” in the long term due to current cheap valuations and expected global and local economic recovery. With the market currently being undervalued for its future growth (PEG Ratio at 0.7x), we believe that investors should reposition towards value stocks with strong earnings growth and that are trading at discounts to their intrinsic value. We expect the current high foreign investors’ sell-offs to continue weighing down the equities outlook in the short term.
- Real Estate Investments Trusts (REITs)
On the Unquoted Securities Platform, Acorn D-REIT and I-REIT traded at Kshs 24.5 and Kshs 22.0 per unit, respectively, as of 14th June 2024. The performance represented a 22.5% and 10.0% gain for the D-REIT and I-REIT, respectively, from the Kshs 20.0 inception price. The volumes traded for the D-REIT and I-REIT came in at 12.3 mn and 30.7 mn shares, respectively, with a turnover of Kshs 257.5 mn and Kshs 633.8 mn, respectively, since inception in February 2021.
REITs provide various benefits like tax exemptions, diversified portfolios, and stable long-term profits. However, the continuous deterioration in the performance of Kenyan REITs and the restructuring of their business portfolios is hampering major investments that had previously been made. The other general challenges include; i) inadequate comprehension of the investment instrument among investors, ii) prolonged approval processes for REIT creation, iii) high minimum capital requirements of Kshs 100.0 mn for trustees, and, iv) minimum investment amounts set at Kshs 5.0 mn, continue to limit the performance of the Kenyan REITs market.
We expect the performance of Kenya’s real estate sector to be supported by: i) increased investment by local and international players, ii) Nairobi’s recognized position as a regional hub, which will spur growth, especially in the commercial office sector, iii) relatively positive demographics in the country necessitating demand for housing and real estate, and iv) continued infrastructural improvements opening up new areas for investments. However, factors such as rising construction costs, strain on infrastructure development like drainage systems, limited investor knowledge in REITs, and existing oversupply in select real estate sectors will continue to hinder the optimal performance of the sector by limiting developments and investments.
Following the release of the Q1’2024 results by Kenyan listed banks, the Cytonn Financial Services Research Team undertook an analysis on the financial performance of the listed banks and identified the key factors that shaped the performance of the sector. For the earnings notes of the various banks, click the links below:
- Equity Group Q1’2024 Earnings Note
- KCB Group Q1’2024 Earnings Note
- Standard Chartered Bank Kenya Q1’2024 Earnings Note
- ABSA Bank Kenya Q1’2024 Earnings Note
- NCBA Group Q1’2024 Earnings Note
- Co-operative Bank Q1’2024 Earnings Note
- Diamond Trust Bank Kenya (DTB-K) Q1’2024 Earnings Note
- I&M Group Holdings Q1’2024 Earnings Note
- Stanbic Holdings Q1’2024 Earnings Note
- HF Group Q1’2024 Earnings Note
The core earnings per share (EPS) for the listed banks recorded a weighted growth of 29.8% in Q1’2024, compared to a weighted growth of 25.0% recorded in Q1’2023, an indication of sustained performance supported by improved operating environment experienced in Q1’2024 on the back of easing inflationary pressures and a strengthening Shilling. Notably, the inflation rate in Q1’2024 averaged 6.3%, 2.8% points lower than the 9.1% average in Q1’2023, with the Kenyan Shilling having appreciated by 15.8% against the USD in Q1’2024. The performance in Q1’2024 was supported by a 22.8% growth in net interest income coupled with a 10.9% growth in non-funded income. The softer growth in NFI was partly driven by the decrease in foreign exchange income recorded by the banks during the period as a result of decreased dollar demand in the country. Additionally, the asset quality of listed banks deteriorated, with the weighted average Gross Non-Performing Loan ratio (NPL) increasing by 0.9% points to 13.5%, from 12.6% recorded in Q1’2023. The performance remained 2.5% points above the ten-year average of 11.0%.
The report is themed “Improved Profitability Owing to Strengthened Business Environment” where we assess the key factors that influenced the performance of the banking sector in Q1’2024, the key trends, the challenges banks faced, and areas that will be crucial for growth and stability of the banking sector going forward. As such, we shall address the following:
- Key Themes that Shaped the Banking Sector Performance in Q1’2024,
- Summary of the Performance of the Listed Banking Sector in Q1’2024,
- The Focus Areas of the Banking Sector Players Going Forward, and,
- Brief Summary and Ranking of the Listed Banks based on the outcome of our analysis
Section I: Key Themes That Shaped the Banking Sector Performance in Q1’2024
In this section, we will highlight the main factors influencing the banking sector in Q1’2024. These include regulation, digitization, interest rates, regional expansion through mergers and acquisitions, and asset quality:
- Regulation:
- Risk-based Lending: Over the years, the government has used various policy tools to curb the increasing interest rates and promote access to credit by the private sector. As such, after the repeal of the Interest Cap Law in 2019, the Central Bank of Kenya (CBK) intervened administratively by halting banks from repricing their loans. Instead, banks were required to develop and submit new risk-based lending formulas for approval. The model's primary purpose is to instill fairness and transparency in the credit pricing decisions as it allows Banks to price based on a customer’s risk profile. This represents a shift from the traditional practice of rejecting loan applicants solely based on their credit scores. The new credit scoring system primarily targets borrowers with higher risks, many of whom are micro, small, and medium-sized enterprises facing challenges in accessing traditional credit. As of June 2023, 33 out of the 38 banks in the country had their models approved by the CBK, with Equity Bank being the first commercial bank to implement risk-based lending. However, the approval process of the models has been gradual in a bid to avoid causing distress to customers through high interest rates. Further, the full deployment has been slowed due to inadequate data to analyse the client's risk profile,
- Digitization: In Q1'2024, digitization continued to be a transformative force in the banking sector, significantly improving how banks operate and deliver services. There has been a significant increase in the adoption of mobile and online banking platforms as customers now prefer to perform banking transactions from the comfort of their homes, leading to a decline in the use of physical branches. For instance, most of the listed banks disclosed that the majority of transactions were conducted through alternative channels, with KCB Group and Cooperative Bank reporting that 99.0% and 93.0% of their transactions, respectively, were done through non-branch channels in Q1’2024,
- Interest Rates: Interest rates remained high in Q1'2024 compared to the same period in 2023. Notably, the yields on Kenyan government securities were on an upward trajectory in Q1'2024, with the yield on the 91-day paper averaging 16.7% during the quarter, 7.1% points higher than the average of 9.6% in Q1'2023. The elevated rates led to a significant increase in the listed bank’s interest income, rising to a weighted average of 35.3% in Q1'2024 from a weighted average of 26.2% in Q1'2023. Additionally, interest expense increased to a weighted average of 64.7% in Q1'2024, up from 40.2% in Q1'2023,
- Regional Expansion through Mergers and Acquisitions: Kenyan banks are looking at having an extensive regional reach. In Q1’2024, there was one acquisition agreement announcement between Access Bank plc and KCb Group:
- On March 20, 2024 Access Bank Plc announced that it had entered into a share purchase agreement with KCB Group Plc that would allow Access Bank Plc to acquire 100% shareholding in National Bank of Kenya Limited (NBK) from KCB. Access Bank Plc is a wholly owned subsidiary of Access Holdings Plc listed on the Nigerian Exchange as Access Corporation. Notably, KCB Bank had acquired the National Bank of Kenya back in 2019 in a rescue deal that was supervised by the Central Bank of Kenya. The announcement follows the release of the FY’2023 results for the KCB group, which revealed a decline in earnings with its Core earnings per share (EPS) declining by 8.3% to Kshs 11.7, from Kshs 12.7 in FY’2022. The transaction represents an important milestone for Access Bank as it moves closer to the achievement of its five-year strategic plan through increased scale in the Kenyan market. In the signed deal, Access Bank will pay multiples of 1.3x the book value of NBK, which stood at Kshs 10.6 bn as of end December 2023. This values the deal at about Kshs 13.3 bn with the actual figure to be announced when the transaction is completed. For more information, please see our Cytonn Weekly #12/2024,
- In April 2024, Sidian Bank disclosed that the founders of the bank and other nine individual shareholders relinquished a combined stake of 728,525 shares representing 16.6% stake to Pioneer General Insurance Limited, pioneer Life Investments Limited, Wizro Enterprises Limited, Afrah Limited, and Telesec Africa Limited. The transaction amounted to Kshs 0.8 bn translating to a price to book multiple (p/bv) of 1.0x. This follows an earlier transaction executed on October 2023 when Pioneer General Insurance, Wizpro Enterprise and Afram Limited bought 38.9% stake in the lender following a shareholders’ resolution passed on 20th September 2023 approving the sale.
The following are Mergers and Acquisitions that were completed in 2023:
- On January 30, 2023, the Central Bank of Kenya (CBK) announcedthat Commercial International Bank (Egypt) S.A.E (CIB) had completed the acquisition of an additional 49.0% shareholding of Mayfair CIB Bank Limited (MBL) at Kshs 5.0 bn following the earlier acquisition of 51.0% stake in MBL announced in April 2020. Consequently, MBL is now a fully owned subsidiary of CIB,
- On January 30, 2023, Equity Group Holdings , through Equity Bank Kenya Limited (EBKL) announced that it had completed the acquisition of certain assets and liabilities of the local Bank, Spire Bank Limited after obtaining all the required regulatory approvals. The completion of the acquisition followed the Assets and Liabilities Purchase Agreement, which was announced in September 2022, as highlighted in our Cytonn Weekly #37/2022. As such, Equity Bank Kenya Limited took over Spire Bank’s 12 branches as well as all existing depositors in Spire Bank, other than remaining deposits from its largest shareholder, Mwalimu Sacco. For more information, please see our Cytonn Monthly-January 2023,
- On March 17, 2023, the Central Bank of Kenya (CBK) announced that Premier Bank Limited Somalia (PBLS) had completed the acquisition of 62.5% shareholding of First Community Bank Limited (FCB) effective 27 March 2023. This came after receiving regulatory approvals from the CBK and the Cabinet Secretary for the National Treasury. FCB, which has been in operation since June 2008, is classified as a tier 3 bank in Kenya with 18 branches and a market share of 0.3% as at December 2022. The acquisition by Premier Bank Limited Somalia (PBLS), came at a time when FCB has been struggling to meet regulatory Capital adequacy requirements. For more information, please see our Cytonn Weekly #11/2023,
- On May 22, 2023, the Central Bank of Kenya (CBK) announced that Shorecap III, LP, a Private Equity fund governed by the laws of Mauritius, had acquired a 20.0% stake in Credit Bank Plc. The fund is managed by Equator Capital Partners LLC and the acquisition took effective from June 15, 2023. While the CBK did not reveal the value of the deal, Shorecap III, LP will assume control of 7,289,928 ordinary shares, which make up 20.0% of the Bank’s ordinary shares. For additional details, refer to our Cytonn Weekly #21/2023,
- On December 1, 2023 Equity Group Holdings Plc (EGH) announced that it had successfully completed the acquisition of its Rwandan Subsidiary, Compagnie Générale de Banque (Cogebanque) Plc, marking a significant milestone in its regional expansion strategy. Equity Group now holds 198,250 shares representing 99.1% of the issued share capital of COGEBANQUE, following receipt of all regulatory and corporate approvals, officially making COGEBANQUE its subsidiary. EGH made the announcement it had entered into a binding agreement with the Government of Rwanda, Rwanda Social Security Board, and other investors of Compagnie Generale De Banque (Cogebanque) Plc Limited to acquire a 91.9% stake in the Rwanda based lender on June 14, 2023. Notably, EGH signed a share purchase agreement with the Sellers on July 28, 2023, committing to buy 183,854 shares at a rate of 297,406 Rwandan Francs per share upon completion on December 1, 2023, giving EGH ownership of 99.1% of the issued share capital. Concurrently, EGH proposed to purchase all outstanding shares from the other shareholders of Cogebanque, aiming to own up to 100% of Cogebanque’s issued shares,
Below is a summary of the deals in the last 10 years that have either happened, been announced or expected to be concluded:
|
Cytonn Report: Banking Sector Deals and Acquisitions |
||||||
|
Acquirer |
Bank Acquired |
Book Value at Acquisition (Kshs bn) |
Transaction Stake |
Transaction Value (Kshs bn) |
P/Bv Multiple |
Date |
|
Pioneer General Insurance and four other companies |
Sidian Bank |
5.0 |
16.57% |
0.8 |
1.0x |
Apr-24 |
|
Access Bank PLC (Nigeria)* |
National Bank of Kenya |
10.6 |
100.00% |
13.3 |
1.3x |
Mar-24* |
|
Pioneer General Insurance and two other companies |
Sidian Bank |
5.0 |
38.91% |
2.0 |
1.0x |
Oct-23 |
|
Equity Group |
Cogebanque PLC ltd |
5.7 |
91.13% |
6.7 |
1.3x |
Dec-23 |
|
Shorecap III |
Credit Bank Plc |
3.0 |
20.00% |
Undisclosed |
N/A |
Jun-23 |
|
Premier Bank Limited |
First Community Bank |
2.8 |
62.50% |
Undisclosed |
N/A |
Mar-23 |
|
KCB Group PLC |
Trust Merchant Bank (TMB) |
12.4 |
85.00% |
15.7 |
1.5x |
Dec-22 |
|
Equity Group |
Spire Bank |
Unknown |
Undisclosed |
Undisclosed |
N/A |
Sep-22* |
|
Access Bank PLC (Nigeria)* |
Sidian Bank |
4.9 |
83.40% |
4.3 |
1.1x |
June-22* |
|
KCB Group |
Banque Populaire du Rwanda |
5.3 |
100.00% |
5.6 |
1.1x |
Aug-21 |
|
I&M Holdings PLC |
Orient Bank Limited Uganda |
3.3 |
90.00% |
3.6 |
1.1x |
Apr-21 |
|
KCB Group** |
ABC Tanzania |
Unknown |
100.00% |
0.8 |
0.4x |
Nov-20* |
|
Co-operative Bank |
Jamii Bora Bank |
3.4 |
90.00% |
1 |
0.3x |
Aug-20 |
|
Commercial International Bank |
Mayfair Bank Limited |
1.0 |
51.00% |
Undisclosed |
N/A |
May-20* |
|
Access Bank PLC (Nigeria) |
Transnational Bank PLC. |
1.9 |
100.00% |
1.4 |
0.7x |
Feb-20* |
|
Equity Group ** |
Banque Commerciale Du Congo |
8.9 |
66.50% |
10.3 |
1.2x |
Nov-19* |
|
KCB Group |
National Bank of Kenya |
7.0 |
100.00% |
6.6 |
0.9x |
Sep-19 |
|
CBA Group |
NIC Group |
33.5 |
53%.47% |
23 |
0.7x |
Sep-19 |
|
Oiko Credit** |
Credit Bank |
3.0 |
22.80% |
1 |
1.5x |
Aug-19 |
|
CBA Group** |
Jamii Bora Bank |
3.4 |
100.00% |
1.4 |
0.4x |
Jan-19 |
|
AfricInvest Azure |
Prime Bank |
21.2 |
24.20% |
5.1 |
1.0x |
Jan-18 |
|
KCB Group |
Imperial Bank |
Unknown |
Undisclosed |
Undisclosed |
N/A |
Dec-18 |
|
SBM Bank Kenya |
Chase Bank Ltd |
Unknown |
75.00% |
Undisclosed |
N/A |
Aug-18 |
|
DTBK |
Habib Bank Kenya |
2.4 |
100.00% |
1.8 |
0.8x |
Mar-17 |
|
SBM Holdings |
Fidelity Commercial Bank |
1.8 |
100.00% |
2.8 |
1.6x |
Nov-16 |
|
M Bank |
Oriental Commercial Bank |
1.8 |
51.00% |
1.3 |
1.4x |
Jun-16 |
|
I&M Holdings |
Giro Commercial Bank |
3.0 |
100.00% |
5 |
1.7x |
Jun-16 |
|
Mwalimu SACCO |
Equatorial Commercial Bank |
1.2 |
75.00% |
2.6 |
2.3x |
Mar-15 |
|
Centum |
K-Rep Bank |
2.1 |
66.00% |
2.5 |
1.8x |
Jul-14 |
|
GT Bank |
Fina Bank Group |
3.9 |
70.00% |
8.6 |
3.2x |
Nov-13 |
|
Average |
|
|
73.3% |
|
1.3x |
|
|
Average: 2013 to 2018 |
|
|
73.5% |
|
1.7x |
|
|
Average: 2019 to 2024 |
|
|
73.2% |
|
1.0x |
|
|
* Announcement Date ** Deals that were dropped |
||||||
In Q1’2024, the average acquisition valuations for banks have remained unchanged at 1.3x, similar to what was recorded in Q1’2023. As such, the valuations still remain low compared to historical prices paid, as highlighted in the chart below;
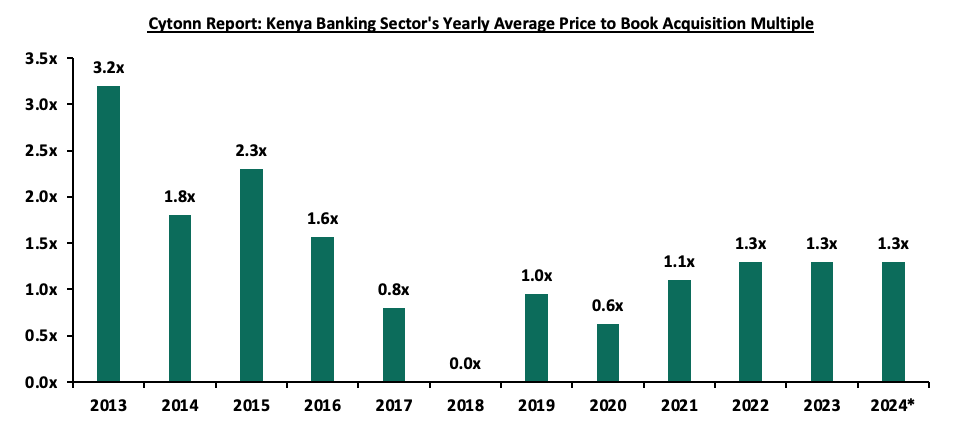
*Figure as of end Q1’2024
As at the end of Q1’2024, the number of commercial banks in Kenya stood at 38, same as in Q1’2023 but lower than the 43 licensed banks in FY’2015. The ratio of the number of banks per 10 million population in Kenya now stands at 6.8x, which is a reduction from 9.0x in FY’2015, demonstrating continued consolidation in the banking sector. However, despite the ratio improving, Kenya still remains overbanked as the number of banks remains relatively high compared to the African major economies. To bring the ratio to 5.5x, we ought to reduce the number of banks from the current 38 banks to about 30 banks. For more on this see our topical.The chart below shows the commercial bank ratio per 10 million people across select African nations in comparison to Kenya;
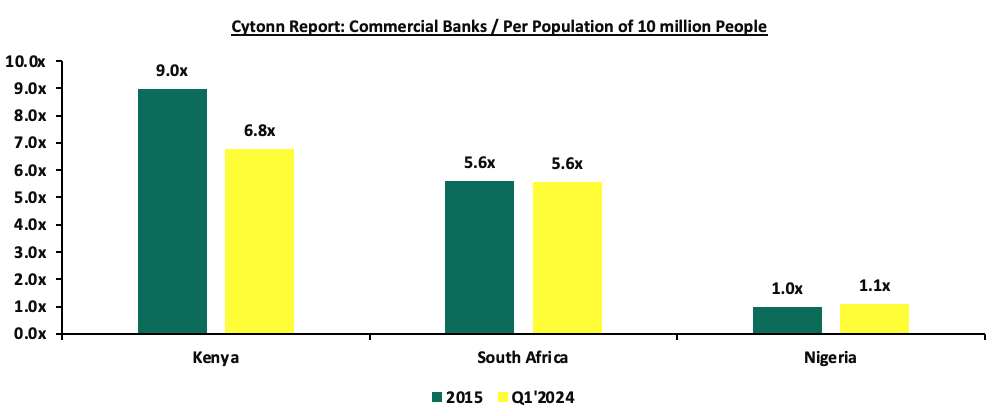
Source: World Bank, Central Bank of Kenya, South Africa Reserve Bank, Central Bank of Nigeria
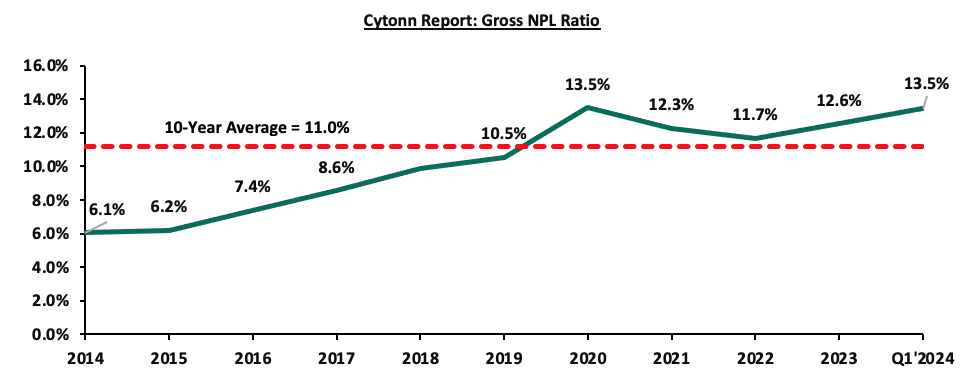
- Asset Quality: Asset quality for listed banks deteriorated in Q1’2024, with the weighted average Gross Non-Performing Loan ratio (NPL) increasing by 0.9% points to 13.5%, from 12.6% recorded in Q1’2023. The performance remained 2.5% points above the ten-year average of 11.0%. The deterioration in asset quality in Q1’2024 was mainly driven by the 4.2% points increase in Equity Group’s NPL ratio to 14.2%, from 10.0% in Q1’2023, coupled with the 4.2% points increase in HF Group’s NPL ratio to 24.1% from 19.9% in Q1’2023. The deterioration in Equity Group asset quality was mainly attributable to 50.0% increase in Gross non-performing loans to Kshs 120.4 bn in Q1’2024 from Kshs 80.3 bn in Q1’2023, which outpaced the 5.4% increase in gross loans to Kshs 849.4 bn from Kshs 806.1 bn recorded in Q1’2023. The chart below highlights the asset quality trend for the listed banks:
However, the deterioration in listed banks asset quality was mitigated by an improvement in Standard Chartered Bank’s Asset quality, with Gross NPL ratio decreasing by 4.5% points to 9.9% in Q1’2024 from 14.4% in Q1’2023, attributable to the 26.9% decrease in gross non-performing loans to Kshs 16.5 bn, from Kshs 22.6 bn in Q1’2023, compared to the 6.8% increase in gross loans to Kshs 167.4 bn, from Kshs 156.7 bn recorded in Q1’2023. A total of three out of the ten listed Kenyan banks recorded improvement in asset quality, owing to the improvement in the economic environment as evidenced by the Q1’2024 Purchasing Managers Index (PMI) which averaged at 50.3 which was above the 50.0 points no change threshold, and above the 49.3 average in Q1’2023. Going forward, we expect credit risk to decline gradually but remain at relatively elevated levels compared to previous years mainly on the back of the improved business environment owing to the eased inflationary pressures as well as the appreciation of the Kenya shilling.
The table below highlights the asset quality for the listed banking sector:
|
Cytonn Report: Listed Banks Asset Quality |
||||||
|
|
Q1'2024 NPL Ratio* |
Q1'2023 NPL Ratio** |
% point change in NPL Ratio |
Q1'2024 NPL Coverage* |
Q1'2023 NPL Coverage** |
% point change in NPL Coverage |
|
Stanbic Bank |
8.9% |
11.7% |
(2.9%) |
72.3% |
66.7% |
5.6% |
|
Standard Chartered Bank |
9.9% |
14.4% |
(4.5%) |
83.7% |
86.8% |
(3.1%) |
|
I&M Group |
10.8% |
10.6% |
0.3% |
58.3% |
65.8% |
(7.5%) |
|
Absa Bank |
11.1% |
9.4% |
1.6% |
62.3% |
63.9% |
(1.6%) |
|
NCBA |
11.7% |
12.8% |
(1.1%) |
55.7% |
56.8% |
(1.0%) |
|
Equity Group |
14.2% |
10.0% |
4.2% |
58.3% |
62.0% |
(3.8%) |
|
Diamond Trust Bank |
14.9% |
12.3% |
2.7% |
44.0% |
45.9% |
(1.8%) |
|
Co-operative Bank of Kenya |
15.9% |
14.1% |
1.8% |
58.6% |
62.2% |
(3.6%) |
|
KCB Group |
17.9% |
17.1% |
0.8% |
62.0% |
57.3% |
4.8% |
|
HF Group |
24.1% |
19.9% |
4.2% |
74.4% |
81.4% |
(7.0%) |
|
Mkt Weighted Average |
13.5% |
12.6% |
0.8% |
62.7% |
63.7% |
(1.0%) |
|
*Market cap weighted as at 13/06/2024 |
||||||
|
**Market cap weighted as at 15/06/2023 |
||||||
Key take-outs from the table include;
- Asset quality for the listed banks deteriorated in Q1’2024, with market weighted average NPL increasing by 0.9% points to 13.5% from a 12.6% in Q1’2023. The worsening of asset quality was mainly driven by a deterioration in Equity Group, HF Group, Diamond trust Bank, Coop Bank and ABSA Bank Kenya’s asset quality with their NPL ratio increasing by 4.2%, 4.2%, 2.7%, 1.8% and 1.6% points respectively,
- Equity Group and HF Group had the highest NPL ratio jumps by 4.2% points each to 14.2% and 24.1%, from 10.0% and 19.9% respectively in Q1’2023. Equity Group’s increase in NPL ratio was attributable to 50.0% increase in Gross non-performing loans to Kshs 120.4 bn in Q1’2024 from Kshs 80.3 bn in Q1’2023, which outpaced the 5.4% increase in gross loans to Kshs 849.4 bn from Kshs 806.1 bn recorded in Q1’2023, and,
- Market weighted average NPL Coverage for the listed banks decreased marginally by 1.0% points to 62.7% in Q1’2024, from 63.7% recorded in Q1’2023, majorly on the back of decreased NPL coverage recorded by I&M Holdings, HF Group, Equity Group, Co-op Bank, Standard Chartered Bank, Diamond trust Bank and ABSA Bank of Kenya by 7.5%, 7.0%, 3.8%, 3.6%, 3.1%, 1.8% and 1.6% points respectively in Q1’2024. However, the NPL coverage ratios of Stanbic bank and KCB Group increased by 5.6% points and 4.8% points to 72.3% and 74.4% respectively in Q1’2024.
Section II: Summary of the Performance of the Listed Banking Sector in Q1’2024:
The table below highlights the performance of the banking sector, showing the performance using several metrics, and the key take-outs of the performance;
|
Cytonn Report: Kenyan Listed Banks Performance Q1’2024 |
||||||||||||||||
|
Bank |
Core EPS Growth |
Interest Income Growth |
Interest Expense Growth |
Net Interest Income Growth |
Net Interest Margin |
Non-Funded Income Growth |
NFI to Total Operating Income |
Growth in Total Fees & Commissions |
Deposit Growth |
Growth in Government Securities |
Loan to Deposit Ratio |
Loan Growth |
Return on Average Equity |
Cost of Funds |
YIEA |
|
|
Equity |
25.2% |
32.7% |
41.4% |
28.4% |
8.2% |
21.0% |
44.4% |
22.6% |
11.3% |
16.2% |
63.0% |
3.0% |
23.8% |
4.2 |
12.3% |
|
|
KCB |
69.0% |
46.0% |
56.0% |
40.8% |
7.4% |
17.8% |
35.9% |
2.4% |
25.4% |
39.6% |
67.8% |
9.5% |
20.1% |
4.6% |
11.6% |
|
|
Co-operative |
7.7% |
24.7% |
60.8% |
8.6% |
7.8% |
(0.3%) |
37.7% |
(7.3%) |
14.8% |
11.7% |
78.5% |
5.0% |
19.7% |
5.1% |
12.3% |
|
|
ABSA Bank |
33.6% |
33.8% |
74.4% |
21.7% |
9.7% |
12.7% |
30.8% |
5.1% |
14.2% |
(21.2%) |
92.1% |
5.4% |
25.0% |
4.7% |
13.4% |
|
|
Standard Chartered |
39.5% |
25.4% |
78.0% |
20.0% |
8.6% |
23.9% |
36.7% |
17.0% |
1.0% |
(27.5%) |
50.2% |
12.0% |
24.0% |
1.2% |
9.6% |
|
|
NCBA Group |
4.7% |
29.8% |
70.8% |
(1.2%) |
6.0% |
7.4% |
48.3% |
16.9% |
9.7% |
(14.0%) |
58.5% |
11.6% |
23.2% |
6.5% |
12.2% |
|
|
Stanbic Holdings |
2.8% |
53.9% |
130.2% |
19.6% |
8.4% |
(34.0%) |
36.9% |
(10.4%) |
22.2% |
(28.4%) |
71.9% |
11.1% |
20.8% |
4.5% |
13.3% |
|
|
I&M Group |
35.4% |
53.1% |
76.0% |
37.7% |
8.0% |
(9.4%) |
27.4% |
24.4% |
18.2% |
0.8% |
75.9% |
13.1% |
15.0% |
6.3% |
14.5% |
|
|
DTB-K |
11.0% |
20.0% |
36.8% |
6.2% |
5.7% |
31.8% |
34.3% |
42.7% |
5.1% |
(12.4%) |
63.3% |
(0.5%) |
11.2% |
6.0% |
11.4% |
|
|
HF Group |
80.4% |
28.5% |
52.4% |
7.6% |
5.4% |
40.7% |
36.3% |
56.0% |
6.2% |
6.4% |
87.1% |
3.1% |
5.1% |
6.3% |
11.4% |
|
|
Q1’2024 Mkt Weighted Average* |
29.8% |
35.3% |
64.7% |
22.8% |
8.0% |
10.9% |
38.6% |
10.7% |
14.1% |
3.1% |
68.4% |
7.5% |
21.9% |
4.5% |
12.2% |
|
|
Q1’2023 Mkt Weighted Average** |
25.0% |
26.2% |
40.2% |
20.1% |
7.3% |
48.1% |
41.3% |
30.0% |
19.0% |
(1.2%) |
73.1% |
19.6% |
22.1% |
|||
|
*Market cap weighted as at 13/06/2024 |
|
|||||||||||||||
|
**Market cap weighted as at 15/06/2023 |
|
|||||||||||||||
Key takeaways from the table include:
- The listed banks recorded an 29.8% growth in core Earnings per Share (EPS) in Q1’2024, compared to the weighted average growth of 25.0% in Q1’2023, an indication of sustained performance supported by improved operating environment experienced in Q1’2024 on the back of easing inflationary pressures and a strengthening Shilling. The performance during the period was mainly supported by a 22.8% weighted average growth in net interest income, coupled with a 10.9% weighted average growth in non-funded income,
- Growth in government securities investments by listed banks increased in Q1’2024, having recorded a market-weighted average growth of 3.1%, from the 1.2% growth decline recorded in Q1’2023, with 5 of the 10 listed banks recording an improvement in government securities investments. The improved investment in Kenya government securities was partly attributable to the reduced perceived risk of default by the government, following the February Eurobond buyback which removed default risk of the June 2024 Eurobond maturity by the government,
- The listed banks’ Net loans and advances to customers recorded a weighted average growth of 7.5% in Q1’2024, a decline from the 19.6% growth recorded in Q1’2023, an indication of decreased lending attributable to the elevated credit risk following the continued implementation of risk-based lending by the banks and increased borrowing costs,
- Interest income recorded a weighted average growth of 35.3% in Q1’2024, compared to 26.2% in Q1’2023. Similarly, interest expenses recorded a market-weighted average growth of 64.7% in Q1’2024 compared to a growth of 40.2% in Q1’2023. Consequently, net interest income recorded a weighted average growth of 22.8% in Q1’2024, an increment from the 20.1% growth recorded in Q1’2023,
- Notably, non-funded income growth softened during the quarter, as evidenced by non-funded income weighted average growth of 10.9% in Q1’2024 compared to a weighted average growth of 48.1% in Q1’2023. The performance was largely supported by the decrease in foreign exchange income recorded by the banks during the period as a result of decreased dollar demand in the country. Additionally, listed banks recorded a weighted average growth of 10.7% in total fees and commissions income in Q1’2024 compared to a weighted growth of 30.0% in Q1’2023, and,
- The listed banks recorded a 21.9% weighted average growth on return on average equity (RoaE), 0.2% points lower than the 22.1% growth registered in Q1’2023. Additionally, the entire banking sector’s Return On Equity (ROE) stood at 0% as of December 2023, a 2.0% points decrease from the 25.0% recorded in September 2023. On a global level, the Kenyan banking sector continues to record high profitability compared to other economies in the world, as highlighted in the chart below:
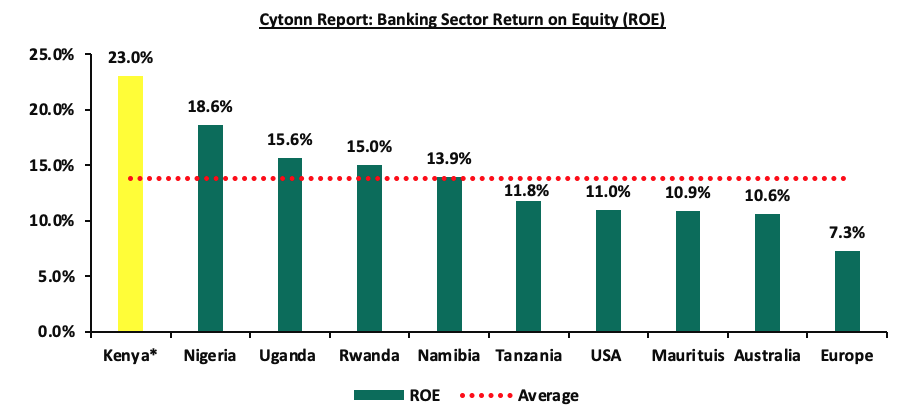
Source: Cytonn research, * Figure as of December 2023
Section III: The Focus Areas of the Banking Sector Players Going Forward:
The banking sector continues to remain resilient despite the tough operating environment as evidenced by the increase in their profitability, with the Core Earnings Per Share (EPS) growing by 29.8%, as banks continued to implement their revenue diversification strategies. Notably, 7 out of the 10 listed banks recorded a significant growth in their Non-funded income in Q1’2024. Additionally, we believe that the possibly improved business environment occasioned by ease in inflationary pressures and a stronger Shilling, coupled with the end of the uncertainty surrounding the June 2024 Eurobond Maturity following the buyback, will see banks start to decrease their provisioning to cushion themselves from credit risk. To note, growth in general provisions for the listed banks recorded a reduced weighted average growth of 14.5% in Q1’2024, compared to a growth of 20.3% in FY’2023. Based on the current operating environment, we believe the future performance of the banking sector will be shaped by the following key factors:
- Growth in Interest income: Going forward, we expect interest income growth to remain a key driver in the banking industry, evidenced by the significant 29.8% growth recorded in Q1’2024, higher than the 25.0% growth recorded in Q1’2023, partly on the back of continued high borrowing costs. Furthermore, the continued approval of banks’ risk-based lending models will enable banks to effectively price their risk, expand loan books, and consequently increase their interest income,
- Revenue Diversification: In Q1’2024, non-funded income (NFI) recorded a 10.9% weighted average growth, slower than the 48.1% weighted growth in Q1’2023 with 7 out of the 10 listed Banks recording an increase in their non-funded income. As a result of the reduced growth in non-funded income, the weighted average contribution of NFI to total operating income came in at 38.6% in Q1’2024, 2.7% points lower than the 41.3% weighted average growth contribution recorded in Q1’2023. As such, there exists an opportunity for the sector to further increase NFI contributions to revenue given the continuous adoption of digitization, and,
- Regional Expansion and Further Consolidation: Consolidation remains a key theme going forward with the current environment offering opportunities for larger banks with a sufficient capital base to expand and take advantage of the market's low valuations, as well as further consolidate out smaller and weaker banks. Notably, the majority of the bigger banks have continued to cushion over unsystematic risks specific to the local market by expanding their operations into other African nations. Banks such as KCB and Equity Group have been leveraging on expansion and consolidation which has largely contributed to their increased asset base as well as earnings growth. As aforementioned, Equity Group recently announced the completion of the acquisition of Compagnie Générale de Banque (Cogebanque) Plc, marking a significant milestone in its regional expansion strategy. As such, we expect to see a continued expansion trend aimed at revenue optimization.
Section IV: Brief Summary and Ranking of the Listed Banks:
As per our analysis of the banking sector from a franchise value and a future growth opportunity perspective, we carried out a comprehensive ranking of the listed banks. For the franchise value ranking, we included the earnings and growth metrics as well as the operating metrics shown in the table below in order to carry out a comprehensive review of the banks:
|
Cytonn Report: Listed Banks Earnings, Growth and Operating Metrics Q1’2024 |
||||||||
|
Bank |
Loan to Deposit Ratio |
Cost to Income (With LLP) |
Return on Average Capital Employed |
Deposits/ Branch (bn) |
Gross NPL Ratio |
NPL Coverage |
Tangible Common Ratio |
Non-Funded Income/Revenue |
|
Absa Bank |
92.1% |
48.5% |
25.0% |
4.3 |
11.1% |
62.3% |
14.9% |
30.8% |
|
NCBA Group |
58.5% |
59.1% |
23.2% |
5.0 |
11.7% |
55.7% |
13.2% |
48.3% |
|
Equity Bank |
63.0% |
59.2% |
23.8% |
3.1 |
14.2% |
58.3% |
11.7% |
44.4% |
|
KCB Group |
67.8% |
56.4% |
20.1% |
2.5 |
17.9% |
62.0% |
10.9% |
35.9% |
|
SCBK |
50.2% |
41.6% |
24.0% |
12.2 |
9.9% |
83.7% |
16.2% |
36.7% |
|
Coop Bank |
78.5% |
52.5% |
19.7% |
2.5 |
15.9% |
58.6% |
17.1% |
37.7% |
|
Stanbic Bank |
71.9% |
46.8% |
20.8% |
11.9 |
8.9% |
72.3% |
12.5% |
36.9% |
|
DTBK |
63.3% |
63.1% |
11.2% |
2.8 |
14.9% |
44.0% |
12.4% |
34.3% |
|
I&M Holdings |
75.9% |
57.5% |
16.0% |
4.1 |
10.8% |
58.3% |
15.3% |
27.4% |
|
HF Group |
87.1% |
85.1% |
5.1% |
2.0 |
24.1% |
74.4% |
14.0% |
36.3% |
|
FY'2023 Weighted Average |
68.4% |
54.0% |
21.9% |
4.9 |
13.5% |
62.7% |
13.5% |
38.6% |
|
Market cap weighted as at 13/06/2024 |
||||||||
The overall ranking was based on a weighted average ranking of Franchise value (accounting for 60.0%) and intrinsic value (accounting for 40.0%). The Intrinsic Valuation is computed through a combination of valuation techniques, with a weighting of 40.0% on Discounted Cash-flow Methods, 35.0% on Residual Income, and 25.0% on Relative Valuation, while the Franchise ranking is based on a bank’s operating metrics, meant to assess efficiency, asset quality, diversification, and profitability, among other metrics. The overall Q1’2024 ranking is as shown in the table below:
|
Cytonn Report: Listed Banks Q1’2024 Rankings |
|||||
|
Bank |
Franchise Value Rank |
Intrinsic Value Rank |
Weighted Rank Score |
Q1'2023 Rank |
Q1'2024 Rank |
|
Absa Bank |
3 |
3 |
3.0 |
2 |
1 |
|
Stanbic Bank |
2 |
6 |
3.6 |
6 |
2 |
|
SCBK |
1 |
8 |
3.8 |
8 |
3 |
|
Equity Bank |
6 |
1 |
4.0 |
1 |
4 |
|
Coop Bank |
5 |
4 |
4.6 |
3 |
5 |
|
I&M Holdings |
4 |
7 |
5.2 |
7 |
6 |
|
DTBK |
9 |
2 |
6.2 |
9 |
7 |
|
NCBA Group |
7 |
5 |
6.2 |
5 |
8 |
|
KCB Group |
8 |
9 |
8.4 |
4 |
9 |
|
HF Group |
10 |
10 |
10.0 |
10 |
10 |
Major Take-outs from the Q1’2024 Ranking are:
- ABSA Bank moved to position 1 in Q1’2024, from position 2 in Q1’2023, mainly supported by strong franchise and intrinsic value score, attributable to improvement in the bank’s management quality and earning quality, with the cost-to-income ratio with LLPs declining by 5.2% points to 48.5% in Q1’2024, from 53.7% in Q1'2023, and cost-to-income without LLPs declined by 2.4% points to 33.9% in Q1’2024, from 36.3% in Q1'2023. Notably, the bank’s Net Interest Margin increased by 1.3% points to 9.7% in Q1’2024 from 8.3% in Q1’2023,
- Standard Chartered Bank climbed up 5 places to rank at position 3 in Q1’2024, up from position 8 in Q1’2023 supported by significant improvement in franchise value score. Its performance was driven by a 1.0% points growth in return on average equity to 24.0% in Q1’2024 from 23.0% in Q1’2023. Additionally, the cost-to-income ratio with LLPs declined by 6.1% points to 41.6% in Q1’2024, from 47.6% in Q1’2023, while cost-to-income ratio without LLPs declined by 2.9% points to 37.4% in Q1’2024, from 40.3% in Q1’2023. Notably, the bank’s Net Interest Margin increased by 1.3% points to 8.6% in Q1’2024 from 7.3% in Q1’2023,
- Stanbic Bank also climbed up 4 places to rank at position 2 in Q1’2024, up from position 6 in Q1’2023 supported by significant improvement in both franchise and intrinsic value score. Its performance was driven by a 0.1% points growth in return on average equity to 20.8% in Q1’2024 from 20.7% in Q1’2023. Additionally, the cost-to-income ratio with LLPs declined by 3.9% points to 46.8% in Q1’2024, from 50.7% in Q1’2023, while cost-to-income ratio without LLPs declined by 4.8% points to 35.7% in Q1’2024, from 40.5% in Q1’2023. Notably, the bank’s Net Interest Margin increased by 1.2% points to 8.4% in Q1’2024 from 7.2% in Q1’2023, and,
- KCB Group slid 5 places to rank at position 9 in Q1’2024, down from position 4 in Q1’2023, supported by deterioration in earnings quality, with the return on average equity deteriorating by 0.8% points to 20.1% in Q1’2024 from 20.9% recorded in Q1’2023. Additionally, the asset quality worsened with the gross NPL ratio increasing by 0.8% points to 17.9% in Q1’2024, up from 17.1% registered in Q1’2023.
For more information, see our Cytonn Q1’2024 Listed Banking Sector Review full report.
Disclaimer: The views expressed in this publication are those of the writers where particulars are not warranted. This publication is meant for general information only and is not a warranty, representation, advice or solicitation of any nature. Readers are advised in all circumstances to seek the advice of a registered investment advisor.

- Talk to us
- Kenya
- P.O Box 20695 - 00200, Nairobi, Kenya
- Cell +254709101200
- Tel +254709101200
- WhatsApp +254741676635
- United States
- +254709101200
- DOWNLOAD OUR APP
-


- Kenya
- 8th Floor, Pinetree Plaza, Kaburu Drive, Ngong Road, Nairobi, Kenya
- USA
- Suite 1150, 1775 Eye Street NW, USA, Washington DC 20006, USA
- Investments
- High Yield
- Private Equity
- Real Estate
- Real Estate
- RiverRun Estates
- Cytonn Towers
- The Ridge
- Taraji Heights
- The Alma