Kenya Listed Banks H1’2022 Report, & Cytonn Weekly #36/2022
By Cytonn Research, Sep 11, 2022
Executive Summary
Fixed Income
During the week, T-bills remained oversubscribed, with the overall subscription rate coming in at 153.0%, an increase from the 128.8% recorded the previous week. The increase in the subscription rate was partly attributable to the eased liquidity in the money market and partly due to increased investor confidence following the verification of the August 2022 elections results. Investor’s preference for shorter 91-day paper persisted for the eleventh consecutive week, with the paper receiving bids worth Kshs 27.0 bn against the offered Kshs 4.0 bn, translating to a subscription rate of 675.4%, up from the 406.6% recorded the previous week. The subscription rate for the 364-day paper also increased to 34.8% from 34.1% while that of the 182-day paper declined to 62.3%, from 112.3% recorded the previous week. The yields on the government papers were on an upward trajectory, with the yields on the 364-day, 182-day and the 91-day papers increasing by 3.9 bps, 2.3 bps, and 5.0 bps to 9.9%, 9.6%, and 8.9%, respectively;
Also during the week, Stanbic Bank released its monthly Purchasing Manager’s Index (PMI) highlighting that the index for the month of August 2022 declined for the fifth consecutive time to 44.2, from 46.3 recorded in July 2022 pointing towards a further deterioration in the business environment in the Kenyan private sector;
Equities
During the week, the equities market was on an upward trajectory with NASI, NSE 20 and NSE 25 gaining by 2.6%, 1.4% and 2.1% respectively, taking their YTD performance to losses of 15.2%, 6.6% and 11.2%, for NASI, NSE 20 and NSE 25, respectively. The equities market performance was mainly driven by gains recorded by large-cap stocks such as NCBA, Safaricom, KCB, and Standard Chartered of 9.3%, 4.3%, 3.9% and 1.8%, respectively. The gains were however weighed down by losses recorded by EABL and ABSA which declined by 0.6% and 0.4%, respectively. Additionally, the Central Bank of Kenya (CBK) released the Quarterly Economic Review for the period ending 30th June 2022, highlighting that the banking sector remained stable and resilient during the period.
Real Estate
During the week, the Central Bank of Kenya (CBK) released the Quarterly Economic Review Q2’2022 highlighting that the gross loans advanced to the Real Estate sector increased by 1.3% to Kshs 466.0 bn in Q2’2022, from Kshs 460.0 bn in Q1’2021. In the commercial office sector, Nairobi Garage, an office space supplier, opened a new outlet at Nairobi’s 20th Century Plaza along Mama Ngina Street. In the retail sector, Naivas Supermarket opened a new outlet at Elgon View Mall in Eldoret, bringing its total number of branches countrywide to 85. Additionally, local eye-wear Optica Limited opened a new outlet at Nextgen Mall located along Mombasa Road. For Real Estate Investment Trusts (REITs), Fahari I-REIT closed the week trading at an average price of Kshs 7.0 per share on the Nairobi Stock Exchange, while Acorn D-REIT and I-REIT closed the week trading at Kshs 23.8, and Kshs 20.8 per unit, respectively on the Unquoted Securities Platform;
Focus of the Week
Following the release of the H1’2022 results by Kenyan listed banks, the Cytonn Financial Services Research Team undertook an analysis on the financial performance of the listed banks and identified the key factors that shaped the performance of the sector;
Investment Updates:
- Weekly Rates:
- Cytonn Money Market Fund closed the week at a yield of 10.57%. To invest, dial *809# or download the Cytonn App from Google Playstore here or from the Appstore here;
- Cytonn High Yield Fund closed the week at a yield of 13.91% p.a. To invest, email us at sales@cytonn.com and to withdraw the interest, dial *809# or download the Cytonn App from Google Playstore here or from the Appstore here;
- We continue to offer Wealth Management Training every Wednesday and every third Saturday of the month, from 9:00 am to 11:00 am, through our Cytonn Foundation. The training aims to grow financial literacy among the general public. To register for any of our Wealth Management Trainings, click here;
- If interested in our Private Wealth Management Training for your employees or investment group, please get in touch with us through wmt@cytonn.com;
- Any CHYS and CPN investors still looking to convert are welcome to consider one of the five projects currently available for assignment, click here for the latest term sheet;
- Cytonn Insurance Agency acts as an intermediary for those looking to secure their assets and loved ones’ future through insurance namely; Motor, Medical, Life, Property, WIBA, Credit and Fire and Burglary insurance covers. For assistance, get in touch with us through insuranceagency@cytonn.com;
- Cytonnaire Savings and Credit Co-operative Society Limited (SACCO) provides a savings and investments avenue to help you in your financial planning journey. To enjoy competitive investment returns, kindly get in touch with us through clientservices@cytonn.com;
- For an exclusive tour of Cytonn’s real estate developments, visit: Sharp Investor's Tour, and for more information, email us at sales@cytonn.com;
- Phase 3 of The Alma is now ready for occupation and the show house is open daily. To rent please email properties@cytonn.com;
- We have 8 investment-ready projects, offering attractive development and buyer targeted returns; See further details here: Summary of Investment-ready Projects;
- For Third Party Real Estate Consultancy Services, email us at rdo@cytonn.com;
- For recent news about the group, see our news section here;
Hospitality Updates:
- We currently have promotions for Staycations. Visit cysuites.com/offers for details or email us at sales@cysuites.com;
During the week, T-bills remained oversubscribed, with the overall subscription rate coming in at 153.0%, an increase from the 128.8% recorded the previous week. The increase in the subscription rate was partly attributable to the eased liquidity in the money market and partly due to increased investor confidence following the verification of the August 2022 elections results. Investor’s preference for the shorter 91-day paper persisted for the eleventh consecutive week, with the paper receiving bids worth Kshs 27.0 bn against the offered Kshs 4.0 bn, translating to a subscription rate of 675.4%, up from the 406.6% recorded the previous week. The subscription rate for the 364-day paper also increased to 34.8% from 34.1% while that of the 182-day paper declined to 62.3%, from 112.3% recorded the previous week. The yields on the government papers were on an upward trajectory, with the yields on the 364-day, 182-day and the 91-day papers increasing by 3.9 bps, 2.3 bps, and 5.0 bps to 9.9%, 9.6%, and 8.9%, respectively. The government continued to reject expensive bids, accepting a total of Kshs 28.0 bn worth of bids out of the Kshs 36.7 bn worth of bids received, translating to an acceptance rate of 76.1%.
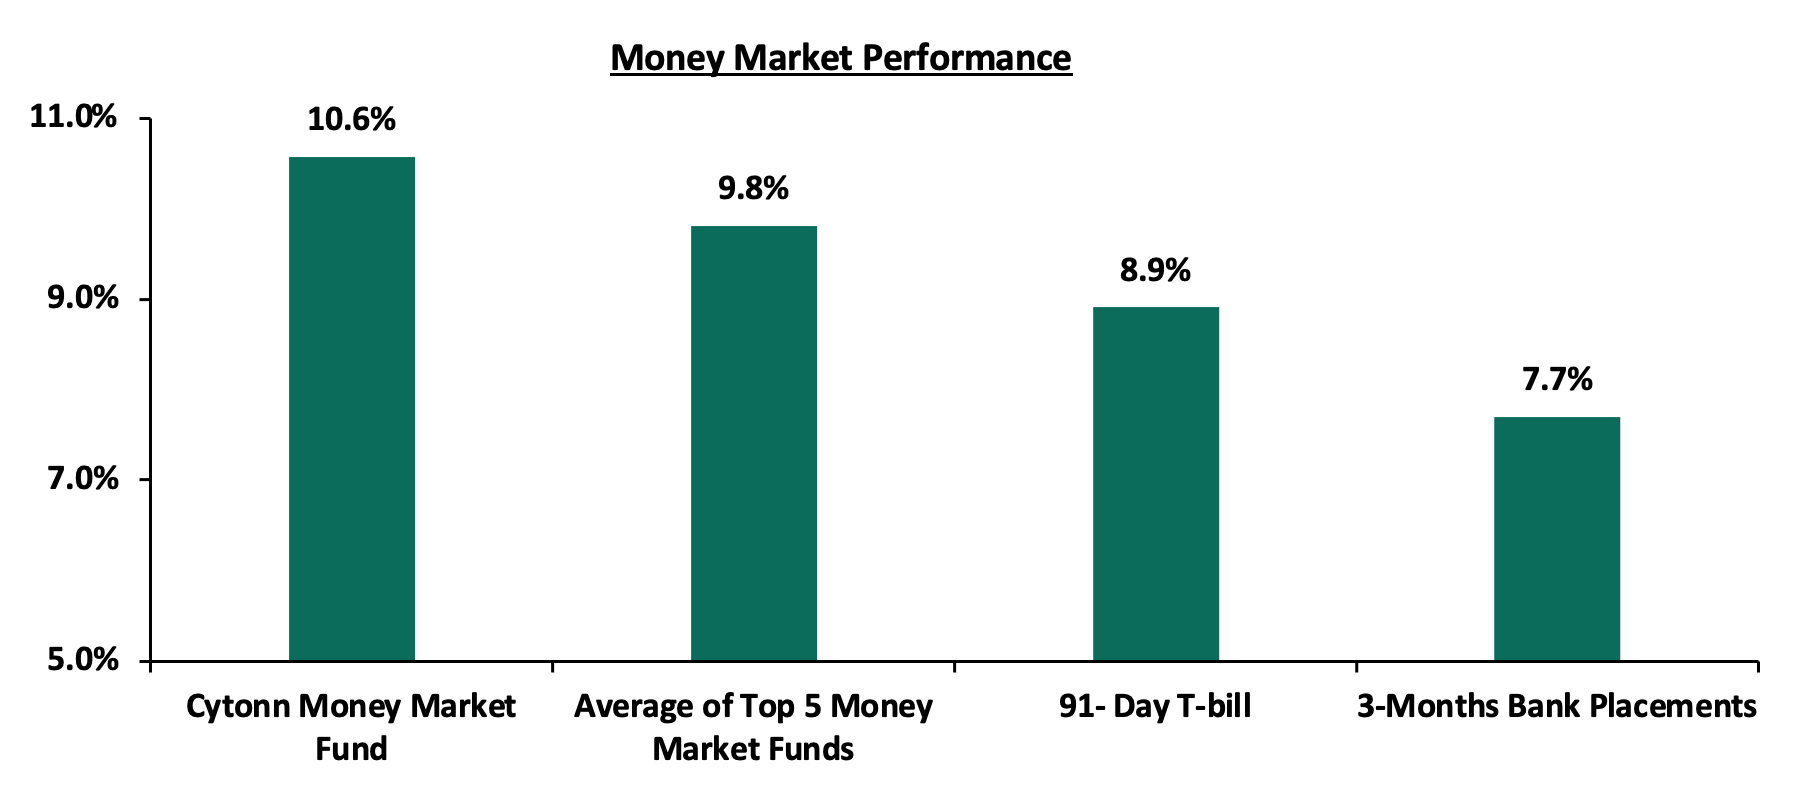
In the money markets, 3-month bank placements ended the week at 7.7% (based on what we have been offered by various banks), while the yield on the 91-day T-bill increased by 5.0 bps to 8.9%. The average yield of the Top 5 Money Market Funds and Cytonn Money Market Fund remained relatively unchanged at 9.8% and 10.6%, respectively, as was recorded last week.
The table below shows the Money Market Fund Yields for Kenyan Fund Managers as published on 9th September 2022:
|
Money Market Fund Yield for Fund Managers as published on 9th September 2022 |
||
|
Rank |
Fund Manager |
Effective Annual Rate |
|
1 |
Cytonn Money Market Fund |
10.6% |
|
2 |
Zimele Money Market Fund |
9.9% |
|
3 |
Sanlam Money Market Fund |
9.6% |
|
4 |
Dry Associates Money Market Fund |
9.5% |
|
5 |
NCBA Money Market Fund |
9.5% |
|
6 |
Nabo Africa Money Market Fund |
9.5% |
|
7 |
Apollo Money Market Fund |
9.4% |
|
8 |
Madison Money Market Fund |
9.3% |
|
9 |
Old Mutual Money Market Fund |
9.3% |
|
10 |
Co-op Money Market Fund |
9.2% |
|
11 |
CIC Money Market Fund |
9.0% |
|
12 |
ICEA Lion Money Market Fund |
8.8% |
|
13 |
GenCap Hela Imara Money Market Fund |
8.6% |
|
14 |
Orient Kasha Money Market Fund |
8.6% |
|
15 |
AA Kenya Shillings Fund |
8.4% |
|
16 |
British-American Money Market Fund |
7.6% |
Source: Business Daily
Liquidity:
During the week, liquidity in the money markets eased, with the average interbank rate decreasing to 4.3% from 5.0% recorded the previous week, partly attributable to government payments that offset tax remittances. However, the average interbank volumes traded declined by 10.3% to Kshs 13.5 bn from Kshs 15.0 bn recorded the previous week.
Kenya Eurobonds:
During the week, the yields on Eurobonds were on a downward trajectory partly attributable to reduced uncertainty following the verification of the August general election results. The yield on the 10-year Eurobond issued in 2014 recorded the highest decrease having declined by 2.2% points to 13.2%, from 15.2%, recorded the previous week. The table below shows the summary of the performance of the Kenyan Eurobonds as of 8th September 2022;
|
Kenya Eurobond Performance |
||||||
|
2014 |
2018 |
2019 |
2021 |
|||
|
Date |
10-year issue |
10-year issue |
30-year issue |
7-year issue |
12-year issue |
12-year issue |
|
3-Jan-22 |
4.4% |
8.1% |
8.1% |
5.6% |
6.7% |
6.6% |
|
31-Aug-22 |
15.3% |
13.2% |
12.4% |
14.5% |
13.1% |
11.5% |
|
2-Sep-22 |
15.4% |
13.3% |
12.5% |
14.5% |
13.2% |
11.6% |
|
5-Sep-22 |
14.6% |
13.0% |
12.3% |
14.0% |
13.1% |
11.4% |
|
6-Sep-22 |
13.0% |
12.7% |
11.9% |
13.1% |
12.5% |
11.0% |
|
7-Sep-22 |
13.5% |
12.6% |
11.9% |
13.4% |
12.6% |
11.0% |
|
8-Sep-22 |
13.2% |
12.5% |
11.8% |
13.3% |
12.5% |
11.0% |
|
Weekly Change |
(2.2%) |
(0.8%) |
(0.7%) |
(1.2%) |
(0.7%) |
(0.6%) |
|
MTD Change |
(2.1%) |
(0.7%) |
(0.6%) |
(1.2%) |
(0.6%) |
(0.5%) |
|
YTD Change |
8.8% |
4.4% |
3.7% |
7.7% |
5.8% |
4.4% |
Source: Central Bank of Kenya (CBK)
Kenya Shilling:
During the week, the Kenyan shilling depreciated by 0.2% against the US dollar to close the week at Kshs 120.3, from Kshs 120.1 recorded the previous week, partly attributable to increased dollar demand from the oil and energy sectors against a slower supply of hard currency. On a year to date basis, the shilling has depreciated by 6.3% against the dollar, higher than the 3.6% depreciation recorded in 2021. We expect the shilling to remain under pressure in 2022 as a result of:
- High global crude oil prices on the back of persistent supply chain bottlenecks coupled with high demand as most economies gradually recover,
- An ever-present current account deficit due to an imbalance between imports and exports, with Kenya’s current account deficit estimated at 5.1% of GDP in the 12 months to July 2022 compared to the 5.2% within a similar period in 2021, and,
- The aggressively growing government debt, with Kenya’s public debt having increased at a 10-year CAGR of 18.2% to Kshs 8.6 tn in May 2022, from Kshs 1.6 tn in May 2012 thus putting pressure on forex reserves to service some of the public debt. It is worth noting that the average GDP growth over the same period has been 3.9%, indicating that the increase in debt is not translating into GDP growth.
The shilling is however expected to be supported by:
- Sufficient Forex reserves currently at USD 7.3 bn (equivalent to 4.2-months of import cover), which is above the statutory requirement of maintaining at least 4.0-months of import cover, and,
- Sufficient diaspora remittances evidenced by a 6.6% increase to USD 3,995.0 mn cumulative remittances as of July 2022, compared to USD 3,442.0 mn recorded over the same period in 2021, which has continued to cushion the shilling against a faster depreciation.
Weekly Highlight:
Stanbic Bank’s August 2022 Purchasing Manager’s Index (PMI)
During the week, Stanbic Bank released its monthly Purchasing Manager’s Index (PMI) highlighting that the index for the month of August 2022 declined for the fifth consecutive time to 44.2, from 46.3 recorded in July 2022 pointing towards a further deterioration in the business environment in the Kenyan private sector. Notably, this was the lowest reading since April 2021, when the index came in at 41.5. The decline was largely attributable to economic disruptions occasioned by uncertainties that surrounded the August general elections as well as the prevailing inflationary pressures. Consequently, there was a decline in new order volumes due to a reduction in consumer spending which led to a decline in purchasing activity by businesses on the back of deteriorating sales. The chart below summarizes the evolution of the PMI in the last two years;
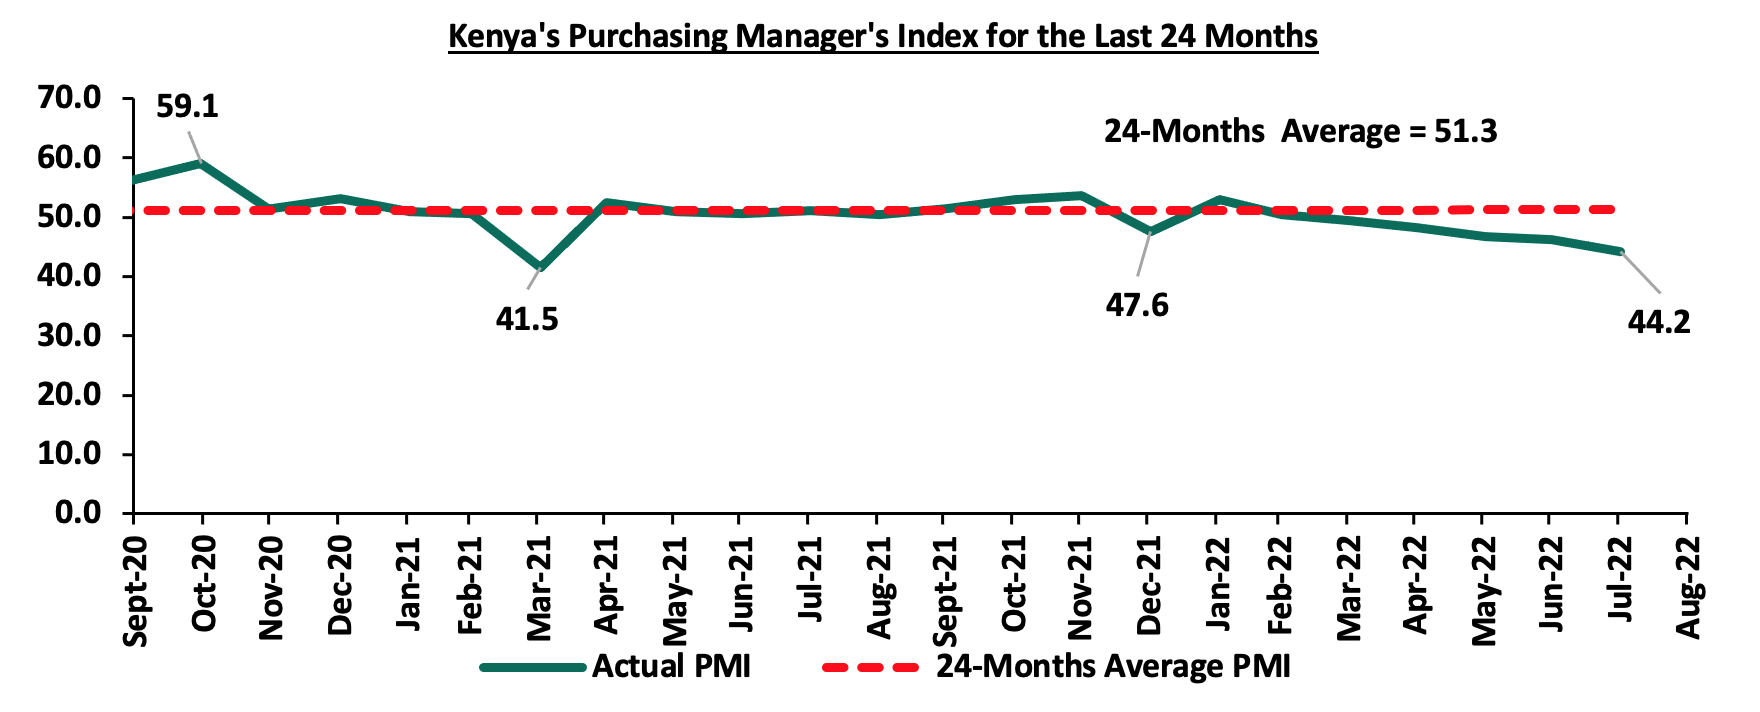
*** Key to note, a reading above 50.0 signals an improvement in business conditions, while readings below 50.0 indicate a deterioration.
Kenya’s general business environment continues to be weighed down by the elevated inflationary pressures emanating from supply chain constraints and a depreciating local currency. Going forward, we expect the business environment to remain subdued given the persistent supply chain bottlenecks that have seen the cost of inputs continue to rise. As such, we maintain our view that the recovery of the private sector business environment in Kenya is largely pegged on how quickly the global economy stabilizes and how soon the inflationary pressures ease.
Rates in the Fixed Income market have remained relatively stable due to the relatively ample liquidity in the money market. As it is still early in the financial year, the government is 12.1% behind its prorated borrowing target of Kshs 113.5 bn having borrowed Kshs 99.8 bn of the Kshs 581.7 bn borrowing target for the FY’2022/2023. We expect sustained gradual economic recovery as evidenced by the revenue collections of Kshs 2.0 tn in the FY’2021/2022, equivalent to a 2.8% outperformance. Despite the performance, we believe that the projected budget deficit of 6.2% is relatively ambitious given the downside risks and deteriorating business environment occasioned by high inflationary pressures. We however expect the support from the IMF and World Bank to finance some of the government projects and thus help maintain a stable interest rate environment since the government is not desperate for cash. Owing to this, our view is that investors should be biased towards short-term fixed-income securities to reduce duration risk.
Markets Performance
During the week, the equities market was on an upward trajectory with NASI, NSE 20 and NSE 25 gaining by 2.6%, 1.4% and 2.1% respectively, taking their YTD performance to losses of 15.2%, 6.6% and 11.2%, for NASI, NSE 20 and NSE 25, respectively. The equities market performance was mainly driven by gains recorded by large-cap stocks such as NCBA, Safaricom, KCB, and Standard Chartered of 9.3%, 4.3%, 3.9% and 1.8%, respectively. The gains were however weighed down by losses recorded by EABL and ABSA which declined by 0.6% and 0.4%, respectively.
During the week, equities turnover declined by 11.1% to USD 13.5 mn, from USD 15.1 mn recorded the previous week, taking the YTD turnover to USD 600.2 mn. Foreign investors remained net sellers, with a net selling position of USD 0.6 mn, from a net selling position of USD 6.0 mn recorded the previous week, taking the YTD net selling position to USD 147.9 mn.
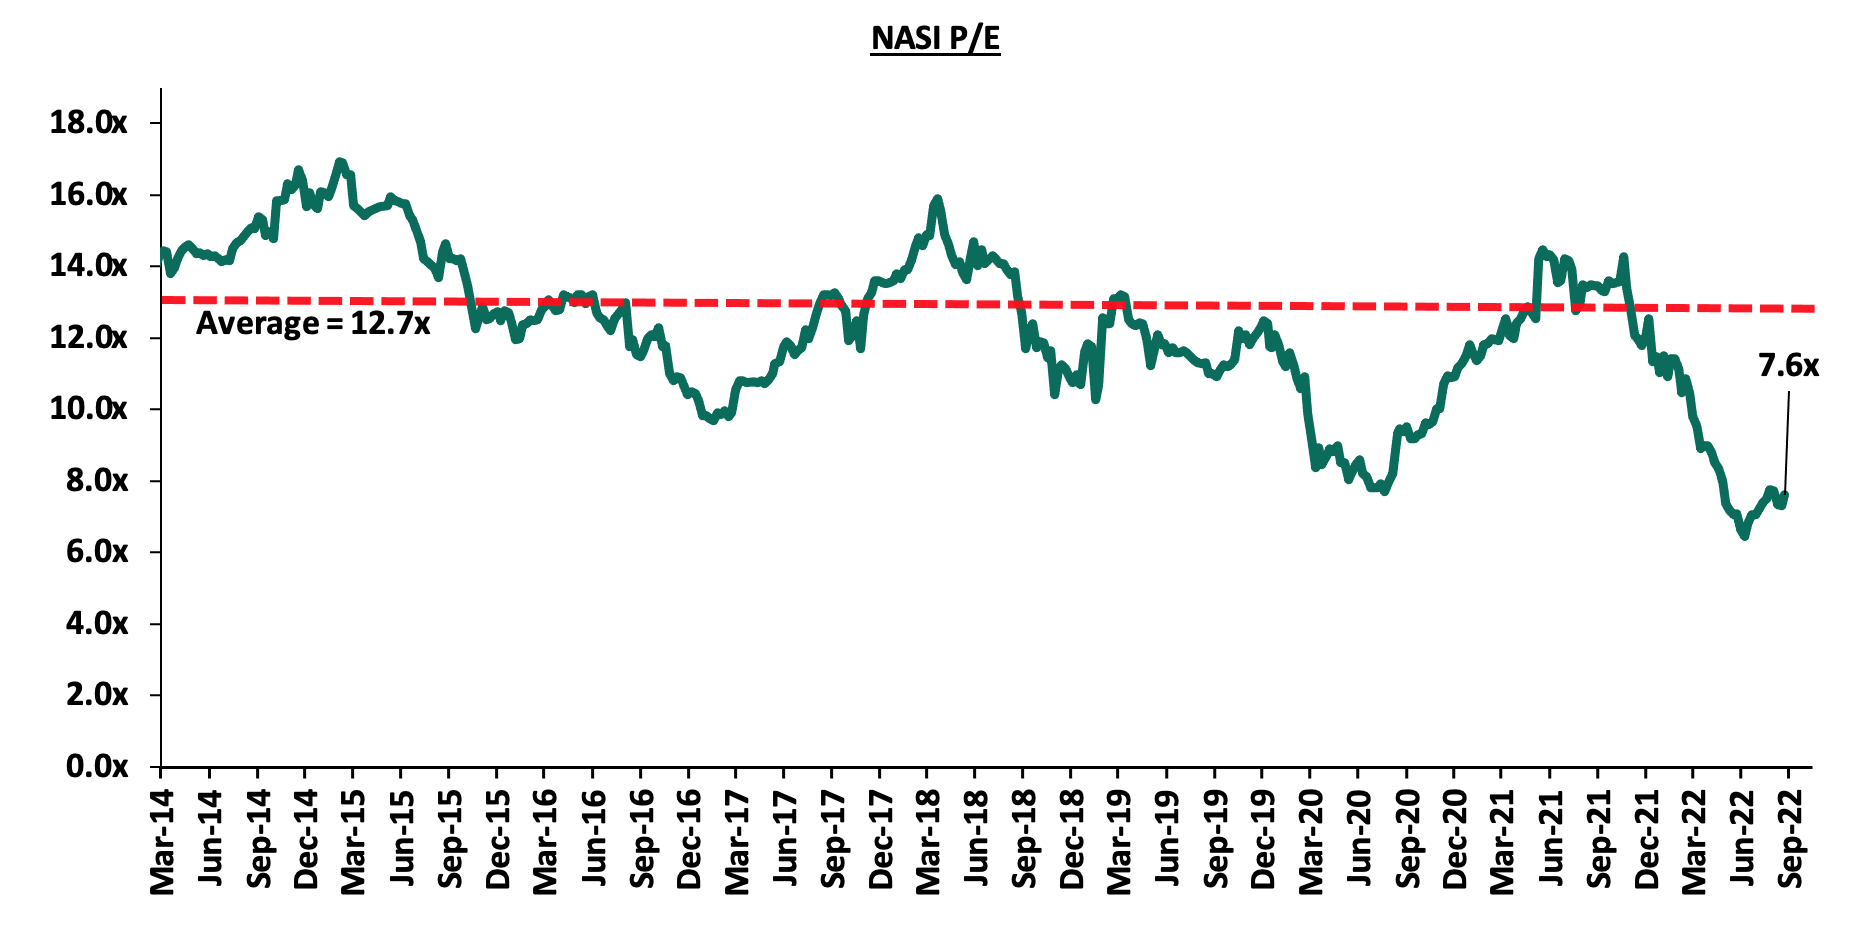
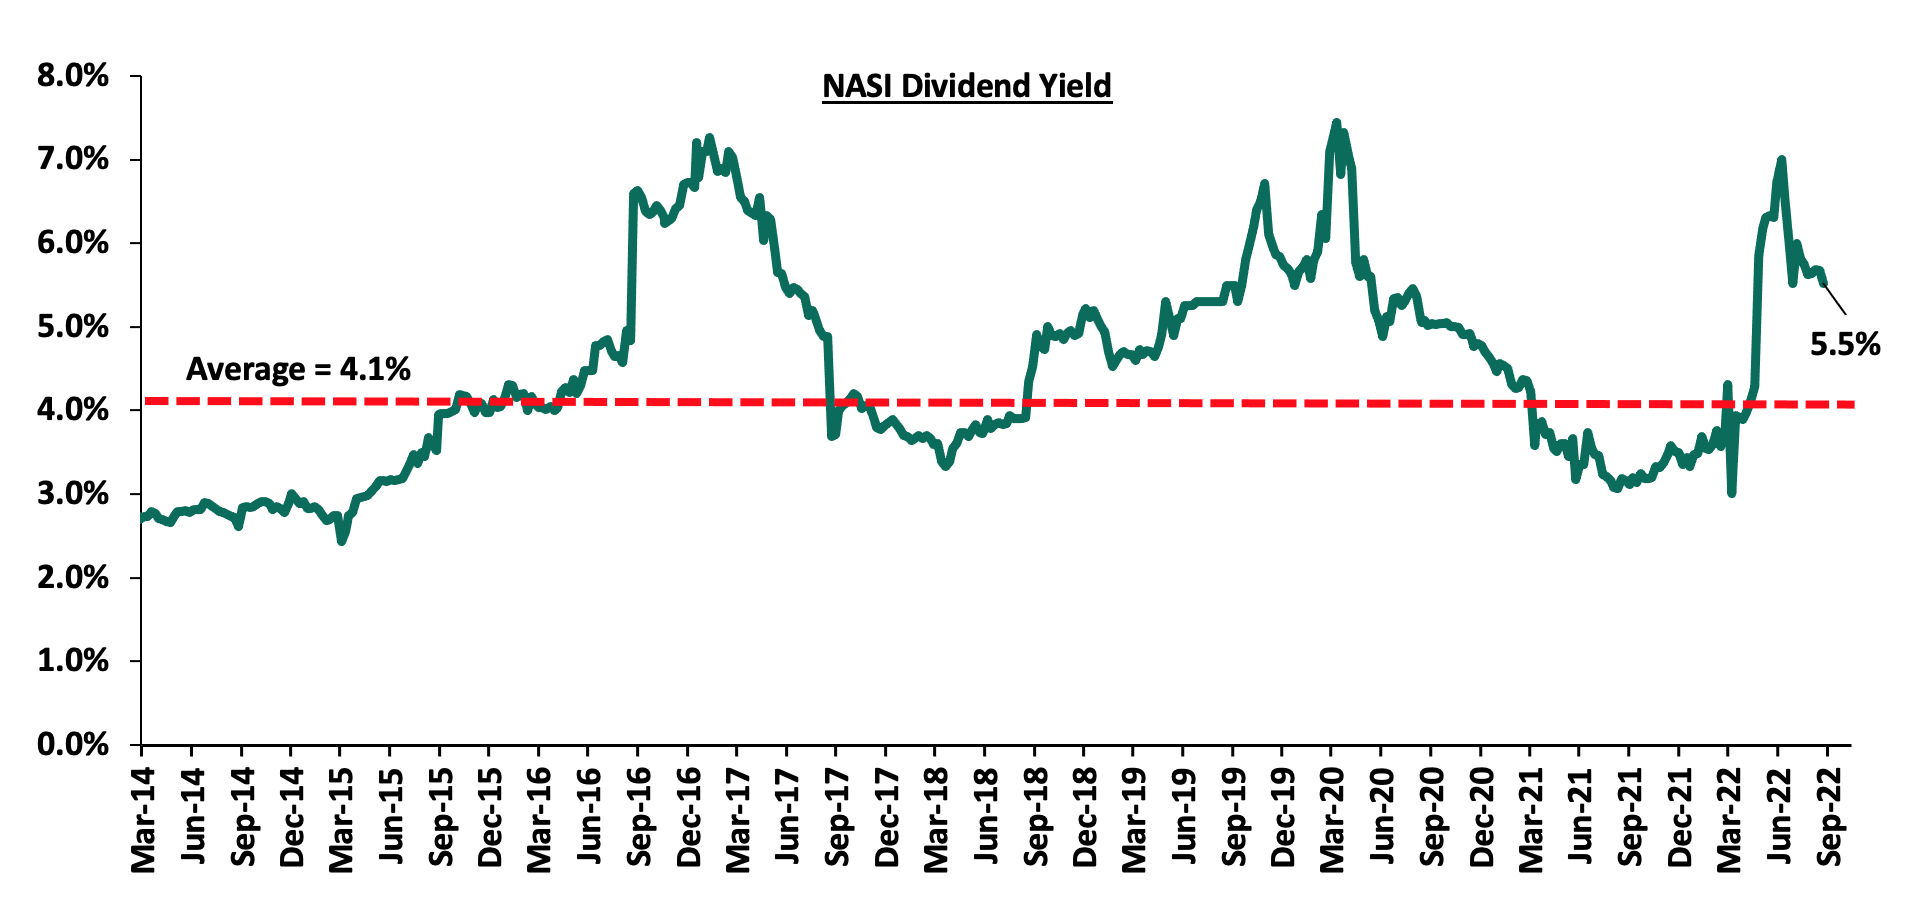
The market is currently trading at a price to earnings ratio (P/E) of 7.6x, 42.5% below the historical average of 12.7x, and a dividend yield of 5.5%, 1.2% points above the historical average of 4.1%. Key to note, NASI’s PEG ratio currently stands at 1.0x, an indication that the market is at par relative to its future growth. A PEG ratio greater than 1.0x indicates the market may be overvalued while a PEG ratio less than 1.0x indicates that the market is undervalued. The charts below indicate the historical P/E and dividend yields of the market:
Weekly Highlights:
Q2’2022 Quarterly Economic Review
During the week, the Central Bank of Kenya (CBK) released the Quarterly Economic Review for the period ending 30th June 2022, highlighting that the banking sector remained stable and resilient during the period. According to the report, the sector’s total assets increased by 2.4% to Kshs 6.2 tn in June 2022, from Kshs 6.1 tn in March 2022. The increase was mainly attributable to a 3.3% increase in loans and advances to Kshs 3.5 tn as well as a 15.9% increase in balances in CBK by Kshs 33.1 bn and a 9.1% increase in other assets by Kshs 25.5 bn. On a yearly basis, total assets increased by 10.0% to Kshs 6.2 tn, from Kshs 5.7 tn in Q2’2021. Notably, loans and advances accounted for 50.8% of total assets in Q2’2022, which was an increase from 50.2% of total assets recorded in the Q1’2022.
Other key take-outs from the report include:
- The banking sector recorded a 9.3% increase in Profit before Tax (PBT) to Kshs 62.6 bn in Q2’2022, from Kshs 57.3 bn in Q1’2022, with the increase in profitability mainly attributable to a higher increase in quarterly income by Kshs 15.8 bn and a lower increase in quarterly expenses by Kshs 10.6 bn. On a yearly basis, PBT increased by 24.0%, to Kshs 62.6 bn, from Kshs 50.5 bn recorded in Q2’2021,
- The sector’s Return on Asset (ROA) remained unchanged at 3.0% from Q1’2022. Year on year, ROA increased by 0.3% to 3.0% in Q2’2022 from 2.7% in Q2’2021. Additionally, Return On Equity (ROE) recorded a 1.7% points increase to 26.8% in June 2022, from 25.1% in March 2022, and, a 4.1% points increase from 22.7% recorded in Q2’2021,
- Lending increased by 3.3% to Kshs 3.5 tn in Q2’2022, from Kshs 3.4 tn in Q1’2022, attributable to an increase in credit granted for working capital purposes, and loans granted to individual borrowers. On a yearly basis, lending was up by 12.3% to Kshs 3.5 tn, from Kshs 3.1 tn in Q2’2021,
- Deposits recorded a 3.3% increase to Kshs 4.6 tn in June 2022, from Kshs 4.5 tn in March 2022, attributable to a 2.6% increase in local currency deposits which increased to Kshs 3.38 tn in June 2022. Compared to last year, deposits increased by 8.6% to Kshs 4.6 tn in Q2’2022, from Kshs 4.2 tn in Q2’2022. Key to note, customers deposits remain the main source of funding for banks, accounting for 73.9% of the sector’s total liabilities and shareholder’s funds as at Q1’2022, 0.7% higher than the 73.2% recorded in Q1’2022 and 0.9% lower than the 74.8% recorded in Q2’2021,
- Credit risk remained elevated in the sector since the gross NPLs to gross loans ratio increased to 14.7% in Q2’2022 from 14.0% in Q1’2022. The gross Non-Performing Loans (NPLs) also increased by 8.6% to Kshs 514.4 bn in Q2’2022 from 473.7 bn in Q1’2022. Energy and water sector registered the highest increase in NPLs by 33.5% (Kshs 5.4 bn) as a result of a challenging operating environment. In addition, the asset quality also deteriorated compared with last year as the gross NPL ratio increased by 0.7% points to 14.7% in Q2’2022 from 14.0% in Q2’2021,
- The sector’s NPL coverage ratio decreased to 43.3% in Q2’2022, from 49.6% in Q1’2022, despite the increase in Non-Performing Loans. We expect provisioning levels to increase during Q3 and Q4’2022 due to the increasing credit risk brought by the tough operating environment,
- The banking sector remained adequately capitalized, with the aggregate Core Capital to Total Risk weighted Assets ratio decreasing marginally to 16.1% in Q2’2022 from 16.2 in Q1’2022, and 0.4% lower than the 16.5% recorded in Q2’2021. The core capital to Total Risk-Weighted Assets ratio was 5.6% points above the CBK’s minimum statutory ratio of 10.5%. On the other hand, Total Capital to Total Risk-Weighted Asset ratio, decreased slightly by 0.1% points to 18.8% in Q2’2022, from 18.9% in Q1’2022, and, down by 0.1% points from 18.9% recorded in Q2’2021. The Q2’2021 Total Capital to Total Risk-Weighted Assets ratio was 4.3% points above the CBK’s minimum statutory ratio of 14.5%, and,
- The sector remained sufficiently liquid during the period under review, despite the liquidity ratio decreasing to 52.5% in Q2’2022 from 55.0% in Q1’2022. Year on year, the ratio decreased by 4.3% points from 56.8% recorded in Q2’2021. This was a 32.5% points above the minimum statutory level of 20.0%. The decrease in the banking sector’s liquidity is attributable to 3.7% increase in short term liabilities, as compared to a 1.1% decrease in total liquid assets between the periods under review.
The continued increase in profitability of the Kenyan banking sector highlights the sector’s resilience in the face of the macroeconomic conditions in the country and the deteriorated business environment, highlighted by the decline in PMI to 46.8 in June 2022, from 50.5 in March 2022. Additionally, the sector remains sufficiently capitalized and with adequate liquidity levels above the minimum statutory requirements, evidenced by the capital adequacy and liquidity ratios remaining above the minimum statutory ratios. However, we take note of the elevated credit risk, with the Gross NPLs increasing by 8.6% to Kshs 514.4 bn in June 2022 from Kshs 473.7 bn in March 2022, taking the Gross NPL Ratio to 14.7%, from 14.0% in Q1’2022. This is largely attributable to the deteriorated business environment as a result of the increased inflationary pressures emanating from imported inflation bill such as fuel and energy inflation, persistent supply constraints due to Ukraine-Russia conflict, depreciating local currency and the high government pending bills which have increased by 40.4% to Kshs 504.7 bn in June 2022 from the previous financial year. Overall, we expect the banking sector to remain resilient boosted by the CBK’s efforts to improve their liquidity positions by maintaining the Cash Reserve Ratio at 4.25%, proactive monitoring of the loan book by commercial banks and improved capital adequacy across the sector.
Universe of coverage:
|
Company |
Price as at 02/09/2022 |
Price as at 09/09/2022 |
w/w change |
m/m change |
YTD Change |
Year Open 2022 |
Target Price* |
Dividend Yield |
Upside/ Downside** |
P/TBv Multiple |
Recommendation |
|
Jubilee |
240.3 |
245.0 |
2.0% |
(3.4%) |
(22.7%) |
316.8 |
379.4 |
0.4% |
55.3% |
0.4x |
Buy |
|
Kenya Re |
2.1 |
2.2 |
2.4% |
5.0% |
(6.1%) |
2.3 |
3.2 |
4.7% |
52.5% |
0.2x |
Buy |
|
Sanlam |
10.6 |
10.9 |
3.3% |
(12.1%) |
(5.6%) |
11.6 |
15.9 |
0.0% |
45.9% |
1.1x |
Buy |
|
KCB Group*** |
40.9 |
42.5 |
3.9% |
(0.7%) |
(6.8%) |
45.6 |
56.8 |
7.1% |
40.9% |
0.9x |
Buy |
|
Equity *** |
48.2 |
48.6 |
0.9% |
0.3% |
(7.9%) |
52.8 |
64.8 |
6.2% |
39.5% |
1.3x |
Buy |
|
I&M Group*** |
17.0 |
17.0 |
0.0% |
0.0% |
(20.6%) |
21.4 |
21.2 |
8.8% |
33.5% |
0.5x |
Buy |
|
Co-op Bank*** |
12.4 |
12.6 |
1.6% |
3.8% |
(3.5%) |
13.0 |
14.8 |
8.0% |
25.9% |
0.9x |
Buy |
|
DTB-K*** |
50.0 |
50.5 |
1.0% |
2.0% |
(15.1%) |
59.5 |
59.5 |
5.9% |
23.8% |
0.2x |
Buy |
|
ABSA Bank*** |
12.0 |
12.0 |
(0.4%) |
8.6% |
1.7% |
11.8 |
14.4 |
1.7% |
22.2% |
1.2x |
Buy |
|
SCBK*** |
136.5 |
139.0 |
1.8% |
2.6% |
6.9% |
130.0 |
155.0 |
10.1% |
21.6% |
1.1x |
Buy |
|
Stanbic |
100.0 |
93.5 |
(6.5%) |
4.7% |
7.5% |
87.0 |
99.9 |
9.6% |
16.5% |
0.8x |
Accumulate |
|
Britam |
6.5 |
6.7 |
4.0% |
6.6% |
(10.8%) |
7.6 |
7.7 |
0.0% |
14.2% |
1.1x |
Accumulate |
|
NCBA*** |
30.2 |
33.0 |
9.3% |
21.0% |
29.7% |
25.5 |
35.2 |
6.1% |
12.7% |
0.8x |
Accumulate |
|
Liberty |
7.2 |
7.5 |
3.9% |
28.2% |
5.7% |
7.1 |
7.8 |
0.0% |
4.6% |
0.6x |
Lighten |
|
HF Group |
3.5 |
3.6 |
1.1% |
5.7% |
(6.3%) |
3.8 |
3.6 |
0.0% |
1.1% |
0.2x |
Lighten |
|
CIC Group |
2.0 |
2.1 |
3.9% |
0.0% |
(2.3%) |
2.2 |
2.1 |
0.0% |
(0.9%) |
0.7x |
Sell |
|
* Target Price as per Cytonn Analyst estimates **Upside/ (Downside) is adjusted for Dividend Yield ***For Disclosure, these are stocks in which Cytonn and/or its affiliates are invested in |
|||||||||||
We are “Neutral” on the Equities markets in the short term due to the current adverse operating environment and huge foreign investor outflows, and, “Bullish” in the long term due to current cheap valuations and expected global and local economic recovery.
With the market currently trading at par to its future growth (PEG Ratio at 1.0x), we believe that investors should reposition towards value stocks with strong earnings growth and that are trading at discounts to their intrinsic value. We expect the current high foreign investors sell-offs, the upcoming Kenyan general elections and the slow vaccine rollout to continue weighing down the economic outlook in the short term.
- Industrial Report
During the week, the Central Bank of Kenya (CBK) released the Quarterly Economic Review Q2’2022, a report highlighting the status and performance of Kenya’s economy. The following were the key take outs from the report, with regards to the Real Estate and related sectors;
- The gross loans advanced to the Real Estate sector increased by 1.3% to Kshs 466.0 bn in Q2’2022, from Kshs 460.0 bn in Q1’2022 representing a 4.0% YoY increase from Kshs 448.0 bn realized in Q2’2021. The performance was driven by the increased construction and development activities in the property sector which necessitated more capital,
- Gross loans advanced to the Tourism sector also increased by 1.8% to Kshs 113.0 bn in Q2’2022, from Kshs 111.0 bn in Q1’2022, in a bid to boost the sector’s performance through its marketing, sports, and leisure activities,
- Gross loans advanced to the Building and Construction sector increased by 2.9% to Kshs 142.0 bn in Q2’2022, from Kshs 138.0 bn in Q1’2022, mainly driven by continuous construction activities in select Real Estate sectors such as residential and infrastructure sectors, coupled with the increased construction costs, and,
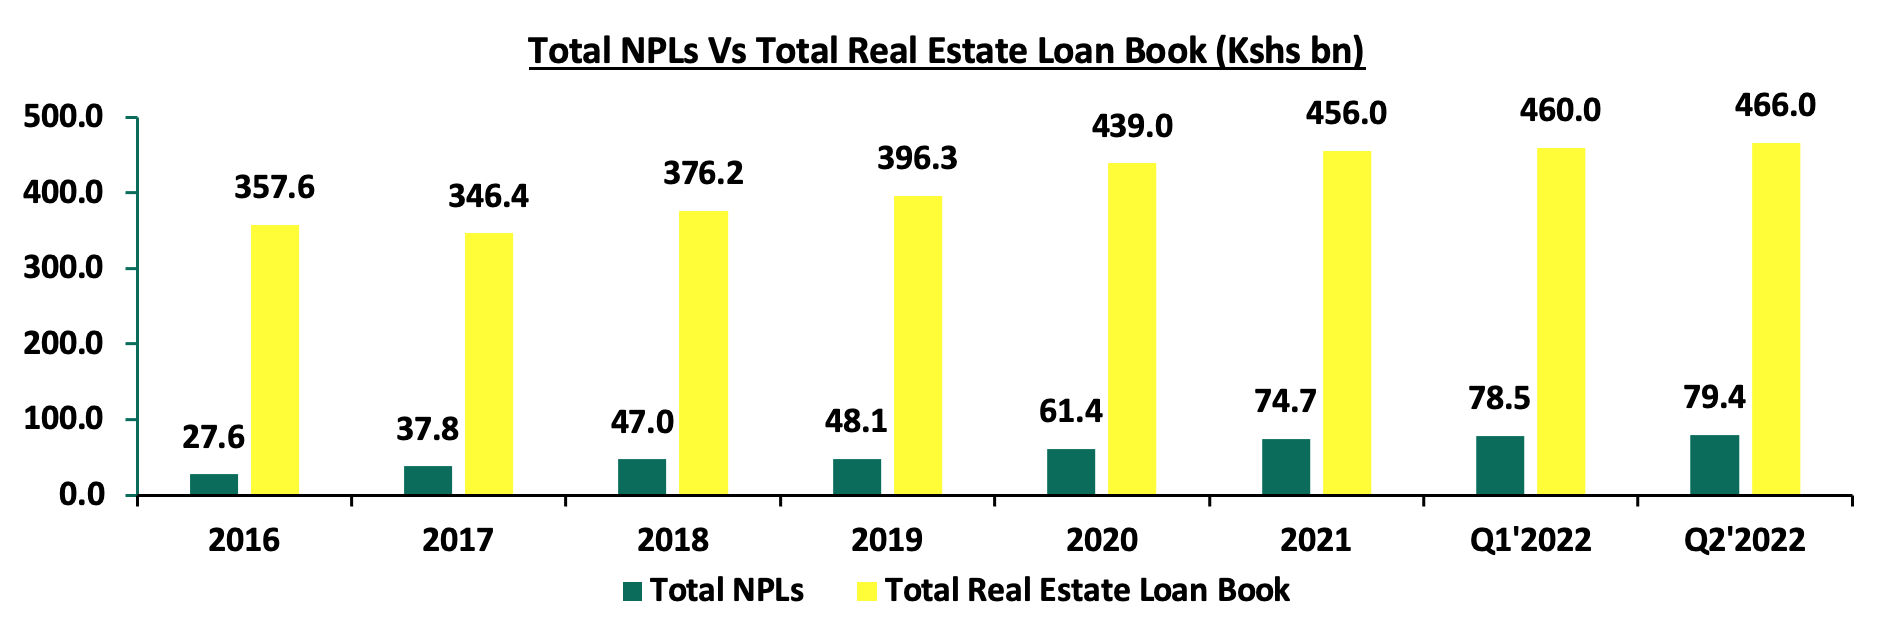
- The Gross Non-Performing Loans in the Real Estate sector increased by 1.1% to Kshs 79.4 bn in Q2’2022, translating to a 17.0% non-performing loans ratio, from Kshs 78.5 bn recorded in Q1’2022 equivalent to 17.1% non-performing loans ratio. On a YoY basis, the performance represented a 16.4% increase from Kshs 68.2 bn realized in Q2’2021, attributed to increased Real Estate loan default rates amidst a rising cost of living.
The graph below shows the total Real Estate non-performing loans against the total loans advanced to the sector since 2016;
Source: Central Bank of Kenya (CBK)
We expect Kenya’s property sector performance to be driven by i) expected increase in visitor arrivals into the country which will boost the performance of the hospitality sector, and ii) the increased residential and infrastructural developments opening up various areas for investments. However, we note that access to credit in the sector remains subdued as evidenced by the overly slow growth in the loans advanced hence posing a funding challenge to the Real Estate sector. As the economy continues to recover, we expect the financing institutions to resume lending to the sector given that the number of defaults is also expected to decline.
- Commercial Office Sector
During the week, Nairobi Garage, an office supply firm in Kenya, opened a two-floor outlet at Nairobi’s 20th Century Plaza located along Mama Ngina Street. The new office space constitutes of 12,000 SQFT and adds to its five existing outlets located in Kilimani, Karen and Westlands. The move to open the new branch in Nairobi’s CBD is mainly driven by;
- Consumer preference to Nairobi’s Central Business District (CBD),
- Remarkable infrastructure development in the city center such as paved walkways, expansion and rehabilitation of roads, Nairobi Expressway exit links, and, the commissioning of the redevelopment of the Central Railway Station, among others, which in turn boost accessibility and investments,
- Increasing popularity of shared working spaces which has continued to drive demand owing to their flexibility and already-available amenities as opposed to unfurnished offices spaces. Consequently, the serviced offices charge premium rates attracting higher yields, and,
- The need to leverage on the affordability of the office space at the CBD as opposed to other areas of the Nairobi Metropolitan Area as summarized below;
|
Nairobi Metropolitan Area Serviced Office Performance |
||||||
|
Location |
Rate (Kshs Per SQFT 2021) |
Rate (Kshs Per SQFT 2022) |
Serviced Offices Rental growth (%) |
Un-serviced Offices Rental growth (%) |
||
|
|
Serviced Offices |
Un-serviced Offices |
Serviced Offices |
Un-serviced Offices |
||
|
Westlands |
204 |
93 |
212 |
104 |
3.9% |
10.6% |
|
Karen |
186 |
104 |
192 |
106 |
3.1% |
1.9% |
|
Parklands |
174 |
106 |
169 |
91 |
(3.3%) |
(16.5%) |
|
Gigiri |
181 |
116 |
- |
119 |
- |
2.5% |
|
Upperhill |
- |
92 |
235 |
94 |
- |
2.1% |
|
Kilimani |
190 |
82 |
194 |
91 |
2.2% |
9.9% |
|
Nairobi CBD |
160 |
93 |
164 |
82 |
2.6% |
(13.4%) |
|
Msa Rd |
105 |
73 |
- |
73 |
- |
0.0% |
|
Thika Rd |
116 |
80 |
112 |
79 |
(3.6%) |
(1.3%) |
|
Nodes Average |
161 |
93 |
183 |
93 |
0.8% |
0.0% |
Source: Cytonn Research
We note that shared office spaces have continued to give better returns as compared to unfurnished office spaces as evidenced by the higher average rate per SQFT which came in at Kshs 183 for serviced offices in comparison to Kshs 93 per SQFT for un-serviced offices. Overall, the commercial office sector continues to record gradual expansion driven by the aggressive development activities which we expect to help boost the performance of the sector. However, the excess supply of office space in the Nairobi Metropolitan Area currently at 6.7 mn SQFT, continues to remain a major challenge hindering the optimum performance of the sector.
- Retail Sector
- Naivas Supermarket Opens its 85th Outlet at Eldoret’s Elgon View Mall
During the week, Naivas Supermarket opened a new outlet at Elgon View Mall in Eldoret, bringing its total branches countrywide to 85. The new outlet covering 39,999 SQFT, is the 4th outlet opened by the retailer in Eldoret town, with the other three being located at Zion Mall, Referral, and Sokoni. Naivas has been on an aggressive expansion spree taking up new and spaces vacated by troubled retailers, in a bid to maintain market dominance as a result of swift market competition from its peers such QuickMart which has opened three new outlets so far this year. The new outlet is the 6th to be opened so far in 2022, with the retailer planning to open another one in Meru town by the end of the year. The decision to open the new outlet in Eldoret was mainly driven by;
- Availability of prime retail space for uptake,
- Strategic location of the retail center along Stendi Kisa-Yala Road which promotes quick access to the retail store, and,
- Uasin Gishu’s relatively high population growth rate currently at 2.7%, compared to Kenya’s 2.3%, which in turn boosts the footfall of the retail spaces in the area, as a result of a rapid demand for goods, services, and retail spaces. As per our Kenya Retail Report 2022 retail spaces in Eldoret recorded an average occupancy rate of 86.1%, 8.8% points higher than the market average of 77.3%, as indicated in the table below;
The table below shows a summary of the number of stores of the key local and international retailer supermarket chains in Kenya;
|
Main Local and International Retail Supermarket Chains |
||||||||||
|
Name of retailer |
Category |
Branches as at FY’ 2018 |
Branches as at FY’ 2019 |
Branches as at FY’ 2020 |
Branches as at FY’ 2021 |
Branches opened in 2022 |
Closed branches |
Current branches |
Branches expected to be opened |
Projected branches FY’2022 |
|
Naivas |
Local |
46 |
61 |
69 |
79 |
6 |
0 |
85 |
1 |
86 |
|
QuickMart |
Local |
10 |
29 |
37 |
48 |
3 |
0 |
51 |
0 |
51 |
|
Chandarana |
Local |
14 |
19 |
20 |
23 |
1 |
1 |
24 |
4 |
28 |
|
Carrefour |
International |
6 |
7 |
9 |
16 |
0 |
0 |
16 |
0 |
16 |
|
Cleanshelf |
Local |
9 |
10 |
11 |
12 |
0 |
0 |
12 |
0 |
12 |
|
Tuskys |
Local |
53 |
64 |
64 |
3 |
0 |
61 |
3 |
0 |
3 |
|
Game Stores |
International |
2 |
2 |
3 |
3 |
0 |
0 |
3 |
0 |
3 |
|
Uchumi |
Local |
37 |
37 |
37 |
2 |
0 |
35 |
2 |
0 |
2 |
|
Choppies |
International |
13 |
15 |
15 |
0 |
0 |
13 |
0 |
0 |
0 |
|
Shoprite |
International |
2 |
4 |
4 |
0 |
0 |
4 |
0 |
0 |
0 |
|
Nakumatt |
Local |
65 |
65 |
65 |
0 |
0 |
65 |
0 |
0 |
0 |
|
Total |
|
257 |
313 |
334 |
186 |
10 |
179 |
196 |
5 |
201 |
Source: Cytonn Research
- Optica Limited Opens a New Outlet at Nextgen Mall
During the week, local eye-wear Optica Limited opened a new outlet at Nextgen Mall, along Mombasa Road bringing its total outlets countrywide to 65. The retailer has opened three new outlets so far this year at Rubis Business Block in Kitengela, and in Argwing’s Arcade in Kilimani, both in May 2022, and another in Ruiru’s Kamakis, in January 2022. The opening of the new outlet at Nextgen Mall was driven by:
- Suitable location of the outlet along the busy Mombasa Road which enhances accessibility to the store and its overall footfall,
- Availability of prime retail space for uptake,
- Its expansion strategy to further reach out its product and services to target clients,
- Increasing demand for prescription sunglasses which also offers protection from UV rays, and,
- Affordability of retail spaces in the area evidenced by our Kenya Retail Report 2022 which highlighted that retail spaces located along Mombasa Road recorded average rental rates per SQFT of Kshs 150, 13.3% lower than the market average of Kshs 173 per SQFT.
The increasing investor confidence in the retail sector has continued to support rapid expansion by local and international retailers and consequently cushioned the performance of the sector. However, we expect the oversupply of mall spaces coupled with the existence of e-commerce to continue weighing down the optimum uptake of space and the overall performance.
- Real Estate Investment Trusts (REITs)
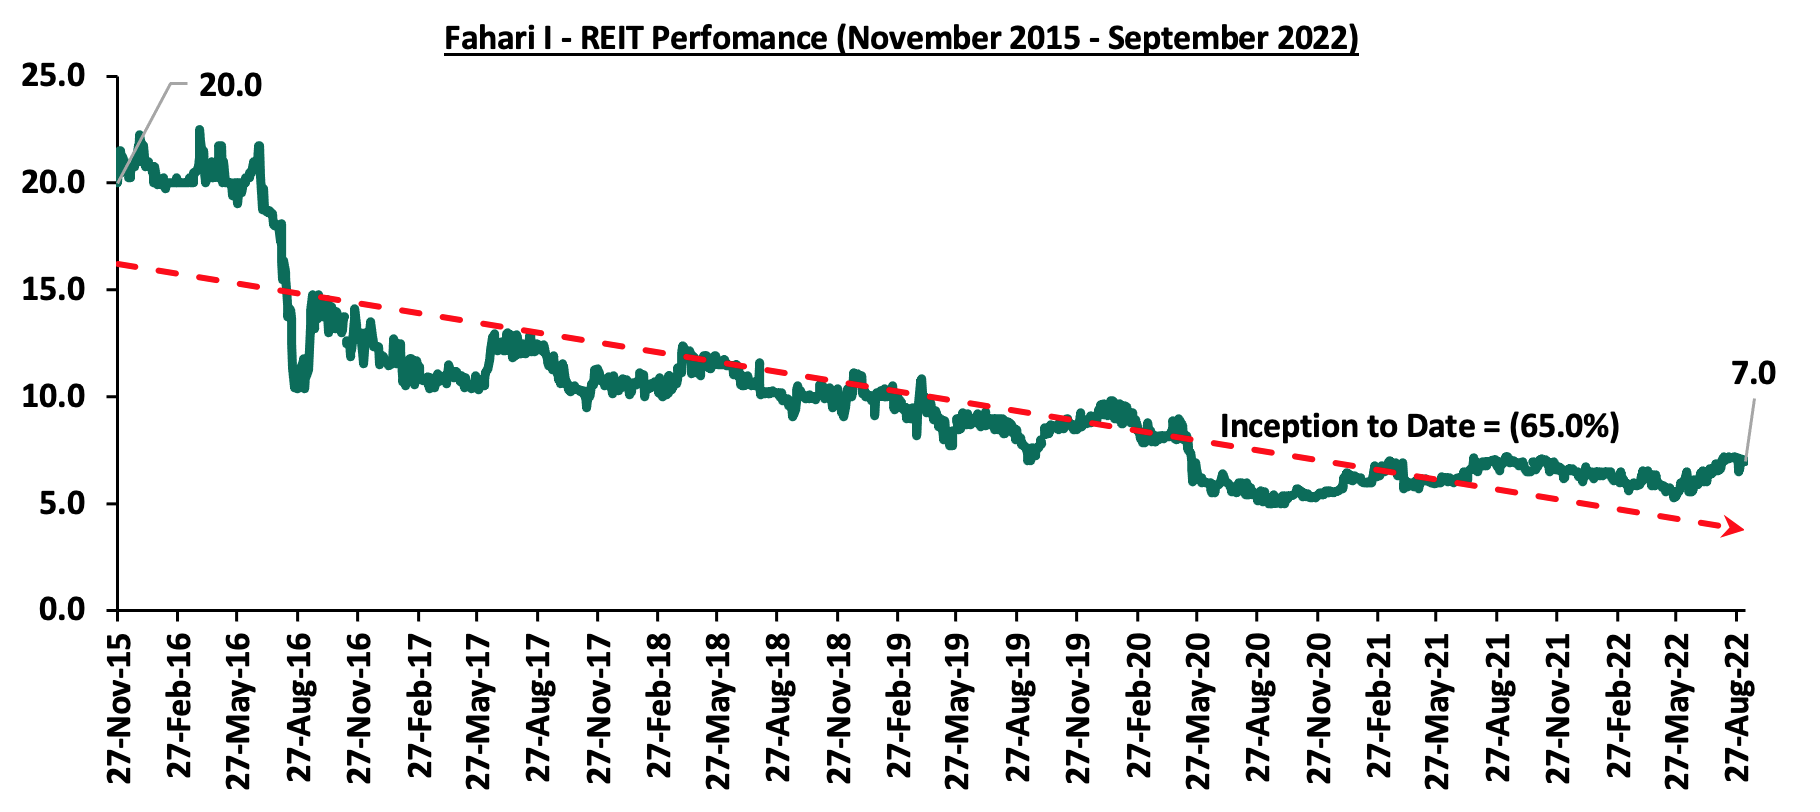
In the Nairobi Stock Exchange, ILAM Fahari I - REIT closed the week trading at an average price of Kshs 7.0 per share representing a 9.4% Year-to-Date (YTD) increase from Kshs 6.4 per share. On an Inception-to-Date (ITD) basis, the REIT’s performance continues to be weighed down having recorded a 65.0% decline from Kshs 20.0. The graph below shows Fahari I-REIT’s performance from November 2015 to September 2022:
In the Unquoted Securities Platform, Acorn D-REIT and I-REIT closed at Kshs 23.8 and Kshs 20.8 per unit, respectively, as at 2nd September 2022. The performance represented a 19.0% and 4.0% gain for the DREIT and I-REIT, respectively, from the Kshs 20.0 inception price. The volumes traded for the D-REIT and I-REIT came in at 5.5 mn and 14.5 mn shares, respectively, with a turnover of Kshs 117.0 mn and Kshs 300.3 mn, respectively since Inception-to-Date.
The performance of Kenya’s Real Estate sector is expected to be on an upward trajectory driven by the slow but rising expansion in the office market, aggressive expansion in the retail sector, and, the improving construction activities in the residential and infrastructure sectors. However, the existing oversupply of office and mall space, financial constraints, and investor’s inadequate appetite for the Kenyan REIT instrument is expected to hinder the optimum investments in the property market.
Following the release of the H1’2022 results by Kenyan listed banks, the Cytonn Financial Services Research Team undertook an analysis on the financial performance of the listed banks and identified the key factors that shaped the performance of the sector. For the earnings notes of the various banks, click thee links below:
- Equity Group H1’2021 Earnings Note;
- KCB Group H1’2022 Earnings Note;
- ABSA Bank Kenya H1’2022 Earnings Note;
- Standard Chartered Bank Kenya H1’2022 Earnings Note;
- NCBA Group H1’2022 Earnings Note;
- Cooperative Bank H1’2022 Earnings Notes;
- Diamond Trust Bank Kenya (DTB-K) H1’2022 Earnings Note;
- I&M Holdings H1’2022 Earnings Note;
- Stanbic Holdings H1’2022 Earnings Note;
- HF Group H1’2022 Earnings Note;
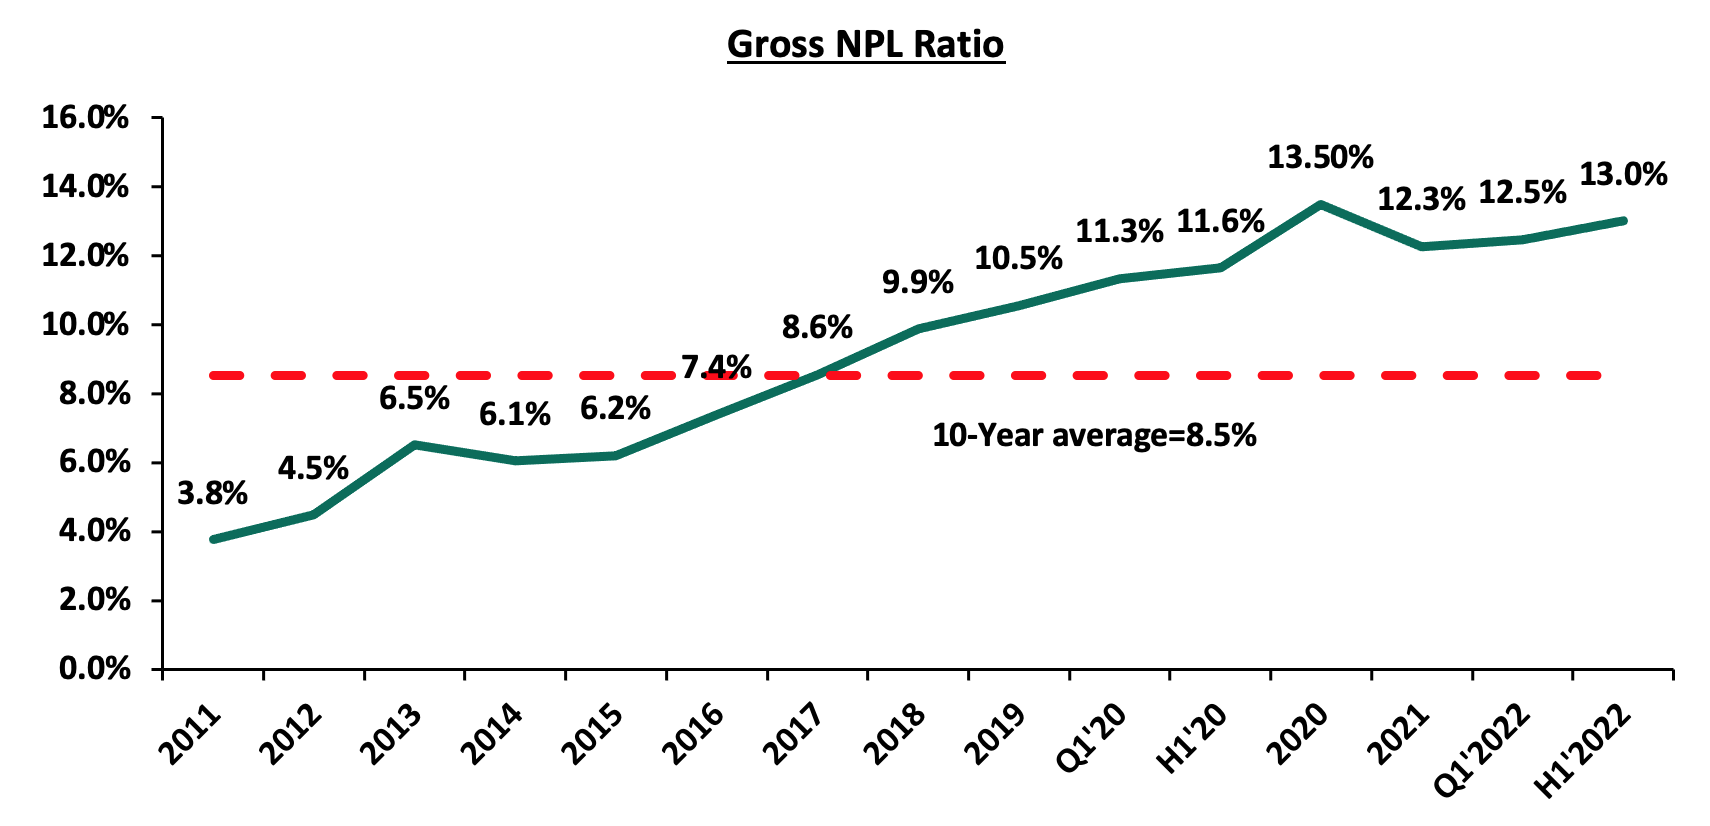
The Core Earnings per Share (EPS) for the listed banks recorded a weighted growth of 34.0% in H1’2022, from a weighted growth of 136.0% recorded in H1’2021 when the sector was recovering from a lower base. Additionally, the Asset Quality for the listed banks deteriorated, with the gross NPL ratio increasing marginally by 0.3% points to 13.0% in H1’2022, from 12.7% in H1’2021. The listed banks’ management quality on the other hand improved, with the Cost to Income ratio declining by 3.5% points to 53.6%, from 57.1% recorded in H1’2021, as banks continued to reduce their provisioning levels.
The report is themed “Earnings Growth Signify Banking Sector Resilience” where we assess the key factors that influenced the performance of the banking sector in H1’2022, the key trends, the challenges banks faced, and areas that will be crucial for growth and stability of the banking sector going forward. As such, we shall address the following:
- Key Themes that Shaped the Banking Sector Performance in H1’2022,
- Summary of the Performance of the Listed Banking Sector in H1’2022,
- The Focus Areas of the Banking Sector Players Going Forward, and,
- Brief Summary and Ranking of the Listed Banks based on the Outcome of Our Analysis.
Section I: Key Themes That Shaped the Banking Sector Performance in Q1’2022
Below, we highlight the key themes that shaped the banking sector in H1’2022 which include; regulations, regional expansion through mergers and acquisitions, asset quality and capital raising for onward lending:
- Regulation:
- Regulation of Digital Lenders: The Central Bank of Kenya (CBK) enacted the law to regulate digital lenders, granting the bank the authority to license and oversee previously unregulated digital credit providers. The regulations were published on 18th March 2022, and allowed digital lenders a period of six months to acquire licences from CBK and are aimed at protecting borrowers from uncharacterized practices of unregulated digital credit providers, particularly their high costs, unethical debt collection practices, and misuse of personal information. All digital lenders are expected to have registered with CBK by 17th September 2022 after which all those who fail to adhere to the regulations will cease operations, and,
- Risk-based Lending- The Central Bank of Kenya has been working on a risk-based lending model to price loans since the Interest Cap law was repealed in 2019. The model’s main goal is to allow banks to lend in line with the estimated risks of each borrower. As of August 2022, at least half of the banks had their models approved by the CBK. However, the approval rate for the models has been gradual in a bid to avoid causing distress to customers through high interest rates. Additionally, the full implementation has also been slowed down as a result of insufficient data to assess client’s risk profile.
- Regional Expansion through Mergers and Acquisitions: Kenyan banks are looking at having an extensive regional reach. In H1’2022, there was one acquisition by Centum Investments Company while KCB Group PLC also announced an acquisition after H1’2022 as follows:
- On 2nd August 2022, KCB Group PLC, announced that it had entered into a final agreement with shareholders of Trust Merchant Bank (TMB) to acquire an 85.0% stake in the Democratic Republic of Congo (DRC)- based lender, with an option to acquire the remaining stake after two years. If successful, the deal will make KCB Group the second Kenyan banking group to enter the DRC banking market after Equity Group Holdings. For this acquisition, KCB will pay a cash consideration based on the net asset value of TMB at completion of the proposed transaction using a Price to Book (P/B) multiple of 1.5x, subject to regulatory, shareholders and other approvals. We estimate a payment of Kshs 15.7 bn by KCB at the trading multiple of 1.5x given TMB’s book valueof FC 208.4 bn (Kshs 12.4 bn) as of 2020. For more information, please see our Cytonn Weekly #31/2022,
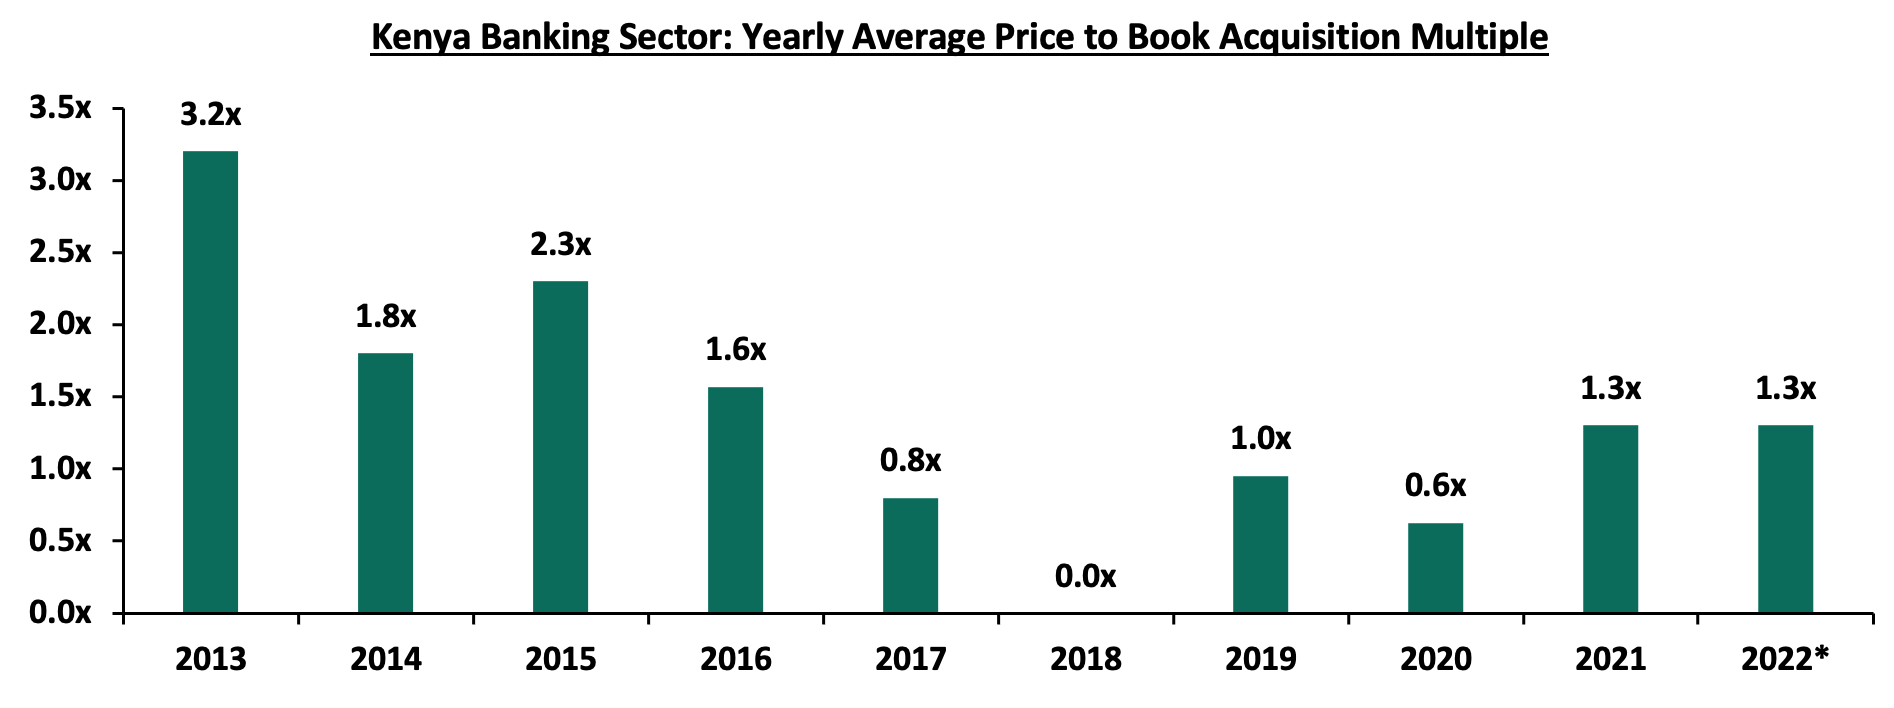
- Also on 8th June 2022, Centum Investment Company PLC, announced that it had entered into a binding agreement to sell its 83.4% shareholding in Sidian Bank to Access Bank PLC, for a consideration of Kshs 4.3 bn subject to relevant approval from the Central bank of Kenya and the Competition Authority of Kenya. The price consideration from Access Bank translates to a Price to Book Value (P/B) of 1.1x, which is lower than the 8-year acquisitions average P/B of 1.3x, but higher than the current average P/B of the listed banking stocks of 0.9x. For more information, please see our Cytonn Weekly #23/2022. Below is a summary of the deals in the last 9years that have either happened, been announced or expected to be concluded:
|
Acquirer |
Bank Acquired |
Book Value at Acquisition (Kshs bn) |
Transaction Stake |
Transaction Value (Kshs bn) |
P/Bv Multiple |
Date |
|
KCB Group PLC |
Trust Merchant Bank (TMB) |
12.4 |
85.0% |
15.7 |
1.5x |
August-22 |
|
Access Bank PLC (Nigeria) |
Sidian Bank |
4.9 |
83.4% |
4.3 |
1.1x |
June-22* |
|
KCB Group |
Banque Populaire du Rwanda |
5.3 |
100.0% |
5.6 |
1.1x |
August-21 |
|
I&M Holdings PLC |
Orient Bank Limited Uganda |
3.3 |
90.0% |
3.6 |
1.1x |
April-21 |
|
KCB Group** |
ABC Tanzania |
Unknown |
100% |
0.8 |
0.4x |
Nov-20* |
|
Co-operative Bank |
Jamii Bora Bank |
3.4 |
90.0% |
1 |
0.3x |
Aug-20 |
|
Commercial International Bank |
Mayfair Bank Limited |
1.0 |
51.0% |
Undisclosed |
N/D |
May-20* |
|
Access Bank PLC (Nigeria) |
Transnational Bank PLC. |
1.9 |
100.0% |
1.4 |
0.7x |
Feb-20* |
|
Equity Group ** |
Banque Commerciale Du Congo |
8.9 |
66.5% |
10.3 |
1.2x |
Nov-19* |
|
KCB Group |
National Bank of Kenya |
7.0 |
100.0% |
6.6 |
0.9x |
Sep-19 |
|
CBA Group |
NIC Group |
33.5 |
53%:47% |
23.0 |
0.7x |
Sep-19 |
|
Oiko Credit |
Credit Bank |
3.0 |
22.8% |
1 |
1.5x |
Aug-19 |
|
CBA Group** |
Jamii Bora Bank |
3.4 |
100.0% |
1.4 |
0.4x |
Jan-19 |
|
AfricInvest Azure |
Prime Bank |
21.2 |
24.2% |
5.1 |
1.0x |
Jan-18 |
|
KCB Group |
Imperial Bank |
Unknown |
Undisclosed |
Undisclosed |
N/A |
Dec-18 |
|
SBM Bank Kenya |
Chase Bank Ltd |
Unknown |
75.0% |
Undisclosed |
N/A |
Aug-18 |
|
DTBK |
Habib Bank Kenya |
2.4 |
100.0% |
1.8 |
0.8x |
Mar-17 |
|
SBM Holdings |
Fidelity Commercial Bank |
1.8 |
100.0% |
2.8 |
1.6x |
Nov-16 |
|
M Bank |
Oriental Commercial Bank |
1.8 |
51.0% |
1.3 |
1.4x |
Jun-16 |
|
I&M Holdings |
Giro Commercial Bank |
3.0 |
100.0% |
5.0 |
1.7x |
Jun-16 |
|
Mwalimu SACCO |
Equatorial Commercial Bank |
1.2 |
75.0% |
2.6 |
2.3x |
Mar-15 |
|
Centum |
K-Rep Bank |
2.1 |
66.0% |
2.5 |
1.8x |
Jul-14 |
|
GT Bank |
Fina Bank Group |
3.9 |
70.0% |
8.6 |
3.2x |
Nov-13 |
|
Average |
74.5% |
1.3x |
||||
|
* Announcement Date ** Deals that were dropped |
||||||
The acquisition valuations for banks have been recovering, with the valuations increasing from the average of 0.6x in 2020 to 1.3x in 2021 and H1’2022 each. This however still remains low compared to historical prices paid as highlighted in the chart below;
The number of commercial banks in Kenya currently stands at 38, same as in Q1’2022 but lower than the 43 licensed banks in FY’2015. The ratio of the number of banks per 10 million populations in Kenya now stands at 6.9x, which is a reduction from 9.0x in FY’2015 demonstrating continued consolidation of the banking sector. However, despite the ratio improving, Kenya still remains overbanked as the number of banks remains relatively high compared to the population. To bring the ratio to 5.5x, we ought to reduce the number of banks from the current 38 banks to 30 banks. For more on this see our topical.
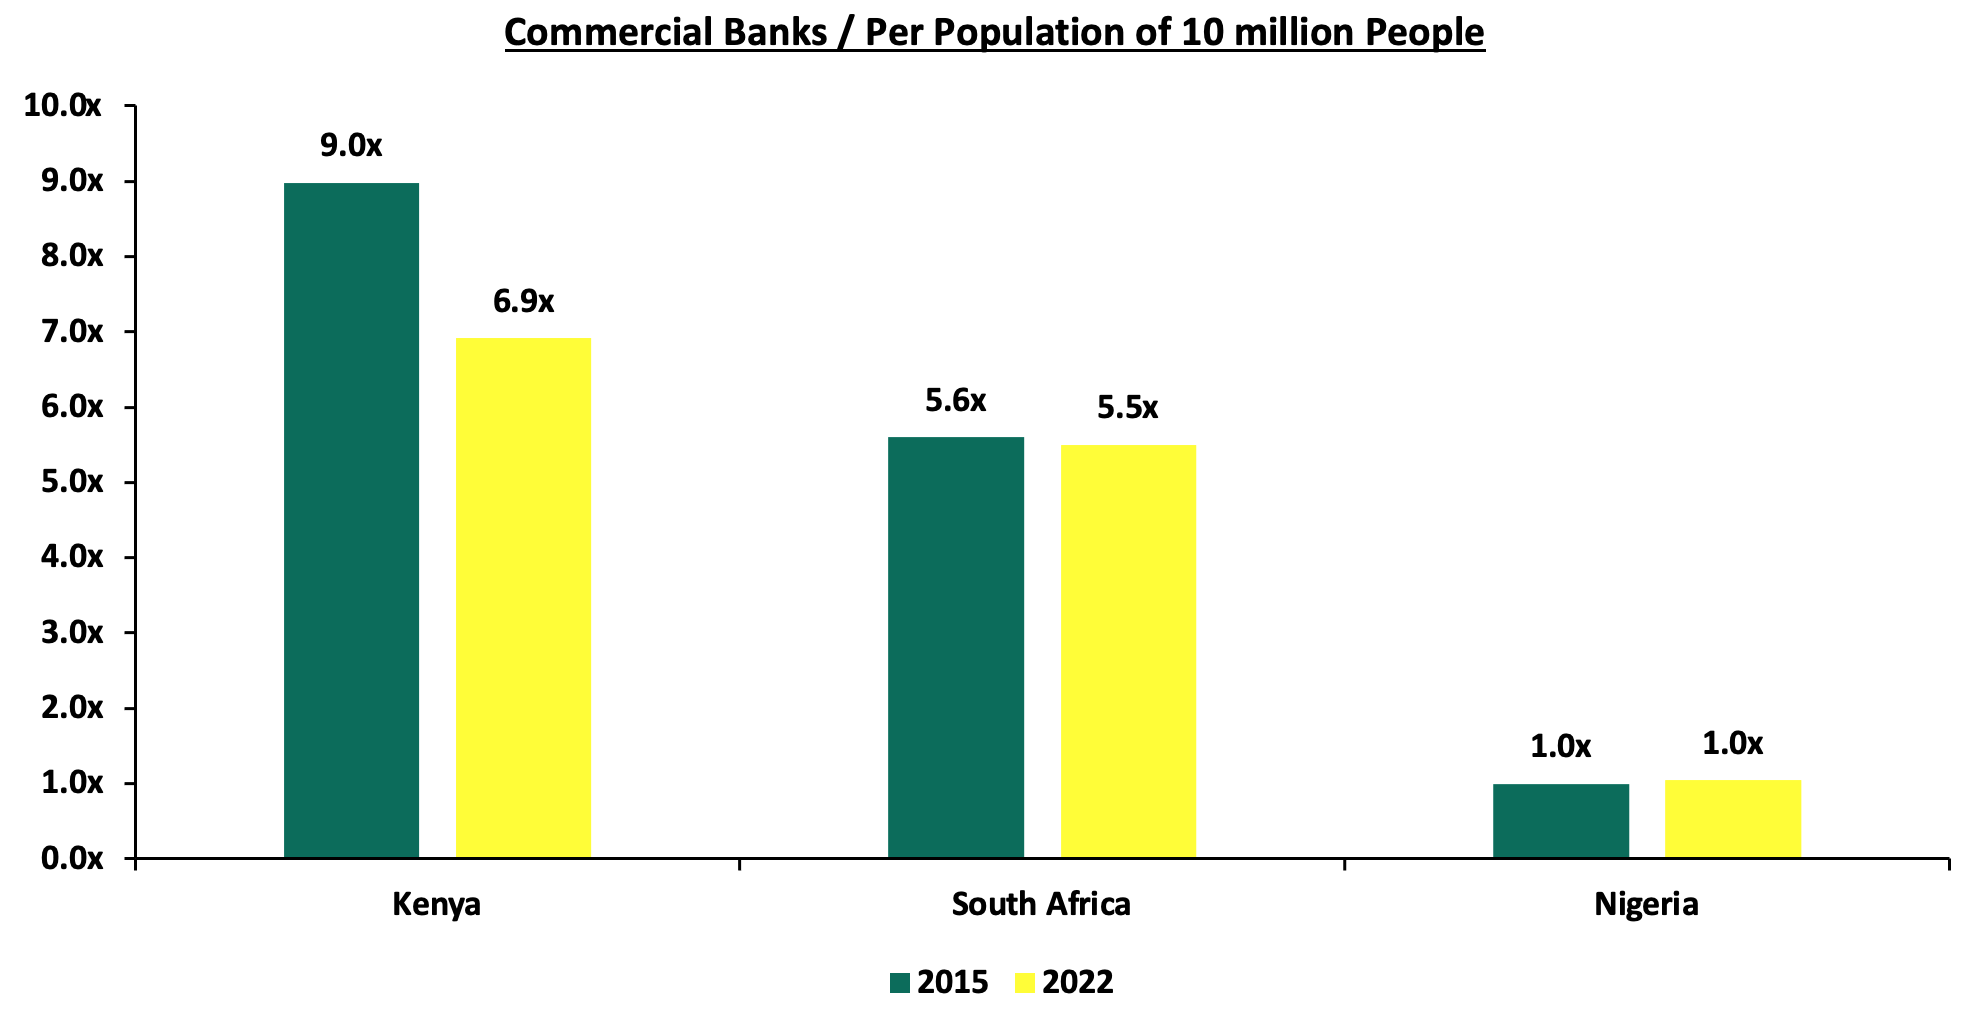
Source: World Bank, Central Bank of Kenya, South Africa Reserve Bank, Central Bank of Nigeria,
- Asset Quality: Asset quality for listed banks deteriorated in H1’2022, with the Gross NPL ratio increasing by 0.3% points to 13.0%, from 12.7% in H1’2021. According to the July 2022 MPC Press Release, the NPL ratio for the entire banking sector stood at 14.7% as at June 2022, compared to 14.1% in April, with majority of the non-performing loans stemming from sectors like the agriculture, energy and water, as well as the transport and communication sectors. The increase in NPL ratio was primarily due to the deteriorating business environment occasioned by the increased cost of living emanating from elevated inflationary pressures. We expect credit risk to remain elevated in the short term given the soaring inflation as well as persistent supply chain constraints which are expected to continue to weigh on the business environment. The chart below highlights the asset quality trend for the listed banks:
The table below highlights the asset quality for the listed banking sector:
|
|
H1'2021 NPL Ratio** |
H1'2022 NPL Ratio* |
% point change in NPL Ratio |
H1'2021 NPL Coverage** |
H1'2022 NPL Coverage* |
% point change in NPL Coverage |
|
ABSA Bank Kenya |
7.9% |
7.1% |
(0.8%) |
70.9% |
78.5% |
7.6% |
|
KCB |
14.4% |
21.4% |
7.0% |
61.6% |
45.8% |
(15.8%) |
|
Equity Group |
11.4% |
8.8% |
(2.6%) |
63.2% |
64.1% |
0.9% |
|
NCBA Group |
16.7% |
13.5% |
(3.2%) |
68.0% |
62.8% |
(5.2%) |
|
Standard Chartered Bank Kenya |
15.4% |
15.4% |
0.1% |
81.4% |
83.9% |
2.5% |
|
Stanbic Bank |
9.5% |
9.4% |
(0.1%) |
51.2% |
56.0% |
4.8% |
|
I&M Holdings |
10.4% |
9.3% |
(1.1%) |
67.2% |
59.2% |
(8.0%) |
|
Diamond Trust Bank |
10.4% |
12.8% |
2.4% |
41.8% |
44.2% |
2.4% |
|
Co-operative Bank of Kenya |
15.2% |
14.1% |
(1.1%) |
63.5% |
65.8% |
2.3% |
|
HF Group |
22.6% |
18.5% |
(4.1%) |
65.1% |
77.6% |
12.5% |
|
Mkt Weighted Average |
12.7% |
13.0% |
0.3% |
64.6% |
62.3% |
(2.3%) |
|
*Market cap weighted as at 09/09/2022 |
||||||
|
**Market cap weighted as at 09/09/2021 |
||||||
Key take-outs from the table include;
- KCB Group had the highest NPL Ratio jump by 7.0% points to 21.4%, from 14.4% recorded in H1’2021, which was 6.7% points higher than industry average of 0.3% points, mainly attributable to KCB Kenya's deterioration in its NPL ratio to 22.8% from 11.9% in H1'2021, following reclassification of 9 large accounts to non-performing loans in the Kenya market. Additionally, the Group has a 50.1% exposure to corporate loans, which have been impacted by delayed recovery from COVID-19, increased inflationary pressures and pending government bills,
- Asset quality for the listed banks deteriorated during the period, with the weighted average NPL ratio increasing by 0.3% points to a market cap weighted average of 13.0%, from an average of 12.7% for the listed banking sector in H1’2021, and,
- NPL Coverage for the listed banks declined to a market cap weighted average of 62.4% in H1’2022, from 64.5% recorded in H1’2021, as the banks reduced their provisioning following reduced risks with some sectors such as tourism, agriculture and manufacturing continue to record gradual recovery.
- Capital Raising: In H1’2022, listed banks continued to borrow from international institutions to not only strengthen their capital position but also boost their ability to lend to the perceived riskier Micro Small and Medium Sized Enterprises (MSMEs) segment. In the period under review, Equity Group received USD 165.0 mn (Kshs 18.6 bn) facility from the International Finance Corporation (IFC) to Equity Bank Kenya in January 2022. For more information see our Cytonn Weekly #19/2022.
Additionally, the International Finance Corporation (IFC) disclosed a plan to extend USD 150.0 mn (Kshs 18.0 bn) to KCB Group in form of a senior unsecured loan in August. The loan facilities to both banks is aimed at supporting the growth of the banks’ climate finance portfolio which entails clients in sectors such as manufacturing, real estate and agriculture. For more information see our Cytonn Monthly August 2022.
Section II: Summary of the Performance of the Listed Banking Sector in H1’2022:
The table below highlights the performance of the banking sector, showing the performance using several metrics, and the key take-outs of the performance;
|
Bank |
Core EPS Growth |
Interest Income Growth |
Interest Expense Growth |
Net Interest Income Growth |
Net Interest Margin |
Non-Funded Income Growth |
NFI to Total Operating Income |
Growth in Total Fees |
Deposit Growth |
Growth in Government Securities |
Loan to Deposit Ratio |
Loan Growth |
|
HF |
114.4% |
4.6% |
(1.3%) |
11.4% |
4.5% |
53.2% |
32.7% |
13.2% |
3.4% |
87.8% |
89.2% |
(1.1%) |
|
NCBA |
66.9% |
10.9% |
12.0% |
10.2% |
6.0% |
32.5% |
48.9% |
(2.2%) |
7.1% |
17.0% |
53.5% |
4.5% |
|
Co-op |
55.7% |
10.0% |
5.5% |
11.8% |
8.4% |
28.8% |
38.7% |
36.8% |
3.8% |
0.7% |
78.0% |
9.6% |
|
Stanbic |
36.9% |
14.8% |
(2.2%) |
20.9% |
5.4% |
25.1% |
45.1% |
11.1% |
(0.7%) |
(36.1%) |
94.5% |
17.5% |
|
Equity |
36.1% |
28.6% |
30.9% |
27.8% |
7.3% |
24.4% |
39.4% |
28.5% |
18.5% |
16.9% |
67.0% |
28.9% |
|
KCB |
28.4% |
15.7% |
30.3% |
11.5% |
8.5% |
29.9% |
32.1% |
24.4% |
15.6% |
30.4% |
80.4% |
20.3% |
|
DTB-K |
25.6% |
12.5% |
11.4% |
13.3% |
5.2% |
17.8% |
26.0% |
9.4% |
10.4% |
(4.3%) |
67.4% |
14.3% |
|
I&M |
15.9% |
19.3% |
20.2% |
18.7% |
6.4% |
28.2% |
32.5% |
30.1% |
13.2% |
17.2% |
73.8% |
13.0% |
|
ABSA |
13.0% |
21.3% |
25.1% |
20.3% |
7.6% |
10.8% |
31.0% |
(10.0%) |
6.7% |
(0.4%) |
92.9% |
19.5% |
|
SCBK |
10.9% |
4.4% |
(21.4%) |
9.9% |
6.4% |
10.9% |
35.6% |
(6.2%) |
3.1% |
2.1% |
44.8% |
(1.3%) |
|
H1'22 Mkt Weighted Average* |
34.0% |
18.0% |
18.6% |
17.7% |
7.3% |
24.4% |
37.1% |
17.9% |
11.3% |
11.6% |
72.7% |
17.7% |
|
H1'21 Mkt Weighted Average** |
136.0% |
15.0% |
10.8% |
17.6% |
7.4% |
19.2% |
35.6% |
16.6% |
18.4% |
12.4% |
68.8% |
11.7% |
|
*Market cap weighted as at 09/09/2022 **Market cap weighted as at 09/09/2021 |
||||||||||||
Key takeaways from the table include:
- The listed banks recorded a 34.0% weighted average growth in core Earnings per Share (EPS), compared to a weighted average increase of 136.0% in H1’2021 for the listed banking sector,
- The Banks have recorded a weighted average deposit growth of 11.3%, slower than the 18.4% growth recorded in H1’2021, an indication of reduced investment risk in the business environment,
- Interest income grew by 18.0%, compared to a growth of 15.0% recorded in H1’2021 while the weighted average Yield on Interest Earning Assets (YIEA) decreased to 9.8%, from the 9.9% recorded in H1’2021 for the listed banking sector. On the other hand, the Net Interest Margin (NIM) stood at 7.3%, 0.1% points lower than the 7.4% recorded in H1’2021 for the whole listed banking sector, and,
- Non-Funded Income grew by 24.4%, compared to the 19.2% growth recorded in H1’2021. This can be attributable to the faster growth in the fees and commission which grew by 18.0% outpacing 16.6% growth in H1’2021.
Section III: Outlook of the banking sector:
Based on the current operating environment, we believe the future performance of the banking sector will be mainly shaped by the following key factors:
- Revenue Diversification: In H1’2022, Non-Funded Income recorded a 24.4% weighted average growth, an increase from the 19.2% growth recorded in H1’2021, with many banks diversifying their revenue sources. We therefore believe that there exists an opportunity for the sector to further increase NFI contribution to revenue given the continuous adoption of digital channels by banks and their clients after the pandemic has created more revenue opportunities for the sector,
- Consolidation: Consolidation remains a key theme going forward with the current environment offering opportunities for larger banks with a sufficient capital base to expand and take advantage of the market's low valuations, as well as further consolidate out smaller and weaker banks. Bigger banks are also more profitable and have better deposit growth coupled with cheaper cost of funds compared to smaller banks. As such, consolidation will help the smaller banks meet the minimum capital requirement and also expand big bank’s asset base,
- Regional Expansion: Notably, majority of the bigger banks have continued to cushion over unsystematic risks specific to the local market by expanding their operations into other African nations. Banks such as KCB and Equity Group have been leveraging on expansion which has largely contributed to their increased asset base as well as earnings growth. As aforementioned, KCB Group recently announced the acquisition of Trust Merchant Bank (TMB) in DRC. We expect other banks to continue with the expansion trend for revenue optimization, and,
- Integration of Climate-Related Risk Management: The release of Guidance on Climate-Related Risk Management report by the Central Bank of Kenya (CBK) is driving banks to channel their long term financing into environmental-friendly assets that are more sustainable and have lower risk of damage loss as a result of climate change. Banks will also lend to clients whose activities do not pose an environmental risk and will ultimately lead to improvement of collateral quality. Key to note, Equity Group and KCB Group have sourced for loans from International Finance Corporation (IFC) aimed at supporting the growth of the bank’s climate finance portfolio.
Section IV: Brief Summary and Ranking of the Listed Banks:
As per our analysis on the banking sector from a franchise value and a future growth opportunity perspective, we carried out a comprehensive ranking of the listed banks. For the franchise value ranking, we included the earnings and growth metrics as well as the operating metrics shown in the table below in order to carry out a comprehensive review of the banks:
|
Bank |
Loan to Deposit Ratio |
Cost to Income (With LLP) |
Return on Average Capital Employed |
Deposits/ Branch (bn) |
Gross NPL Ratio |
NPL Coverage |
Tangible Common Ratio |
Non Funded Income/Revenue |
|
ABSA Bank |
92.9% |
56.4% |
16.8% |
3.4 |
7.1% |
78.5% |
12.5% |
31.0% |
|
NCBA Group |
53.5% |
58.9% |
14.5% |
4.5 |
13.5% |
62.8% |
12.5% |
48.9% |
|
Equity Bank |
67.0% |
52.9% |
21.2% |
2.8 |
8.8% |
64.1% |
10.1% |
39.4% |
|
KCB Group |
80.4% |
52.9% |
17.0% |
1.8 |
21.4% |
45.8% |
14.5% |
32.1% |
|
SCBK |
44.8% |
51.3% |
14.0% |
13.0 |
15.4% |
81.8% |
14.5% |
35.6% |
|
Coop Bank |
78.0% |
55.8% |
16.1% |
2.4 |
14.1% |
14.1% |
15.0% |
38.7% |
|
Stanbic Bank |
94.5% |
40.0% |
12.0% |
10.3 |
9.4% |
56.0% |
14.7% |
45.1% |
|
DTBK |
67.4% |
62.3% |
8.4% |
2.7 |
12.8% |
44.2% |
14.1% |
26.0% |
|
I&M Holdings |
73.8% |
55.2% |
10.9% |
3.6 |
9.5% |
59.2% |
13.8% |
32.5% |
|
HF Group |
89.2% |
95.9% |
0.7% |
1.8 |
18.5% |
71.8% |
13.6% |
32.7% |
|
Weighted Average H1’2022 |
73.0% |
53.6% |
16.9% |
4.0 |
12.9% |
56.2% |
12.9% |
37.1% |
|
Market cap weighted as at 09/09/2022 |
||||||||
The overall ranking was based on a weighted average ranking of Franchise value (accounting for 60.0%) and intrinsic value (accounting for 40.0%). The Intrinsic Valuation is computed through a combination of valuation techniques, with a weighting of 40.0% on Discounted Cash-flow Methods, 35.0% on Residual Income and 25.0% on Relative Valuation, while the Franchise ranking is based on banks operating metrics, meant to assess efficiency, asset quality, diversification, and profitability, among other metrics. The overall H1’2022 ranking is as shown in the table below:
|
Bank |
Franchise Value Rank |
Intrinsic Value Rank |
Weighted Rank |
Q1'2022 |
H1’2022 |
|
Equity Group Holdings Ltd |
3 |
1 |
1.8 |
1 |
1 |
|
Co-operative Bank of Kenya Ltd |
1 |
4 |
2.8 |
4 |
2 |
|
ABSA |
4 |
3 |
3.4 |
5 |
3 |
|
KCB Group Plc |
7 |
2 |
4.0 |
2 |
4 |
|
I&M Holdings |
4 |
5 |
4.6 |
8 |
5 |
|
Stanbic Bank/Holdings |
1 |
8 |
5.2 |
3 |
6 |
|
SCBK |
4 |
7 |
5.8 |
7 |
7 |
|
DTBK |
10 |
6 |
7.6 |
6 |
8 |
|
NCBA Group Plc |
8 |
9 |
8.6 |
9 |
9 |
|
HF Group Plc |
9 |
10 |
9.6 |
10 |
10 |
Major Changes from the H1’2022 Ranking are:
- KCB Group’s rank declined to position 4 in H1’2022 from position 2 in Q1’2022, attributable to an increase in the bank’s NPL ratio to 21.4%, from 16.9% in Q1’2022. However, the bank’s Return on Average Equity increased to 23.2%, from 22.9% recorded in Q1’2022, and,
- Co-operative Bank’s rank improved to position 2 in H1’2022 from position 4 in Q1’2022 attributable to the improvement in its Net Interest Margin to 8.4%, from the 8.3% recorded in Q1’2022, leading to an increase in the bank’s franchise value score.
For more information, see our Cytonn H1’2022 Listed Banking Sector Review
Disclaimer: The views expressed in this publication are those of the writers where particulars are not warranted. This publication, which is in compliance with Section 2 of the Capital Markets Authority Act Cap 485A, is meant for general information only and is not a warranty, representation, advice or solicitation of any nature. Readers are advised in all circumstances to seek the advice of a registered investment advisor.

- Talk to us
- Kenya
- P.O Box 20695 - 00200, Nairobi, Kenya
- Cell +254709101200
- Tel +254709101200
- WhatsApp +254741676635
- United States
- +254709101200
- DOWNLOAD OUR APP
-


- Kenya
- 8th Floor, Pinetree Plaza, Kaburu Drive, Ngong Road, Nairobi, Kenya
- USA
- Suite 1150, 1775 Eye Street NW, USA, Washington DC 20006, USA
- Investments
- High Yield
- Private Equity
- Real Estate
- Real Estate
- RiverRun Estates
- Cytonn Towers
- The Ridge
- Taraji Heights
- The Alma