Kenya’s Listed Banks Q3’2023 Report, & Cytonn Weekly #51/2023
By Research, Dec 24, 2023
Executive Summary
Fixed Income
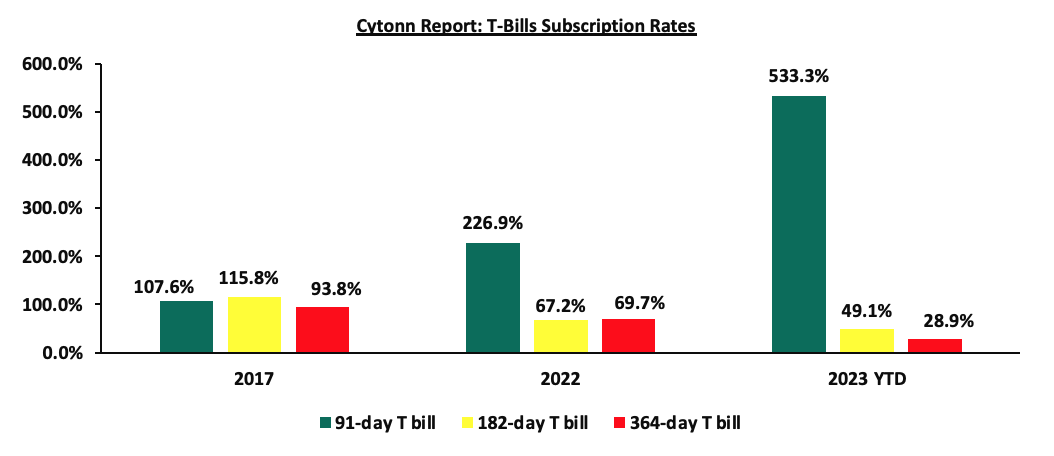
During the week, T-bills were undersubscribed for the second consecutive week, with the overall undersubscription rate coming in at 86.8%, albeit higher than the undersubscription rate of 72.3% recorded the previous week. Investors’ preference for the shorter 91-day paper persisted, with the paper receiving bids worth Kshs 16.6 bn against the offered Kshs 4.0 bn, translating to an oversubscription rate of 415.9%, albeit higher than the oversubscription rate of 344.8% recorded the previous week. The subscription rates for the 182-day and 364-day papers recorded mixed performance, with the 182-day decreasing to 22.9% from 29.2%, while the 364-day paper increased to 19.2% from 6.3%, recorded the previous week. The government accepted a total of Kshs 20.7 bn worth of bids out of Kshs 20.8 bn of bids received, translating to an acceptance rate of 99.4%. The yields on the government papers continued to rise, with the yields on the 364-day, 182-day, and 91-day papers increasing by 6.7 bps, 5.0 bps, and 11.2 bps to 15.9%, 16.0%, and 15.9% respectively;
During the week, the National Treasury gazetted the revenue and net expenditures for the fifth month of FY’2023/2024, ending 30th November 2023, indicating that the total revenue collected as at the end of November 2023 amounted to Kshs 882.3 bn, equivalent to 34.2% of the revised estimates of Kshs 2,576.8 bn for FY’2023/2024 and is 82.2% of the prorated estimates of Kshs 1,073.6 bn;
Additionally, we are projecting the y/y inflation rate for December 2023 to come in at the range of 6.6%-6.8% mainly on the back of reduced fuel prices.
Equities
During the week, the equities market was on a downward trajectory, with NASI losing the most by 1.1%, while NSE 20, NSE 25, and NSE 10 lost by 0.2%, 0.5%, and 0.7% respectively, taking the YTD performance to losses of 28.5%, 11.1%, and 24.7% for NASI, NSE 20, and NSE 25, respectively. The equities market performance was driven by losses recorded by large-cap stocks such as Bamburi, Equity Bank, and Safaricom of 7.8%, 4.8%, and 3.9% respectively. The losses were, however, mitigated by gains recorded by large-cap stocks such as KCB, Standard Chartered Bank, and EABL of 14.4%, 3.1%, and 2.7% respectively;
Real Estate
During the week, the Kenya National Bureau of Statistics (KNBS) released the Leading Economic Indicators (LEI) October 2023 Report highlighting overall international arrivals through Jomo Kenyatta International Airport (JKIA) and Moi International Airport (MIA) increased by 42.3% to 451,441 persons from 317,196 persons recorded in Q2’2023;
In the infrastructure sector, the National Treasury announced that the Nairobi-Mombasa Expressway project secured first-stage approval for construction under a Private-Public Partnership (PPP) model from the PPP Committee. Following the approval, the 473.0-Kilometre highway project valued at USD 3.6 bn (Kshs 555.1 bn) is set to proceed to the development stage;
In the industrial sector, global print and packaging firm Printcare Packaging Limited announced it had picked Africa Logistics Properties (ALP) West Logistics Park to service its expansion. Printcare settled on ALP’s West Logistics Park situated in Limuru due to its strategic location, as well as high-quality amenities and ALP’s commitment to offer international quality warehousing solutions and facilities in the region;
In the regulated Real Estate Funds sector, under the Real Estate Investment Trusts (REITs) segment, Fahari I- REIT closed the week trading at an average price of Kshs 6.3 per share in the Nairobi Securities Exchange, representing a 2.2% decline from the Kshs 6.4 recorded the previous week;
On the Unquoted Securities Platform, as at 1st December 2023, Acorn D-REIT and I-REIT closed the week trading at Kshs 25.3 and Kshs 21.7 per unit, a 26.6% and 8.3% gain for the D-REIT and I-REIT, respectively, from the Kshs 20.0 inception price. In addition, Cytonn High Yield Fund (CHYF) closed the week with an annualized yield of 18.0%, remaining relatively unchanged from the previous week;
Focus of the Week
Following the release of the Q3’2023 results by Kenyan banks, the Cytonn Financial Services Research Team undertook an analysis on the financial performance of the listed banks and identified the key factors that shaped the performance of the sector;
Investment Updates:
- Weekly Rates:
- Cytonn Money Market Fund closed the week at a yield of 15.45% p.a To invest, dial *809# or download the Cytonn App from Google Playstore here or from the Appstore here;
- Cytonn High Yield Fund closed the week at a yield of 17.95% p.a. To invest, email us at sales@cytonn.com and to withdraw the interest, dial *809# or download the Cytonn App from Google Playstore here or from the Appstore here;
- We continue to offer Wealth Management Training every Wednesday, from 9:00 am to 11:00 am. The training aims to grow financial literacy among the general public. To register for any of our Wealth Management Trainings, click here;
- If interested in our Private Wealth Management Training for your employees or investment group, please get in touch with us through wmt@cytonn.com;
- Cytonn Insurance Agency acts as an intermediary for those looking to secure their assets and loved ones’ future through insurance namely; Motor, Medical, Life, Property, WIBA, Credit and Fire and Burglary insurance covers. For assistance, get in touch with us through insuranceagency@cytonn.com;
- Cytonn Asset Managers Limited (CAML) continues to offer pension products to meet the needs of both individual clients who want to save for their retirement during their working years and Institutional clients that want to contribute on behalf of their employees to help them build their retirement pot. To more about our pension schemes, kindly get in touch with us through pensions@cytonn.com;
Real Estate Updates:
- For more information on Cytonn’s real estate developments, email us at sales@cytonn.com;
- Phase 3 of The Alma is now ready for occupation and the show house is open daily. To join the waiting list to rent, please email properties@cytonn.com;
- For Third Party Real Estate Consultancy Services, email us at rdo@cytonn.com;
- For recent news about the group, see our news section here;
Hospitality Updates:
- We currently have promotions for Staycations. Visit cysuites.com/offers for details or email us at sales@cysuites.com;
Money Markets, T-Bills Primary Auction:
During the week, T-bills were undersubscribed for the second consecutive week, with the overall undersubscription rate coming in at 86.8%, albeit higher than the undersubscription rate of 72.3% recorded the previous week. Investors’ preference for the shorter 91-day paper persisted, with the paper receiving bids worth Kshs 16.6 bn against the offered Kshs 4.0 bn, translating to an oversubscription rate of 415.9%, albeit higher than the oversubscription rate of 344.8% recorded the previous week. The subscription rates for the 182-day and 364-day papers recorded mixed performance, with the 182-day decreasing to 22.9% from 29.2%, while the 364-day paper increased to 19.2% from 6.3%, recorded the previous week. The government accepted a total of Kshs 20.7 bn worth of bids out of Kshs 20.8 bn of bids received, translating to an acceptance rate of 99.4%. The yields on the government papers continued to rise, with the yields on the 364-day, 182-day, and 91-day papers increasing by 6.7 bps, 5.0 bps, and 11.2 bps to 15.9%, 16.0%, and 15.9% respectively. The chart below compares the overall average T-bill subscription rates obtained in 2017, 2022, and 2023 Year-to-date (YTD):
Money Market Performance:
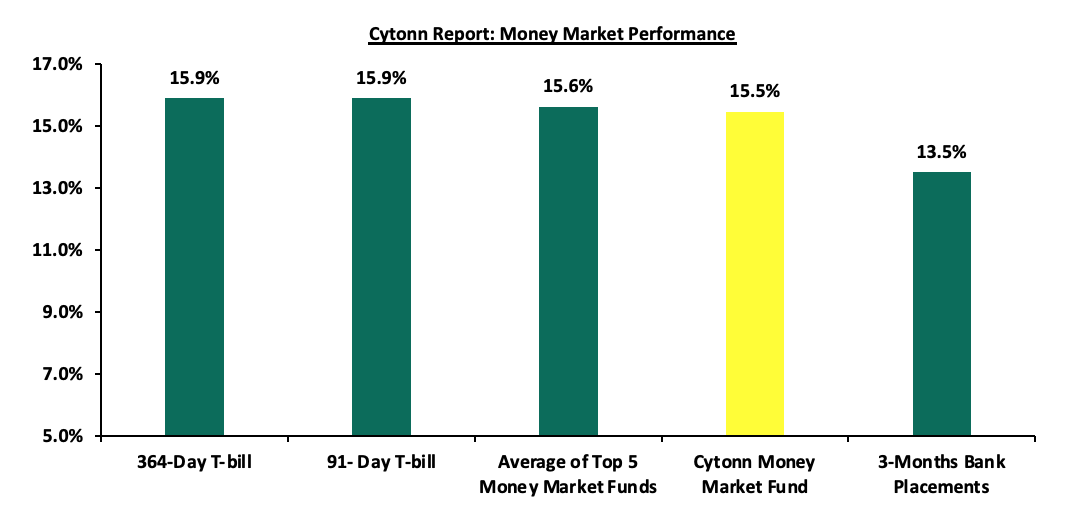
In the money markets, 3-month bank placements ended the week at 13.5% (based on what we have been offered by various banks), and the yields on the 364-day paper increased by 6.7 bps to 15.9% and 91-day T-bill yield increased by 11.2 bps to 15.9%. The yields of the Cytonn Money Market Fund increased by 2.0 bps to 15.5% from 15.4% recorded the previous week, and the average yields on the Top 5 Money Market Funds increased by 10.4 bps to 15.6%, from 15.5% recorded the previous week.
The table below shows the Money Market Fund Yields for Kenyan Fund Managers as published on 22nd December 2023:
|
Cytonn Report: Money Market Fund Yield for Fund Managers as published on 22nd December 2023 |
||
|
Rank |
Fund Manager |
Effective Annual |
|
1 |
Etica Money Market Fund |
16.0% |
|
2 |
Nabo Africa Money Market Fund |
15.9% |
|
3 |
Cytonn Money Market Fund (Dial *809# or download Cytonn App) |
15.5% |
|
4 |
GenAfrica Money Market Fund |
15.4% |
|
5 |
Lofty-Corban Money Market Fund |
15.4% |
|
6 |
Sanlam Money Market Fund |
14.7% |
|
7 |
Enwealth Money Market Fund |
14.5% |
|
8 |
Apollo Money Market Fund |
14.4% |
|
9 |
Kuza Money Market fund |
14.1% |
|
10 |
AA Kenya Shillings Fund |
14.0% |
|
11 |
Madison Money Market Fund |
13.9% |
|
12 |
Absa Shilling Money Market Fund |
13.8% |
|
13 |
Co-op Money Market Fund |
13.8% |
|
14 |
Jubilee Money Market Fund |
13.6% |
|
15 |
GenCap Hela Imara Money Market Fund |
13.6% |
|
16 |
Old Mutual Money Market Fund |
13.1% |
|
17 |
Orient Kasha Money Market Fund |
13.0% |
|
18 |
Dry Associates Money Market Fund |
12.3% |
|
19 |
KCB Money Market Fund |
12.2% |
|
20 |
CIC Money Market Fund |
11.8% |
|
21 |
ICEA Lion Money Market Fund |
11.6% |
|
22 |
Equity Money Market Fund |
11.5% |
|
23 |
Mali Money Market Fund |
11.0% |
|
24 |
Mayfair Money Market Fund |
9.7% |
|
25 |
British-American Money Market Fund |
9.1% |
Source: Business Daily
Liquidity:
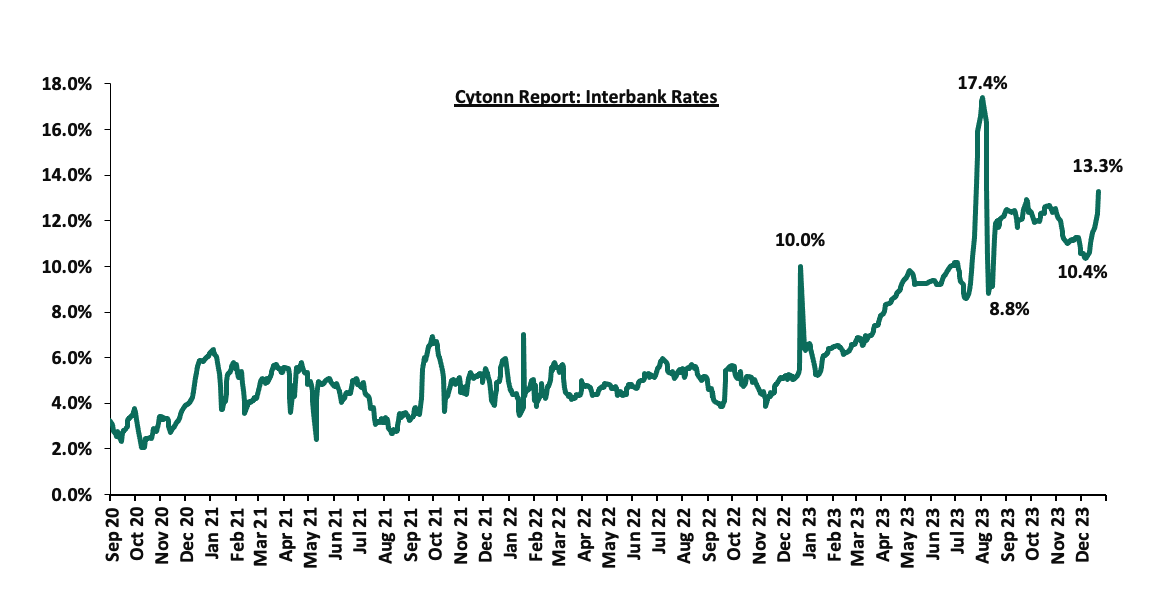
During the week, liquidity in the money markets tightened, with the average interbank rate increasing to 12.2% from 11.1% recorded the previous week, partly attributable to the tax remittances that offset government payments. The average interbank volumes traded increased by 4.7% to Kshs 33.7 bn from Kshs 32.2 bn recorded the previous week. The chart below shows the interbank rates in the market over the years:
Kenya Eurobonds:
During the week, the yields on Eurobonds were on a downward trajectory, with the yields on the 30-year Eurobond issued in 2018 declining the most by 0.6% points, to 10.3% from 10.9% recorded the previous week, while the yields on the 12-year Eurobond issued in 2021 declined the least by 0.2% points to 9.6% from 9.8% recorded the previous week. The table below shows the summary of the performance of the Kenyan Eurobonds as of 21st December 2023;
|
Cytonn Report: Kenya Eurobonds Performance |
||||||
|
|
2014 |
2018 |
2019 |
2021 |
||
|
Tenor |
10-year issue |
10-year issue |
30-year issue |
7-year issue |
12-year issue |
12-year issue |
|
Amount Issued (USD) |
2.0 bn |
1.0 bn |
1.0 bn |
0.9 bn |
1.2 bn |
1.0 bn |
|
Years to Maturity |
0.5 |
4.2 |
24.2 |
3.4 |
8.4 |
10.5 |
|
Yields at Issue |
6.6% |
7.3% |
8.3% |
7.0% |
7.9% |
6.2% |
|
02-Jan-23 |
12.9% |
10.5% |
10.9% |
10.9% |
10.8% |
9.9% |
|
01-Dec-23 |
14.4% |
11.3% |
11.2% |
11.8% |
11.2% |
10.6% |
|
14-Dec-23 |
13.9% |
10.2% |
10.9% |
10.2% |
10.3% |
9.8% |
|
15-Dec-23 |
13.6% |
10.1% |
10.4% |
10.1% |
10.1% |
9.7% |
|
18-Dec-23 |
13.7% |
10.0% |
10.4% |
10.0% |
10.1% |
9.7% |
|
19-Dec-23 |
13.2% |
10.0% |
10.3% |
10.0% |
10.0% |
9.6% |
|
20-Dec-23 |
13.5% |
9.9% |
10.3% |
9.9% |
10.0% |
9.6% |
|
21-Dec-23 |
13.4% |
9.9% |
10.3% |
9.9% |
9.9% |
9.6% |
|
Weekly Change |
(0.5%) |
(0.3%) |
(0.6%) |
(0.3%) |
(0.4%) |
(0.2%) |
|
MTD Change |
(1.0%) |
(1.5%) |
(0.9%) |
(1.9%) |
(1.3%) |
(1.0%) |
|
YTD Change |
0.5% |
(0.6%) |
(0.6%) |
(1.1%) |
(0.8%) |
(0.3%) |
Source: Central Bank of Kenya (CBK) and National Treasury
Kenya Shilling:
During the week, the Kenya Shilling depreciated against the US Dollar by 0.9% to close at Kshs 155.1, from Kshs 153.7 recorded the previous week. On a year-to-date basis, the shilling has depreciated by 25.7% against the dollar, adding to the 9.0% depreciation recorded in 2022. We expect the shilling to remain under pressure in 2023 as a result of:
- An ever-present current account deficit which came at 3.7% of GDP in Q2’2023 from 6.0% recorded in a similar period last year,
- The need for government debt servicing, continues to put pressure on forex reserves given that 67.1% of Kenya’s external debt was US Dollar denominated as of June 2023, and,
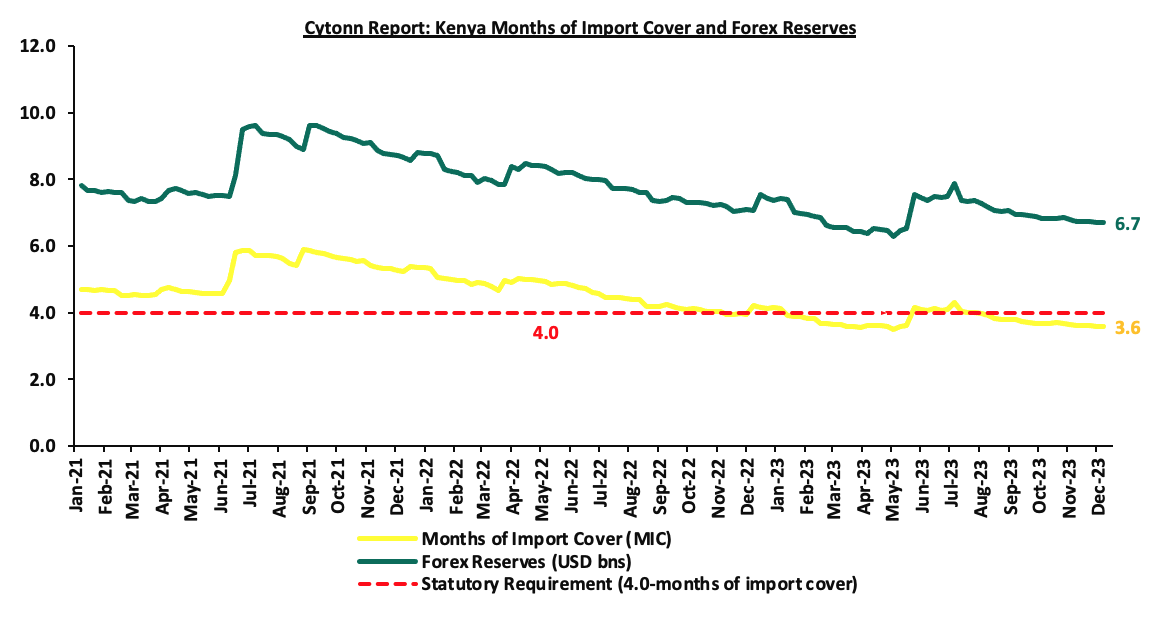
- Dwindling forex reserves, currently at USD 6.7 mn (equivalent to 3.6 months of import cover), which is below the statutory requirement of maintaining at least 4.0 months of import cover.
The shilling is however expected to be supported by:
- Diaspora remittances standing at a cumulative USD 3,817.4 mn as of November 2023, 4.0% higher than the USD 3,670.6 mn recorded over the same period in 2022, which has continued to cushion the shilling against further depreciation. In the November 2023 diaspora remittances figures, North America remained the largest source of remittances to Kenya accounting for 57.2% in the period, and,
- The tourism inflow receipts which came in at USD 268.1 mn in 2022, a significant 82.9% increase from USD 146.5 mn inflow receipts recorded in 2021, and tourist arrivals improved by 34.1% in the 12 months to October 2023, compared to a similar period in 2022.
Key to note, Kenya’s forex reserves remained relatively unchanged during the week at USD 6.7 bn recorded the previous week, equivalent to 3.6 months of import cover same as the previous week, and remained below the statutory requirement of maintaining at least 4.0 months of import cover. The chart below summarizes the evolution of Kenya's months of import cover over the years:
Weekly Highlights:
- The National Treasury gazetted the revenue and net expenditures for the fifth month of FY’2023/2024
The National Treasury gazetted the revenue and net expenditures for the fifth month of FY’2023/2024, ending 30th November 2023. Below is a summary of the performance:
|
FY'2023/2024 Budget Outturn - As at 30th November 2023 |
||||||
|
Amounts in Kshs billions unless stated otherwise |
||||||
|
Item |
12-months Original Estimates |
Revised Estimates |
Actual Receipts/Release |
Percentage Achieved of the Revised Estimates |
Prorated |
% achieved of the Prorated |
|
Opening Balance |
|
|
2.6 |
|
|
|
|
Tax Revenue |
2,495.8 |
2,495.8 |
847.3 |
34.0% |
1,039.9 |
81.5% |
|
Non-Tax Revenue |
75.3 |
80.9 |
32.4 |
40.0% |
33.7 |
96.0% |
|
Total Revenue |
2,571.2 |
2,576.8 |
882.3 |
34.2% |
1,073.6 |
82.2% |
|
External Loans & Grants |
870.2 |
849.8 |
77.0 |
9.1% |
354.1 |
21.8% |
|
Domestic Borrowings |
688.2 |
851.9 |
222.3 |
26.1% |
355.0 |
62.6% |
|
Other Domestic Financing |
3.2 |
3.2 |
3.5 |
111.1% |
1.3 |
266.6% |
|
Total Financing |
1,561.6 |
1,704.9 |
302.9 |
17.8% |
710.4 |
42.6% |
|
Recurrent Exchequer issues |
1,302.8 |
1,360.1 |
444.1 |
32.7% |
566.7 |
78.4% |
|
CFS Exchequer Issues |
1,963.7 |
2,078.8 |
575.9 |
27.7% |
866.2 |
66.5% |
|
Development Expenditure & Net Lending |
480.8 |
457.2 |
55.7 |
12.2% |
190.5 |
29.2% |
|
County Governments + Contingencies |
385.4 |
385.4 |
107.5 |
27.9% |
160.6 |
67.0% |
|
Total Expenditure |
4,132.7 |
4,281.6 |
1,183.2 |
27.6% |
1,784.0 |
66.3% |
|
Fiscal Deficit excluding Grants |
1,561.6 |
1,704.9 |
300.9 |
17.6% |
710.4 |
42.4% |
|
Total Borrowing |
1,558.4 |
1,701.7 |
299.3 |
17.6% |
709.0 |
42.2% |
Amounts in Kshs bns unless stated otherwise
The Key take-outs from the release include;
- Total revenue collected as at the end of November 2023 amounted to Kshs 882.3 bn, equivalent to 34.2% of the revised estimates of Kshs 2,576.8 bn for FY’2023/2024, and is 82.2% of the prorated estimates of Kshs 1,073.6 bn. Cumulatively, tax revenues amounted to Kshs 847.3 bn, equivalent to 34.0% of the revised estimates of Kshs 2,495.8 bn and 81.5% of the prorated estimates of Kshs 1,039.9 bn,
- Total financing amounted to Kshs 302.9 bn, equivalent to 17.8% of the revised estimates of Kshs 1,704.9 bn and is equivalent to 42.6% of the prorated estimates of Kshs 710.4 bn. Additionally, domestic borrowing amounted to Kshs 222.3 bn, equivalent to 26.1% of the revised estimates of Kshs 851.9 bn and is 62.6% of the prorated estimates of Kshs 355.0 bn,
- The total expenditure amounted to Kshs 1,183.2 bn, equivalent to 27.6% of the revised estimates of Kshs 4,281.6 bn, and is 66.3% of the prorated target expenditure estimates of Kshs 1,784.0 bn. Additionally, the net disbursements to recurrent expenditures came in at Kshs 444.1 bn, equivalent to 32.7% of the revised estimates of Kshs 1,360.1 and 78.4% of the prorated estimates of Kshs 566.7 bn,
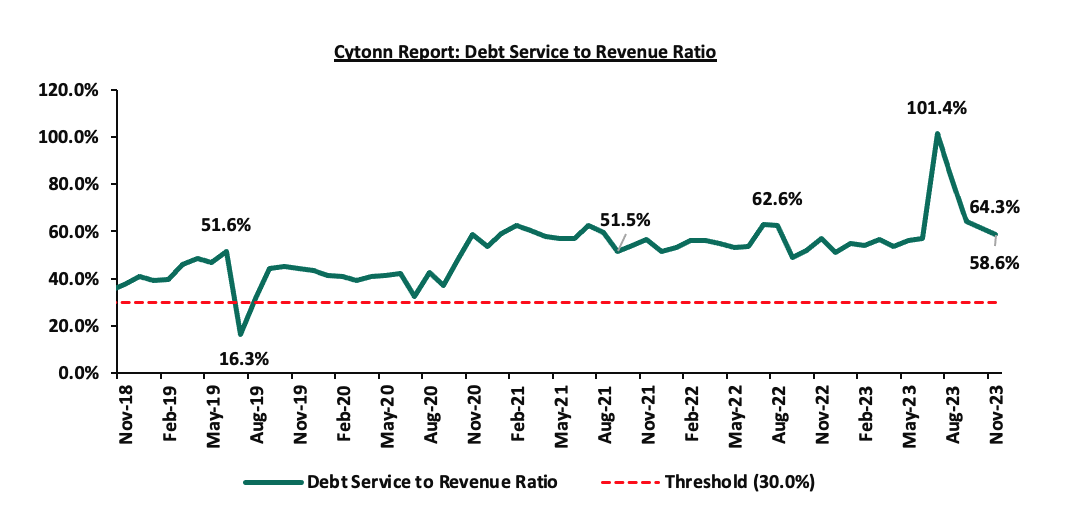
- Consolidated Fund Services (CFS) Exchequer issues came in at Kshs 575.9 bn, equivalent to 27.7% of the revised estimates of Kshs 2,078.8 bn, and are 66.5% of the prorated amount of Kshs 866.2 bn. The cumulative public debt servicing cost amounted to Kshs 517.1 bn which is 27.7% of the revised estimates of Kshs 1,866.0 bn, and is 66.5% of the prorated estimates of Kshs 777.5 bn. Additionally, the Kshs 517.1 bn debt servicing cost is equivalent to 58.6% of the actual revenues collected as at the end of November 2023. The chart below shows the debt serving to revenue ratio;
- Total Borrowings as at the end of November 2023 amounted to Kshs 299.3 bn, equivalent to 17.6% of the revised estimates of Kshs 1,701.7 bn for FY’2023/2024, and are 42.2% of the prorated estimates of Kshs 709.0 bn. The cumulative domestic borrowing of Kshs 851.9 bn comprises of Net Domestic Borrowing Kshs 471.4 bn and Internal Debt Redemptions (Rollovers) Kshs 380.5 bn.<\li>
The government's failure to achieve its prorated revenue targets in the fifth month of FY’2023/2024 reflects the challenges posed by the tough economic situation. The performance continues to be impeded by the poor business environment brought about by the high cost of living due to high fuel prices, the sustained depreciation of the Kenya shilling, as well as the tough business and entrepreneurship environment as evidenced by the decrease in the Purchasing Managers index which came in at 45.8 in November 2023, from 46.2 in October 2023. Key to note, the National Assembly approved the first supplementary budget for the FY’2023/24 which saw an increase in the government’s budget by 5.0% to Kshs 3.9 tn, from the Kshs 3.7 tn in the June budget, with the aim of mitigating economic headwinds related to debt repayment obligations as well as spending pressures from critical sectors. As such, we believe that the performance of revenue collection in the coming months will be largely determined by how soon the country’s business environment stabilizes. Notably, the government continues to implement strategies to enhance revenue collection, such as expanding the revenue base and addressing tax leakages, as well as suspending tax relief payments.
- December 2023 Inflation Projection
We are projecting the y/y inflation rate for December 2023 to come in at the range of 6.6%-6.8% mainly on the back of:
- Reduced Fuel Prices – The prices for super petrol, Diesel, and Kerosene decreased by 2.3%, 1.0% and 2.0% to retail at Kshs 212.4, Kshs 201.5 and Kshs 199.1 per litre, from Kshs 217.4, Kshs 203.5 and Kshs 203.1 per litre respectively according to the latest EPRA report . The decline was driven by lower international oil prices and the government's efforts to stabilize pump prices. Notably, the government also on September 2023 made efforts to stabilize fuel prices by extending the existing oil supply deal with the three Gulf-based companies namely; Emirates National Oil Corporation, Abu Dhabi National Oil Corporation, and Saudi Aramco until December 2024. This slight decline in fuel prices is likely to contribute to the easing of inflationary pressures as it provides a stabilizing effect on consumer purchasing power as well as business operational costs,
- The upward revision of the Central Bank Rate (CBR) to 12.50% from 10.50% – Earlier this month, the monetary policy committee noted that there was a need to tighten the monetary policy following the sustained depreciation of the Kenyan shilling as well as the heightened inflationary pressures which came in at 6.8% in the month of November, a slight decline from the 6.9% in October and remaining within the upper bound of the inflation target range of 2.5% to 7.5%. The impact of this might be muted given that the current inflation is cost driven and not demand driven as the money supply remain stable;
- Reducing food prices – Food prices have been reducing in the recent past with the food inflation easing to 7.6% in the month of November 2023, from 7.8% in October 2023 largely on account of lower prices of key non-vegetable food items particularly maize and wheat flour following improved supply attributed to the ongoing harvests and Government measures to zero-rate key food imports. This trend is expected to continue in the several coming months on the back of increased subsidization of key agricultural inputs such as fertilizers which would see an increase in food production.
Going forward, we expect inflationary pressures to ease in the short term, while remaining within the CBK’s target range of 2.5% to 7.5% aided by the easing in fuel prices and easing of domestic food prices on the account of improved supply attributed to the ongoing harvests and Government measures to zero-rate key food imports. Additionally, the upward revision of the CBR to 12.50% in the latest MPC meeting, from 10.50%, is meant to continue reducing money supply, in turn easing inflation in the short to medium term. We also expect the measures taken by the government to subsidize major inputs of agricultural production such as fertilizers to lower the cost of farm inputs and support the easing of inflation in the long term.
Rates in the Fixed Income market have been on an upward trend given the continued high demand for cash by the government and the occasional liquidity tightness in the money market. The government is 26.7% behind its prorated net domestic borrowing target of Kshs 229.2 bn, having a net borrowing position of Kshs 167.9 bn out of the domestic net borrowing target of Kshs 471.4 bn for the FY’2023/2024. Therefore, we expect a continued upward readjustment of the yield curve in the short and medium term, with the government looking to maintain the fiscal surplus through the domestic market. Owing to this, our view is that investors should be biased towards short-term fixed-income securities to reduce duration risk.
Market Performance:
During the week, the equities market was on a downward trajectory, with NASI losing the most by 1.1%, while NSE 20, NSE 25, and NSE 10 lost by 0.2%, 0.5%, and 0.7% respectively, taking the YTD performance to losses of 28.5%, 11.1%, and 24.7% for NASI, NSE 20, and NSE 25, respectively. The equities market performance was driven by losses recorded by large-cap stocks such as Bamburi, Equity Bank, and Safaricom of 7.8%, 4.8%, and 3.9% respectively. The losses were, however, mitigated by gains recorded by large-cap stocks such as KCB, Standard Chartered Bank, and EABL of 14.4%, 3.1%, and 2.7% respectively.
During the week, equities turnover increased by 58.4% to USD 5.0 mn from USD 3.1 mn recorded the previous week, taking the YTD total turnover to USD 646.5 mn. Foreign investors remained net sellers for the fourth consecutive week with a net selling position of USD 1.0 mn, from a net selling position of USD 1.5 mn recorded the previous week, taking the YTD foreign net selling position to USD 296.3 mn.
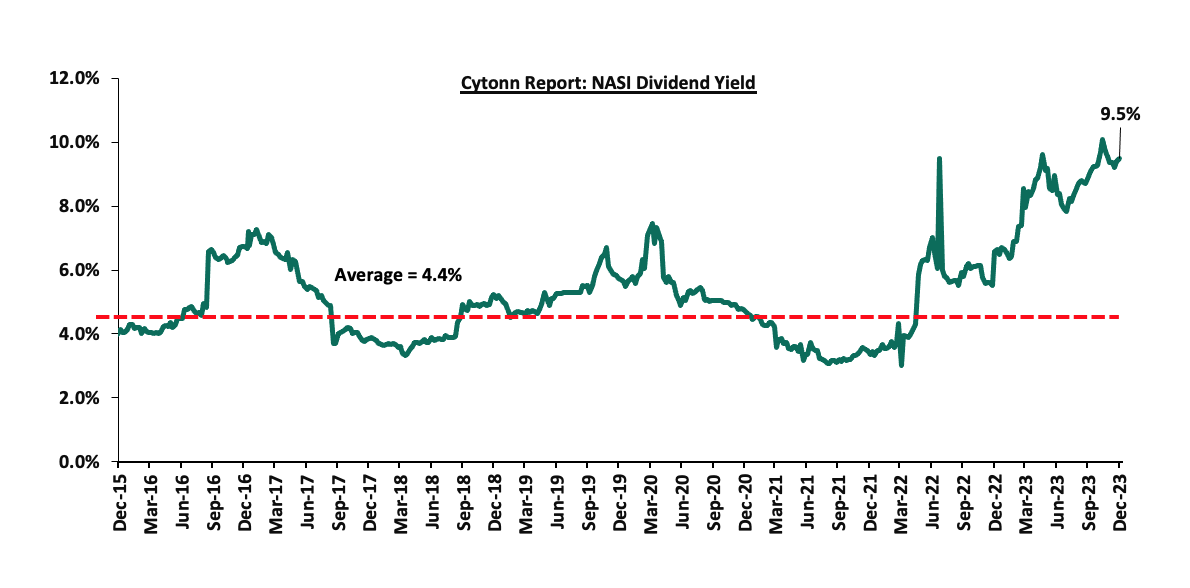
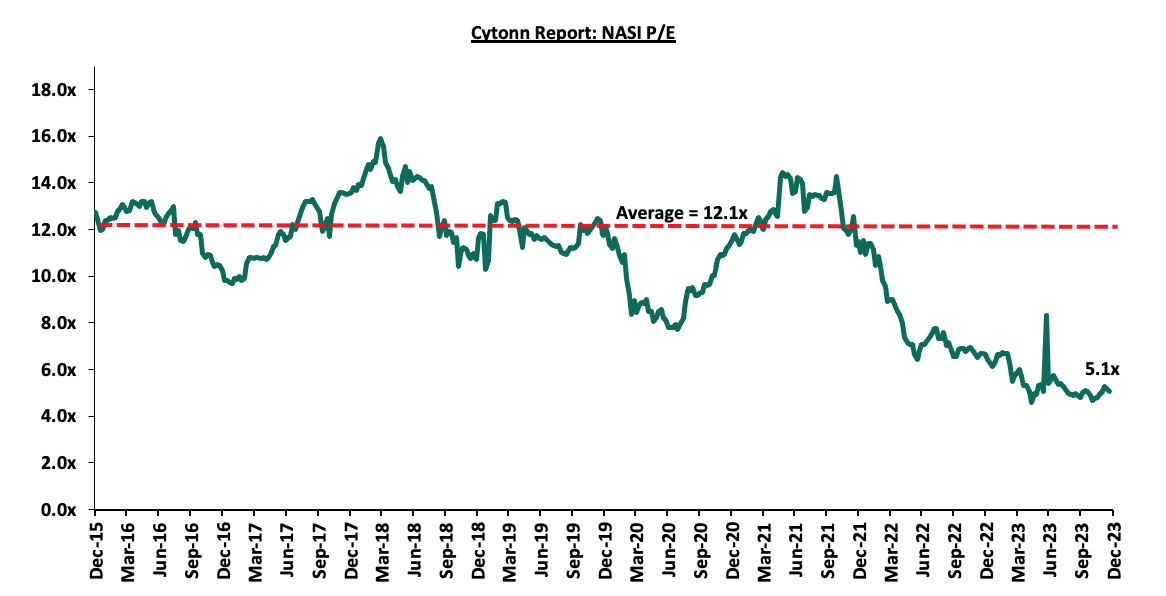
The market is currently trading at a price-to-earnings ratio (P/E) of 5.1x, 58.3% below the historical average of 12.1x. The dividend yield stands at 9.5%, 5.1% points above the historical average of 4.4%. Key to note, NASI’s PEG ratio currently stands at 0.6x, an indication that the market is undervalued relative to its future growth. A PEG ratio greater than 1.0x indicates the market is overvalued while a PEG ratio less than 1.0x indicates that the market is undervalued. The charts below indicate the historical P/E and dividend yields of the market;
Universe of Coverage:
|
Cytonn Report: Universe of Coverage |
|||||||||
|
Company |
Price as at 15/12/2023 |
Price as at 22/12/2023 |
w/w change |
YTD Change |
Target Price* |
Dividend Yield |
Upside/ Downside** |
P/TBv Multiple |
Recommendation |
|
Liberty Holdings |
3.7 |
3.7 |
1.1% |
(26.8%) |
5.9 |
0.0% |
60.4% |
0.3x |
Buy |
|
Kenya Reinsurance |
1.8 |
1.7 |
(1.1%) |
(7.0%) |
2.5 |
11.5% |
55.7% |
0.1x |
Buy |
|
Sanlam |
6.1 |
6.7 |
9.8% |
(29.6%) |
10.3 |
0.0% |
52.7% |
1.9x |
Buy |
|
Jubilee Holdings |
184.0 |
182.0 |
(1.1%) |
(8.4%) |
260.7 |
6.6% |
49.8% |
0.3x |
Buy |
|
KCB Group*** |
19.1 |
21.9 |
14.4% |
(43.0%) |
30.7 |
9.2% |
49.7% |
0.4x |
Buy |
|
ABSA Bank*** |
11.3 |
11.2 |
(0.9%) |
(8.2%) |
14.8 |
12.1% |
44.2% |
0.9x |
Buy |
|
I&M Group*** |
17.5 |
17.5 |
0.0% |
2.6% |
21.8 |
12.9% |
37.4% |
0.4x |
Buy |
|
Equity Group*** |
35.7 |
34.0 |
(4.8%) |
(24.5%) |
42.6 |
11.8% |
37.1% |
0.8x |
Buy |
|
Co-op Bank*** |
11.2 |
11.1 |
(0.9%) |
(8.7%) |
13.5 |
13.6% |
35.7% |
0.5x |
Buy |
|
Diamond Trust Bank*** |
47.0 |
46.5 |
(1.1%) |
(6.7%) |
58.1 |
10.8% |
35.7% |
0.2x |
Buy |
|
Stanbic Holdings |
105.0 |
105.3 |
0.2% |
3.2% |
118.2 |
12.0% |
24.3% |
0.8x |
Buy |
|
CIC Group |
2.3 |
2.2 |
(6.5%) |
12.6% |
2.5 |
6.0% |
22.3% |
0.7x |
Buy |
|
Standard Chartered*** |
155.5 |
160.3 |
3.1% |
10.5% |
170.9 |
13.7% |
20.4% |
1.1x |
Buy |
|
NCBA*** |
39.7 |
40.0 |
0.8% |
2.7% |
43.2 |
10.6% |
18.6% |
0.8x |
Accumulate |
|
Britam |
4.9 |
5.1 |
3.4% |
(1.9%) |
6.0 |
0.0% |
17.1% |
0.7x |
Accumulate |
|
HF Group |
3.5 |
3.5 |
(1.1%) |
10.5% |
3.2 |
0.0% |
(8.0%) |
0.2x |
Sell |
We are “Neutral” on the Equities markets in the short term due to the current tough operating environment and huge foreign investor outflows, and, “Bullish” in the long term due to current cheap valuations and expected global and local economic recovery.
With the market currently being undervalued to its future growth (PEG Ratio at 0.6x), we believe that investors should reposition towards value stocks with strong earnings growth and that are trading at discounts to their intrinsic value. We expect the current high foreign investors' sell-offs to continue weighing down the equities outlook in the short term.
- Industry Report
During the week, the Kenya National Bureau of Statistics (KNBS) released the Leading Economic Indicators (LEI) October 2023 Report which highlighted the performance of major economic indicators. Key highlights related to the Real Estate sector include;
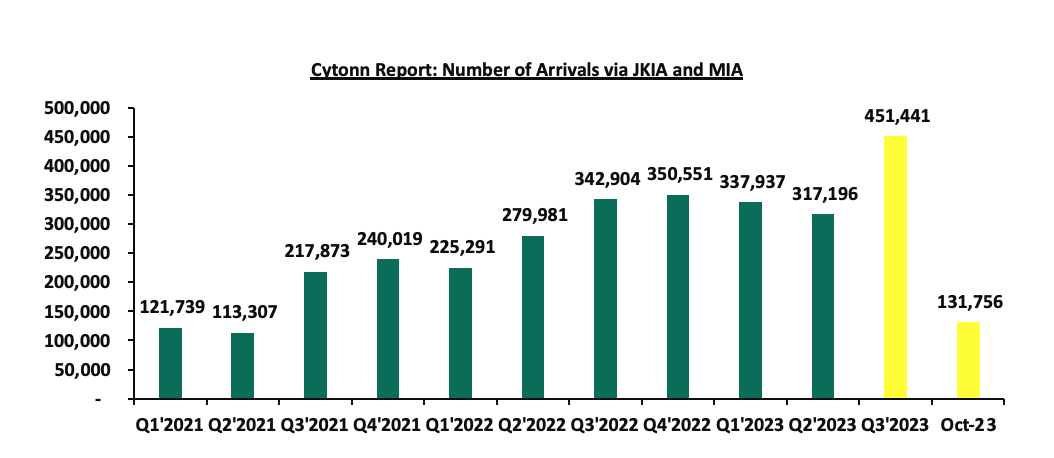
- In Q3’2023, overall international arrivals through Jomo Kenyatta International Airport (JKIA) and Moi International Airport (MIA) increased by 42.3% to 451,441 persons from 317,196 persons recorded in Q2’2023. For the month of October, visitor arrivals recorded stood at 131,756 persons, compared to 113,981 persons recorded during a similar period last year. On a year-on-year (y/y) basis, the performance represented a 28.7% increase to 1,238,330 persons, compared to 962,157 persons recorded during a similar period in 2022. The improved performance is attributable to; i) increased international marketing of Kenya’s tourism market by the Ministry of Tourism in collaboration with the Kenya Tourism Board, through platforms such as the Magical Kenya platform, ii) the tourism board alignment of its marketing initiatives towards targeting emerging and established source markets, iii) concerted efforts to promote local and regional tourism, iv) development of niche products such as cruise tourism, adventure tourism, culture and sports tourism and, iv) an increase in corporate and business Meetings, Events, and Conferences (MICE) from both the public and private sectors. The chart below shows the number of international arrivals in Kenya between Q1’2021 and October 2023;
Source: Kenya National Bureau of Statistics
- During the month of October, the value of building plans approved in the Nairobi Metropolitan Area increased by 66.1% to Kshs 16.1 bn from Kshs 9.7 bn in September 2023. On a y/y basis, the value of approved building plans in the NMA increased by 23.6% to Kshs 159.1 bn as at October, from Kshs 128.7 bn recorded during a similar period last year. This was attributable to the clearing of the large number of pending approvals by the Nairobi County Government, and sustained demand for Real Estate development facilitated by positive demographics which are above global averages. The chart below shows the trend in the value of approved building plans in Kenya between Q1’2021 and October 2023;
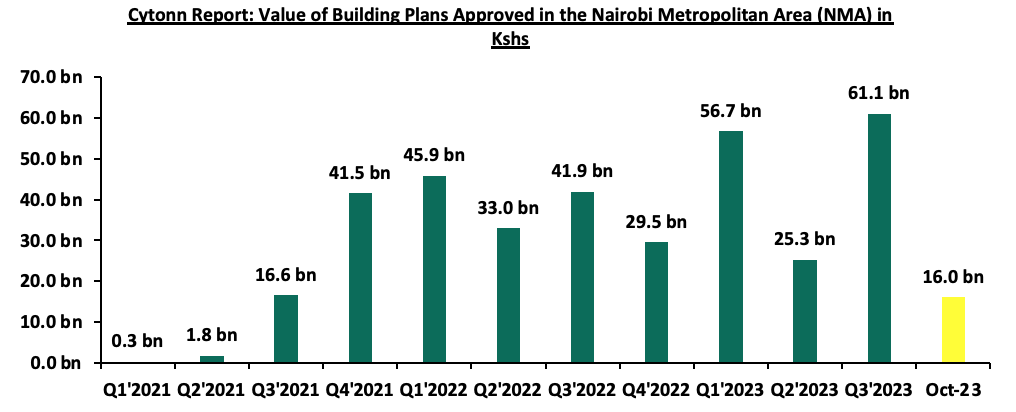
Source: Kenya National Bureau of Statistics (KNBS)
Going forward, we expect Kenya’s Real Estate sector to register positive growth and improved performance supported by; i) the increasing number of visitor arrivals into the country expected to enhance the performance of the hospitality industry by boosting room and bed occupancies, ii) improved access to financing evidenced by a 6.2% y/y increase in gross loans advanced to the Real Estate sector to Kshs 495.0 bn in Q2’2023, from Kshs 466.0 bn recorded in Q2’2022, and, iii) sustained demand for Real Estate development facilitated by positive population demographics which are above global averages. However, we expect; i) increased construction costs on the back of rising inflation, ii) oversupply in select Real Estate sectors, and, iii) elevated credit risk attributable to a 20.9% spike in gross Non-Performing Loans (NPLs) recorded in the Real Estate sector to Kshs 96.0 bn in Q2’2023, from Kshs 79.4 bn in Q2’2022 will hamper optimum performance of the sector.
- Infrastructure Sector
During the week, the National Treasury announced that the Nairobi- Mombasa Expressway project secured first-stage approval for construction under a Private-Public Partnership (PPP) model from the PPP Committee. Following the approval, the 473.0-Kilometre highway project valued at USD 3.6 bn (Kshs 555.1 bn) is set to proceed to the development stage.
The project was first floated in 2017 when Kenya signed a Kshs 230.0 bn deal with Betchel Executive, an American based engineering firm. However, the company later failed to agree with the Kenyan government on the model of funding the project, rejecting the government’s proposal to have the firm recoup its costs from toll fees imposed on motorists upon project completion.
Currently, the project is being spearheaded by Korean Infrastructure and Urban Development Corporation Africa (KIND). The Korean based firm presented a feasibility study to the Kenyan government in July 2022 for the construction of the road under a PPP model. Through the project, the government aims at easing traffic between the two cities. Additionally, the project will boost the country’s economy as the network will serve major truck highways thus facilitating fast movement of goods and services.
Notably, Kenya has been keen on utilizing PPP partnerships as an alternative means to finance capital-intensive infrastructure development projects which would otherwise require that the government borrows huge sums of money to finance. By utilizing PPPs, the government avoids large capital borrowing which could potentially worsen Kenya’s public debt situation. Key projects delivered through PPP arrangements include the 27.0-Kilometre Nairobi Expressway project which was built by China Road and Bridge Corporation.
We expect the infrastructure sector in Kenya will continue to contribute significantly to the stimulation of economic activities in the country, and enhance the overall performance of the Real Estate sector. The presence of enhanced road, railway, and air transport networks, along with other supporting facilities, is expected to facilitate the efficient delivery of people, goods, and services. Consequently, this will boost the demand for Real Estate properties. Furthermore, the extension and expansion of major roads will continue to open up satellite towns and stimulate growth, especially in the residential sector.
- Industrial Sector
During the week, global print and packaging firm Printcare Packaging Limited announced it had picked Africa Logistics Properties (ALP) West Logistics Park to service its expansion. The park comprises 100,000 SQM of Grade A warehousing space sitting on 49.0 acres within Tilisi development, Limuru, Kenya. Printcare settled on ALP’s West Logistics Park situated in Limuru due to; i) its strategic location, iii) high-quality amenities, and, iii) ALP’s commitment to offer international quality warehousing solutions and facilities in the region.
In the partnership, Printcare Packaging will invest USD 10.0 mn (Kshs 1.5 bn) and take up 75,000 SQM of warehousing space in the park. The move is aimed at boosting the firm’s operational efficiency in the East Africa region, set to commence in April 2024. Upon actualization, the move will see Printcare Limited employ approximately 100 people in its first phase and an additional 150 individuals in its second phase.
Notably, ALP has continued to experience sustained demand for warehousing space during the year due to its competitive edge and stringent quality meeting high standards in the warehousing and logistics sector. This has resulted in ALP attracting numerous deals from multinational corporations. Other notable firms in the country which have chosen ALP to provide them with logistics services include Worldwide Movers, Tawi Fresh, Oximio Kenya, USN Kenya, Tivoni Grown, and eBee Africa.
We expect the sector’s performance to be driven by; i) Kenya’s recognition as an industrial hub consequently attracting multinational corporations, ii) increasing demand for top-tier warehousing facilities in Africa outpacing supply, iii) notable gaps in the supply of quality warehousing in the region presenting an opportunity for growth. In support of this, according to the Africa Industrial Market Dashboards Q1’2023 report, Africa is experiencing severe shortfalls in supply with the deficit in countries such as Nigeria estimated at 300,000 SQM, and, iv) the rising demand for e-commerce warehouses in the retail sector.
- Regulated Real Estate Funds
- Real Estate Investments Trusts (REITs)
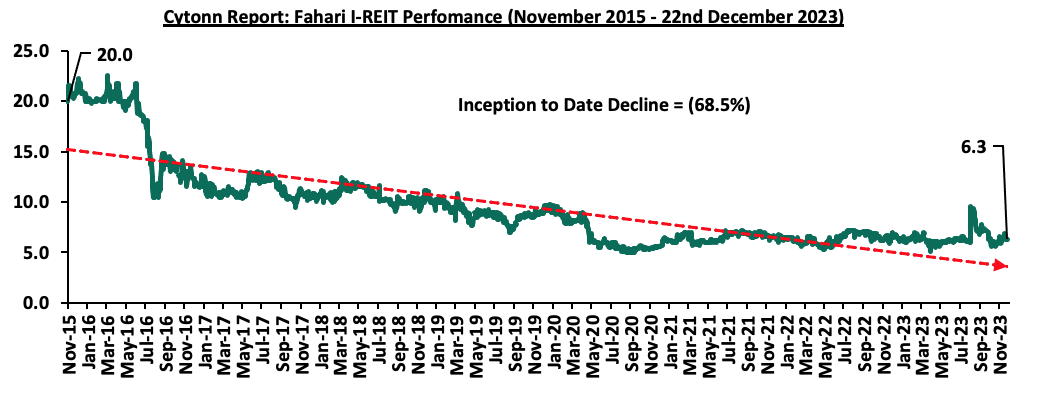
In the Nairobi Securities Exchange, ILAM Fahari I-REIT closed the week trading at an average price of Kshs 6.3 per share, representing a 2.2% decline from the Kshs 6.4 recorded the previous week. The performance represented a 7.1% Year-to-Date (YTD) loss from Kshs 6.8 per share recorded on 3 January 2023, taking it to a 68.5% Inception-to-Date (ITD) loss from the Kshs 20.0 price. The dividend yield currently stands at 10.3%. The graph below shows Fahari I-REIT’s performance from November 2015 to 22nd December 2023;
In the Unquoted Securities Platform, Acorn D-REIT and I-REIT traded at Kshs 25.3 and Kshs 21.7 per unit, respectively, as of 1st December 2023. The performance represented a 26.6% and 8.3% gain for the D-REIT and I-REIT, respectively, from the Kshs 20.0 inception price. The volumes traded for the D-REIT and I-REIT came in at 12.3 mn and 30.7 mn shares, respectively, with a turnover of Kshs 257.5 mn and Kshs 633.8 mn, respectively, since inception in February 2021.
REITs provide various benefits like tax exemptions, diversified portfolios, and stable long-term profits. However, the continuous deterioration in performance of the Kenyan REITs and restructuring of their business portfolio is on top of other general challenges such as; i) inadequate comprehension of the investment instrument among investors, ii) prolonged approval processes for REITs creation, iii) high minimum capital requirements of Kshs 100.0 mn for trustees, and, iv) minimum investment amounts set at Kshs 5.0 mn, continue to limit the performance of the Kenyan REITs market.
- Cytonn High Yield Fund (CHYF)
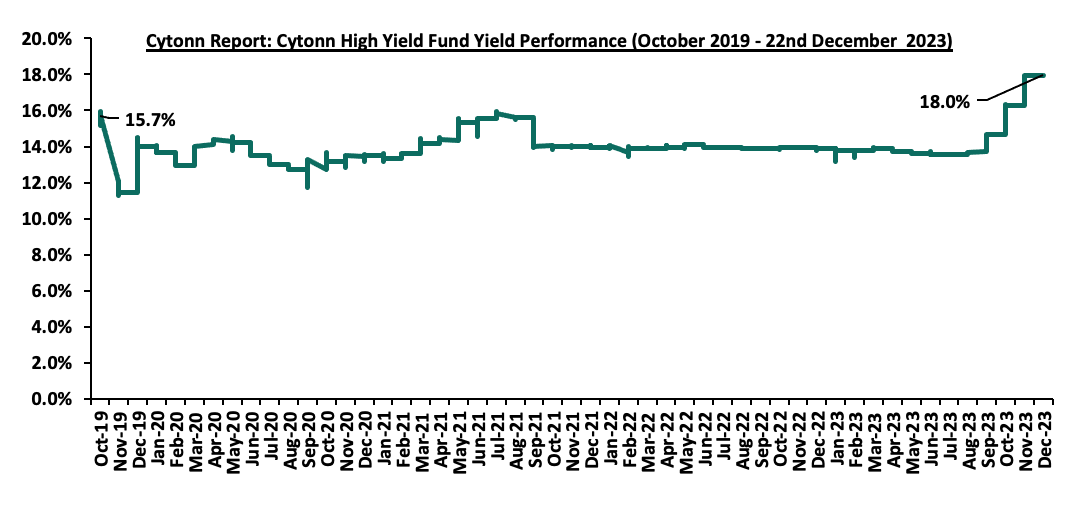
Cytonn High Yield Fund (CHYF) closed the week with an annualized yield of 18.0%, remaining relatively unchanged the previous week. The performance represented a 4.1%-points Year-to-Date (YTD) increase from 13.9% yield recorded on 1st January 2023, and 2.3%-points Inception-to-Date (ITD) increase from the 15.7% yield. The graph below shows Cytonn High Yield Fund’s performance from November 2019 to 22nd December 2023;
Notably, the CHYF has outperformed other regulated Real Estate funds with an annualized yield of 18.0%, as compared to Fahari I-REIT and Acorn I-REIT with yields of 10.3%, and 2.8% respectively. As such, the higher yields offered by CHYF makes the fund one of the best alternative investment resource in the Real Estate sector. The graph below shows the yield performance of the Regulated Real Estate Funds;
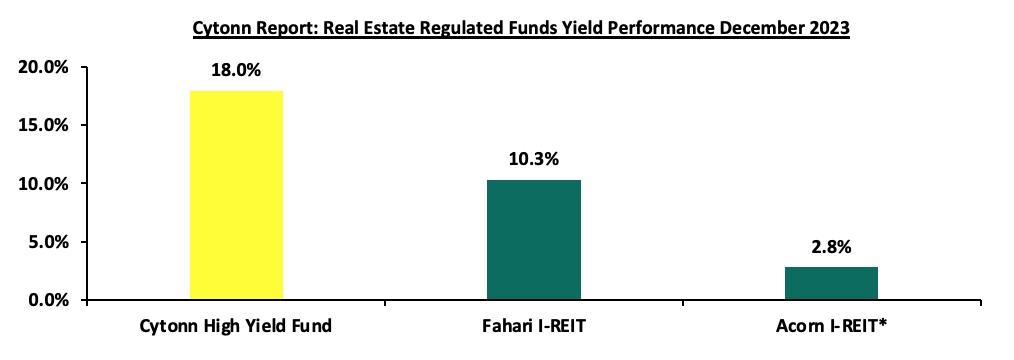
*H1’2023
Source: Cytonn Research
We expect the performance of Kenya’s Real Estate sector to be supported by factors such as; i) increased demand for quality warehousing propelling the industrial sector, ii) government’s continued focus to advance infrastructural development in the country, iii) continued recognition of Kenya as a regional hub attracting global investments and foreign entities, and iv) positive demographics which are above global averages facilitating sustained demand for Real Estate. However, factors such as; i) rising costs of construction, ii) limited investor knowledge in REITs, iii) existing oversupply in select Real Estate sectors, and, iv) the challenging micro-economic environment dampening consumers' purchasing power will continue to hinder optimal performance of the sector by limiting developments and investments.
Following the release of the Q3’2023 results by Kenyan banks, the Cytonn Financial Services Research Team undertook an analysis on the financial performance of the listed banks and identified the key factors that shaped the performance of the sector. For the earnings notes of the various banks, click the links below:
- Equity Group Q3’2023 Earnings Note
- KCB Group Q3’2023 Earnings Note
- Standard Chartered Bank Kenya Q3’2023 Earnings Note
- ABSA Bank Kenya Q3’2023 Earnings Note
- NCBA Group Q3’2023 Earnings Note
- Co-operative Bank Q3’2023 Earnings Note
- Diamond Trust Bank Kenya (DTB-K) Q3’2023 Earnings Note
- I&M Group Holdings Q3’2023 Earnings Note
- Stanbic Holdings Q3’2023 Earnings Note
- HF Group Q3’2023 Earnings Note
The core earnings per share (EPS) for the listed banks recorded a weighted growth of 11.2% in Q3’2023, compared to a weighted growth of 36.3% recorded in Q3’2022, an indication of sustained performance despite the tough operating environment occasioned by elevated inflationary pressures experienced during the period, with the inflation rate in the first nine months leading to end of Q3’2023 averaging 8.0%, which is higher than the 7.1% average recorded over a similar period in 2022. The performance in Q3’2023 was supported by a 21.3% growth in net interest income coupled with a 17.0% growth in non-funded income. The growth in NFI was largely driven by the increase in foreign exchange income recorded by the banks during the period as a result of increased dollar demand in the country. However, the asset quality of listed banks deteriorated, with the weighted average Gross Non-Performing Loan ratio (NPL) increasing by 0.9% points to 13.1%, from 12.2% recorded in Q3’2022. The performance remained 2.2% points above the ten-year average of 11.1%.
The report is themed “Sustained Profitability Despite a Challenging Business Environment”, and examines the primary elements that shaped the banking sector’s performance in Q3’2023. It highlights the prevailing trends, the obstacles encountered by banks, and the areas that will be vital for the sector’s future growth and stability. Consequently, we will discuss the following:
- Key Themes that Shaped the Banking Sector Performance in Q3’2023,
- Summary of the Performance of the Listed Banking Sector in Q3’2023,
- The Focus Areas of the Banking Sector Players Going Forward, and,
- Brief Summary and Ranking of the Listed Banks based on the outcome of our analysis.
Section I: Key Themes That Shaped the Banking Sector Performance in Q3’2023
In this section, we underscore the principal themes that influenced the banking sector performance in Q3’2023. These encompass regulation, regional growth through mergers and acquisitions, and the quality of assets:
- Regulation:
- Risk based Lending: Following the scrapping of the Interest Cap Law in 2019, the Central Bank of Kenya (CBK) intervened administratively, stopping banks from reprising their loans and requiring them to submit new risk-based lending formulas for approval. The main aim of the risk-based lending model is to assist banks in making lending decisions based on the predicted risks associated with each loan applicant. This signifies a move from the traditional practice of blacklisting defaulters to a new credit scoring system that doesn’t reject loan applicants solely based on their credit bureau scores. This method primarily focuses on borrowers who pose higher risks, most of whom are involved in micro, small, and medium-sized enterprises that have had difficulties securing traditional credit. As of May 2023, 33 out of the 39 banks in the country had their models approved by the CBK, with Equity Bank being the first commercial bank to implement risk-based lending. The adoption of risk-based credit models has seen an increase in lending to the private sector, with the growth in credit to the private sector coming in at 12.2% in September 2023, 3.4% points above the five-year average rate of 8.8%. Consequently, the banking sector has reduced its appetite for government securities,
- Changes to Interbank Foreign Exchange Market: In August 2023, the CBK issued a circular detailing several modifications to the interbank foreign exchange market operations. These changes included the removal of the tenor limit for swaps between residents, a rule that also applies to residents of the East African Community. For swaps that involve non-residents, a minimum tenor of 6 months was established. The regulator also permitted the use of Electronic Brokerage Systems and lowered the minimum trade amount in the interbank market from USD 500,000 to USD 250,000. These modifications have improved swap transactions, allowing banks to more effectively manage their exchange rate and interest rate risks, and to assume speculative positions,
- Foreign Exchange Code: On March 22, 2023, the CBK introduced the Foreign Exchange Code (FX Code) to commercial banks. This was an effort to regulate the wholesale transactions in Kenya’s foreign exchange market. The decision was triggered by the significant fluctuations in the exchange rate spread in the market, as highlighted in our currency review note. The FX Code is designed to foster a strong and transparent foreign currency market by implementing certain reporting guidelines;
- Compliance with FX Code- All market participants (commercial banks and foreign exchange brokers) were required to conduct a self-assessment and submit to the CBK a report on an institution’s their level of compliance with the FX Code by 30 April 2023, and submit a detailed compliance implementation plan that was to be approved by its Board by 30 June 2023. Each participant was required to be fully compliant with the aforementioned code by December 31, 2023,
- Reporting Mechanism- All market participants will be required to submit a quarterly report to CBK, detailing their adherence to the FX Code within 14 days following the conclusion of each calendar quarter,
- In the event of non-compliance- CBK may take appropriate enforcement and other administrative action including monetary penalties as provided for under the Banking Act against any market participant, and,
- Prohibitive Practices- The FX Code aims to prevent market participants from engaging in disruptive practices such as quoting prices or moving prices in ways that create artificial delays, or misrepresent the market’s depth and liquidity. Such practices will incur severe sanctions. Moreover, market participants should not engage in position or points parking, which are fake transactions to hide positions or shift profits or losses.
- Regional Expansion through Mergers and Acquisitions: Kenyan banks are continuously looking at having an extensive regional reach. In the first nine months leading to the end of Q3’2023, there were three completed acquisitions made by Commercial International Bank (Egypt) S.A.E (CIB), Equity Group Holdings Plc, and Premier Bank Limited Somalia as follows:
- On January 30, 2023, the Central Bank of Kenya (CBK) announcedthat Commercial International Bank (Egypt) S.A.E (CIB) had completed the acquisition of an additional 49.0% shareholding of Mayfair CIB Bank Limited (MBL) at Kshs 5.0 bn following the earlier acquisition of 51.0% stake in MBL announced in April 2020. Consequently, MBL is now a fully owned subsidiary of CIB,
- On January 30, 2023, Equity Group Holdings Plc., through Equity Bank Kenya Limited (EBKL) announced that it had completed the acquisition of certain assets and liabilities of the local Bank, Spire Bank Limited after obtaining all the required regulatory approvals. The completion of the acquisition followed the Assets and Liabilities Purchase Agreement, which was announced in September 2022, as highlighted in our Cytonn Weekly #37/2022. As such, Equity Bank Kenya Limited took over Spire Bank’s 12 branches as well as all existing depositors in Spire Bank, other than remaining deposits from its largest shareholder, Mwalimu Sacco. For more information, please see our Cytonn Monthly-January 2023,
- On March 17, 2023, the Central Bank of Kenya (CBK) announced that Premier Bank Limited Somalia (PBLS) had completed the acquisition of 62.5% shareholding of First Community Bank Limited (FCB) effective 27 March 2023. This came after receiving regulatory approvals from the CBK and the Cabinet Secretary for the National Treasury. FCB, which has been in operation since June 2008, is classified as a tier 3 bank in Kenya with 18 branches and a market share of 0.3% as at December 2022. The acquisition by Premier Bank Limited Somalia (PBLS), came at a time when FCB has been struggling to meet regulatory Capital adequacy requirements. For more information, please see our Cytonn Weekly #11/2023,
- On May 22, 2023, the Central Bank of Kenya (CBK) announced that Shorecap III, LP, a Private Equity fund governed by the laws of Mauritius, had acquired a 20.0% stake in Credit Bank Plc. The fund is managed by Equator Capital Partners LLC and the acquisition took effective from June 15, 2023. While the CBK did not reveal the value of the deal, Shorecap III, LP will assume control of 7,289,928 ordinary shares, which make up 20.0% of the Bank’s ordinary shares. This follows the acquisition of a 22.8% stake in the lender by Oikocredit in August 2019, for a cash consideration of Kshs 1.0 bn, with the transaction trading at a price to book (P/B) multiple of 1.5x. For additional details, refer to our Cytonn Weekly #21/2023,
- On June 14, 2023, Equity Group Holdings Plc (EGH) announced that it had entered into a binding agreement with the Government of Rwanda, Rwanda Social Security Board, and other investors of Compagnie Generale De Banque (Cogebanque) Plc Limited to acquire a 91.9% stake in the Rwanda based lender. Upon the completion of the acquisition, EGH plans to eventually merge the business of the Cogebanque with its Rwandan Subsidiary, Equity Bank Rwanda Plc. Notably, EGH signed a share purchase agreement with the Sellers on July 28, 2023, committing to buy 183,854 shares at a rate of 297,406 Rwandan Francs per share upon completion on December 1, 2023, giving EGH ownership of 99.1% of the issued share capital. Concurrently, EGH proposed to purchase all outstanding shares from the other shareholders of Cogebanque, aiming to own up to 100% of Cogebanque’s issued shares, and,
- On September 27, 2023, the NCBA Group declared its plan to purchase a 100% share in AIG Insurance. AIG Insurance is a well-established company in Kenya, having been in operation for over 50 years, providing general insurance services to corporations, SMEs, and individuals. Currently, the NCBA Group holds a minority stake in AIG Insurance and intends to negotiate with AIG Inc, the majority stakeholder, to acquire the remaining shares. This acquisition is part of NCBA Group’s strategy to broaden its bancassurance operations, transforming it into a universal bank that caters to all the financial needs of its customers. The acquisition is contingent upon the necessary due diligence, approval from the boards of NCBA, AIG Kenya, AIG Group, and the relevant banking, insurance, and other regulatory authorities.
Below is a summary of the deals in the last 10 years that have either happened, been announced or expected to be concluded:
|
Cytonn Report: Banking Sector Deals and Acquisitions |
||||||
|
Acquirer |
Bank Acquired |
Book Value at Acquisition (Kshs bn) |
Transaction Stake |
Transaction Value (Kshs bn) |
P/Bv Multiple |
Date |
|
Equity Group |
Cogebanque PLC ltd |
5.7 |
91.1% |
6.7 |
1.3x |
Jun-23 |
|
Shorecap III |
Credit Bank Plc |
3 |
20.0% |
Undisclosed |
N/A |
Jun-23 |
|
Premier Bank Limited |
First Community Bank |
2.8 |
62.5% |
Undisclosed |
N/A |
Mar-23 |
|
KCB Group PLC |
Trust Merchant Bank (TMB) |
12.4 |
85.0% |
15.7 |
1.5x |
Dec-22 |
|
Equity Group |
Spire Bank |
Unknown |
Undisclosed |
Undisclosed |
N/A |
Sep-22* |
|
Access Bank PLC (Nigeria)* |
Sidian Bank |
4.9 |
83.4% |
4.3 |
1.1x |
June-22* |
|
KCB Group |
Banque Populaire du Rwanda |
5.3 |
100.0% |
5.6 |
1.1x |
Aug-21 |
|
I&M Holdings PLC |
Orient Bank Limited Uganda |
3.3 |
90.0 0% |
3.6 |
1.1x |
Apr-21 |
|
KCB Group** |
ABC Tanzania |
Unknown |
100.0% |
0.8 |
0.4x |
Nov-20* |
|
Co-operative Bank |
Jamii Bora Bank |
3.4 |
90.0% |
1 |
0.3x |
Aug-20 |
|
Commercial International Bank |
Mayfair Bank Limited |
1 |
51.0% |
Undisclosed |
N/A |
May-20* |
|
Access Bank PLC (Nigeria) |
Transnational Bank PLC. |
1.9 |
100.0% |
1.4 |
0.7x |
Feb-20* |
|
Equity Group ** |
Banque Commerciale Du Congo |
8.9 |
66.5% |
10.3 |
1.2x |
Nov-19* |
|
KCB Group |
National Bank of Kenya |
7 |
100.0% |
6.6 |
0.9x |
Sep-19 |
|
CBA Group |
NIC Group |
33.5 |
53%:5% |
23 |
0.7x |
Sep-19 |
|
Oiko Credit |
Credit Bank |
3 |
22.8% |
1 |
1.5x |
Aug-19 |
|
CBA Group** |
Jamii Bora Bank |
3.4 |
100.0% |
1.4 |
0.4x |
Jan-19 |
|
AfricInvest Azure |
Prime Bank |
21.2 |
24.2% |
5.1 |
1.0x |
Jan-18 |
|
KCB Group |
Imperial Bank |
Unknown |
Undisclosed |
Undisclosed |
N/A |
Dec-18 |
|
SBM Bank Kenya |
Chase Bank Ltd |
Unknown |
75.0% |
Undisclosed |
N/A |
Aug-18 |
|
DTBK |
Habib Bank Kenya |
2.4 |
100.0% |
1.8 |
0.8x |
Mar-17 |
|
SBM Holdings |
Fidelity Commercial Bank |
1.8 |
100.0% |
2.8 |
1.6x |
Nov-16 |
|
M Bank |
Oriental Commercial Bank |
1.8 |
51.0% |
1.3 |
1.4x |
Jun-16 |
|
I&M Holdings |
Giro Commercial Bank |
3 |
100.0% |
5 |
1.7x |
Jun-16 |
|
Mwalimu SACCO |
Equatorial Commercial Bank |
1.2 |
75.0% |
2.6 |
2.3x |
Mar-15 |
|
Centum |
K-Rep Bank |
2.1 |
66.0% |
2.5 |
1.8x |
Jul-14 |
|
GT Bank |
Fina Bank Group |
3.9 |
70.0% |
8.6 |
3.2x |
Nov-13 |
|
Average |
|
|
75.0% |
|
1.3x |
|
|
Average: 2013 to 2018 |
|
|
73.5% |
|
1.7x |
|
|
Average: 2019 to 2023 |
|
|
75.8% |
|
0.9x |
|
|
* Announcement Date ** Deals that were dropped |
||||||
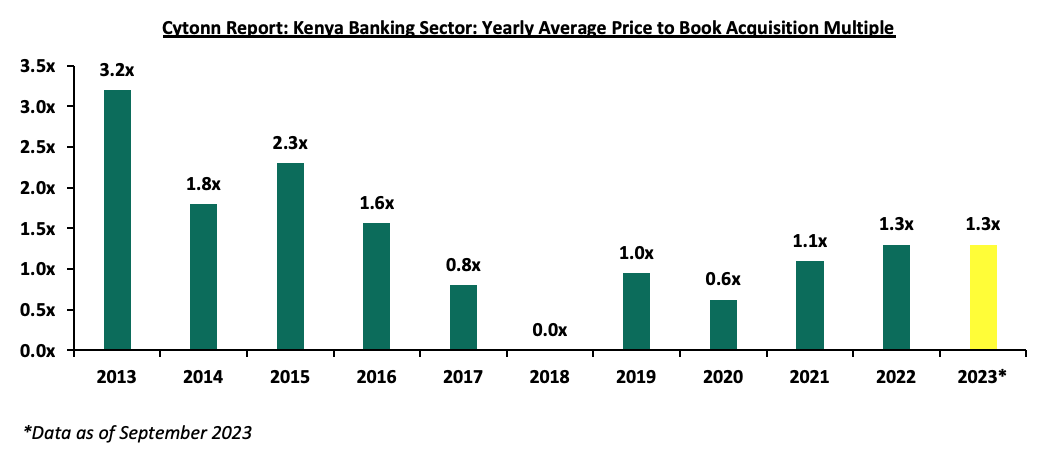
So far in 2023, the average acquisition valuations for banks have remained unchanged at 1.3x, similar to what was recorded in 2022. As such, the valuations still remain low compared to historical prices paid, as highlighted in the chart below;
As at the end of Q3’2023, the number of commercial banks in Kenya stood at 38, same as in Q3’2022 but lower than the 43 licensed banks in FY’2015. The ratio of the number of banks per 10 million population in Kenya now stands at 6.8x, which is a reduction from 9.0x in FY’2015, demonstrating continued consolidation in the banking sector. However, despite the ratio improving, Kenya still remains overbanked with the number of banks remaining relatively high compared to the African major economies. To bring the ratio to 5.5x, we ought to reduce the number of banks from the current 38 banks to about 30 banks. For more on this see our topical.
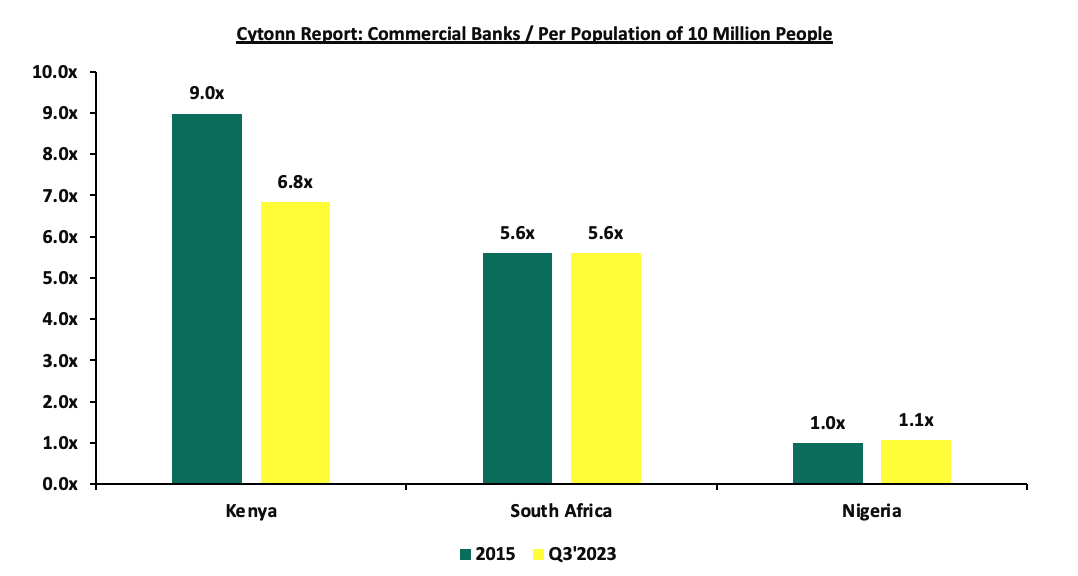
Source: World Bank, Central Bank of Kenya, South Africa Reserve Bank, Central Bank of Nigeria; * Data as of September 2023
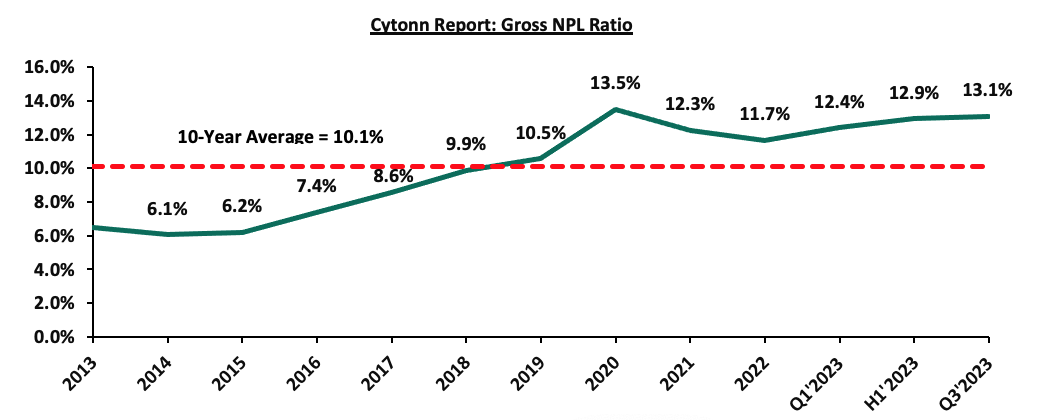
- Asset Quality: Asset quality for listed banks improved in Q3’2023, with the weighted average Gross Non-Performing Loan ratio (NPL) decreasing by 0.8% points to 13.1%, from 13.9% recorded in Q3’2022. However, the performance remained 3.0% points above the ten-year average of 10.1%. The deterioration in asset quality in Q3’2023 was mainly driven by the 4.1% points increase in Equity Group’s NPL ratio to 13.6%, from 9.5% in Q3’2022. The chart below highlights the asset quality trend for the listed banks:
The deterioration in Equity Group asset quality was mainly attributable to 83.5% an increase in Gross non-performing loans to Kshs 124.5 bn in Q3’2023 from Kshs 67.9 bn in Q3’2022, which outpaced the 27.3% increase in gross loans to Kshs 912.4 bn from Kshs 716.6 bn recorded in Q3’2022. However, the deterioration in listed banks asset quality was mitigated by an improvement in KCB Group’s Asset quality, with Gross NPL ratio decreasing to 16.1% in Q3’2023 from 17.8% in Q3’2022, attributable to a 39.0% increase in Gross loans to Kshs 1,164.0 bn, from Kshs 837.7 bn in Q3’2022, which outpaced the 25.3% increase in gross non-performing loans to Kshs 187.0 bn, from Kshs 149.3 bn recorded in Q3’2022. A total of five out of the ten listed Kenyan banks recorded improvement in their asset quality, despite the deteriorated in the general business environment which was evidenced by the average Purchasing Managers Index (PMI) of 48.0 in Q3’2023 which was below the 50.0 points no change threshold, despite the slight improvement from an average of 47.4 in Q3’2022. Going forward, we expect credit risk to remain elevated in the short to medium term mainly on the back of a tough operating environment occasioned by elevated inflationary pressures as well as sustained depreciation of the Kenya shilling.
The table below highlights the asset quality for the listed banking sector:
|
Cytonn Report: Listed Banks Asset Quality |
||||||
|
|
Q3'2023 NPL Ratio* |
Q3'2022 NPL Ratio** |
% point change in NPL Ratio |
Q3'2023 NPL Coverage* |
Q3'2022 NPL Coverage** |
% point change in NPL Coverage |
|
Equity Group |
13.6% |
9.5% |
4.1% |
53.4% |
63.0% |
(9.6%) |
|
NCBA Group |
12.0% |
12.6% |
(0.6%) |
56.8% |
65.3% |
(8.5%) |
|
KCB Group |
16.1% |
17.8% |
(1.8%) |
62.1% |
52.8% |
9.3% |
|
Standard Chartered Bank Kenya |
14.4% |
15.4% |
(1.0%) |
84.8% |
83.9% |
0.9% |
|
ABSA Bank Kenya |
9.8% |
6.6% |
3.2% |
67.4% |
80.0% |
(12.5%) |
|
Co-operative Bank of Kenya |
14.9% |
14.0% |
0.9% |
62.1% |
69.3% |
(7.2%) |
|
Stanbic Bank |
9.0% |
10.1% |
(1.1%) |
66.3% |
63.4% |
3.0% |
|
I&M Holdings |
11.8% |
9.5% |
2.3% |
51.8% |
75.4% |
(23.6%) |
|
Diamond Trust Bank |
12.6% |
12.7% |
(0.1%) |
48.7% |
45.2% |
3.4% |
|
HF Group |
22.8% |
20.3% |
2.5% |
74.0% |
77.2% |
(3.2%) |
|
Mkt Weighted Average |
13.1% |
12.2% |
0.9% |
62.0% |
67.8% |
(5.8%) |
|
*Market cap weighted as at 22/12/2023 |
||||||
|
**Market cap weighted as at 02/12/2022 |
||||||
Key take-outs from the table include;
- Asset quality for the listed banks deteriorated in Q3’2023, with market weighted average NPL increasing by 0.9% points to 13.1% from a 12.2% in Q3’2022. The worsening of asset quality was mainly driven by a deterioration in Equity Group, ABSA Bank Kenya, HF Group, I&M Holdings and Coop Bank’s asset quality with their NPL ratio increasing by 4.1%, 3.2%, 2.5%, 2.3% and 0.9% respectively,
- Equity Group had the highest NPL ratio jump by 4.1% points to 13.6% from 9.5% points in Q3’2022, attributable to 83.5% increase in Gross non-performing loans to Kshs 124.5 bn in Q3’2023 from Kshs 67.9 bn in Q3’2022, which outpaced the 27.3% increase in gross loans to Kshs 912.4 bn from Kshs 716.6 bn recorded in Q3’2022, and,
- Market weighted average NPL Coverage for the listed banks decreased by 5.8% points to 62.0% in Q3’2023, from 67.8% recorded in Q3’2022, majorly on the back of decreased NPL coverage recorded by I&M Holdings, ABSA Bank, Equity Group, NCBA Group, Co-operative Bank and HF Group of Kenya by 23.6%, 12.5%, 9.6%, 8.5%, 7.2% and 3.2% respectively in Q3’2023. However, the NPL coverage ratios of KCB Group, Diamond Trust Bank and Stanbic bank increased by 9.3% points, 3.4% points and 3.0% points to 62.1%, 48.7% and 66.3% respectively in Q3’2023.
Section II: Summary of the Performance of the Listed Banking Sector in Q3’2023:
The table below highlights the performance of the banking sector, showing the performance using several metrics, and the key take-outs of the performance;
|
Cytonn Report: Listed Banks Performance in Q3’2023 |
|||||||||||||
|
Bank |
Core EPS Growth |
Interest Income Growth |
Interest Expense Growth |
Net Interest Income Growth |
Net Interest Margin |
Non-Funded Income Growth |
NFI to Total Operating Income |
Growth in Total Fees & Commissions |
Deposit Growth |
Growth in Government Securities |
Loan to Deposit Ratio |
Loan Growth |
Return on Average Equity |
|
Equity Group |
5.3% |
32.0% |
58.4% |
21.3% |
5.6% |
36.9% |
44.3% |
36.6% |
19.9% |
4.1% |
70.0% |
25.5% |
21.8% |
|
NCBA Group |
14.4% |
21.1% |
35.3% |
11.7% |
6.0% |
(8.0%) |
44.4% |
11.9% |
18.6% |
(2.9%) |
56.3% |
16.0% |
18.4% |
|
KCB Group |
0.4% |
36.4% |
77.9% |
21.6% |
6.8% |
38.7% |
36.1% |
65.7% |
79.6% |
37.5% |
63.3% |
38.1% |
20.2% |
|
SCBK |
11.8% |
28.5% |
(10.0%) |
34.5% |
8.5% |
(6.6%) |
27.9% |
19.0% |
4.5% |
(50.3%) |
48.0% |
5.5% |
22.7% |
|
Absa Bank |
14.9% |
33.5% |
62.2% |
26.0% |
8.8% |
6.4% |
27.0% |
21.2% |
26.1% |
(15.7%) |
93.4% |
14.3% |
25.8% |
|
Coop Bank |
7.6% |
12.9% |
41.3% |
2.5% |
8.4% |
2.1% |
38.5% |
7.8% |
0.2% |
1.5% |
87.3% |
12.8% |
22.3% |
|
Stanbic Holdings |
32.7% |
48.2% |
63.2% |
42.4% |
7.8% |
23.0% |
41.0% |
22.7% |
14.3% |
(41.3%) |
82.1% |
5.9% |
21.4% |
|
I&M Holdings |
14.3% |
27.5% |
41.5% |
18.4% |
6.2% |
21.2% |
35.9% |
16.9% |
30.6% |
14.6% |
71.4% |
24.3% |
15.9% |
|
DTBK |
5.2% |
33.0% |
51.5% |
19.6% |
5.4% |
33.9% |
31.4% |
25.2% |
27.3% |
(4.5%) |
63.2% |
18.7% |
10.0% |
|
HF Group |
283.9% |
20.3% |
19.1% |
21.4% |
5.4% |
20.6% |
32.2% |
38.5% |
12.9% |
10.9% |
87.8% |
9.3% |
5.3% |
|
Q3'23 Mkt Weighted Average* |
11.2% |
29.7% |
47.9% |
21.3% |
7.0% |
17.0% |
37.7% |
27.7% |
24.4% |
(4.3%) |
70.6% |
19.1% |
21.1% |
|
Q3'22 Mkt Weighted Average* |
36.3% |
16.4% |
19.7% |
17.6% |
7.3% |
30.1% |
38.1% |
16.3% |
9.8% |
6.5% |
73.7% |
17.1% |
24.2% |
|
*Market cap weighted as at 22/12/2023 |
|||||||||||||
|
**Market cap weighted as at 02/12/2022 |
|||||||||||||
Key takeaways from the table include:
- The listed banks recorded an 11.2% growth in core Earnings per Share (EPS) in Q3’2023, compared to the weighted average growth of 36.4% in Q3’2022, an indication of sustained performance despite the tough operating environment experienced in 2023 on the back of elevated inflationary pressures. The performance during the period was mainly supported by a 21.3% weighted average growth in net interest income, coupled with a 17.0% weighted average growth in non-funded income,
- Investments in government securities by listed banks reduced significantly in Q3’2023, having recorded a market weighted average decline of 4.3%, a reversal from the 6.5% growth recorded in Q3’2022. The declining investment in Kenya government securities is partly attributable to the increased perceived risk of default by the government, mainly on the back of high debt sustainability concerns given the current high public debt stock as well as the impending Eurobond maturity in June 2024,
- The listed banks’ Net loans and advances to customers recorded a weighted average growth of 19.1% in Q3’2023, an increment from the 17.1% growth recorded in Q3’2022, an indication of increased lending despite the elevated credit risk following the continued implementation of risk-based lending by the banks,
- Interest income recorded a weighted average growth of 29.7% in Q3’2023, compared to 16.4% in Q3’2022. Similarly, interest expenses recorded a market weighted average growth of 47.9% in Q3’2023 compared to a growth of 19.7% in Q3’2022. Consequently, net interest income recorded a weighted average growth of 21.3% in Q3’2022, an increment from the 17.6% growth recorded over a similar period in 2022, and,
- The listed banks recorded a 21.1% weighted average growth on return on average equity (RoaE), 3.1% points lower than the 24.2% growth registered in Q3’2022. Additionally, the entire banking sector’s Return On Equity (ROE) stood at 4%, a 1.8% points decrease from the 27.2% recorded in Q3’2022. On a global level, the Kenyan banking sector continues to record high profitability compared to other economies in the world, as highlighted in the chart below:
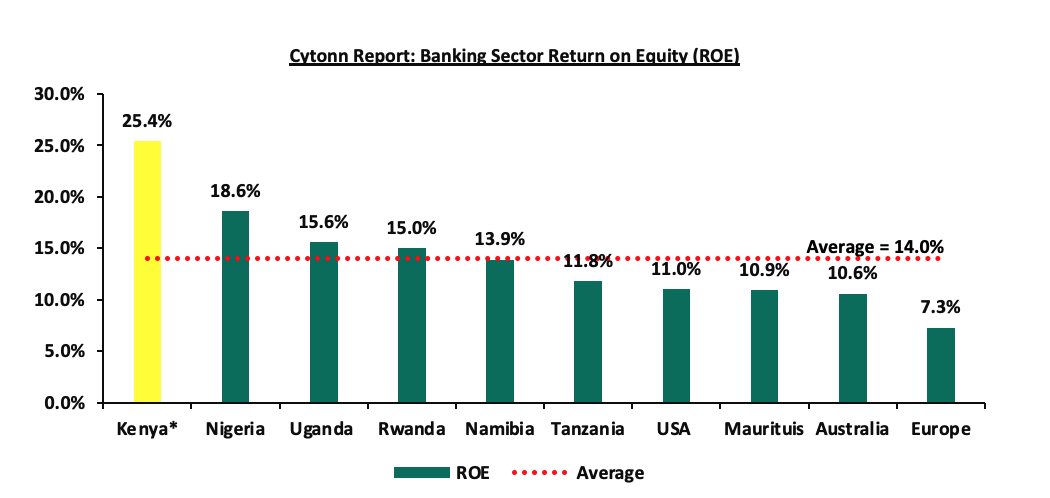
Source: Online research, * Figure as of H1’2023
Section III: The Focus Areas of the Banking Sector Players Going Forward:
The banking sector continue to remain resilient despite the tough operating environment as evidenced by the increase in their profitability, with the Core Earnings Per Share (EPS) growing by 11.2%, as banks continued to implement their revenue diversification strategies. Notably, 8 out of the 10 listed banks recorded a significant growth in their Non-funded income in Q3’2023. However, we believe that the uncertainty surrounding the June 2024 Eurobond Maturity coupled with the deteriorated business environment, will see banks continue increasing their provisioning to cushion themselves from the elevated credit risk. Based on the current operating environment, we believe the future performance of the banking sector will be shaped by the following key factors:
- Growth in Interest income: Going forward, we expect interest income growth to remain a key driver in the banking industry, evidenced by the 29.7% growth recorded in Q3’2023, higher than the 16.4% growth recorded in Q3’2022. Additionally, the government securities continue to witness increases in yields, as such we believe the continued allocation to government securities will lead to an increase in overall interest income. Furthermore, the continued approval of banks risk-based lending models will enable banks to effectively price their risk, expand loan books, and consequently increase their interest income,
- Revenue Diversification: In Q3’2023, non-funded income (NFI) recorded a 17.0% weighted average growth, slower than the 30.1% weighted growth in Q3’2022 with 8 out of the 10 listed Banks recording an increase in their non-funded income. Despite the slower growth in NFI, the weighted average contribution of NFI to total operating income came in at 37.7% in Q3’2023, 0.4% points lower than the 38.1% weighted average growth contribution recorded in Q3’2022. As such, there exists an opportunity for the sector to further increase NFI contributions to revenue given the continuous adoption of digitization, and,
- Regional Expansion and Further Consolidation: Consolidation remains a key theme going forward with the current environment offering opportunities for larger banks with a sufficient capital base to expand and take advantage of the market's low valuations, as well as further consolidate out smaller and weaker banks. Notably, majority of the bigger banks have continued to cushion over unsystematic risks specific to the local market by expanding their operations into other African nations. Banks such as KCB and Equity Group have been leveraging on expansion and consolidation which has largely contributed to their increased asset base as well as earnings growth. As aforementioned, Equity Group recently announced the completion of the acquisition of Compagnie Générale de Banque (Cogebanque) Plc, marking a significant milestone in its regional expansion strategy. As such, we expect to see continued expansion trend aimed at revenue optimization.
Section IV: Brief Summary and Ranking of the Listed Banks:
As per our analysis of the banking sector from a franchise value and a future growth opportunity perspective, we carried out a comprehensive ranking of the listed banks. For the franchise value ranking, we included the earnings and growth metrics as well as the operating metrics shown in the table below in order to carry out a comprehensive review of the banks:
|
Cytonn Report: Listed Banks Earnings, Growth and Operating Metrics |
||||||||
|
Bank |
Loan to Deposit Ratio |
Cost to Income (With LLP) |
Return on Average Capital Employed |
Deposits/ Branch (bn) |
Gross NPL Ratio |
NPL Coverage |
Tangible Common Ratio |
Non-Funded Income/Revenue |
|
Absa Bank |
93.4% |
55.6% |
25.8% |
4.3 |
9.8% |
67.4% |
12.8% |
27.0% |
|
NCBA Group |
56.3% |
60.2% |
18.4% |
5.2 |
12.0% |
56.8% |
12.1% |
44.4% |
|
Equity Bank |
70.0% |
64.8% |
21.8% |
3.4 |
13.6% |
53.4% |
10.1% |
44.3% |
|
KCB Group |
63.3% |
65.4% |
20.2% |
2.8 |
16.1% |
62.1% |
9.6% |
36.1% |
|
SCBK |
48.0% |
53.5% |
22.7% |
9.3 |
14.4% |
83.0% |
15.1% |
27.9% |
|
Coop Bank |
87.3% |
54.3% |
22.3% |
2.5 |
14.9% |
62.1% |
15.6% |
38.5% |
|
Stanbic Bank |
82.1% |
57.8% |
21.4% |
9.3 |
9.0% |
66.3% |
13.3% |
41.0% |
|
DTBK |
63.2% |
70.6% |
10.0% |
3.4 |
12.6% |
48.7% |
11.8% |
31.4% |
|
I&M Holdings |
71.4% |
64.3% |
15.9% |
4.7 |
11.8% |
51.8% |
13.4% |
35.9% |
|
HF Group |
87.8% |
90.7% |
5.3% |
1.9 |
22.8% |
74.0% |
14.0% |
32.2% |
|
Q3'2023 Weighted Average |
70.6% |
60.4% |
21.1% |
4.7 |
13.1% |
61.8% |
12.3% |
37.7% |
|
Market cap weighted as at 22/12/2023 |
||||||||
The overall ranking was based on a weighted average ranking of Franchise value (accounting for 60.0%) and intrinsic value (accounting for 40.0%). The Intrinsic Valuation is computed through a combination of valuation techniques, with a weighting of 40.0% on Discounted Cash-flow Methods, 35.0% on Residual Income and 25.0% on Relative Valuation, while the Franchise ranking is based on banks operating metrics, meant to assess efficiency, asset quality, diversification, and profitability, among other metrics. The overall Q3’2023 ranking is as shown in the table below:
|
Cytonn Report: Listed Banks Q3’2023 Rankings |
|||||
|
Bank |
Franchise Value Rank |
Intrinsic Value Rank |
Weighted Rank Score |
Q3'2022 Rank |
Q3'2023 Rank |
|
Absa Bank |
2 |
2 |
2.0 |
3 |
1 |
|
Coop Bank |
1 |
4 |
2.8 |
3 |
2 |
|
I&M Holdings |
5 |
3 |
3.8 |
5 |
3 |
|
KCB Group |
8 |
1 |
3.8 |
1 |
3 |
|
Stanbic Bank |
4 |
5 |
4.6 |
9 |
5 |
|
Equity Bank |
6 |
6 |
6.0 |
2 |
6 |
|
SCBK |
3 |
9 |
6.6 |
7 |
7 |
|
NCBA Group |
7 |
8 |
7.6 |
6 |
8 |
|
DTBK |
10 |
7 |
8.2 |
8 |
9 |
|
HF Group |
9 |
10 |
9.6 |
10 |
10 |
Major Changes from the Q3’2023 Ranking are:
- ABSA Bank rose to position 1 in Q3’2023, up from rank number 3 in Q3’2022, mainly supported by strong franchise and intrinsic value score, attributable to improvement in the bank’s management quality and earning quality, with the return on average equity improving by 2.5% points to 25.8% in Q3’2023, up from 23.2% registered in Q2’2022. Additionally, the cost to income ratio without LLPs declined by 1.0% points to 38.7% in Q3’2023, from 39.7% in Q3'2022. Notably, the bank’s Net Interest Margin increased by 1.3% points to 8.8% in Q3’2023 from 7.6% in Q3’2022,
- Stanbic Bank climbed up 4 places to rank position 5 in Q3’2023, up from position 9 in Q3’2022 supported by significant improvement in both franchise and intrinsic value score. Its performance was driven by a 2.3% points growth in return on average equity to 21.4% in Q3’2023 from 19.1% in Q3’2022. Additionally, the cost to income ratio without LLPs declined by 2.2% points to 43.2% in Q3’2023, from 45.4% in Q3'2022. Notably, the bank’s Net Interest Margin increased by 1.6% points to 7.8% in Q3’2023 from 6.2% in Q3’2022, and,
- Equity Group slid 4 places to rank at position 6 in Q3’2023, down from position 2 in Q3’2022, mainly due to a deterioration in the group’s asset quality as the gross NPL ratio rose to 13.6%, from the 9.5% recorded in Q3’2022. Additionally, there was a deterioration in operating efficiency, with the cost-to income ratio with LLPs increasing by 8.2% points to 64.8% from 56.6% recorded in Q3’2022, while the cost-to ratio without LLPs also increased by 3.1% to 50.2% from 47.1% in Q3’2022.
For more information, see our Cytonn Q3’2023 Listed Banking Sector Review
Disclaimer: The views expressed in this publication are those of the writers where particulars are not warranted. This publication is meant for general information only and is not a warranty, representation, advice or solicitation of any nature. Readers are advised in all circumstances to seek the advice of a registered investment advisor.

- Talk to us
- Kenya
- P.O Box 20695 - 00200, Nairobi, Kenya
- Cell +254709101200
- Tel +254709101200
- WhatsApp +254741676635
- United States
- +254709101200
- DOWNLOAD OUR APP
-


- Kenya
- 8th Floor, Pinetree Plaza, Kaburu Drive, Ngong Road, Nairobi, Kenya
- USA
- Suite 1150, 1775 Eye Street NW, USA, Washington DC 20006, USA
- Investments
- High Yield
- Private Equity
- Real Estate
- Real Estate
- RiverRun Estates
- Cytonn Towers
- The Ridge
- Taraji Heights
- The Alma