Kenya’s Listed Banks H1’2024 Report, and Cytonn Weekly #37/2024
By Investments team, Sep 15, 2024
Executive Summary
Fixed Income
During the week, T-bills were undersubscribed for the first time in three weeks with the overall undersubscription rate coming in at 89.1%, a reversal from the oversubscription rate of 162.3% recorded the previous week. Investors’ preference for the shorter 91-day paper persisted, with the paper receiving bids worth Kshs 14.2 bn against the offered Kshs 4.0 bn, translating to an oversubscription rate of 354.7%, albeit lower than the oversubscription rate of 580.2% recorded the previous week. The subscription rates for the 182-day and 364-day papers decreased significantly to 32.7% and 39.2% respectively from the 101.7% and 55.7% respectively, recorded the previous week. The government accepted a total of Kshs 19.9 bn worth of bids out of Kshs 21.4 bn bids received, translating to an acceptance rate of 93.3%. The yields on the government papers were on a downward trajectory, with the yields on the 364-day, 182-day, and 91-day papers decreasing by 0.6 bps, 0.1 bps, and 1.8 bps to 16.82%, 16.62%, and 15.75% respectively from 16.82%, 16.63% and 15.77% respectively recorded the previous week;
Also, during the week, During the week, The Energy and Petroleum Regulatory Authority (EPRA) released their monthly statement on the maximum retail fuel prices in Kenya, effective from 15th September 2024 to 14th October 2024. Notably, the maximum allowed price for Super Petrol and Diesel remained unchanged from the prices announced for the previous period, while the maximum price allowed for Kerosene decreased by Kshs 3.4 per litre. Consequently, Super Petrol and Diesel will continue to retail at Kshs 188.8 and Kshs. 171.6 per litre respectively, while Kerosene will retail at Kshs. 158.4 per litre from Kshs 161.8 the previous month;
Equities
During the week, the equities market recorded mixed performance, with NASI gaining the most by 0.7% and NSE 20 gaining by 0.4% while NSE 25 and NSE 10 declined 0.2% each, taking the YTD performance to gains of 21.2%, 19.6%, 15.6%, and 13.6% for NSE 10, NSE 25, NASI, and NSE 20 respectively. The equities market performance was driven by gains recorded by large-cap stocks such as Safaricom, BAT, and Bamburi of 3.4%, 1.3%, and 0.9% respectively. The performance was, however, weighed down by losses recorded by large-cap stocks such as NCBA, KCB, and Stanbic of 7.9%,3.9%, and 1.0% respectively;
Real Estate
During the week, the construction of the Pangani Affordable Housing Project which had stalled for two years, resumed after the developer managed to secure new funding. The Kshs 5.0 bn Pangani Affordable Housing Project in Nairobi, which had been stalled for two years due to financial challenges, has resumed after the developer, Tecnofin Kenya Ltd, secured new funding;
On the Unquoted Securities Platform, Acorn D-REIT and I-REIT traded at Kshs 25.4 and Kshs 22.2 per unit, respectively, as per the last updated data on 13th September 2024. The performance represented a 27.0% and 11.0% gain for the D-REIT and I-REIT, respectively, from the Kshs 20.0 inception price. Additionally, ILAM Fahari I-REIT traded at Kshs 11.0 per share as of 13th September, 2024, representing a 45.0% loss from the Kshs 20.0 inception price;
Focus of the Week
Following the release of the H1’2024 results by Kenyan listed banks, the Cytonn Financial Services Research Team undertook an analysis on the financial performance of the listed banks and identified the key factors that shaped the performance of the sector;
Investment Updates:
- Weekly Rates:
- Cytonn Money Market Fund closed the week at a yield of 18.2% p.a. To invest, dial *809# or download the Cytonn App from Google Play store here or from the Appstore here;
- We continue to offer Wealth Management Training every Monday, from 10:00 am to 12:00 pm. The training aims to grow financial literacy among the general public. To register for any of our Wealth Management Trainings, click here;
- If interested in our Private Wealth Management Training for your employees or investment group, please get in touch with us through wmt@cytonn.com;
- Cytonn Insurance Agency acts as an intermediary for those looking to secure their assets and loved ones’ future through insurance namely; Motor, Medical, Life, Property, WIBA, Credit and Fire and Burglary insurance covers. For assistance, get in touch with us through insuranceagency@cytonn.com
- Cytonn Asset Managers Limited (CAML) continues to offer pension products to meet the needs of both individual clients who want to save for their retirement during their working years and Institutional clients that want to contribute on behalf of their employees to help them build their retirement pot. To more about our pension schemes, kindly get in touch with us through pensions@cytonn.com;
Hospitality Updates:
- We currently have promotions for Staycations. Visit cysuites.com/offers for details or email us at sales@cysuites.com;
Money Markets, T-Bills Primary Auction:
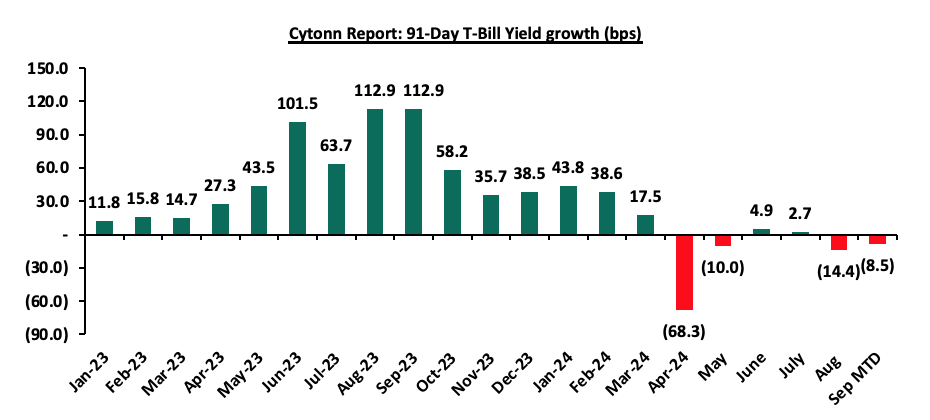
During the week, T-bills were undersubscribed for the first time in three weeks with the overall undersubscription rate coming in at 89.1%, a reversal from the oversubscription rate of 162.3% recorded the previous week. Investors’ preference for the shorter 91-day paper persisted, with the paper receiving bids worth Kshs 14.2 bn against the offered Kshs 4.0 bn, translating to an oversubscription rate of 354.7%, albeit lower than the oversubscription rate of 580.2% recorded the previous week. The subscription rates for the 182-day and 364-day papers decreased significantly to 32.7% and 39.2% respectively from the 101.7% and 55.7% respectively recorded the previous week. The government accepted a total of Kshs 19.9 bn worth of bids out of Kshs 21.4 bn bids received, translating to an acceptance rate of 93.3%. The yields on the government papers were on a downward trajectory, with the yields on the 364-day, 182-day and 91-day papers decreasing by 0.6 bps, 0.1 bps and 1.8 bps to 16.82%, 16.62% and 15.75% respectively from 16.82%, 16.63% and 15.77% respectively recorded the previous week. The chart below shows the yield growth rate for the 91-day paper over the period:
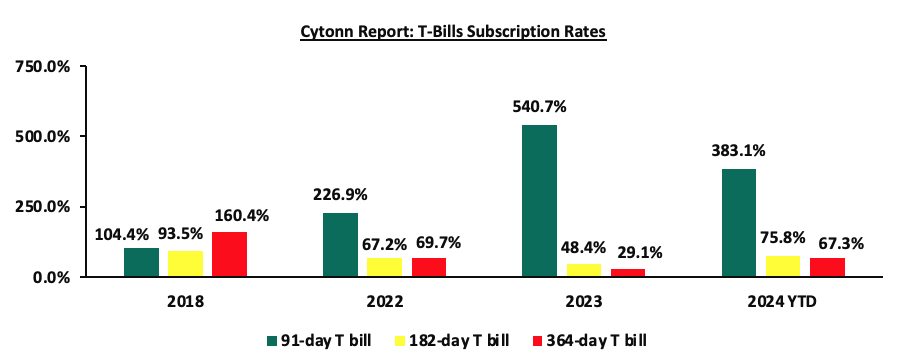
The chart below compares the overall average T-bill subscription rates obtained in 2018, 2022, 2023, and 2024 Year-to-date (YTD):
Money Market Performance:
In the money markets, 3-month bank placements ended the week at 17.6% (based on what we have been offered by various banks), and the yields on the government papers were on a downward trajectory, with the yields on the 364-day and 91-day papers decreasing by 0.6 bps and 1.8 bps to remain relatively unchanged at 16.8% and 15.8% respectively recorded the previous week. The yields on the Cytonn Money Market Fund decreased marginally by 2.0 bps to close the week at 18.2% relatively unchanged from the previous week, while the average yields on the Top 5 Money Market Funds increased by 11.0 bps to 17.7% from the 17.6% recorded the previous week.
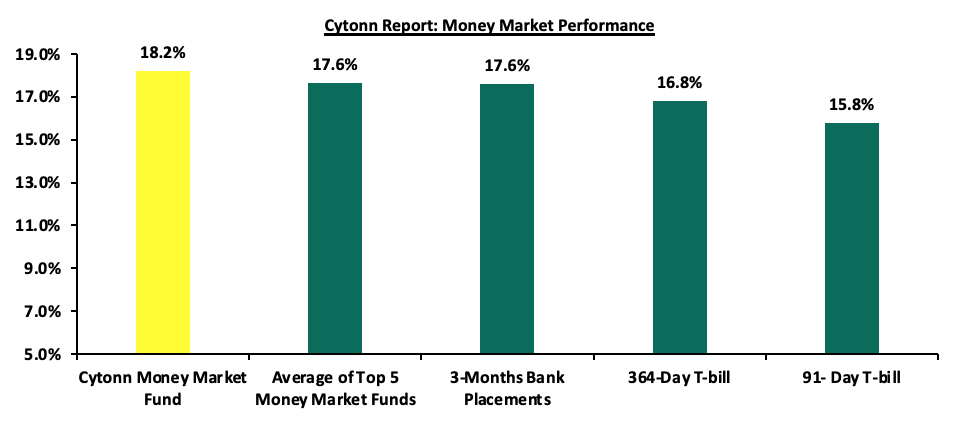
The table below shows the Money Market Fund Yields for Kenyan Fund Managers as published on 13th September 2024:
|
Cytonn Report: Money Market Fund Yield for Fund Managers as published on 13th September 2024 |
||
|
Rank |
Fund Manager |
Effective Annual Rate |
|
1 |
Cytonn Money Market Fund (Dial *809# or download the Cytonn App) |
18.2% |
|
2 |
Lofty-Corban Money Market Fund |
18.2% |
|
3 |
Arvocap Money Market Fund |
17.7% |
|
4 |
Etica Money Market Fund |
17.6% |
|
5 |
Kuza Money Market fund |
17.1% |
|
6 |
GenAfrica Money Market Fund |
16.8% |
|
7 |
Jubilee Money Market Fund |
16.1% |
|
8 |
Enwealth Money Market Fund |
16.0% |
|
9 |
Nabo Africa Money Market Fund |
16.0% |
|
10 |
Genghis Money Market Fund |
16.0% |
|
11 |
Co-op Money Market Fund |
15.8% |
|
12 |
Absa Shilling Money Market Fund |
15.6% |
|
13 |
KCB Money Market Fund |
15.6% |
|
14 |
Madison Money Market Fund |
15.5% |
|
15 |
Mali Money Market Fund |
15.4% |
|
16 |
Stanbic Money Market Fund |
15.2% |
|
17 |
Apollo Money Market Fund |
15.2% |
|
18 |
Mayfair Money Market Fund |
15.1% |
|
19 |
Sanlam Money Market Fund |
15.1% |
|
20 |
Orient Kasha Money Market Fund |
14.9% |
|
21 |
AA Kenya Shillings Fund |
14.9% |
|
22 |
Dry Associates Money Market Fund |
14.2% |
|
23 |
Old Mutual Money Market Fund |
14.1% |
|
24 |
ICEA Lion Money Market Fund |
13.9% |
|
25 |
CIC Money Market Fund |
13.7% |
|
26 |
British-American Money Market Fund |
13.2% |
|
27 |
Equity Money Market Fund |
12.7% |
Source: Business Daily
Liquidity:
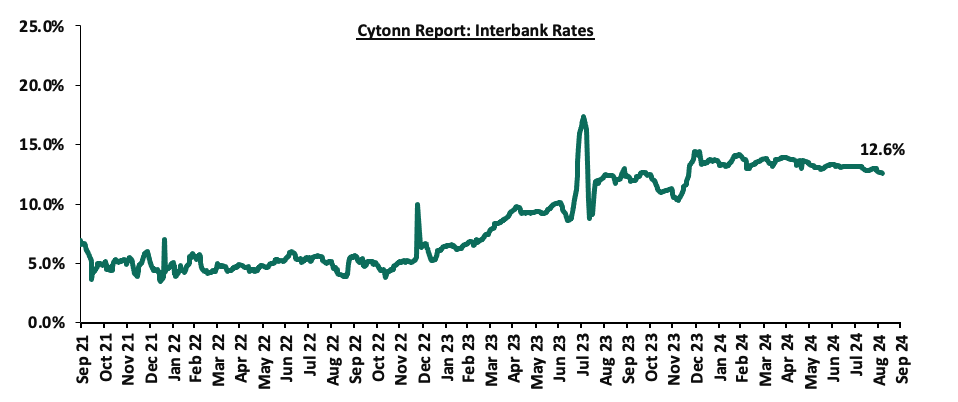
During the week, liquidity in the money markets eased, with the average interbank rate decreasing marginally by 0.3 bps, to remain relatively unchanged at 12.6% recorded the previous week, partly attributable to government payments that offset tax remittances. The average interbank volumes traded increased by 22.4% to Kshs 35.1 bn from Kshs 28.7 bn recorded the previous week. The chart below shows the interbank rates in the market over the years:
Kenya Eurobonds:
During the week, the yields on Eurobonds were on an upward trajectory, with the yields on the 7-year Eurobond issued in 2019 increasing the most by 47.4 bps to 10.5% from 10.1% recorded the previous week. The table below shows the summary of the performance of the Kenyan Eurobonds as of 12th September 2024;
|
Cytonn Report: Kenya Eurobonds Performance |
||||||
|
|
2018 |
2019 |
2021 |
2024 |
||
|
Tenor |
10-year issue |
30-year issue |
7-year issue |
12-year issue |
13-year issue |
7-year issue |
|
Amount Issued (USD) |
1.0 bn |
1.0 bn |
0.9 bn |
1.2 bn |
1.0 bn |
1.5 bn |
|
Years to Maturity |
3.5 |
23.5 |
2.7 |
7.7 |
9.8 |
6.4 |
|
Yields at Issue |
7.3% |
8.3% |
7.0% |
7.9% |
6.2% |
10.4% |
|
01-Jan-24 |
9.8% |
10.2% |
10.1% |
9.9% |
9.5% |
|
|
05-Sep-24 |
10.3% |
10.8% |
10.1% |
10.5% |
10.4% |
10.6% |
|
06-Sep-24 |
10.3% |
10.8% |
10.1% |
10.5% |
10.4% |
10.7% |
|
09-Sep-24 |
10.4% |
10.8% |
10.2% |
10.6% |
10.5% |
10.7% |
|
10-Sep-24 |
10.5% |
10.9% |
10.4% |
10.7% |
10.6% |
10.9% |
|
11-Sep-24 |
10.6% |
11.0% |
10.7% |
10.9% |
10.8% |
11.0% |
|
12-Sep-24 |
10.5% |
10.9% |
10.5% |
10.8% |
10.6% |
10.8% |
|
Weekly Change |
0.2% |
0.1% |
0.5% |
0.3% |
0.2% |
0.2% |
|
MTD Change |
0.1% |
0.1% |
0.4% |
0.2% |
0.2% |
0.1% |
|
YTD Change |
0.6% |
0.7% |
0.4% |
0.9% |
1.1% |
- |
Source: Central Bank of Kenya (CBK) and National Treasury
Kenya Shilling:
During the week, the Kenya Shilling depreciated marginally against the US Dollar by 0.6 bps, to remain relatively unchanged at the Kshs 129.2 recorded the previous week. On a year-to-date basis, the shilling has appreciated by 17.7% against the dollar, a contrast to the 26.8% depreciation recorded in 2023.
We expect the shilling to be supported by:
- Diaspora remittances standing at a cumulative USD 4,571.7 mn in the 12 months to July 2024, 12.2% higher than the USD 4,075.7 mn recorded over the same period in 2023, which has continued to cushion the shilling against further depreciation. In the July 2024 diaspora remittances figures, North America remained the largest source of remittances to Kenya accounting for 54.9% in the period, and,
- The tourism inflow receipts which came in at USD 352.5 bn in 2023, a 31.5% increase from USD 268.1 bn inflow receipts recorded in 2022, and owing to tourist arrivals that improved by 27.2% in the 12 months to June 2024, from the arrivals recorded during a similar period in 2023.
The shilling is however expected to remain under pressure in 2024 as a result of:
- An ever-present current account deficit which came at 3.2% of GDP in Q1’2024 from 3.0% recorded in Q1’2023,
- The need for government debt servicing, continues to put pressure on forex reserves given that 67.9% of Kenya’s external debt is US Dollar-denominated as of March 2024, and,
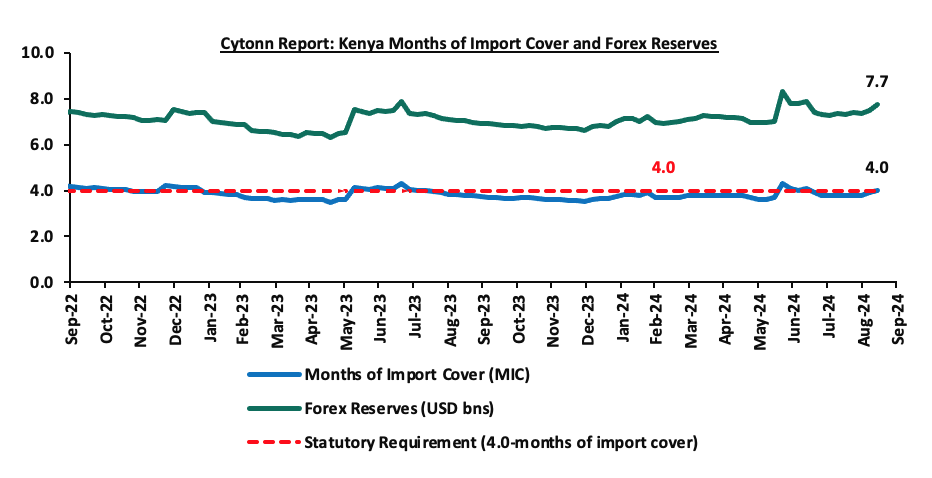
- Dwindling forex reserves currently at USD 7.7 bn (equivalent to 4.0-months of import cover), which is equal to the statutory requirement of maintaining at least 4.0-months of import cover, but lower than the EAC region’s convergence criteria of 4.5-months of import cover.
Key to note, Kenya’s forex reserves increased by 3.2% during the week to close the week at USD 7.7 bn from the USD 7.5 bn recorded the previous week, equivalent to 4.0 months of import cover, up from the 3.9 months recorded last week, and equal to the statutory requirement of maintaining at least 4.0-months of import cover. The chart below summarizes the evolution of Kenya's months of import cover over the years:
Weekly Highlights:
- Fuel Prices effective 15th September 2024 to 14th October 2024
During the week, During the week, The Energy and Petroleum Regulatory Authority (EPRA) released their monthly statement on the maximum retail fuel prices in Kenya, effective from 15th September 2024 to 14th October 2024. Notably, the maximum allowed price for Super Petrol and Diesel remained unchanged from the prices announced for the previous period, while the maximum price allowed for Kerosene decreased by Kshs 3.4 per litre. Consequently, Super Petrol and Diesel will continue to retail at Kshs 188.8 and Kshs. 171.6 per litre respectively, while Kerosene will retail at Kshs. 158.4 per litre from Kshs 161.8 the previous month.
Other key take-outs from the performance include;
- The average landing costs per cubic meter for Super Petrol, Diesel and Kerosene decreased by 1.5%, 3.0% and 5.3% each respectively to USD 697.6, USD 673.4 and USD 668.3 respectively in August 2024 from USD 708.5, USD 693.8 and USD 705.7 respectively recorded in July 2024,
- The Kenyan shilling depreciated marginally against the US Dollar by 1.1% to Kshs. 129.4 in August 2024, compared to the mean monthly exchange rate of Kshs 130.8 recorded in July 2024.
We note that fuel prices in the country have decreased in recent months largely due to the government's efforts to stabilize pump prices through the petroleum pump price stabilization mechanism which expended Kshs 9.9 bn in the FY2023/24 to cushion the increases applied to the petroleum pump prices, coupled with the ongoing appreciation of the Kenyan Shilling against the dollar and other major currencies, as well as a decrease in international fuel prices. Nevertheless, fuel prices in the country still remain under pressure from the high taxation of petroleum products as provided in the Finance Act 2023. We expect that fuel prices will drop in the coming months as a result of the government's efforts to mitigate the cost of petroleum through the pump price stabilization mechanism and strengthening of the Kenyan Shilling against the United States Dollar, having gained by 17.7% against the dollar on a year-to-date basis. As such, we expect the business environment in the country to improve as fuel is a major input cost, as well as further ease in inflationary pressures, with the inflation rate expected to remain within the CBK’s preferred target range of 2.5%-7.5%.
Rates in the Fixed Income market have been on an upward trend given the continued high demand for cash by the government and the occasional liquidity tightness in the money market. The government is 113.1% ahead of its prorated net domestic borrowing target of Kshs 86.4 bn, having a net borrowing position of Kshs 184.1 bn. However, we expect a downward readjustment of the yield curve in the short and medium term, with the government looking to increase its external borrowing to maintain the fiscal surplus, hence alleviating pressure in the domestic market. As such, we expect the yield curve to normalize in the medium to long-term and hence investors are expected to shift towards the long-term papers to lock in the high returns.
Market Performance:
During the week, the equities market recorded mixed performance, with NASI gaining the most by 0.7% and NSE 20 gaining by 0.4% while NSE 25 and NSE 10 declined 0.2% each, taking the YTD performance to gains of 21.2%, 19.6%, 15.6%, and 13.6% for NSE 10, NSE 25, NASI, and NSE 20 respectively. The equities market performance was driven by gains recorded by large-cap stocks such as Safaricom, BAT, and Bamburi of 3.4%, 1.3%, and 0.9% respectively. The performance was, however, weighed down by losses recorded by large-cap stocks such as NCBA, KCB, and Stanbic of 7.9%,3.9%, and 1.0% respectively.
During the week, equities turnover decreased by 7.5% to USD 9.2 mn from USD 10.0 mn recorded the previous week, taking the YTD total turnover to USD 463.4 mn. Foreign investors remained net buyers with a net buying position of USD 1.2 mn, from a net selling position of USD 2.3 mn recorded the previous week, taking the YTD foreign net buying to USD 0.8 mn.
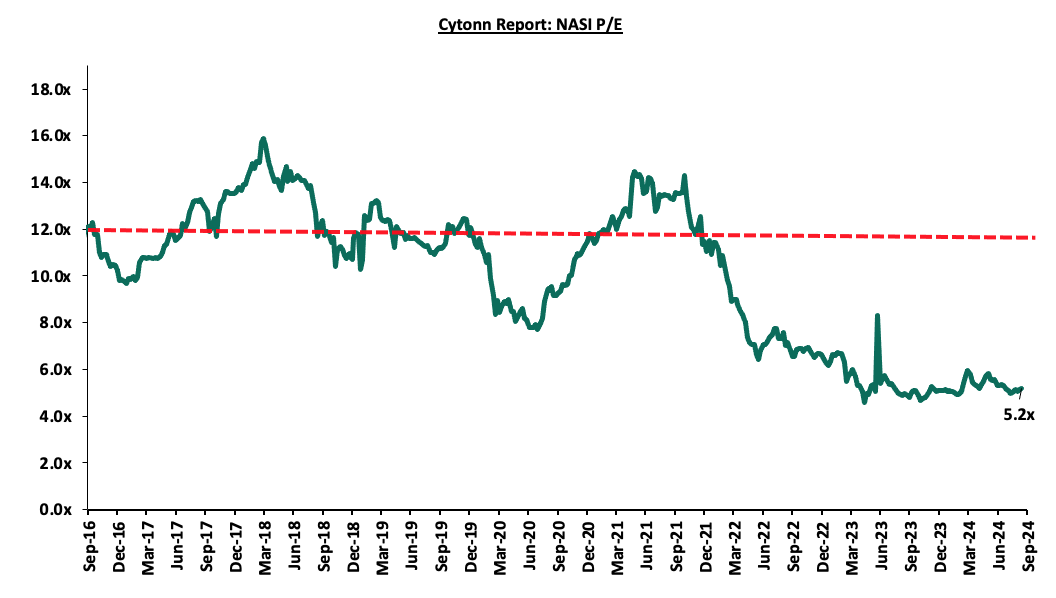
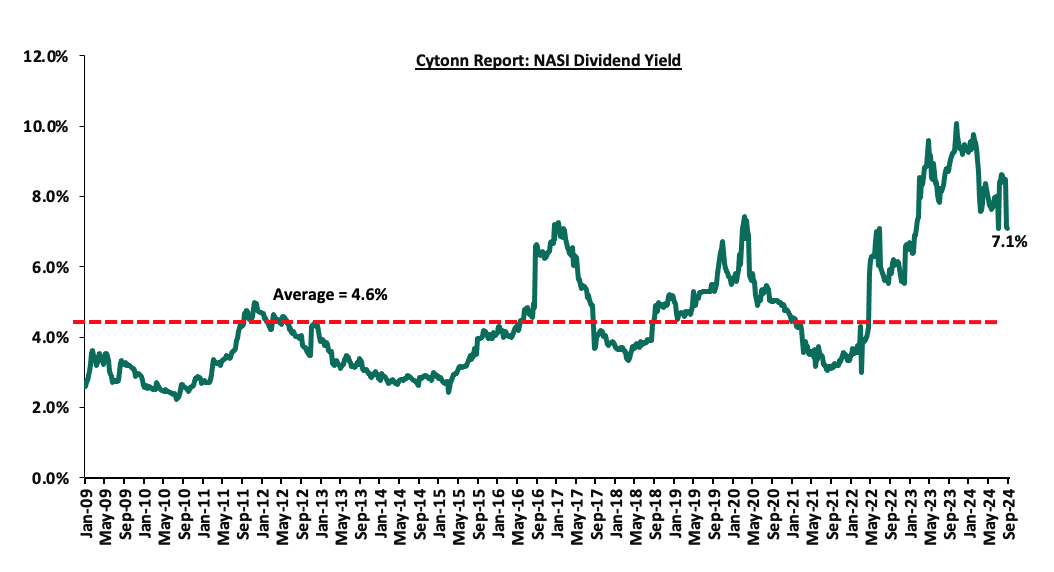
The market is currently trading at a price-to-earnings ratio (P/E) of 5.2x, 56.2% below the historical average of 11.8x. The dividend yield stands at 7.1%, 2.5% points above the historical average of 4.6%. Key to note, NASI’s PEG ratio currently stands at 0.6x, an indication that the market is undervalued relative to its future growth. A PEG ratio greater than 1.0x indicates the market is overvalued while a PEG ratio less than 1.0x indicates that the market is undervalued. The charts below indicate the historical P/E and dividend yields of the market;
Universe of Coverage:
|
Cytonn Report: Equities Universe of Coverage |
||||||||||
|
Company |
Price as at 06/09/2025 |
Price as at 13/09/2026 |
w/w change |
YTD Change |
Year Open 2024 |
Target Price* |
Dividend Yield |
Upside/ Downside** |
P/TBv Multiple |
Recommendation |
|
Jubilee Holdings |
155.0 |
155.0 |
0.0% |
(16.2%) |
316.8 |
260.7 |
9.2% |
77.4% |
0.2x |
Buy |
|
Diamond Trust Bank*** |
45.5 |
45.6 |
0.2% |
1.9% |
59.5 |
65.2 |
11.0% |
53.9% |
0.2x |
Buy |
|
NCBA*** |
43.7 |
40.3 |
(7.9%) |
3.6% |
25.5 |
55.2 |
11.8% |
48.9% |
0.7x |
Buy |
|
Equity Group*** |
43.2 |
43.2 |
0.1% |
26.3% |
52.8 |
60.2 |
9.3% |
48.6% |
0.8x |
Buy |
|
KCB Group*** |
33.7 |
32.4 |
(3.9%) |
47.6% |
45.6 |
46.7 |
0.0% |
44.0% |
0.5x |
Buy |
|
CIC Group |
2.0 |
2.1 |
1.0% |
(10.5%) |
2.2 |
2.8 |
6.3% |
42.9% |
0.6x |
Buy |
|
Co-op Bank*** |
13.1 |
13.1 |
0.0% |
15.4% |
13.0 |
17.2 |
11.5% |
42.7% |
0.6x |
Buy |
|
Stanbic Holdings |
121.3 |
120.0 |
(1.0%) |
13.2% |
87.0 |
145.3 |
12.8% |
33.9% |
0.8x |
Buy |
|
ABSA Bank*** |
14.1 |
14.2 |
0.7% |
22.5% |
11.8 |
17.3 |
11.0% |
33.2% |
1.1x |
Buy |
|
Britam |
5.8 |
5.7 |
(1.4%) |
10.5% |
7.6 |
7.5 |
0.0% |
32.0% |
0.8x |
Buy |
|
I&M Group*** |
22.0 |
22.2 |
0.7% |
26.9% |
21.4 |
26.5 |
11.5% |
31.2% |
0.5x |
Buy |
|
Target Price as per Cytonn Analyst estimates **Upside/ (Downside) is adjusted for Dividend Yield ***For Disclosure, these are stocks in which Cytonn and/or its affiliates are invested in |
||||||||||
We are “Neutral” on the Equities markets in the short term due to the current tough operating environment and huge foreign investor outflows, and, “Bullish” in the long term due to current cheap valuations and expected global and local economic recovery. With the market currently being undervalued for its future growth (PEG Ratio at 0.6x), we believe that investors should reposition towards value stocks with strong earnings growth and that are trading at discounts to their intrinsic value. We expect the current high foreign investors’ sell-offs to continue weighing down the equities outlook in the short term.
- Real Estate Investments Trusts (REITs)
- Pangani affordable houses-Tecnofin Kenya Limited
During the week the construction of the Pangani Affordable Housing, the Ksh 5.0 bn Project in Nairobi, which had been stalled for two years due to financial challenges, has resumed after the developer, Tecnofin Kenya Ltd, secured new funding. The project, initially scheduled for completion by June 2023, faced delays after the developer ran out of funds, partly due to the project's rapid pace. The specific amount of funding that Tecnofin Kenya Ltd secured to resume the Pangani Affordable Housing Project has not been publicly disclosed in the available sources. However, the developer's new financial backing allowed them to overcome previous cash flow challenges and restart the project. Previously, they had attempted to secure additional funding through the project's title deed, but a court ruling blocked this attempt
Construction has now resumed, with work such as equipment servicing, debris removal, painting, and window installation underway. Located near Nairobi CBD, it offers easy access to essential services and infrastructure. The project also provides financial benefits, including tax exemptions and affordable mortgage rates, for first-time homebuyers under the Affordable Housing Scheme. The below table shows various typologies and their prices per SQM
|
Cytonn Report: Pangani affordable housing units by Tecnofin Kenya Limited |
|||
|
Typology |
Plinth Area (SQM) |
Price (Kshs Mn) |
Price per SQM(Kshs) |
|
1 |
30 |
1.0 |
33,333 |
|
2 |
40 |
2.0 |
50,000 |
|
3 |
60 |
3.0 |
50,000 |
|
Average |
43 |
2.0 |
44,444 |
The project consists of 1,562 units, including 952 affordable housing units and 610 market-rate units. Prices for the affordable units range from KSh 1.0 mn for a one-bedroom to Ksh 3.0 mn for a three-bedroom unit, while market-rate units are priced at Ksh 9.0 mn. The above prices matches with Projects under the Affordable Housing Programme in the Nairobi area affordable housing price per SQM which ranges between Kshs 33,333 to Ksh 50,000
We expect heightened activities in the Real Estate residential sector supported by the government initiatives in the residential sector, especially through the Affordable Housing Agenda and demand for housing driven by the growing population and high urbanization rate currently at 3.7% per annum. The outlook for Kenya’s residential real estate sector in 2024 indicates continued growth despite various challenges. The real estate market is benefiting from strong demand driven by urbanization, population growth, and government initiatives such as the affordable housing program. However, rising construction costs, high interest rates, and financing constraints due to tightened lending are dampening growth prospects.
As of 2024, the homeownership rate in Kenya is about 21.3% in urban areas, which remains significantly low compared to other countries like South Africa (53.0%) and Ghana (47.2%) as shown in the below chart
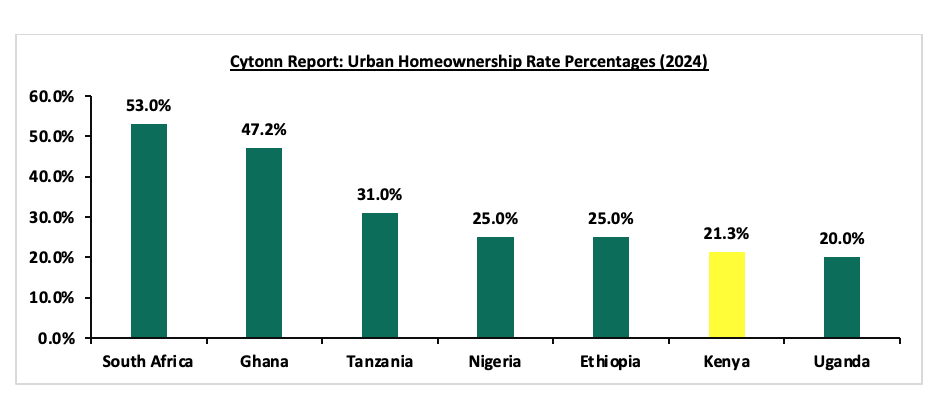
This figure highlights the need for more affordable housing initiatives, as the country continues to face a housing deficit of approximately 2.0 mn units. The low homeownership rate is attributed to factors such as high property prices, limited access to affordable financing, and rapid urbanization. Programs like the government's Affordable Housing initiative are working to address this deficit and improve homeownership rates by offering subsidized housing options to lower-middle and middle-income earners
- REIT Weekly Performance
On the Unquoted Securities Platform, Acorn D-REIT and I-REIT traded at Kshs 25.4 and Kshs 22.2 per unit, respectively, as per the last updated data on 13th September 2024. The performance represented a 27.0% and 11.0% gain for the D-REIT and I-REIT, respectively, from the Kshs 20.0 inception price. The volumes traded for the D-REIT and I-REIT came in at Kshs 12.3 mn and Kshs 31.6 mn shares, respectively, with a turnover of Kshs 311.5 mn and Kshs 702.7 mn, respectively, since inception in February 2021. Additionally, ILAM Fahari I-REIT traded at Kshs 11.0 per share as of 13th September, 2024, representing a 45.0% loss from the Kshs 20.0 inception price. The volume traded to date came in at 138,600 for the I-REIT, with a turnover of Kshs 1.5 mn since inception in November 2015.
REITs offer various benefits, such as tax exemptions, diversified portfolios, and stable long-term profits. However, the ongoing decline in the performance of Kenyan REITs and the restructuring of their business portfolios are hindering significant previous investments. Additional general challenges include: i) insufficient understanding of the investment instrument among investors leading to a slower uptake of REIT products, ii) lengthy approval processes for REIT creation, iii) high minimum capital requirements of Kshs 100.0 mn for REIT trustees compared to Kshs. 10 million for pension funds Trustees, (iv) limiting the type of entity that can form a REIT to only a trust company, and v) minimum subscription amounts or offer parcels set at Kshs 0.1 mn for D-REITs and 5.0 Mn for restricted I-REITs. The significant capital requirements still make REITs relatively inaccessible to smaller retail investors compared to other investment vehicles like unit trusts or government bonds, all of which continue to limit the performance of the Kenyan REITs market.
We expect the performance of Kenya’s Real Estate sector to be sustained by: i) increased investment from local and international investors, particularly in the residential sector ii) favorable demographics in the country, leading to higher demand for housing and Real Estate, (iii) government infrastructure development projects e.g. roads, opening up satellite towns for investment, and iv) increased enrollment in universities and other tertiary institutions supporting the take up of Purpose-Built Student Accommodation properties. However, challenges such as rising construction costs, strain on key infrastructure development, and high capital demands in the REITs sector will continue to impede the sector’s optimal performance by restricting developments and investments.
Following the release of the H1’2024 results by Kenyan listed banks, the Cytonn Financial Services Research Team undertook an analysis on the financial performance of the listed banks and identified the key factors that shaped the performance of the sector. For the earnings notes of the various banks, click the links below:
- Equity Group H1’2024 Earnings Note
- KCB Group H1’2024 Earnings Note
- Standard Chartered Bank Kenya H1’2024 Earnings Note
- ABSA Bank Kenya H1’2024 Earnings Note
- NCBA Group H1’2024 Earnings Note
- Co-operative Bank H1’2024 Earnings Note
- Stanbic Holdings H1’2024 Earnings Note
- I&M Group Holdings H1’2024 Earnings Note
- Diamond Trust Bank Kenya (DTB-K) H1’2024 Earnings Note
- HF Group H1’2024 Earnings Note
The core earnings per share (EPS) for the listed banks recorded a weighted growth of 28.9% in H1’2024, compared to a weighted growth of 14.3% recorded in H1’2023, an indication of sustained performance supported by an improved operating environment experienced in H1’2024 on the back of easing inflationary pressures and a strengthening Shilling. Notably, the inflation rate in H1’2024 averaged 5.6%, 2.9% points lower than the 8.5% average in H1’2023, with the Kenyan Shilling having appreciated by 17.2% against the USD in H1’2024. The performance in H1’2024 was supported by a 17.6% growth in net interest income coupled with a 13.6% growth in non-funded income. The softer growth in NFI was partly driven by the decrease in foreign exchange income recorded by the banks during the period as a result of decreased dollar demand in the country, following the appreciation of the Kenyan Shilling against the dollar. Additionally, the asset quality of listed banks deteriorated, with the weighted average Gross Non-Performing Loan ratio (NPL) increasing by 0.7% points to 13.4%, from 12.7% recorded in H1’2023. The performance remained 2.5% points above the ten-year average of 11.0%.
The report is themed “Sustained Profitability Owing to Improved Business Environment” where we assess the key factors that influenced the performance of the banking sector in H1’2024, the key trends, the challenges banks faced, and areas that will be crucial for growth and stability of the banking sector going forward. As such, we shall address the following:
- Key Themes that Shaped the Banking Sector Performance in H1’2024,
- Summary of the Performance of the Listed Banking Sector in H1’2024,
- The Focus Areas of the Banking Sector Players Going Forward, and,
- Brief Summary and Ranking of the Listed Banks based on the outcome of our analysis.
Section I: Key Themes That Shaped the Banking Sector Performance in H1’2024
In this section, we will highlight the main factors influencing the banking sector in H1’2024. These include regulation, digitization, interest rates, regional expansion through mergers and acquisitions, and asset quality:
- Regulation:
Risk-based Lending: Over the years, the government has used various policy tools to curb the increasing interest rates and promote access to credit by the private sector. As such, after the repeal of the Interest Cap Law in 2019, the Central Bank of Kenya (CBK) intervened administratively by halting banks from repricing their loans. Instead, banks were required to develop and submit new risk-based lending formulas for approval. The model's primary purpose is to instill fairness and transparency in credit pricing decisions as it allows Banks to price based on a customer’s risk profile. This represents a shift from the traditional practice of rejecting loan applicants solely based on their credit scores. The new credit scoring system primarily targets borrowers with higher risks, many of whom are micro, small, and medium-sized enterprises facing challenges in accessing traditional credit. As of June 2023, 33 out of the 38 banks in the country had their models approved by the CBK, with Equity Bank being the first commercial bank to implement risk-based lending. However, the approval process of the models has been gradual in a bid to avoid causing distress to customers through high interest rates. Further, the full deployment has been slowed due to inadequate data to analyse the client's risk profile,
- Digitization: In H1’2024, digitization continued to be a transformative force in the banking sector, significantly improving how banks operate and deliver services. There has been a significant increase in the adoption of mobile and online banking platforms as customers now prefer to perform banking transactions from the comfort of their homes, leading to a decline in the use of physical branches. For instance, most of the listed banks disclosed that the majority of transactions were conducted through alternative channels, with Equity Group and KCB Group reporting that 84.0% and 72.0% of their transactions, respectively, were done through non-branch channels in H1’2024,
- Interest Rates: Interest rates remained high in H1’2024 compared to the same period in 2023. Notably, the yields on Kenyan government securities were on an upward trajectory in H1’2024, with the yield on the 91-day paper averaging 16.2% during the quarter, 6.1% points higher than the average of 10.1% in H1’2023. The elevated rates led to a significant increase in the listed bank’s interest income, rising to a weighted average of 29.5% in H1’2024 from a weighted average of 28.2% in H1’2023. Additionally, interest expense increased to a weighted average of 58.2% in H1’2024, up from 44.8% in H1’2023,
- Regional Expansion through Mergers and Acquisitions: Kenyan banks are increasingly expanding their regional footprint, with subsidiaries contributing significantly to overall profitability. For instance, Equity Group reported that regional subsidiaries contributed 55.0% of the Group’s Profit Before Tax (PBT) in H1’2024, up from 44.0% in the same period last year, demonstrating the growing importance of these subsidiaries to the group’s earnings. Additionally, KCB Group's subsidiaries contributed 37.8% of the group's PBT in H1’2023. In H1’2024, there was one acquisition agreement announcement between Access Bank plc and KCB Group:
- On March 20, 2024 Access Bank Plc announced that it had entered into a share purchase agreement with KCB Group Plc that would allow Access Bank Plc to acquire 100% shareholding in National Bank of Kenya Limited (NBK) from KCB. Access Bank Plc is a wholly owned subsidiary of Access Holdings Plc listed on the Nigerian Exchange as Access Corporation. Notably, KCB Bank had acquired the National Bank of Kenya back in 2019 in a rescue deal that was supervised by the Central Bank of Kenya. The announcement follows the release of the FY’2023 results for the KCB group, which revealed a decline in earnings with its Core earnings per share (EPS) declining by 8.3% to Kshs 11.7, from Kshs 12.7 in FY’2022. The transaction represents an important milestone for Access Bank as it moves closer to the achievement of its five-year strategic plan through increased scale in the Kenyan market. In the signed deal, Access Bank will pay multiples of 1.3x the book value of NBK, which stood at Kshs 10.6 bn as of end December 2023. This values the deal at about Kshs 13.3 bn with the actual figure to be announced when the transaction is completed. For more information, please see our Cytonn Weekly #12/2024,
- In April 2024, Sidian Bank disclosed that the founders of the bank and other nine individual shareholders relinquished a combined stake of 728,525 shares representing 16.6% stake to Pioneer General Insurance Limited, pioneer Life Investments Limited, Wizro Enterprises Limited, Afrah Limited, and Telesec Africa Limited. The transaction amounted to Kshs 0.8 bn translating to a price to book multiple (P/Bv) of 1.0x. This follows an earlier transaction executed on October 2023 when Pioneer General Insurance, Wizpro Enterprise, and Afram Limited bought 38.9% stake in the lender following a shareholders’ resolution passed on 20th September 2023 approving the sale.
The following are Mergers and Acquisitions that were completed in 2023:
- On January 30, 2023, the Central Bank of Kenya (CBK) announcedthat Commercial International Bank (Egypt) S.A.E (CIB) had completed the acquisition of an additional 49.0% shareholding of Mayfair CIB Bank Limited (MBL) at Kshs 5.0 bn following the earlier acquisition of 51.0% stake in MBL announced in April 2020. Consequently, MBL is now a fully owned subsidiary of CIB,
- On January 30, 2023, Equity Group Holdings , through Equity Bank Kenya Limited (EBKL) announced that it had completed the acquisition of certain assets and liabilities of the local Bank, Spire Bank Limited after obtaining all the required regulatory approvals. The completion of the acquisition followed the Assets and Liabilities Purchase Agreement, which was announced in September 2022, as highlighted in our Cytonn Weekly #37/2022. As such, Equity Bank Kenya Limited took over Spire Bank’s 12 branches as well as all existing depositors in Spire Bank, other than the remaining deposits from its largest shareholder, Mwalimu SACCO. For more information, please see our Cytonn Monthly-January 2023,
- On March 17, 2023, the Central Bank of Kenya (CBK) announced that Premier Bank Limited Somalia (PBLS) had completed the acquisition of 62.5% shareholding of First Community Bank Limited (FCB) effective 27 March 2023. This came after receiving regulatory approvals from the CBK and the Cabinet Secretary for the National Treasury. FCB, which has been in operation since June 2008, is classified as a tier 3 bank in Kenya with 18 branches and a market share of 0.3% as at December 2022. The acquisition by Premier Bank Limited Somalia (PBLS), came at a time when FCB has been struggling to meet regulatory Capital adequacy requirements. For more information, please see our Cytonn Weekly #11/2023,
- On May 22, 2023, the Central Bank of Kenya (CBK) announced that Shorecap III, LP, a Private Equity fund governed by the laws of Mauritius, had acquired a 20.0% stake in Credit Bank Plc. The fund is managed by Equator Capital Partners LLC, and the acquisition took effect from June 15, 2023. While the CBK initially did not reveal the value of the deal, it has since been disclosed that Shorecap III, LP paid Ksh 0.7 bn for the 20.0% stake, valuing the bank at Ksh 3.64 bn. Shorecap III, LP assumed control of 7,289,928 ordinary shares, which make up 20.0% of the Bank’s ordinary shares. The funds helped lift Credit Bank from a regulatory capital breach. For additional details, refer to our Cytonn Weekly #21/2023, and,
- On December 1, 2023 Equity Group Holdings Plc (EGH) announced that it had successfully completed the acquisition of its Rwandan Subsidiary, Compagnie Générale de Banque (Cogebanque) Plc, marking a significant milestone in its regional expansion strategy. Equity Group now holds 198,250 shares representing 99.1% of the issued share capital of COGEBANQUE, following receipt of all regulatory and corporate approvals, officially making COGEBANQUE its subsidiary. EGH made the announcement it had entered into a binding agreement with the Government of Rwanda, Rwanda Social Security Board, and other investors of Compagnie Generale De Banque (Cogebanque) Plc Limited to acquire a 91.9% stake in the Rwanda based lender on June 14, 2023. Notably, EGH signed a share purchase agreement with the Sellers on July 28, 2023, committing to buy 183,854 shares at a rate of 297,406 Rwandan Francs per share upon completion on December 1, 2023, giving EGH ownership of 99.1% of the issued share capital. Concurrently, EGH proposed to purchase all outstanding shares from the other shareholders of Cogebanque, aiming to own up to 100% of Cogebanque’s issued shares.
Below is a summary of the deals in the last 10 years that have either happened, been announced or expected to be concluded:
|
Cytonn Report: Banking Sector Deals and Acquisitions |
||||||
|
Acquirer |
Bank Acquired |
Book Value at Acquisition (Kshs bn) |
Transaction Stake |
Transaction Value (Kshs bn) |
P/Bv Multiple |
Date |
|
Pioneer General Insurance and four other companies |
Sidian Bank |
5.0 |
16.57% |
0.8 |
1.0x |
Apr-24 |
|
Access Bank PLC (Nigeria)* |
National Bank of Kenya |
10.6 |
100.00% |
13.3 |
1.3x |
Mar-24* |
|
Pioneer General Insurance and two other companies |
Sidian Bank |
5.0 |
38.91% |
2.0 |
1.0x |
Oct-23 |
|
Equity Group |
Cogebanque PLC ltd |
5.7 |
91.13% |
6.7 |
1.3x |
Dec-23 |
|
Shorecap III |
Credit Bank Plc |
3.6 |
20.00% |
0.7 |
1.0x |
Jun-23 |
|
Premier Bank Limited |
First Community Bank |
2.8 |
62.50% |
Undisclosed |
N/A |
Mar-23 |
|
KCB Group PLC |
Trust Merchant Bank (TMB) |
12.4 |
85.00% |
15.7 |
1.5x |
Dec-22 |
|
Equity Group |
Spire Bank |
Unknown |
Undisclosed |
Undisclosed |
N/A |
Sep-22* |
|
Access Bank PLC (Nigeria)* |
Sidian Bank |
4.9 |
83.40% |
4.3 |
1.1x |
June-22* |
|
KCB Group |
Banque Populaire du Rwanda |
5.3 |
100.00% |
5.6 |
1.1x |
Aug-21 |
|
I&M Holdings PLC |
Orient Bank Limited Uganda |
3.3 |
90.00% |
3.6 |
1.1x |
Apr-21 |
|
KCB Group** |
ABC Tanzania |
Unknown |
100.00% |
0.8 |
0.4x |
Nov-20* |
|
Co-operative Bank |
Jamii Bora Bank |
3.4 |
90.00% |
1 |
0.3x |
Aug-20 |
|
Commercial International Bank |
Mayfair Bank Limited |
1.0 |
51.00% |
Undisclosed |
N/A |
May-20* |
|
Access Bank PLC (Nigeria) |
Transnational Bank PLC. |
1.9 |
100.00% |
1.4 |
0.7x |
Feb-20* |
|
Equity Group ** |
Banque Commerciale Du Congo |
8.9 |
66.50% |
10.3 |
1.2x |
Nov-19* |
|
KCB Group |
National Bank of Kenya |
7.0 |
100.00% |
6.6 |
0.9x |
Sep-19 |
|
CBA Group |
NIC Group |
33.5 |
53%.47% |
23 |
0.7x |
Sep-19 |
|
Oiko Credit** |
Credit Bank |
3.0 |
22.80% |
1 |
1.5x |
Aug-19 |
|
CBA Group** |
Jamii Bora Bank |
3.4 |
100.00% |
1.4 |
0.4x |
Jan-19 |
|
AfricInvest Azure |
Prime Bank |
21.2 |
24.20% |
5.1 |
1.0x |
Jan-18 |
|
KCB Group |
Imperial Bank |
Unknown |
Undisclosed |
Undisclosed |
N/A |
Dec-18 |
|
SBM Bank Kenya |
Chase Bank Ltd |
Unknown |
75.00% |
Undisclosed |
N/A |
Aug-18 |
|
DTBK |
Habib Bank Kenya |
2.4 |
100.00% |
1.8 |
0.8x |
Mar-17 |
|
SBM Holdings |
Fidelity Commercial Bank |
1.8 |
100.00% |
2.8 |
1.6x |
Nov-16 |
|
M Bank |
Oriental Commercial Bank |
1.8 |
51.00% |
1.3 |
1.4x |
Jun-16 |
|
I&M Holdings |
Giro Commercial Bank |
3.0 |
100.00% |
5 |
1.7x |
Jun-16 |
|
Mwalimu SACCO |
Equatorial Commercial Bank |
1.2 |
75.00% |
2.6 |
2.3x |
Mar-15 |
|
Centum |
K-Rep Bank |
2.1 |
66.00% |
2.5 |
1.8x |
Jul-14 |
|
GT Bank |
Fina Bank Group |
3.9 |
70.00% |
8.6 |
3.2x |
Nov-13 |
|
Average |
|
|
73.3% |
|
1.3x |
|
|
Average: 2013 to 2018 |
|
|
73.5% |
|
1.7x |
|
|
Average: 2019 to 2024 |
|
|
73.2% |
|
1.0x |
|
|
* Announcement Date ** Deals that were dropped |
||||||
In H1’2024, the average acquisition valuations for banks have remained unchanged at 1.3x, similar to what was recorded in H1’2023. As such, the valuations still remain low compared to historical prices paid, as highlighted in the chart below;
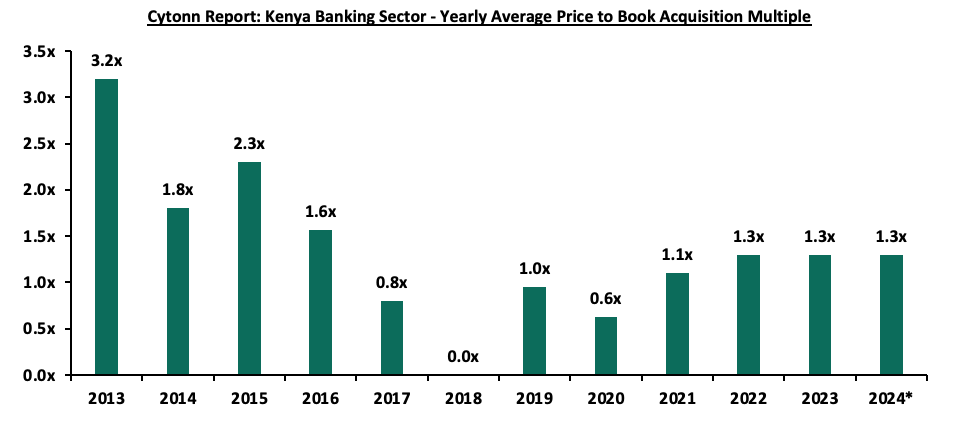
*Figure as of end H1’2024
As at the end of H1’2024, the number of commercial banks in Kenya stood at 38, the same as in H1’2023 but lower than the43 licensed banks in FY’2015. The ratio of the number of banks per 10.0 mn population in Kenya now stands at 6.7x, which is a reduction from 9.0x in FY’2015, demonstrating continued consolidation in the banking sector. However, despite the ratio improving, Kenya still remains overbanked as the number of banks remains relatively high compared to the African major economies. To bring the ratio to 5.5x, we ought to reduce the number of banks from the current 38 banks to about 30 banks. This ongoing trend is expected to accelerate following the recent Treasury announcement to review the minimum core capital requirement for commercial banks to Kshs 10.0 bn up from the current Kshs 1.0 bn. The new capital requirement is likely to trigger further mergers and acquisitions (M&As), especially for smaller lenders that may struggle to meet the threshold, potentially reducing the number of banks even further. The chart below shows the commercial bank ratio per 10.0 mn people across select African nations in comparison to Kenya;
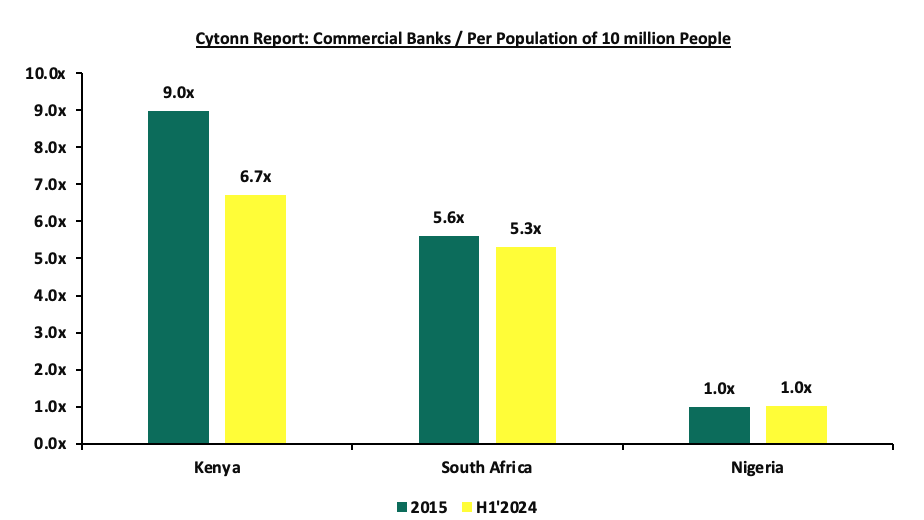
Source: World Bank, Central Bank of Kenya, South Africa Reserve Bank, Central Bank of Nigeria
- Asset Quality: Asset quality for listed banks deteriorated in H1’2024, with the weighted average Gross Non-Performing Loan ratio (NPL) increasing by 0.7% points to 13.4%, from 12.7% recorded in H1’2023. The performance remained 2.4% points above the ten-year average of 11.0%. Notably, 7 out of the 10 listed banks recorded an increase in the NPL ratio, mainly driven by tough business conditions and increased borrowing costs, which elevated credit risk and defaults. This was reflected in 2.7% points increase in Equity Group’s NPL ratio to 13.9%, from 11.2% in H1’2023, and 2.1% points rise in Cooperative Group’s NPL ratio to 16.7%, up from 14.6% in H1’2023. Equity Group’s asset quality worsened due to a 23.0% rise in Gross non-performing loans to Kshs 119.9 bn in H1’2024 from Kshs 97.5 bn in H1’2023, outpacing a 1.0% decline in gross loans to Kshs 861.6 bn from Kshs 870.3 bn in H1’2023. The chart below highlights the asset quality trend for the listed banks:
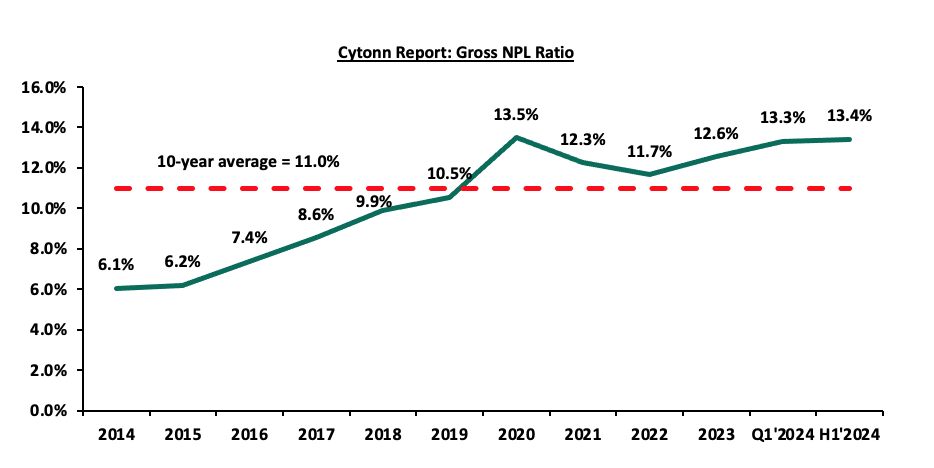
However, the deterioration in listed banks' asset quality was mitigated by an improvement in Standard Chartered Bank’s asset quality, with the Gross NPL ratio decreasing by 5.9% points to 8.4% in H1’2024 from 14.4% in H1’2023. This was attributable to the 42.9% decrease in gross non-performing loans to Kshs 13.6 bn from Kshs 23.8 bn in H1’2023, compared to the 2.9% decrease in gross loans to Kshs 160.9 bn from Kshs 165.6 bn in H1’2023. A total of three out of the ten listed Kenyan banks recorded an improvement in asset quality, driven by the improving economic environment, as evidenced by the H1’2024 Purchasing Managers Index (PMI) averaging 50.0, above the 48.7 average in H1’2023. Additionally, the Central Bank of Kenya lowered the Central Bank Rate (CBR) by 25 basis points to 12.75% from 13.00%, signalling a gradual easing of monetary policy. This reduction in CBR is expected to support credit growth and ease financial pressures on borrowers. Hence, going forward, we expect credit risk to decline gradually but remain at relatively elevated levels compared to previous years, owing to the improved business environment, easing inflationary pressures, and the appreciation of the Kenya shilling.
The table below highlights the asset quality for the listed banking sector:
|
Cytonn Report: Listed Banks Asset Quality |
||||||
|
|
H1’2023 NPL Ratio* |
H1’2024 NPL Ratio** |
% point change in NPL Ratio |
H1’2023 NPL Coverage* |
H1’2024 NPL Coverage** |
% point change in NPL Coverage |
|
EQTY |
11.2% |
13.9% |
2.7% |
54.5% |
58.8% |
4.3% |
|
CO-OP |
14.6% |
16.7% |
2.1% |
60.7% |
59.5% |
(1.2%) |
|
ABSA |
9.5% |
11.5% |
2.0% |
69.4% |
67.7% |
(1.7%) |
|
DTB-K |
12.3% |
13.5% |
1.3% |
46.4% |
44.4% |
(2.0%) |
|
HF |
23.1% |
24.2% |
1.1% |
72.0% |
75.6% |
3.6% |
|
KCB |
17.2% |
18.1% |
0.9% |
16.2% |
18.1% |
1.9% |
|
STANBIC |
9.2% |
9.5% |
0.3% |
57.4% |
75.0% |
17.6% |
|
NCBA |
13.4% |
12.2% |
(1.2%) |
57.8% |
59.8% |
2.0% |
|
I & M |
12.7% |
11.4% |
(1.3%) |
49.8% |
57.9% |
8.1% |
|
SCBK |
14.4% |
8.4% |
(5.9%) |
86.8% |
83.7% |
(3.1%) |
|
Mkt Weighted Average* |
12.7% |
13.4% |
0.6% |
60.1% |
57.5% |
(2.6%) |
|
*Market cap weighted as at 13/09/2024 |
||||||
|
**Market cap weighted as at 21/09/2023 |
||||||
Key take-outs from the table include;
- Asset quality for the listed banks deteriorated in H1’2024, with market-weighted average NPL increasing by 0.7% points to 13.4% from 12.7% in H1’2023. The worsening of asset quality was mainly driven by a deterioration in Equity Group, Coop Bank, Absa Group, Diamond Trust Bank, HF Group, KCB Group, and Stanbic Bank Kenya’s asset quality with their NPL ratio increasing by 2.7%, 2.1%, 2.0%, 1.3%, 1.1%, 0.9%, and 0.3% points respectively,
- Equity Group and Coop Bank had the highest NPL ratio jumps by 2.7% and 2.1% points respectively to 13.9% and 16.7%, from 11.2% and 14.6% respectively in H1’2023. Equity Group’s increase in NPL ratio was attributable to a 23.0% increase in Gross non-performing loans to Kshs 119.9 bn in H1’2024 from Kshs 97.5 bn in H1’2023, which outpaced the 1.0% decrease in gross loans to Kshs 861.6 bn from Kshs 870.3 bn recorded in H1’2023, and,
- Market weighted average NPL Coverage for the listed banks decreased by 2.6% points to 57.5% in H1’2024, from 60.1% recorded in H1’2023, majorly on the back of decreased NPL coverage recorded by Standard Chartered Bank, Diamond Trust Bank, Absa Group and Co-op Bank by 3.1%, 2.0%, 1.7% and 1.2% points respectively in H1’2024. However, the NPL coverage ratios of Stanbic Bank, I&M Group, Equity Group, HF Group, NCBA Bank, and KCB Group increased by 17.6%, 8.1%, 4.3%, 3.1%, 2.0% and 1.9% points respectively in H1’2024.
Section II: Summary of the Performance of the Listed Banking Sector in H1’2024:
The table below highlights the performance of the banking sector, showing the performance using several metrics, and the key take-outs of the performance;
|
Cytonn Report: Kenyan Listed Banks Performance H1’2024 |
|||||||||||||||
|
Bank |
Core EPS Growth |
Interest Income Growth |
Interest Expense Growth |
Net Interest Income Growth |
Net Interest Margin |
Non-Funded Income Growth |
NFI to Total Operating Income |
Growth in Total Fees & Commissions |
Deposit Growth |
Growth in Government Securities |
Loan to Deposit Ratio |
Loan Growth |
Return on Average Equity |
Cost of Funds |
YIEA |
|
KCB Group |
86.4% |
38.9% |
46.5% |
34.8% |
7.1% |
20.8% |
35.2% |
11.9% |
1.3% |
(1.5%) |
67.8% |
0.0% |
22.7% |
4.6% |
11.3% |
|
Standard Chartered |
48.9% |
25.4% |
78.0% |
19.3% |
8.6% |
36.1% |
36.7% |
20.6% |
66.5% |
(19.9%) |
54.0% |
2.7% |
25.5% |
1.2% |
9.6% |
|
HF Group |
45.3% |
23.8% |
44.4% |
4.7% |
5.3% |
30.7% |
35.0% |
29.2% |
10.7% |
24.4% |
84.2% |
(0.4%) |
5.2% |
6.7% |
11.7% |
|
ABSA Bank |
28.9% |
29.3% |
60.1% |
19.7% |
10.1% |
8.4% |
27.7% |
0.2% |
6.2% |
(21.0%) |
89.5% |
(0.5%) |
27.5% |
5.0% |
14.2% |
|
I&M Group |
17.3% |
46.1% |
60.8% |
35.2% |
7.8% |
(10.9%) |
27.2% |
16.2% |
17.5% |
(18.6%) |
67.8% |
5.3% |
16.3% |
6.3% |
14.3% |
|
Equity Group |
12.5% |
21.5% |
30.1% |
17.2% |
7.7% |
17.2% |
44.0% |
15.5% |
10.6% |
(5.1%) |
60.9% |
(3.2%) |
23.7% |
4.2% |
10.5% |
|
DTB-K Bank |
11.5% |
17.9% |
28.6% |
8.3% |
5.7% |
15.1% |
31.0% |
17.3% |
3.3% |
(8.7%) |
62.0% |
(4.7%) |
11.3% |
6.1% |
11.4% |
|
Co-operative Bank of Kenya |
7.0% |
24.4% |
52.6% |
10.7% |
7.8% |
11.2% |
39.2% |
4.4% |
9.4% |
7.3% |
74.0% |
2.8% |
20.5% |
5.4% |
12.7% |
|
NCBA Bank |
5.0% |
25.4% |
64.5% |
(4.4%) |
(0.2%) |
7.9% |
47.5% |
11.5% |
2.4% |
(9.8%) |
58.6% |
5.9% |
23.1% |
7.1% |
12.5% |
|
Stanbic Holdings |
2.3% |
49.1% |
154.3% |
4.2% |
7.9% |
(15.1%) |
37.6% |
(6.3%) |
30.3% |
(21.0%) |
67.0% |
(2.4%) |
18.5% |
5.9% |
13.9% |
|
H1'24 Mkt Weighted Average* |
28.9% |
29.7% |
58.6% |
17.6% |
7.2% |
13.6% |
38.0% |
10.8% |
16.1% |
(9.3%) |
66.5% |
0.4% |
22.7% |
4.7% |
11.8% |
|
H1'23 Mkt Weighted Average** |
14.3% |
28.2% |
44.8% |
21.0% |
7.3% |
27.9% |
38.9% |
26.6% |
21.3% |
5.3% |
72.3% |
20.5% |
22.9% |
||
|
*Market cap weighted as at 13/09/2024 |
|||||||||||||||
|
**Market cap weighted as at 21/09/2023 |
|||||||||||||||
Key takeaways from the table include:
- The listed banks recorded a 28.9% growth in core Earnings per Share (EPS) in H1’2024, compared to the weighted average growth of 14.3% in H1’2023, an indication of sustained performance supported by an improved operating environment experienced in H1’2024 on the back of easing inflationary pressures and a strengthening Shilling. The performance during the period was mainly supported by a 17.6% weighted average growth in net interest income, coupled with a 13.6% weighted average growth in non-funded income,
- Investments in government securities investments by listed banks decreased in H1’2024, having recorded a market-weighted average decline of 9.3%, from the 5.3% growth recorded in H1’2023, with 8 of the 10 listed banks recording a decrease in government securities investments. The decreased investment in Kenya government securities was partly attributable to the increased perceived risk of default by the government on the back of the government's decision to forgo proposed tax increases through the Finance Bill 2024 and rely on expenditure cuts, significantly impacting Kenya's fiscal trajectory and financing needs,
- The listed banks’ Net loans and advances to customers recorded a marginal weighted average growth of 0.4% in H1’2024, a significant decline from the 20.5% growth recorded in H1’2023, an indication of decreased lending attributable to the elevated credit risk following the continued implementation of risk-based lending by the banks and increased borrowing costs,
- Interest income recorded a weighted average growth of 29.7% in H1’2024, compared to 28.2% in H1’2023. Similarly, interest expenses recorded a market-weighted average growth of 58.6% in H1’2024 compared to a growth of 44.8% in H1’2023. Consequently, net interest income recorded a weighted average growth of 17.6% in H1’2024, albeit lower than the 21.0% growth recorded in H1’2023,
- Notably, non-funded income growth softened during the quarter, as evidenced by non-funded income weighted average growth of 13.6% in H1’2024 compared to a weighted average growth of 27.9% in H1’2023. The performance was largely attributable to the decrease in foreign exchange income recorded by the banks during the period as a result of decreased dollar demand in the country. Additionally, listed banks recorded a weighted average growth of 10.8% in total fees and commissions income in H1’2024 compared to a weighted growth of 26.6% in H1’2023, and,
- The listed banks recorded a 22.7% weighted average growth on return on average equity (RoaE), 0.2% points lower than the 22.9% growth registered in H1’2023. Additionally, the entire banking sector’s Return On Equity (ROE) stood at 0%as of June 2024, a 1.8% points decrease from the 27.8% recorded in March 2024. On a global level, the Kenyan banking sector continues to record high profitability compared to other economies in the world, as highlighted in the chart below:
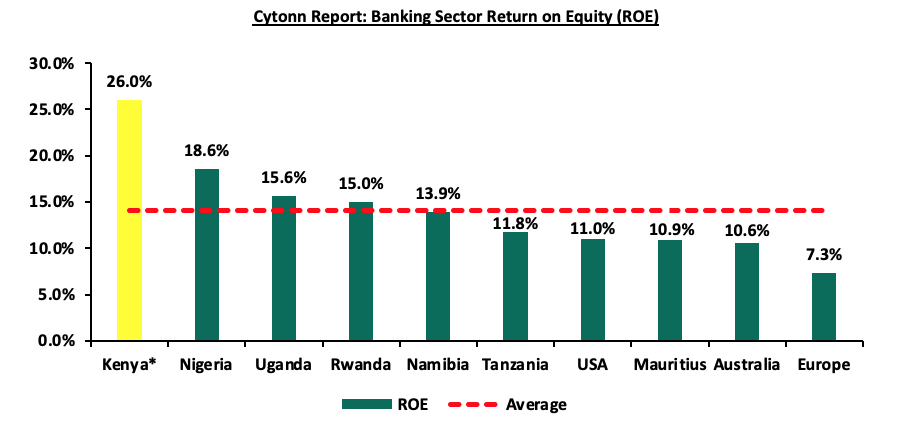
Source: Credit Officer Survey Report June 2024, Cytonn Research
* Figure as of June 2024
Section III: The Focus Areas of the Banking Sector Players Going Forward:
The banking sector continues to remain resilient despite the tough operating environment as evidenced by the increase in their profitability, with the Core Earnings Per Share (EPS) growing by 29.3%, as banks continued to implement their revenue diversification strategies. Notably, 8 out of the 10 listed banks recorded a growth in their Non-funded income in H1’2024.Additionally, we believe that the possibly improved business environment occasioned by ease in inflationary pressures, an ease in the monetary policy following a decrease in the CBR, and a stronger Shilling, will see banks start to decrease their provisioning to cushion themselves from credit risk. To note, growth in general provisions for the listed banks recorded a reduced weighted average growth of 19.1% in H1’2024, compared to a growth of 20.3% in FY’2023. Based on the current operating environment, we believe the future performance of the banking sector will be shaped by the following key factors:
- Growth in Interest income: Going forward, we expect interest income growth to remain a key driver in the banking industry, evidenced by the 17.5% growth recorded in H1’2024, albeit lower than the 21.0% growth recorded in H1’2023, partly on the back of continued high borrowing costs. Furthermore, the continued approval of banks’ risk-based lending models will enable banks to effectively price their risk, expand loan books, and consequently increase their interest income,
- Revenue Diversification: In H1’2024, non-funded income (NFI) recorded a 13.7% weighted average growth, slower than the 27.9% weighted growth in H1’2023 with 8 out of the 10 listed Banks recording an increase in their non-funded income. As a result of the reduced growth in non-funded income, the weighted average contribution of NFI to total operating income came in at 38.1% in H1’2024, 0.8% points lower than the 38.9% weighted average growth contribution recorded in H1’2023. As such, there exists an opportunity for the sector to further increase NFI contributions to revenue given the continuous adoption of digitization,
- Growth in Loans and Advance: While 5 of the listed banks, such as NCBA and I&M Group experienced positive loan growth of 5.9% and 5.3% respectively, 5 out of the 10 listed banks recorded negative growth in loans and advances to customers. To drive loan growth, banks must leverage opportunities such as risk-based lending models, improved customer segmentation, and expanding access to credit in underserved sectors, and,
- Regional Expansion and Further Consolidation: Consolidation remains a key theme going forward with the current environment offering opportunities for larger banks with a sufficient capital base to expand and take advantage of the market's low valuations, as well as further consolidate out smaller and weaker banks. Notably, the majority of the bigger banks have continued to cushion over unsystematic risks specific to the local market by expanding their operations into other African nations. Banks such as KCB and Equity Group have been leveraging on expansion and consolidation, which has largely contributed to their increased asset base as well as earnings growth. As aforementioned, Equity Group recently announced the completion of the acquisition of Compagnie Générale de Banque (Cogebanque) Plc, marking a significant milestone in its regional expansion strategy. Additionally, the increased capital requirements imposed on banks have further accelerated consolidation, as only well-capitalized banks are able to meet these thresholds while pursuing expansion opportunities. As such, we expect to see a continued expansion trend aimed at revenue optimization.
Section IV: Brief Summary and Ranking of the Listed Banks:
As per our analysis of the banking sector from a franchise value and a future growth opportunity perspective, we carried out a comprehensive ranking of the listed banks. For the franchise value ranking, we included the earnings and growth metrics as well as the operating metrics shown in the table below in order to carry out a comprehensive review of the banks:
|
Cytonn Report: Listed Banks Earnings, Growth, and Operating Metrics H1’2024 |
||||||||
|
Bank |
Loan to Deposit Ratio |
Cost to Income (With LLP) |
Return on Average Capital Employed |
Deposits/ Branch (bn) |
Gross NPL Ratio |
NPL Coverage |
Tangible Common Ratio |
Non Funded Income/Revenue |
|
Absa Bank |
89.5% |
52.0% |
27.5% |
4.2 |
11.5% |
67.7% |
15.0% |
27.7% |
|
HF Group |
84.2% |
86.2% |
5.2% |
2.0 |
24.2% |
75.6% |
14.2% |
35.0% |
|
Coop Bank |
74.0% |
54.2% |
20.5% |
2.5 |
16.7% |
59.5% |
17.0% |
39.2% |
|
KCB Group |
69.2% |
59.7% |
22.7% |
2.6 |
18.1% |
65.9% |
11.3% |
35.2% |
|
I&M Holdings |
67.8% |
63.0% |
16.3% |
4.3 |
11.4% |
57.9% |
14.2% |
27.2% |
|
Stanbic Bank |
67.0% |
50.1% |
18.5% |
11.9 |
9.5% |
75.0% |
12.3% |
37.6% |
|
DTBK |
62.0% |
69.2% |
11.3% |
2.8 |
13.5% |
44.4% |
12.5% |
29.7% |
|
Equity Bank |
60.9% |
61.7% |
23.7% |
3.2 |
13.9% |
58.8% |
11.3% |
44.0% |
|
NCBA Group |
58.6% |
61.2% |
23.1% |
4.6 |
12.2% |
59.8% |
13.9% |
47.5% |
|
SCBK |
54.0% |
44.4% |
28.4% |
11.1 |
8.4% |
85.1% |
15.8% |
36.6% |
|
Weighted Average H1'2024 |
66.8% |
56.7% |
23.0% |
4.9 |
13.4% |
65.1% |
13.4% |
38.0% |
|
Market cap weighted as at 13/09/2024 |
||||||||
The overall ranking was based on a weighted average ranking of Franchise value (accounting for 60.0%) and intrinsic value (accounting for 40.0%). The Intrinsic Valuation is computed through a combination of valuation techniques, with a weighting of 40.0% on Discounted Cash-flow Methods, 35.0% on Residual Income, and 25.0% on Relative Valuation, while the Franchise ranking is based on a bank’s operating metrics, meant to assess efficiency, asset quality, diversification, and profitability, among other metrics. The overall H1’2024 ranking is as shown in the table below:
|
Cytonn Report: Listed Banks H1’2024 Rankings |
|||||
|
Bank |
Franchise Value Rank |
Intrinsic Value Rank |
Weighted Rank Score |
H1'2023 Rank |
H1'2024 Rank |
|
Absa Bank |
3 |
3 |
3.0 |
1 |
1 |
|
Stanbic Bank |
2 |
6 |
3.6 |
5 |
2 |
|
SCBK |
1 |
8 |
3.8 |
9 |
3 |
|
Coop Bank |
4 |
4 |
4.0 |
4 |
4 |
|
NCBA Group |
5 |
5 |
5.0 |
7 |
5 |
|
Equity Bank |
8 |
1 |
5.2 |
6 |
6 |
|
DTBK |
9 |
2 |
6.2 |
8 |
7 |
|
I&M Holdings |
6 |
7 |
6.4 |
2 |
8 |
|
KCB Group |
7 |
9 |
7.8 |
3 |
9 |
|
HF Group |
10 |
10 |
10.0 |
10 |
10 |
Major Take-outs from the H1’2024 Ranking are:
- ABSA Bank retained position 1 in H1’2024, similar to H1’2023, mainly supported by strong franchise and intrinsic value score, attributable to improvement in the bank’s management quality and earning quality, with the cost-to-income ratio with LLPs declining by 3.9% points to 52.0% in H1’2024, from 55.9% in H1’2023, and cost-to-income without LLPs declined by 1.9% points to 35.8% in H1’2024, from 37.0% in H1’2023. Notably, the bank’s Net Interest Margin increased by 1.1% points to 10.1% in H1’2024 from 9.0% in H1’2023,
- Standard Chartered Bank climbed up 6 places to rank at position 3 in H1’2024, up from position 9 in H1’2023 supported by significant improvement in franchise value score. Its performance was driven by a 4.5% points growth in return on average equity to 28.4% in H1’2024 from 23.9% in H1’2023. Additionally, the cost-to-income ratio with LLPs declined by 9.4% points to 44.4% in H1’2024, from 53.8% in H1’2023, while the cost-to-income ratio without LLPs declined by 5.6% points to 38.5% in H1’2024, from 44.1% in H1’2023. Notably, the bank’s Net Interest Margin increased by 1.4% points to 9.5% in H1’2024 from 8.0% in H1’2023,
- Stanbic Bank also climbed up 3 places to rank at position 2 in H1’2024, up from position 5 in H1’2023 supported by significant improvement in both franchise and intrinsic value score. Its performance was driven by a 3.4%-points decline in the cost-to-income ratio with LLPs to 50.1% in H1’2024, from 53.5% in H1’2023, while the cost-to-income ratio without LLPs declined by 1.2% points to 40.4% in H1’2024, from 41.6% in H1’2023. Notably, the bank’s Net Interest Margin increased by 0.5% points to 7.9% in H1’2024 from 7.4% in H1’2023, and,
- KCB Group slid 6 places to rank at position 9 in H1’2024, down from position 3 in H1’2023, attributable to deterioration in asset quality with the gross NPL ratio increasing by 0.9% points to 18.1% in H1’2024, up from 17.2% registered in H1’2023. The bank’s performance was however supported by a 9.5%-points decline in the cost-to-income ratio with LLPs to 59.7% in H1’2024, from 69.3% in H1’2023 coupled with a 0.5%-points increase in Net Interest Margin to 7.2% in H1’2024 from the 6.7% recorded in H1’2023.
For more information, see our Cytonn H1’2024 Listed Banking Sector Review full report.
Disclaimer: The views expressed in this publication are those of the writers where particulars are not warranted. This publication is meant for general information only and is not a warranty, representation, advice or solicitation of any nature. Readers are advised in all circumstances to seek the advice of a registered investment advisor.

- Talk to us
- Kenya
- P.O Box 20695 - 00200, Nairobi, Kenya
- Cell +254709101200
- Tel +254709101200
- WhatsApp +254741676635
- United States
- +254709101200
- DOWNLOAD OUR APP
-


- Kenya
- 8th Floor, Pinetree Plaza, Kaburu Drive, Ngong Road, Nairobi, Kenya
- USA
- Suite 1150, 1775 Eye Street NW, USA, Washington DC 20006, USA
- Investments
- High Yield
- Private Equity
- Real Estate
- Real Estate
- RiverRun Estates
- Cytonn Towers
- The Ridge
- Taraji Heights
- The Alma