Nairobi Metropolitan Area Residential Report 2026, & Cytonn Weekly #23.2026
By Research Team, Jun 14, 2026
Executive Summary
Fixed Income
During the week, T-bills were oversubscribed for the second consecutive week, with the overall subscription rate coming in at 163.9%, lower than the subscription rate of 227.4%, recorded the previous week. Investors’ preference for the shorter 91-day paper persisted, with the paper receiving bids worth 26.9 bn against the offered Kshs 4.0 bn, translating to a subscription rate of 820.7%, remaining relatively unchanged from the subscription rate of 820.7%, recorded the previous week. The subscription rate for the 182-day paper decreased to 43.8% from 65.3% recorded the previous week, while that of the 364-day paper decreased significantly to 21.4% from 153.3% recorded the previous week. The government accepted a total of Kshs 32.6 bn worth of bids out of Kshs 39.3 bn bids received, translating to an acceptance rate of 82.9%. The yields on the government papers showed an upward trajectory with the yields on the 91-day paper increasing the most by 0.2 bps to 8.7% from the 8.6% recorded the previous week. The yields on the 364-day paper also increased by 0.1 bps to 8.9% from the 8.8% recorded the previous week, while the yields on the 182-day paper increased by 0.1 bps to 8.6% from the 8.5% recorded the previous week;
Equities
During the week, the equities market was on a downward trajectory, with NASI losing by 0.8%, NSE 10 by 0.7%, NSE 25 by 0.6%, and NSE 20 by 0.4%, taking the YTD performance to gains of 12.8%, 12.4%, 11.4% and 10.7% for NSE 20, NSE 25, NASI and NSE 10 respectively. The week-on-week equities market performance was mainly driven by losses recorded by large cap stocks such as Absa, Equity and KCB of 2.9%, 2.3% and 2.1% respectively. However, the performance was supported by gains recorded by large cap stocks such as EABL, Stanbic and Standard Chartered of 4.0%, 2.6% and 1.6% respectively;
During the week, the banking sector index decreased by 0.9% to 238.0 from 239.4 recorded the previous week. This is attributable to losses recorded by large cap stocks such Absa, Equity and KCB of 2.9%, 2.3% and 2.1% respectively. However, the performance was uplifted by gains recorded by large cap stocks such as Stanbic and Standard Chartered of 2.6% and 1.6% respectively;
Real Estate
During the week, Shelter Afrique Development Bank (ShafDB) unveiled a new brand identity during its 45th Annual General Meeting in Rabat, Morocco, marking a significant milestone in its transition from a traditional housing financier into a multilateral development bank;
During the week, the Government sought to strengthen enforcement of the Affordable Housing Levy after revealing that more than Kshs 100.0 bn in employee deductions may not have been remitted to the Affordable Housing Fund despite being collected by employers;
During the week, the National Government, through Treasury Cabinet Secretary John Mbadi, launched the construction of the Kanyawanga-Kwoyo-Dede-Rapogi-Awendo Road and the Othoo-Got-Kachola Road in Migori County during the week, reaffirming its commitment to expanding infrastructure development across the Nyanza region;
The FY'2026/27 Budget signaled a notable shift in the government's approach to infrastructure development, with greater emphasis being placed on mobilizing private sector capital to fund large scale projects;
On the Unquoted Securities Platform Acorn D-REIT and I-REIT traded at Kshs 29.6 and Kshs 23.8 per unit, respectively, as per the last updated data on 5th June 2026. The performance represented a 48.0% and 18.8% gain for the D-REIT and I-REIT, respectively, from the Kshs 20.0 inception price. Additionally, ILAM Fahari I-REIT traded at Kshs 13.8 per share as of 5th June 2026, representing a 31.0% loss from the Kshs 20.0 inception price;
Digital Payments
During the week, Mastercard Incorporated expanded communication around its always-on stablecoin settlement infrastructure, enabling banks and fintech partners to settle transactions using regulated stablecoins 24 hours a day, including weekends and holidays. The infrastructure supports multiple stablecoins including USDC, PYUSD, RLUSD, USDG, and SoFiUSD across blockchain networks such as Ethereum and Solana. This marks a significant shift from traditional banking-hour settlement cycles and demonstrates Mastercard’s growing commitment to blockchain integration within its core payments infrastructure;
PayPal Holdings, Inc., alongside partner Hey Savi, launched what is being positioned as the United Kingdom’s first agentic commerce platform, enabling AI-driven shopping experiences integrated directly with in-app checkout capabilities. The platform allows users to discover products, receive AI-assisted recommendations, and complete purchases seamlessly within the application environment, reducing friction in the customer journey. Retail group Debenhams became the first commercial partner to adopt the platform;
The significance lies in the rapid convergence between artificial intelligence and digital commerce infrastructure. Payments providers are increasingly competing not only on transaction processing but also on ownership of the broader consumer purchasing journey. For the digital payments ecosystem, PayPal’s move signals an industry-wide shift toward embedded payments where discovery, decision-making, and checkout are integrated into AI-powered commerce experiences, potentially reducing reliance on traditional standalone checkout systems;
The digital payment stocks we track (AXP, Visa, Mastercard, Circle, Block and Paypal) are currently trading at an average P/E of 25.4x, implying that investors are pricing in strong future earnings growth expectations and are willing to pay a significant premium for current earnings, which may also suggest that valuations may be stretched relative to near-term fundamentals;
Focus of the Week
This week, we update our previous research with the Nairobi Metropolitan Area (NMA) Residential Report 2026 titled ‘Unlocking Value in a Shifting Residential Market’ by analyzing the residential sector's performance in the region in terms of price appreciation, rental yields, and market uptake, based on the coverage of 35 regions within the Nairobi Metropolis.
Investment Updates:
- Weekly Rates: Cytonn Money Market Fund closed the week at a yield of 12.05% p.a. To invest, dial *809# or download the Cytonn App from Google Play store here or from the Appstore here.
- We continue to offer Wealth Management Training every Tuesday, from 7:00 pm to 8:00 pm. The training aims to grow financial literacy among the general public. To register for any of our Wealth Management Trainings, click here. If interested in our Private Wealth Management Training for your employees or investment group, please get in touch with us through wmt@cytonn.com.
- Cytonn Insurance Agency acts as an intermediary for those looking to secure their assets and loved ones’ future through insurance namely; Motor, Medical, Life, Property, WIBA, Credit and Fire and Burglary insurance covers. For assistance, get in touch with us through insuranceagency@cytonn.com.
- Cytonn Asset Managers Limited (CAML) continues to offer pension products to meet the needs of both individual clients who want to save for their retirement during their working years and Institutional clients that want to contribute on behalf of their employees to help them build their retirement pot. To more about our pension schemes, kindly get in touch with us through pensions@cytonn.com.
Hospitality Updates:
- We currently have promotions for Staycations. Visit cysuites.com/offers for details or email us at sales@cysuites.com.
Money Markets, T-Bills Primary Auction:
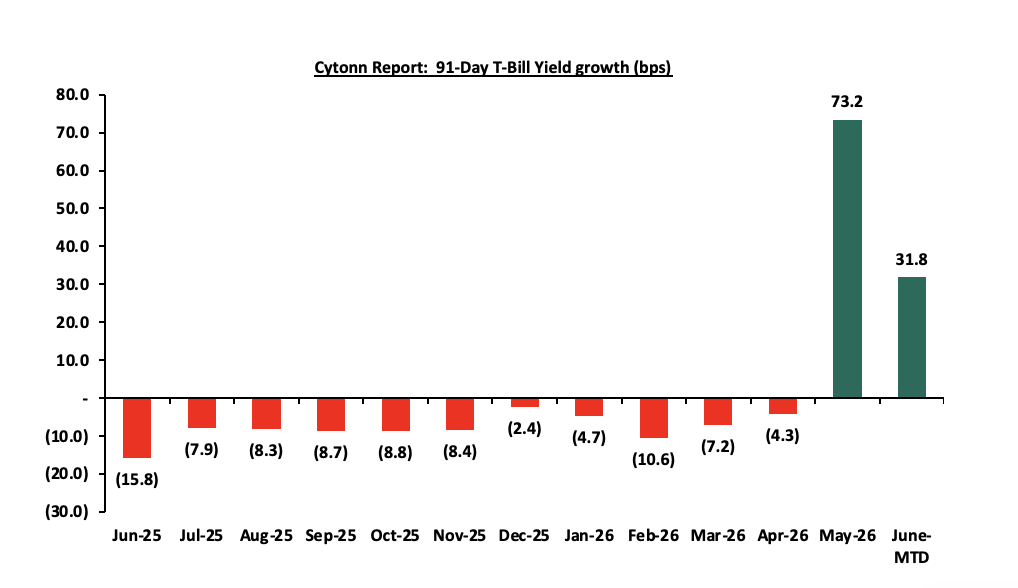
This week, T-bills were oversubscribed for the second consecutive week, with the overall subscription rate coming in at 163.9%, lower than the subscription rate of 227.4%, recorded the previous week. Investors’ preference for the shorter 91-day paper persisted, with the paper receiving bids worth 26.9 bn against the offered Kshs 4.0 bn, translating to a subscription rate of 820.7%, remaining relatively unchanged from the subscription rate of 820.7%, recorded the previous week. The subscription rate for the 182-day paper decreased to 43.8% from 65.3% recorded the previous week, while that of the 364-day paper decreased significantly to 21.4% from 153.3% recorded the previous week. The government accepted a total of Kshs 32.6 bn worth of bids out of Kshs 39.3 bn bids received, translating to an acceptance rate of 82.9%. The yields on the government papers showed an upward trajectory with the yields on the 91-day paper increasing the most by 0.2 bps to 8.7% from the 8.6% recorded the previous week. The yields on the 364-day paper also increased by 0.1 bps to 8.9% from the 8.8% recorded the previous week, while the yields on the 182-day paper increased by 0.1 bps to 8.6% from the 8.5% recorded the previous week. The chart below shows the yield growth rate for the 91-day paper from June 2025 to date:
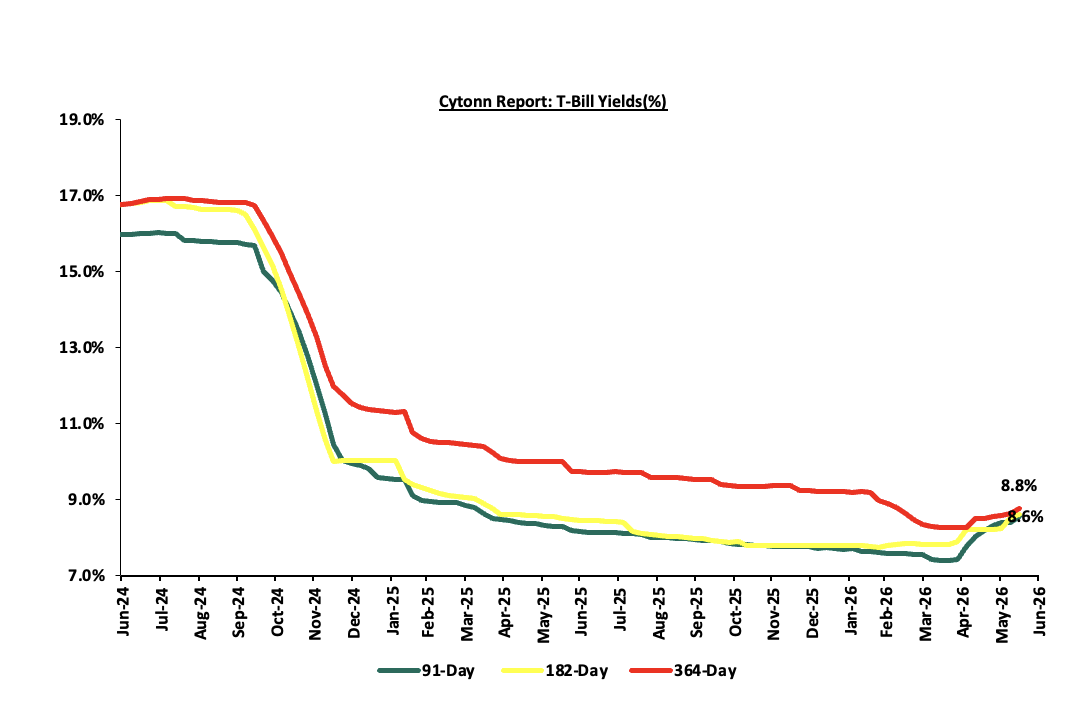
The charts below show the performance of the 91-day, 182-day and 364-day papers from June 2024 to June 2026:
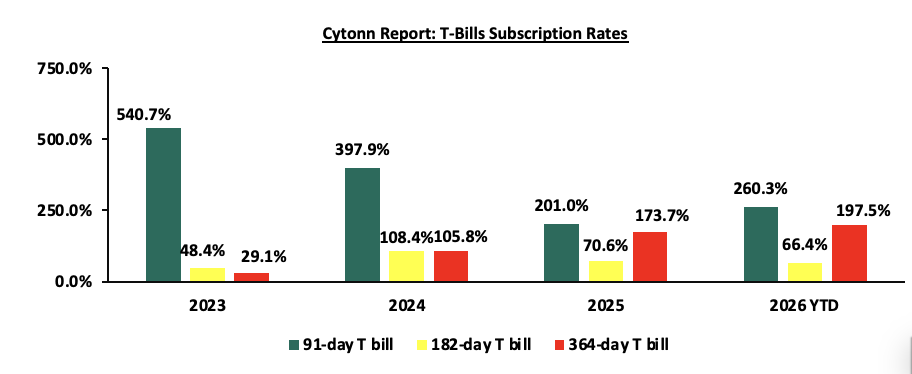
The chart below compares the overall average T-bill subscription rates obtained in 2023,2024, 2025 and 2026 Year-to-date (YTD):
Money Market Performance:
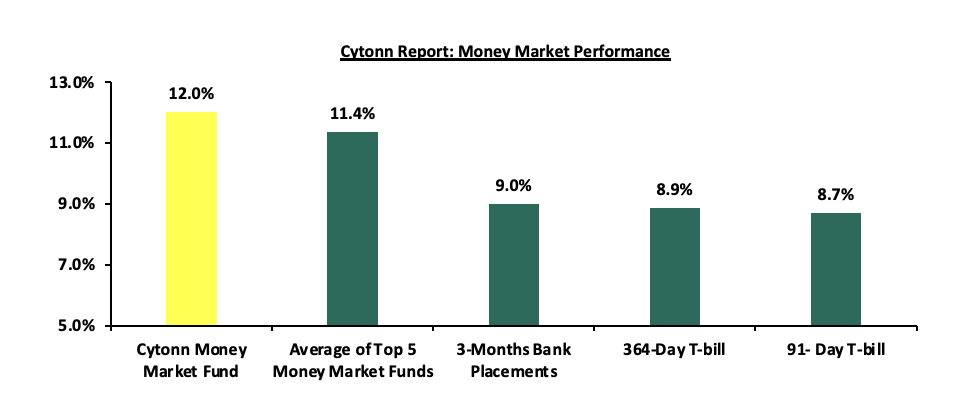
In the money markets, 3-month bank placements ended the week at 9.0% (based on what we have been offered by various banks). The yields on the 91-day paper increased by 0.2 bps to 8.7% from the 8.6% recorded the previous week, while the yields on the 364-day paper increased by 0.1 bps to 8.9% from the 8.8% recorded the previous week and the yield on the Cytonn Money Market Fund remained unchanged from the 12.0% recorded the previous week, while the average yields on the Top 5 Money Market Funds decreased by 0.1 bps to 11.4% from 11.5% recorded in the previous week.
The table below shows the Money Market Fund Yields for Kenyan Fund Managers as published on 12th June 2026:
|
Money Market Fund Yield for Fund Managers as published on 12th June 2026 |
||
|
Rank |
Fund Manager |
Effective Annual Rate |
|
1 |
Nabo Africa Money Market Fund |
12.77% |
|
2 |
Cytonn Money Market Fund ( Dial *809# or download Cytonn App) |
12.00% |
|
3 |
Etica Money Market Fund |
10.88% |
|
4 |
Lofty-Corban Money Market Fund |
10.65% |
|
5 |
Arvocap Money Market Fund |
10.55% |
|
6 |
Enwealth Money Market Fund |
10.52% |
|
7 |
Madison Money Market Fund |
10.49% |
|
8 |
Ndovu Money Market Fund |
10.48% |
|
9 |
Faulu Money Market Fund |
10.42% |
|
10 |
Kuza Money Market fund |
10.38% |
|
11 |
Old Mutual Money Market Fund |
10.13% |
|
12 |
Gulfcap Money Market Fund |
10.11% |
|
13 |
Orient Kasha Money Market Fund |
10.08% |
|
14 |
Jubilee Money Market Fund |
9.98% |
|
15 |
British-American Money Market Fund |
9.73% |
|
16 |
GenAfrica Money Market Fund |
9.47% |
|
17 |
Apollo Money Market Fund |
9.14% |
|
18 |
Dry Associates Money Market Fund |
9.13% |
|
19 |
SanlamAllianz Money Market Fund |
9.06% |
|
20 |
Genghis Money Market Fund |
8.88% |
|
21 |
KCB Money Market Fund |
8.60% |
|
22 |
CIC Money Market Fund |
8.43% |
|
23 |
CPF Money Market Fund |
8.13% |
|
24 |
Mali Money Market Fund |
8.00% |
|
25 |
Co-op Money Market Fund |
7.91% |
|
26 |
Mayfair Money Market Fund |
7.67% |
|
27 |
ICEA Lion Money Market Fund |
7.54% |
|
28 |
Absa Shilling Money Market Fund |
7.23% |
|
29 |
Ziidi Money Market Fund |
6.02% |
|
30 |
AA Kenya Shillings Fund |
5.95% |
|
31 |
Stanbic Money Market Fund |
5.27% |
|
32 |
Equity Money Market Fund |
5.19% |
Source: Business Daily
Liquidity:
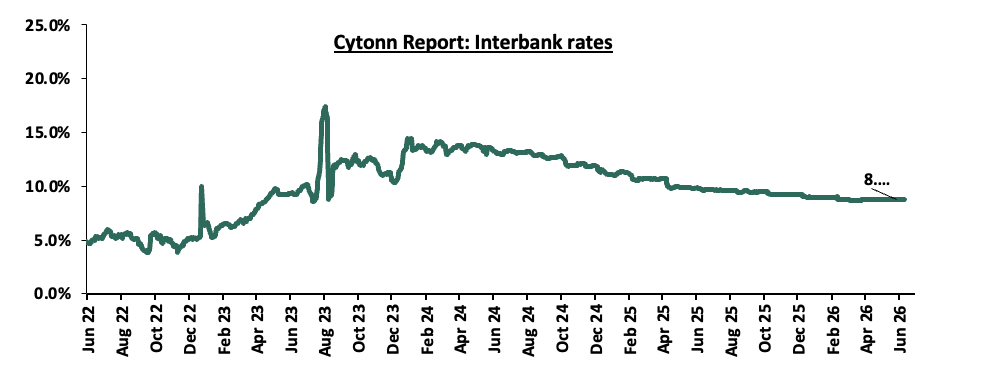
During the week, liquidity in the money markets eased, with the average interbank rate decreasing by 0.1 bps, to 8.7% from the 8.8% recorded the previous week, partly attributable to government payments that offset tax remittances. The average interbank volumes traded increased by 2.2% to Kshs 11.0 bn from Kshs 10.7 bn recorded the previous week. The chart below shows the interbank rates in the market over the years:
Kenya Eurobonds:
During the week, the yields on the Eurobonds were on an upward trajectory with the yield on the 7-year Eurobond issued in 2024 increasing the most by 21.0 bps to 7.4% from 7.2% recorded the previous week. The table below shows the summary performance of the Kenyan Eurobonds as of 11th June 2026:
|
|
2018 |
2019 |
2021 |
2024 |
|
|
Tenor |
10-year issue |
30-year issue |
12-year issue |
13-year issue |
7-year issue |
|
Amount Issued (USD) |
1.0 bn |
1.0 bn |
1.2 bn |
1.0 bn |
1.5 bn |
|
Years to Maturity |
2.5 |
22.5 |
6.7 |
8.8 |
5.5 |
|
Yields at Issue |
7.3% |
8.3% |
7.9% |
6.2% |
10.4% |
|
2-Jan-26 |
6.1% |
8.8% |
7.2% |
7.8% |
7.1% |
|
1-Jun-26 |
7.1% |
8.9% |
7.7% |
8.2% |
7.3% |
|
4-Jun-26 |
7.0% |
8.9% |
7.6% |
8.2% |
7.2% |
|
5-Jun-26 |
7.2% |
8.9% |
7.7% |
8.2% |
7.3% |
|
8-Jun-26 |
7.0% |
9.0% |
7.7% |
8.3% |
7.3% |
|
9-Jun-26 |
7.2% |
9.0% |
7.8% |
8.3% |
7.4% |
|
10-Jun-26 |
7.2% |
9.1% |
7.9% |
8.4% |
7.6% |
|
11-Jun-26 |
7.1% |
9.0% |
7.8% |
8.4% |
7.4% |
|
Weekly Change |
0.1% |
0.2% |
0.2% |
0.2% |
0.2% |
|
MTD Change |
0.2% |
0.2% |
0.2% |
0.2% |
0.3% |
|
YTD Change |
1.1% |
0.3% |
0.7% |
0.6% |
0.5% |
Source: Central Bank of Kenya (CBK) and National Treasury
Kenya Shilling:
During the week, the Kenya Shilling depreciated by 0.3 bps against the US Dollar, to Kshs 129.6 from the Kshs 129.3 recorded the previous week. On a year-to-date basis, the shilling has depreciated by 47.3 bps against the dollar, as compared to the 20.9 bps appreciation recorded in 2025.
We expect the shilling to be supported by:
-
Diaspora remittances standing at a cumulative USD 5,053.5 mn in the twelve months to April 2026, 1.1% higher than the USD 4,997.2 mn recorded over the same period in 2025. These have continued to cushion the shilling against further depreciation. In the April 2026 diaspora remittances figures, North America remained the largest source of remittances to Kenya accounting for 52.2% in the period, and,
-
Tourism inflows, which strengthened significantly. Tourism receipts reached Kshs 560.0 bn in 2025, up from Kshs 452.2 bn in 2024, representing a 23.9% increase, supported by improved international arrivals through the country’s major airports, and,
-
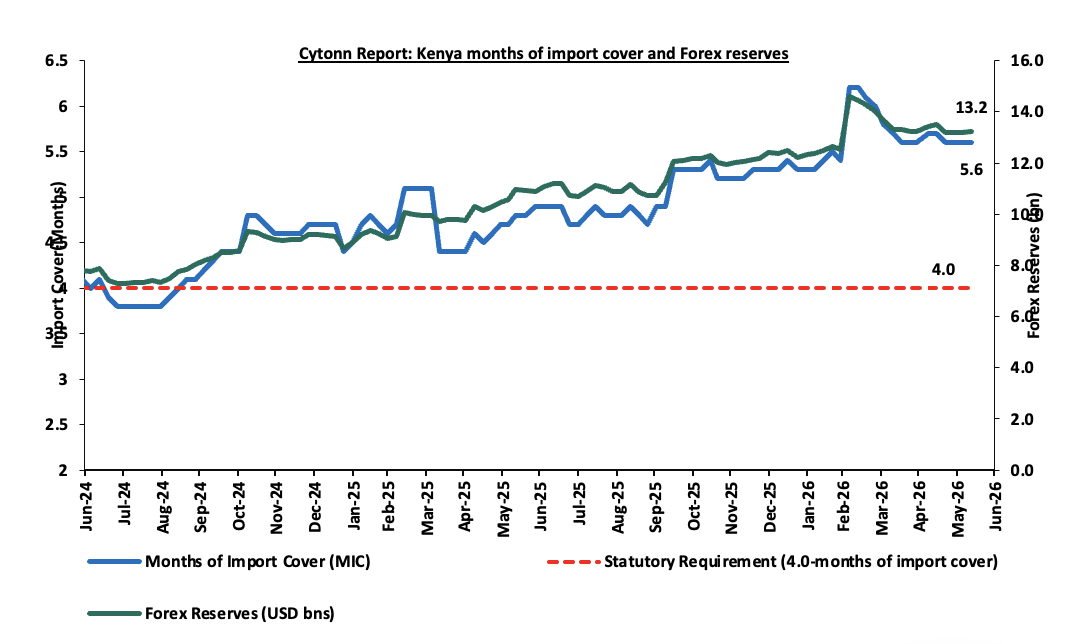
Improved forex reserves currently at USD 13.2 bn (equivalent to 5.6-months of import cover), which is above the statutory requirement of maintaining at least 4.0-months of import cover and above the EAC region’s convergence criteria of 4.5-months of import cover.
The shilling is however expected to remain under pressure in 2026 as a result of:
-
An ever-present current account deficit which came at 2.6% of GDP in the twelve months to April 2026, and,
-
The need for government debt servicing, continues to put pressure on forex reserves given that 52.0% of Kenya’s external debt is US Dollar-denominated as of September 2025.
-
Rising geopolitical tensions in the Middle East, which could exert pressure on the shilling through higher global oil prices and increased uncertainty in international markets. Given that Kenya is a net importer of petroleum products, any sustained increase in oil prices would widen the import bill, increase demand for US Dollars, and consequently put depreciation pressure on the shilling
Kenya’s forex reserves remained relatively unchanged at USD 13.2 bn recorded the previous week, equivalent to 5.6 months of import cover, and above the statutory requirement of maintaining at least 4.0-months of import cover. The chart below summarizes the evolution of Kenya's months of import cover over the years:
Weekly Highlights
-
June 2026 Monetary Policy Committee (MPC) Meeting Highlight
The Monetary Policy Committee met on 9th June, 2026, to review the outcome of its previous policy decisions and decided to maintain the CBR rate at 8.75%, to remain unchanged from April 2026 which was in line with our projection of MPC to maintain the CBR at 8.75%. Notably, inflation rates remain anchored though there was a jump and remained within the CBK preferred range of 2.5%-7.5% for the thirty-third consecutive month, with an increase of 1.1% points to 6.7% in May 2026, from 5.6% in April 2026. Key to note, the MPC had maintained the CBR rate to 8.75% in the previous meeting in April 2026 recorded in February 2026. Below are some of the key highlights from the April meeting:
-
The overall inflation increased by 1.1% points to 6.7% in May 2026, from 5.6% in April 2026, remaining below the preferred CBK range of 2.5%-7.5%, albeit above the midpoint of the range. Core inflation increased to 3.2% in May 2026, from 2.8% in April 2026 mainly driven by higher inflation for transport items, arising from higher fuel prices. However, Processed food inflation remained relatively stable, supported by lower prices of sugar and maize products. Non-core inflation increased to 16.0% in May 2026, from 13.4% in April 2026, driven by higher energy prices, particularly fuel and gas prices and elevated prices of some vegetables, particularly tomatoes and cabbages. Overall inflation is expected to remain within the target range in the near term, assuming a de-escalation of the conflict in the Middle East. This will be supported by appropriate monetary policy actions, government interventions including subsidies and temporary reduction of VAT on fuel, expected stability in food prices attributable to favorable weather conditions and continued exchange rate stability.
-
The growth of the Kenyan economy moderated in 2025, with real GDP growth at 4.6%, as compared to 4.7% in 2024 driven by a slowdown in growth of the agriculture and services sectors. However, the growth was supported by a strong recovery in the industrial sector, particularly the construction sub-sector. Leading indicators of economic activity point to resilient performance in the first quarter of 2026. The growth of the economy is projected at 4.9% compared to the previous projection of 5.3% mainly reflecting the continued uncertainty, particularly a prolonged conflict in the Middle East and elevated trade policy uncertainties.
-
The current account deficit is estimated at 2.6% of GDP in the 12 months to April 2026 as compared to the 1.7% of GDP in the same period in 2025, due to a higher trade deficit and lower secondary income transfers as a share of GDP. Goods exports increased by 4.2%, driven by horticulture, tea, coffee, food and live animals, and machinery and transport equipment. Goods imports rose by 8.5%, reflecting higher imports of food, intermediate and capital goods and mineral fuels. Services receipts increased by 4.8%, due to lower receipts from travel services, while diaspora remittances increased by 1.1%. The current account deficit is projected at 3.0% of GDP in 2026 compared to the previous projection of 2.1%, reflecting the emerging risks of the Middle East, including higher international oil prices, lower receipts from services, slower growth in remittance inflows and reduced exports. Currently, the CBK foreign exchange reserves stand at USD 13,203 mn (5.6 months of import cover) and continue to provide adequate cover and a buffer against short-term domestic and external shocks.
-
The banking sector remains stable and resilient, with strong liquidity and capital adequacy ratios. The ratio of gross non-performing loans (NPLs) to gross loans stood at 15.3% in May 2026 down from 15.6% in February 2026, and 17.6% in August 2025. Decreases in NPLs were noted in the personal and household, transport and communications, and mining and quarrying sectors. Banks have continued to make adequate provisions for the NPLs.
-
The CEOs Survey and Market Perceptions Survey conducted in March 2026 revealed sustained optimism about business activity and economic growth prospects for the next 12 months. The optimism was attributed to to expected favorable weather conditions which are expected to support agriculture, increased infrastructure spending, increased digital innovations, stable exchange rate, and improved private sector credit growth. Nevertheless, respondents expressed concerns about increased global uncertainties attributed to the conflict in the Middle East, high cost of doing business, and low consumer demand
-
A majority of respondents to the May 2026 Agriculture Sector Survey expect higher energy prices arising from elevated international oil prices attributed to the conflict in the Middle East, to contribute to some upward pressure on inflation rate in the near term. However, respondents expect inflation to remain within the target range in the near term, supported by stable food prices attributed to favorable weather conditions, and stability in the exchange rate.
-
The conflict in the Middle East has disrupted global supply chains and led to a sharp increase in energy prices and transportation costs, resulting in higher inflation and moderated global growth prospects. Global growth is projected at 3.1 percent in 2026, down from 3.4 percent in 2025, due to effects of higher inflation and reduced demand arising from higher energy prices and elevated uncertainties. Additionally, elevated trade policy uncertainty and the Russia-Ukraine conflict remain key risks to growth
-
Global inflation is expected to increase in to 4.4% 2026 from 4.1% in 2025 on account of higher energy prices and transport costs attributed to supply chain disruptions from the Middle East crisis. Inflation rates in most major economies have increased and remained above their respective targets in the recent months, due to elevated energy prices and stickiness in core inflation. Central banks in the major economies have kept their policy rates unchanged as they assess the impact of the conflict in the Middle East on their inflation and growth outlooks. Food inflation has increased modestly, mainly driven by higher inflation rates for edible oils and cereals prices.
-
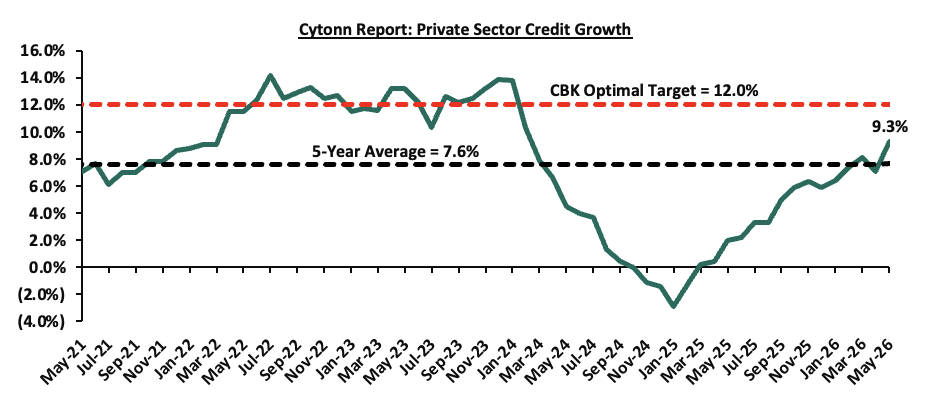
Growth in commercial banks’ lending to the private sector continued to improve and stood at 9.3% in May 2026 compared to 7.1% in April 2026 and (2.9%) in January 2025. Growth in credit to key sectors of the economy, particularly building and construction, trade, agriculture and consumer durables, remained strong, reflecting improved demand for credit in line with the declining lending interest rates. Average commercial banks’ lending rates stood at 14.5% in May 2026, down from 14.7% in April 2026 and 17.2% in November 2024.
-
The Committee noted the ongoing implementation of the FY2025/26 Supplementary Budget I by the Government, and the planned fiscal consolidation strategy to reduce debt vulnerabilities over the medium term.
The MPC noted that maintaining the Central Bank Rate (CBR) at 8.75% remains appropriate to keep inflation expectations anchored within the target range of 2.5%-7.5% and support exchange rate stability. The Committee emphasized that it will closely monitor the evolution of global oil prices and any second-round effects on inflation, as well as other developments in the global and domestic economies, and remains ready to take further action as necessary in line with its mandate. Going forward, we expect the MPC to adopt a more cautious approach to rate adjustments in the coming meetings in a bid to anchoring inflation, supporting exchange rate stability and private sector credit growth, while monitoring the effects of the Middle East conflict. The next MPC meeting is scheduled for August 2026.
- Fuel Prices effective 15th June – 14th July 2026
During the week, The Energy and Petroleum Regulatory Authority (EPRA) released their monthly statement on the maximum retail fuel prices in Kenya, effective from 15th June 2026 to 14th July 2026. Notably, the maximum allowed prices for Super Petrol, and Diesel decreased by Kshs 0.2, and Kshs 10.0 per litre to Kshs 214.0, and Kshs 222.9 per litre from Kshs 214.3 and Kshs 232.9 per litre respectively in May 2026. On the other hand, Kerosene remain unchanged at Kshs 152.8 per litre.
Other key take-outs from the performance include,
- The average landing cost per cubic metre of Diesel increased by 0.2% to USD 1,294.7 in May 2026 from USD 1,292.0 in April 2026, However, for Super petrol and kerosene decreased by 0.6% and 0.3% to USD 901.2 and USD 1,328.4 in May 2026 from USD 906.2 and 1,332.7 in April 2026.
- The Kenyan Shilling depreciated against the US Dollar by 27.9 bps to Kshs 129.6 in May from 129.2 recorded in April 2026
- The Authority calculated the prices based on 8.0% Value Added Tax (VAT) on petroleum products, aimed at cushioning consumers from the sharp increase in global oil prices.
- The government reduced the level of price stabilization on Kerosene, and Diesel by Kshs 55.7 and Kshs 34.7 per litre respectively.
We note that while fuel prices have seen a sharp upward adjustment in the May 2026 cycle, the government’s continued intervention through the price stabilization mechanism, with the government planning to utilize approximately Kshs 10.0 bn of the Petroleum Development Levy (PDL) Fund to stabilize the prices and a stable Kenyan Shilling have prevented even steeper increases. Without these efforts, the record surges in landing costs for Kerosene, Diesel and Super Petrol, would have dealt a far more severe blow to the economy.
Going forward, the outlook for fuel prices remains cautious. While the government's stabilization framework provides a cushion, persistent geopolitical tensions in the Middle East suggest that global oil prices may remain volatile. Given Diesel's role as a key input in production and transportation, the recent Kshs 10.0 decline in diesel prices is expected to ease cost push pressures across sectors, particularly in manufacturing, agriculture, and logistics, by lowering transportation and operational costs. However, diesel prices remain relatively high at Kshs 222.9 per litre, suggesting that the relief to businesses and consumers may be gradual rather than immediate. Additionally, with inflation having risen to 6.7%, close to the upper limit of the Central Bank of Kenya's target range of 2.5% to 7.5%, the inflation outlook remains sensitive to prevailing fuel costs, exchange rate movements, and food price dynamics. Consequently, while the decline in diesel prices may help moderate inflationary pressures, maintaining inflation within the target range could prove increasingly challenging in the near term.
Rates in the Fixed Income market have been on an upward trend due to tightening liquidity in the money market which has limited the government’s ability to front load its borrowing. The government is 16.0% ahead of its prorated net domestic borrowing target of Kshs 957.4 bn, having a net borrowing position of Kshs 1110.4 bn (inclusive of T-bills). We expect the yield curve to steepen in the short and medium term, driven by the inflationary pressures, with the government looking to increase its domestic borrowing to maintain the fiscal surplus. As such, we expect the yield curve to steepen in the short to medium-term and hence investors are expected to shift towards the short to medium-term papers to lock in the high returns.
Market Performance:
During the week, the equities market was on a downward trajectory, with NASI losing by 0.8%, NSE 10 by 0.7%, NSE 25 by 0.6%, and NSE 20 by 0.4%, taking the YTD performance to gains of 12.8%, 12.4%, 11.4% and 10.7% for NSE 20, NSE 25, NASI and NSE 10 respectively. The week-on-week equities market performance was mainly driven by losses recorded by large cap stocks such as Absa, Equity and KCB of 2.9%, 2.3% and 2.1% respectively. However, the performance was supported by gains recorded by large cap stocks such as EABL, Stanbic and Standard Chartered of 4.0%, 2.6% and 1.6% respectively.
During the week, the banking sector index decreased by 0.9% to 237.9 from 239.4 recorded the previous week. This is attributable to losses recorded by large cap stocks such Absa, Equity and KCB of 2.9%, 2.3% and 2.1% respectively. However, the performance was uplifted by gains recorded by large cap stocks such as Stanbic and Standard Chartered of 2.6% and 1.6% respectively.
During the week, equities turnover increased by 1.2% to USD 26.5 mn from USD 26.2 mn recorded the previous week, taking the YTD total turnover to USD 734.1 mn. Foreign investors became net buyers for the first time in two weeks with a net buying position of USD 3.5 mn, from a net selling position of USD 1.9 mn recorded the previous week, taking the YTD foreign net selling position to USD 79.4 mn, compared to a net selling position of USD 92.9 mn recorded in 2025.
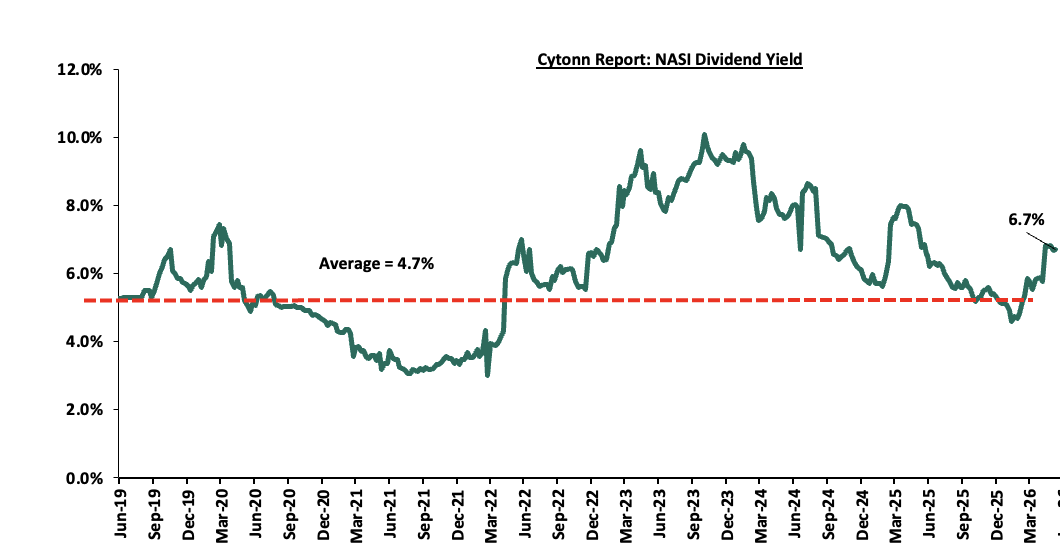
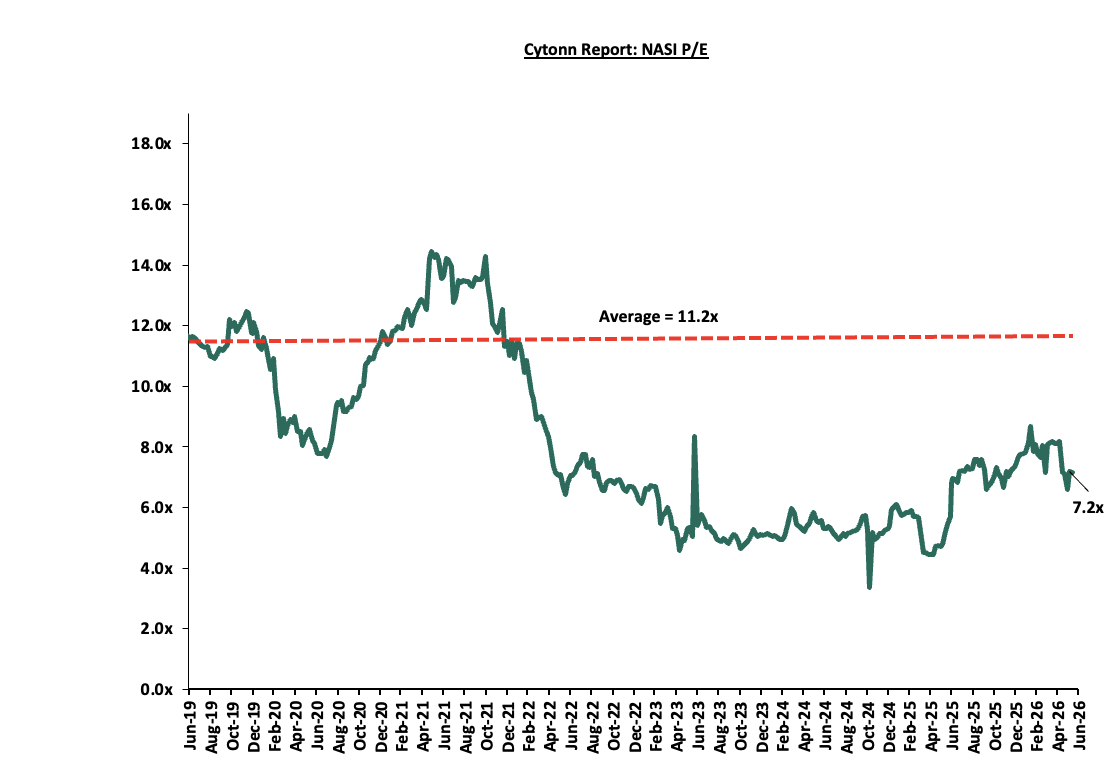
The market is currently trading at a price to earnings ratio (P/E) of 7.2x, 36.4% below the historical average of 11.2x, and a dividend yield of 6.7%, 2.0% points above the historical average of 4.7%. Key to note, NASI’s PEG ratio currently stands at 0.9x, an indication that the market is slightly undervalued relative to its future growth. A PEG ratio greater than 1.0x indicates the market may be overvalued while a PEG ratio less than 1.0x indicates that the market is undervalued. The charts below indicate the historical P/E and dividend yields of the market:
Universe of Coverage:
|
Cytonn Report: Equities Universe of Coverage |
|||||||||||
|
Company |
Price as at 05/06/2026 |
Price as at 12/06/2027 |
w/w change |
m/m change |
YTD Change |
Year Open 2026 |
Target Price* |
Dividend Yield |
Upside/ Downside** |
P/TBv Multiple |
Recommendation |
|
CIC Group |
4.2 |
4.2 |
0.0% |
0.2% |
(7.5%) |
4.5 |
5.5 |
3.1% |
34.0% |
1.1x |
Buy |
|
Diamond Trust Bank |
143.0 |
142.5 |
(0.3%) |
(3.2%) |
24.2% |
114.8 |
175.1 |
6.3% |
29.2% |
0.4x |
Buy |
|
KCB Group |
70.8 |
69.3 |
(2.1%) |
3.7% |
5.3% |
65.8 |
81.1 |
8.0% |
27.2% |
0.7x |
Buy |
|
Co-op Bank |
32.0 |
31.7 |
(0.8%) |
(1.2%) |
32.6% |
23.9 |
37.2 |
9.9% |
25.1% |
1.2x |
Buy |
|
NCBA |
88.3 |
88.3 |
0.0% |
1.1% |
3.8% |
85.0 |
103.3 |
7.8% |
25.1% |
1.2x |
Buy |
|
Equity Group |
77.3 |
75.5 |
(2.3%) |
1.7% |
12.7% |
67.0 |
87.8 |
7.4% |
23.9% |
1.0x |
Buy |
|
ABSA Bank |
29.1 |
28.2 |
(2.9%) |
(1.9%) |
13.5% |
24.9 |
31.7 |
7.1% |
19.8% |
1.5x |
Accumulate |
|
Jubilee Holdings |
394.0 |
368.0 |
(6.6%) |
0.2% |
14.1% |
322.5 |
407.5 |
7.1% |
14.8% |
0.5x |
Accumulate |
|
Standard Chartered Bank |
331.8 |
337.0 |
1.6% |
1.1% |
12.4% |
299.8 |
346.8 |
9.3% |
12.1% |
2.1x |
Accumulate |
|
I&M Group |
52.5 |
55.0 |
4.8% |
8.4% |
28.5% |
42.8 |
56.7 |
7.8% |
9.8% |
0.9x |
Hold |
|
Stanbic Holdings |
285.0 |
292.5 |
2.6% |
8.5% |
47.9% |
197.8 |
297.5 |
3.8% |
9.4% |
1.7x |
Hold |
|
Britam |
12.7 |
12.4 |
(2.4%) |
0.4% |
36.3% |
9.1 |
13.5 |
0.0% |
9.3% |
0.9x |
Hold |
|
*Target Price as per Cytonn Analyst estimates **Upside/ (Downside) is adjusted for Dividend Yield ***Dividend Yield is calculated using FY’2025 Dividends |
|||||||||||
We maintain a “cautiously optimistic” short-term outlook supported primarily earnings-led attractive valuations, despite rising yields on short-term government papers, which increase competition for capital by drawing investors towards risk-free government securities, as well as heightened geopolitical risks such as Iran war that may weigh on investor sentiment, and, “neutral” in the long term as persistent foreign investor outflows continue to constrain market liquidity and limit broad-based market re-rating. With the market currently trading at a discount to its future growth (PEG Ratio at 0.9x), where performance will be driven by company-specific fundamentals rather than general market direction, we believe that investors should reposition towards value stocks exhibiting strong earnings growth, attractive dividend yields, solid balance sheets, sustainable competitive advantages and trading at compelling discounts to their intrinsic value. While foreign investor sell-offs are expected to continue exerting pressure in the near term, we believe this will create selective entry opportunities for long-term investors.
-
Industry Sector
During the week, Shelter Afrique Development Bank (ShafDB) unveiled a new brand identity during its 45th Annual General Meeting in Rabat, Morocco, marking a significant milestone in its transition from a traditional housing financier into a multilateral development bank. ShafDB was established in 1981 to address the housing deficit in Africa. The rebranding reflects the expanded mandate of the institution to support not only housing development but also broader urban infrastructure projects aimed at addressing Africa's growing urbanization challenges and housing deficit.
ShafDB indicated that the transformation will strengthen its capacity to mobilize capital and finance larger scale housing and urban development projects across the continent. The institution noted that Africa faces a housing deficit exceeding 53 million units, requiring substantial long-term investment, with the bank positioning itself as a key catalyst in attracting both public and private capital towards affordable housing, sustainable cities, and related infrastructure.
Going forward, the enhanced mandate and stronger capital mobilization strategy are expected to increase financing for affordable housing and urban infrastructure projects across African markets, especially in Kenya. This could translate into greater access to development finance, increased private sector participation, and accelerated delivery of housing projects in the Real Estate sector. In the medium term, ShafDB's expansion could support efforts to narrow the continent's housing deficit while promoting the development of more inclusive, resilient, and sustainable urban centers.
-
KRA set to pursue Housing Levy defaulters
During the week, the Government sought to strengthen enforcement of the Affordable Housing Levy after revealing that more than Kshs 100.0 bn in employee deductions may not have been remitted to the Affordable Housing Fund despite being collected by employers. The State Department for Housing wants the Kenya Revenue Authority (KRA) to be granted powers to recover outstanding levy payments using the same enforcement mechanisms applied to unpaid taxes. The proposal follows concerns raised by both the Affordable Housing Fund Board and the Auditor General, who identified legal and administrative gaps that have limited KRA's ability to pursue non-compliant employers and safeguard housing levy collections.
We expect that going forward, the proposed changes could significantly strengthen the funding base of the Affordable Housing Programme at a time when the government is seeking additional resources to support housing delivery. Recovery of even a portion of the estimated Kshs 100.0 bn in outstanding levy payments would provide a substantial boost to the Affordable Housing Fund, enhancing the government's capacity to finance ongoing and future housing projects. The proposal also comes shortly after plans to securitize future housing levy collections to bridge funding gaps within the programme, highlighting the growing importance of levy revenues as a key source of capital for affordable housing development in Kenya.
-
Infrastructure Sector
-
Construction of two roads in Migori County
During the week, the National Government, through Treasury Cabinet Secretary John Mbadi, launched the construction of the Kanyawanga-Kwoyo-Dede-Rapogi-Awendo Road and the Othoo-Got-Kachola Road in Migori County during the week, reaffirming its commitment to expanding infrastructure development across the Nyanza region. The projects are expected to improve connectivity between key population centers, facilitate movement of goods and people, and enhance access to essential services. Government officials noted that the roads form part of broader efforts to unlock economic opportunities in previously underserved areas while addressing longstanding infrastructure deficits.
The launch is particularly significant for residents of Awendo and Nyatike constituencies, where poor road conditions have historically constrained trade, access to healthcare, and mobility, especially during rainy seasons.
Going forward, the completion of the road projects is expected to reduce travel times, lower transportation costs, and improve market access for businesses and farmers across Migori County. The construction phase is also likely to generate employment opportunities for local communities, supporting economic activity. Enhanced connectivity could increase the attractiveness of surrounding areas for residential, commercial, and mixed-use developments, while supporting land value appreciation and encouraging private sector investment over the medium to long term.
-
Government shifts infrastructure financing deficit
The FY'2026/27 Budget signaled a notable shift in the government's approach to infrastructure development, with greater emphasis being placed on mobilising private sector capital to fund large scale projects. Faced with rising fiscal pressures and limited room for additional borrowing, the government is increasingly turning to alternative financing mechanisms, including Public Private Partnerships (PPPs), infrastructure funds, and securitisation structures, to support the delivery of critical infrastructure while maintaining fiscal sustainability.
The proposed strategy reflects a broader effort to reduce dependence on traditional debt financed development, which has contributed to elevated public debt levels in recent years. By leveraging private investment, the government aims to continue expanding infrastructure networks without placing additional strain on the national balance sheet. The approach is expected to facilitate the implementation of key projects while allowing the government to redirect part of its resources towards other priority sectors such as healthcare, education, and social programmes.
Among the major projects expected to benefit from the new financing framework is the Nairobi–Nakuru–Mau Summit Highway, which is set to be delivered through a PPP arrangement involving both local and international investors. Similar models are also being explored for other strategic transport corridors, underscoring the government's intention to accelerate infrastructure delivery through risk sharing and long-term concession agreements. The strategy further extends beyond roads, with private capital expected to play a greater role in the development of ports, logistics facilities, and water infrastructure.
Going forward, increased reliance on private financing could enhance the pace of infrastructure delivery while reducing pressure on public finances, provided that projects remain commercially viable and attractive to investors. For the real estate sector, continued investment in transport and logistics infrastructure is likely to improve accessibility, support economic activity, and stimulate development in emerging urban centres and growth corridors. Enhanced connectivity may also strengthen demand for residential, commercial, and industrial real estate in areas that benefit from improved infrastructure linkages.
-
Real Estate Investments Trusts
-
REITs Weekly Performance
On the Unquoted Securities Platform Acorn D-REIT and I-REIT traded at Kshs 29.6 and Kshs 23.8 per unit, respectively, as per the last updated data on 5th June 2026. The performance represented a 48.0% and 18.8% gain for the D-REIT and I-REIT, respectively, from the Kshs 20.0 inception price. The volumes traded for the D-REIT and I-REIT came in at 13.5 mn and 43.3 mn shares, respectively. Additionally, ILAM Fahari I-REIT traded at Kshs 13.8 per share as of 5th June 2026, representing a 31.0% loss from the Kshs 20.0 inception price. The volume traded to date came in at 1.2 mn shares for the I-REIT, REITs offer various benefits, such as tax exemptions, diversified portfolios, and stable long-term profits. However, the ongoing decline in the performance of Kenyan REITs and the restructuring of their business portfolios are hindering significant previous investments. Additional general challenges include:
-
Insufficient understanding of the investment instrument among investors leading to a slower uptake of REIT products,
-
Lengthy approval processes for REIT creation,
-
High minimum capital requirements of Kshs 100.0 mn for REIT trustees compared to Kshs 10.0 mn for pension funds Trustees, essentially limiting the licensed REIT Trustee to banks only
-
The rigidity of choice between either a D-REIT or and I-REIT forces managers to form two REITs, rather than having one Hybrid REIT that can allocate between development and income earning properties
-
Limiting the type of legal entity that can form a REIT to only a trust company, as opposed to allowing other entities such as partnerships, and companies,
-
We need to give time before REITS are required to list – they would be allowed to stay private for a few years before the requirement to list given that not all companies maybe comfortable with listing on day one, and,
-
Minimum subscription amounts or offer parcels set at Kshs 0.1 mn for D-REITs and Kshs 5.0 mn for restricted I-REITs. The significant capital requirements still make REITs relatively inaccessible to smaller retail investors compared to other investment vehicles like unit trusts or government bonds, all of which continue to limit the performance of Kenyan REITs.
We expect the performance of Kenya's Real Estate sector to remain resilient, supported by several factors: i) Rebranding of Shelter Afrique Development Bank which will increase financing for affordable housing and urban infrastructure projects ii) The Government’s aim to strengthen enforcement of the Affordable Housing Levy iii) The construction of the two roads in Migori County, and iv) The FY'2026/27 Budget which is signaling a notable shift in the government's approach to infrastructure development. However, challenges such the weak investor appetite in listed REITs like ILAM Fahari I-REIT and high capital requirements will continue to constrain the sector's optimal performance.
Digital Payments Weekly Highlights
-
Mastercard expands 24/7 stablecoin settlement infrastructure
During the week, Mastercard Incorporated expanded communication around its always-on stablecoin settlement infrastructure, enabling banks and fintech partners to settle transactions using regulated stablecoins 24 hours a day, including weekends and holidays. The infrastructure supports multiple stablecoins including USDC, PYUSD, RLUSD, USDG, and SoFiUSD across blockchain networks such as Ethereum and Solana. This marks a significant shift from traditional banking-hour settlement cycles and demonstrates Mastercard’s growing commitment to blockchain integration within its core payments infrastructure.
The significance is the gradual evolution toward a real-time global payments ecosystem. Traditional card settlement processes have historically depended on intermediary banks and delayed clearing cycles, particularly across borders. Mastercard’s move signals a future where blockchain infrastructure can reduce settlement delays, improve liquidity management, and enable continuous payment operations independent of banking hours. This could materially improve transaction efficiency for merchants, banks, and cross-border remittance providers while accelerating industry-wide adoption of programmable financial infrastructure.
-
PayPal launches UK’s first agentic commerce platform with in-app checkout
PayPal Holdings, Inc., alongside partner Hey Savi, launched what is being positioned as the United Kingdom’s first agentic commerce platform, enabling AI-driven shopping experiences integrated directly with in-app checkout capabilities. The platform allows users to discover products, receive AI-assisted recommendations, and complete purchases seamlessly within the application environment, reducing friction in the customer journey. Retail group Debenhams became the first commercial partner to adopt the platform.
The significance lies in the rapid convergence between artificial intelligence and digital commerce infrastructure. Payments providers are increasingly competing not only on transaction processing but also on ownership of the broader consumer purchasing journey. For the digital payments ecosystem, PayPal’s move signals an industry-wide shift toward embedded payments where discovery, decision-making, and checkout are integrated into AI-powered commerce experiences, potentially reducing reliance on traditional standalone checkout systems
Digital Payments Stock Performance
The table below presents a snapshot of NYSE-listed digital payments stocks, covering Visa, Mastercard, American Express (AXP), Circle, Block and Paypal.
|
Cytonn Report: Digital Payments NYSE stock perfomance |
||||||
|
Company |
Year Open 2026 |
Price 6/5/2026 |
Price 6/12/2026 |
w/w change |
YTD change |
P/E |
|
American Express |
372.7 |
310.7 |
325.4 |
4.8% |
(12.7%) |
26.3x |
|
Visa |
346.5 |
323.6 |
322.4 |
(0.4%) |
(7.0%) |
16.3x |
|
Mastercard |
563.1 |
491.1 |
490.0 |
(0.2%) |
(13.0%) |
30.5x |
|
Circle |
83.5 |
80.3 |
77.8 |
(3.0%) |
(6.7%) |
42.8x |
|
Block |
65.2 |
68.2 |
69.5 |
2.0% |
6.7% |
28.8x |
|
Paypal Holdings |
58.1 |
41.3 |
41.5 |
0.6% |
(28.6%) |
7.5x |
|
Average |
|
|
|
|
|
25.4x |
Source: Visa, AXP, Circle, Mastercard, Block and Paypal financials. NYSE
The stocks are currently trading at an average P/E multiple of 25.4x, indicating that investors are pricing in strong future earnings growth and are prepared to pay a substantial premium for current earnings. This also suggests that valuations may be stretched relative to near-term fundamentals.
We expect the digital payments sector to remain in a phase of structural transformation driven by the convergence of blockchain-based settlement systems, artificial intelligence, enabled commerce, and continued expansion of embedded payments. The rollout of 24/7 stablecoin settlement infrastructure by major networks such as Mastercard, alongside similar initiatives across the broader industry, points to a gradual shift toward real-time, always-on global payment rails that reduce reliance on traditional banking-hour constraints and improve cross-border efficiency. At the same time, the emergence of agentic and AI-driven commerce platforms, as seen in recent developments by PayPal, is reshaping the payments value chain by integrating discovery, decisioning, and checkout into unified digital experiences, potentially compressing traditional merchant payment workflows. However, despite these strong structural tailwinds, the sector’s current valuation profile suggests elevated expectations, implying that near-term performance may be more sensitive to execution risk, regulatory developments around stablecoins and AI commerce, and competition from both fintech challengers and incumbent financial institutions. The sector is currently trading at an average P/E of 25.4x, indicating relatively rich valuations that already embed significant future growth expectations and may limit upside if earnings delivery underwhelms.
In 2025, we published the Nairobi Metropolitan Area Residential Report 2025 themed ‘Navigating Opportunities in a Resilient Market’. This week, we update our previous research with the Nairobi Metropolitan Area (NMA) Residential Report 2026 titled ‘Unlocking Value in a Shifting Residential Market’ by highlighting the residential sector's performance in the region in terms of price appreciation, rental yields, and market uptake, based on the coverage of 35 regions within the Nairobi Metropolis. We shall also discuss factors influencing residential supply and demand, current developments affecting the industry, and conclude with a look at investment options as well as the sector's general outlook for the coming fiscal year. As such, we shall discuss the following;
-
Overview of the Residential Sector,
-
Recent Developments in the Sector,
-
Residential Market Performance, and,
-
Conclusion, Residential Market Outlook, and Investment Opportunity.
Section I: Overview of the Residential Sector
In FY’2025/26, the residential sector maintained resilience despite economic challenges, supported by sustained demand from Kenya’s high urbanization 3.7% p.a. and population growth 2.0% p.a. rates against a global average of 1.7% p.a and 1.0% p.a, respectively, as per World Bank 2024 data. According to the Kenya National Bureau of Statistics (KNBS) 2025 Economic Survey, the Real Estate sector’s contribution to GDP grew by 5.5% to KSh 364.6 bn in Q2’2025, up from KSh 339.2 bn in Q2’2024, contributing 8.1% to GDP to remain relatively unchanged from the 8.1% recorded in Q1’2025. Cumulatively, Real Estate and construction sectors accounted for 15.3% of GDP, a 3.8% decline from 19.1% in Q2’2024, reflecting economic slowdown and reduced construction activity.
The residential sector recorded a marginal increase in performance, with the average total returns to investors coming in at 6.6%, a 0.8%-point increase from 5.8% recorded in FY’2024. The performance was attributed to an increase in the residential average y/y price appreciation which came in at 0.8% in FY’2025, 0.4%-points higher than the 0.4% appreciation recorded in FY’2024, driven by increase in the average rent per SQM by 9.7% to Kshs 622, from Kshs 567 recorded in FY’2024. We expect the sector’s contribution to continue improving in 2025 supported by;
-
Government and private sector aggressiveness in implementing housing initiative programs, which focus on housing. According to the Architectural Association of Kenya’s (AAK) Status of the Built Environment Report 2025, there are 307 ongoing projects across the country, comprising 214,057 housing units. Of these, 77.0% are Affordable Housing Programme units, 10.0% are student housing, 7.0% are institutional staff housing and 6.0% are private projects benefitting from VAT exemptions,
-
Continued efforts by the Kenya Mortgage Refinance Company (KMRC) to drive the availability and affordability of home loans to Kenyans by providing single-digit fixed rate, and long-term finance to Primary Mortgage Lenders (PMLs) such as banks and SACCOs. In Q3’2025, KMRC advanced the implementation of its widened eligibility framework to include non-shareholder SACCOs and microfinance banks, aimed at enabling more institutions to offer low-cost mortgages to underserved segments.
-
Concerted efforts by the government to provide affordable mortgages through the Kenya Mortgage Refinance Company (KMRC), in a bid to make home ownership more accessible to Kenyans by providing long-term, low-interest home loans to potential home buyers. By December 2025, KMRC refinanced 5,148 mortgages for refinancing at a low interest rate of 5.0%, and,
-
The growing trend towards purpose-built properties to host Student housing, Diplomatic residential, which offer potential for growth to the residential sector.
Going forward, we anticipate that the following factors will influence the performance of the residential sector;
-
Housing Deficit: The Center for Affordable Housing Finance Africa (CAHF) projected that Kenya's housing deficit reached 80.0% in 2024. This estimation arises from the annual delivery of approximately 50,000 new homes, falling significantly short of the demand, which amounts to 250,000 homes per year. Notably, the low-income segment faces substantial under-representation, receiving only 2% of the constructed residences. To bridge this disparity, the government, through the Affordable Housing Programme (AHP), is committed to addressing the issue. Consequently, the demand for affordable housing continues to surge, driven by increased participation from private sector entities entering into Public Private Partnerships (PPPs),
-
Demographics: Kenya continues to witness positive demographics as evidenced by Kenya’s relatively high urbanization and population growth rates of 3.7% p.a and 2.0% p.a, respectively, against the global averages of 1.7% p.a and 1.0% p.a, respectively, as at 2024, there is a sustained demand for more housing units in the country.
-
Access to Credit: High mortgage interest rates currently at 15.3% and high transaction costs, have made it difficult for low- and middle-income earners to afford mortgages. Nonetheless, we foresee that heightened cooperation among industry stakeholders and the Kenya Mortgage Refinance Company (KMRC) will help alleviate this challenge. Particularly noteworthy are the government's initiatives aimed at enhancing accessibility to affordable home loans for Kenyans, offering reduced interest rates starting from 9.5%. These measures are poised to enhance the effectiveness of mortgage lending by enhancing accessibility to home loans, thereby stimulating higher adoption rates across the nation.
In terms of supply, the residential sector has been largely constrained by insufficient access to affordable funding by developers, and bureaucracies and delays in approval processes. In 2025, new supply is also expected to slow down owing to:
-
Rising construction costs: In 2025, construction costs increased marginally by 0.6% to an average of Kshs 66,375 per SQM from an average of Kshs 71,200 per SQM recorded in 2024. This increase can be, partly supported by the Kenyan Shilling's relative stability against the US Dollar, with the exchange rate remaining around Kshs 129.0 per USD in December 2025 compared to Kshs 129.4 per USD in December 2024.
-
Constrained Access to Financing: Lenders continue to tighten their lending requirements and demand more collateral from developers as a result of elevated credit risk in the Real Estate sector as evidenced by the 17.6% increase in gross Non-Performing Loans (NPLs), by June 2025, up from 17.4% in March 2025.
Section II: Recent Developments in the Sector
In FY’2025/26, the government announced the following regulations, policies, measures, and proposals affecting the residential sector namely:
-
The Cabinet approved the Affordable Housing Regulations, 2024, reducing the minimum housing deposit under the Affordable Housing Programme from 10.0% to 5.0% in a bid to enhance accessibility for low and middle-income earners. The new regulations also introduce supportive frameworks such as structured home loans, deposit support and tenant purchase schemes to boost uptake. This comes as the government seeks to accelerate housing delivery and bridge the homeownership gap under the Bottom-Up Economic Transformation Agenda (BETA). or more information, please visit our Cytonn Weekly #26.2025,
-
Superior Homes Kenya (SHK) and HFC Kenya, a subsidiary of HF Group, signed a transformative Memorandum of Understanding (MOU) to enhance homeownership accessibility in Kenya. This strategic partnership merges Superior Homes’ expertise in developing master-planned communities with HFC’s innovative financing solutions, offering homebuyers concessional mortgage rates of 9.5%, 20-year loan terms, and expedited loan approvals. For more information, please visit our Cytonn Weekly #24.2025
It is important to highlight that various multilateral institutions, private entities, and the government have embarked on diverse approaches to secure funding for residential projects, including leveraging the capital markets and offering grants and loans. These initiatives are aimed at bolstering the supply side of the affordable housing initiative, with the goal of achieving an annual target of 250,000 units. Additionally, organizations have actively pursued partnerships and agreements to facilitate the realization of their residential projects. Some of the notable initiatives include;
-
President William Ruto presided over the launch of an affordable housing project in Kimilili, Bungoma County, as part of his broader Western Kenya development tour, reinforcing the government’s ongoing efforts to scale up the Affordable Housing Programme across the country. The initiative reflects a continued shift towards expanding housing delivery into emerging urban centres, with the Kimilili project forming part of a growing pipeline of developments aimed at increasing access to decent and affordable housing while supporting local economic activity. For more information, please see our Cytonn weekly #11.2026
-
The Kenyan government announced its plan to pursue an ambitious plan to secure Kshs 9.2 bn from private investors to construct 2,820 affordable homes in Stoni Athi, Machakos County, as part of its Affordable Housing Programme. For more information, please see our Cytonn monthly #February 2026
-
GulfCap Real Estate broke ground for a Kshs 120.0 bn housing project in Kisumu marking a significant development in Kenya's real estate sector. Spanning 285 acres, the project aims to address the growing demand for housing in Kisumu, a city experiencing rapid urbanization and population growth. For more information, please see our Cytonn Weekly #04/2026
-
Mi Vida Homes announced the signing of a major development partnership with International Housing Solutions (IHS) to construct 240 housing units in Riruta, Nairobi. The project will incorporate IFC’s EDGE sustainability standards, emphasizing energy efficiency, water conservation and reduced carbon footprints. The housing units will include studio, one-bedroom and three-bedroom apartments, designed to meet growing demand for modern, affordable homes in urban centres. For more information, please see our Cytonn Weekly #46/2025.
-
The International Finance Corporation ( IFC) , the private-sector arm of the World Bank, has disbursed Kshs 2.6 bn repayable in 7.0 years to Centum Real Estate, a Kenyan real estate firm to build 1940.0 units green, energy-efficient homes within Nairobi’s Two Rivers “Mizizi” project at the two rivers residential with 600.0 units already sold in phase one. For more information, please visit our Cytonn Weekly #25.2025,
In terms of financing for residential unit demand, the government is intensifying its efforts to facilitate affordable mortgages via the Kenya Mortgage Refinance Company (KMRC). The objective is to enhance accessibility to homeownership for Kenyan citizens by offering long-term, low-interest home loans to prospective buyers. In 2025, KMRC successfully refinanced 5,148 mortgages at an advantageous interest rate of 5.0%. Some of the notable highlights regarding affordable mortgages include;
-
The Board of Directors of the Kenya Mortgage Refinance Company Plc successfully concluded the second tranche of its Kshs 10.5 bn Medium Term Note (MTN) Programme, with tenors to maturity of 8 years and a weighted average life of 5.1 years. The bond was oversubscribed, with an overall subscription rate coming in at 312.8% receiving bids worth Kshs 9.4 bn. KMRC accepted bids worth Kshs 3.0 bn. The note was offered at par at an issue price of 100.0% and carries a fixed coupon rate of 12.2% per annum payable semi-annually. For more information, please see our Cytonn Weekly #19/2026
-
Centum Real Estate partnered with KCB Bank Kenya to offer discounted fixed-rate mortgages aimed at increasing sales of its housing units. The mortgages will carry an 8.9% fixed interest rate for periods of up to 25 years, which is lower than the 11.0% to 15.0% rates commonly charged by commercial banks as of March 2026. The company says the arrangement is intended to make home ownership more affordable for salaried and self-employed buyers. For more information, please see our Cytonn Weekly #18/2026
-
National Treasury disclosed that KMRC’s interventions have helped lift cumulative mortgage lending to Kshs 21.4 bn as at August 2025 and that more than 4,500 affordable home loans were disbursed across 39 counties under its refinancing programme. These loans have an average interest rate of 10.0%, made possible by KMRC’s provision of long-term funding to primary mortgage lenders (PMLs) at approximately 5.0%, which in turn helps reduce borrowing costs for homebuyers. For more information, please see our Cytonn Weekly #52/2025,
Section III: Residential Market Performance
In FY’2025/26 there was a marginal increase in residential market performance in Nairobi Metropolitan Area, with the average total returns to investors coming in at 6.6%, a 0.8%-point increase from 5.8% recorded in FY’2024/25. The performance was attributed to an increase in the residential average y/y price appreciation which came in at 0.8% in FY’2025/26, 0.4%-points higher than the 0.4% appreciation recorded in FY’2024/25, driven by increased property transactions during the year. On the other hand, the average rental yield came in at 5.9% in FY’2025/26, recording a 0.5%-points increase from the 5.4% rental yield recorded in FY’2024/25. This was driven by an increase in the average rent per SQM by 9.7% to Kshs 622, from Kshs 567 recorded in FY’2024. The table below shows the comparison between the performance in FY’2024’25 and FY’2023/24;
|
Cytonn Report: Residential Market Performance Summary: FY’2024/25 - FY’2025/26 |
|||||||||||
|
Segment |
Average of Price per SQM FY'2025/26 |
Average of Rent per SQM FY'2025/26 |
Average of Rental Yield FY'2025/26 |
Average of Price Appreciation FY'2025/26 |
Average of Total Returns FY'2025/26 |
Average of Rental Yield FY'2024/25 |
Average of Price Appreciation FY'2024/25 |
Average of Total Returns FY'2024/25 |
y/y ∆ in Rental Yield (% points) |
y/y ∆ in Price Appreciation (% points) |
y/y ∆ in Total Returns (% points) |
|
Detached Units |
|||||||||||
|
High End |
211,239 |
932 |
5.1% |
0.5% |
5.6% |
4.8% |
0.1% |
4.9% |
0.3% |
0.4% |
0.7% |
|
Lower Middle |
81,256 |
388 |
5.6% |
1.7% |
7.3% |
4.9% |
0.6% |
5.5% |
0.7% |
1.1% |
1.8% |
|
Upper Middle |
142,647 |
624 |
5.1% |
0.9% |
6.0% |
5.0% |
0.3% |
5.3% |
0.1% |
0.6% |
0.7% |
|
Detached Units Average |
145,047 |
648 |
5.3% |
1.0% |
6.3% |
4.9% |
0.4% |
5.2% |
0.4% |
0.7% |
1.1% |
|
Apartments |
|||||||||||
|
Lower Mid- End Suburbs |
87,692 |
497 |
6.4% |
1.3% |
7.7% |
6.3% |
(0.1%) |
6.2% |
0.1% |
1.4% |
1.5% |
|
Upper Mid- End |
133,727 |
834 |
7.0% |
0.6% |
7.6% |
6.0% |
1.2% |
7.2% |
1.0% |
(0.6%) |
0.4% |
|
Lower Mid-End Satellite Towns |
105,768 |
455 |
5.8% |
(0.5%) |
5.3% |
5.7% |
0.0% |
5.7% |
0.1% |
(0.5%) |
(0.4%) |
|
Apartments Average |
109,063 |
595 |
6.4% |
0.5% |
6.8% |
6.0% |
0.4% |
6.4% |
0.4% |
0.1% |
0.5% |
|
Residential Market Average |
127,055 |
622 |
5.9% |
0.8% |
6.6% |
5.4% |
0.4% |
5.8% |
0.4% |
0.4% |
0.8% |
Source: Cytonn Research
Sub-Market Analysis
In our submarket analysis, we classified the various suburbs in the Nairobi Metropolitan Area into three segments;
High End Segment – Consists of prime suburbs in Nairobi, such as Karen, Runda and Kitisuru. The majority of these areas have been designated for low-rise residential construction and are distinguished by their large, luxurious villas and bungalows,
Upper Middle-Income Segment – Consists of suburbs zoned for both high rise and low-density houses such as Kilimani, Lavington, Kileleshwa, Loresho, and Ridgeways among others. The population in these zones are middle class but with higher incomes than the average characterization of middle class,
Lower Middle-Income Segment – Consists of suburbs in Nairobi habited by middle class such as Ruiru, Kikuyu, Ruaka, Dagoretti, Upper Kabete (Uthiru and parts of Mountain View), and Ngong Road (Race Course, Lenana, Corner), among others.
-
Detached Units
The segment registered an average total return of 6.2%, 0.4 % higher than the 5.8% recorded in FY’2024. The performance was driven by a 1.0%-points increase in the average rental yield to 5.3% in FY’2025, from 4.3% recorded in FY’2024. The increase in performance was attributable to a 3.9% increase in the average rents per SQM to Kshs 643 in FY’2025, from Kshs 619 recorded in FY’2024. The best-performing segment was the Lower-middle segment offering an average total return of 7.5%, attributable to a relatively high average price appreciation of 1.6%, 0.6%-points higher than the detached market average appreciation of 1.0%. The impressive performance of the segment was driven by returns from well-performing nodes such as Rongai, Thika and Juja, which have continued to offer relatively high returns to investors. Overall, Kitengela was the best-performing node, offering the highest returns at 10.8%, 4.6% points higher than the detached market average of 6.2%, driven by a relatively high y/y price appreciation of 9.8%. The node has seen increased detached unit property investments owing to an inflow of residents brought about by the enhanced accessibility to the Nairobi CBD through various roads such as the Southern Bypass. Thika followed with an average total return of 10.6%, 4.6% points higher than the detached market average of 6.2%;
|
All values in Kshs unless stated otherwise |
|||||||||||
|
Cytonn Report: Residential Detached Units Summary FY’2025/26 |
|||||||||||
|
Area |
Average of Occupancy FY'2025/26 |
Average of Annual Uptake FY'2025/26 |
Average of Rental Yield FY'2025 |
Average of Price Appreciation FY'2025 |
Average of Total Returns FY'2025/26 |
Average of Rental Yield FY'2024/25 |
Average of Price Appreciation FY'2024/25 |
Average of Total Returns FY'2024/25 |
Change in Rental Yield (% Points) |
Change in Price Appreciation (% Points) |
Change in Total Returns (% Points) |
|
High End |
|||||||||||
|
Lower Kabete |
95.9% |
10.5% |
4.7% |
1.9% |
6.6% |
4.6% |
1.1% |
6.0% |
0.1% |
0.8% |
0.6% |
|
Runda |
96.8% |
8.1% |
5.5% |
0.3% |
5.9% |
5.4% |
0.0% |
5.2% |
0.1% |
0.3% |
0.7% |
|
Karen |
92.6% |
10.9% |
5.6% |
(0.2%) |
5.4% |
5.1% |
(0.4%) |
4.8% |
0.5% |
(0.2%) |
0.6% |
|
Rosslyn |
94.1% |
9.5% |
5.3% |
0.0% |
5.3% |
6.6% |
0.0% |
4.5% |
(1.3%) |
0.0% |
0.8% |
|
Kitisuru |
88.9% |
9.3% |
4.0% |
1.3% |
5.2% |
5.1% |
0.0% |
4.2% |
(1.1%) |
1.3% |
1.0% |
|
Average |
93.7% |
9.7% |
5.0% |
0.7% |
5.7% |
5.4% |
0.1% |
4.9% |
(0.4%) |
0.6% |
0.8% |
|
Upper Middle |
|||||||||||
|
South B/C |
91.2% |
9.6% |
7.5% |
1.7% |
9.2% |
4.3% |
(0.1%) |
6.3% |
3.2% |
1.8% |
2.9% |
|
Redhill & Sigona |
93.2% |
10.3% |
6.2% |
1.5% |
7.7% |
5.3% |
0.4% |
5.7% |
0.9% |
1.1% |
2.0% |
|
Loresho |
88.7% |
9.3% |
5.4% |
1.2% |
6.6% |
5.4% |
0.1% |
5.7% |
0.0% |
1.0% |
0.9% |
|
Langata |
93.1% |
7.6% |
4.5% |
1.0% |
5.5% |
4.8% |
0.0% |
5.7% |
(0.3%) |
1.0% |
(0.2%) |
|
Runda Mumwe |
91.1% |
13.4% |
4.7% |
0.0% |
4.7% |
6.2% |
0.7% |
4.2% |
(1.5%) |
(0.7%) |
0.5% |
|
Lavington |
87.2% |
8.3% |
3.5% |
0.7% |
4.2% |
6.3% |
0.8% |
5.4% |
(2.8%) |
(0.1%) |
(1.2%) |
|
Ridgeways |
88.8% |
8.9% |
2.7% |
0.0% |
2.7% |
4.3% |
0.0% |
4.2% |
(1.6%) |
0.0% |
(1.5%) |
|
Average |
90.5% |
9.6% |
4.9% |
0.9% |
5.8% |
5.4% |
0.3% |
5.7% |
(0.5%) |
0.6% |
0.1% |
|
Lower Middle |
|||||||||||
|
Rongai |
96.9% |
10.6% |
9.8% |
1.1% |
10.8% |
5.2% |
0.5% |
5.6% |
(4.6%) |
0.6% |
5.2% |
|
Thika |
87.1% |
9.8% |
6.1% |
4.5% |
10.6% |
5.5% |
0.4% |
5.9% |
(0.6%) |
4.1% |
4.7% |
|
Juja |
90.7% |
14.6% |
5.2% |
3.0% |
8.2% |
4.3% |
1.9% |
6.2% |
0.9% |
1.1% |
2.2% |
|
Kitengela |
93.6% |
9.8% |
5.2% |
1.5% |
6.7% |
5.0% |
1.7% |
6.7% |
0.2% |
(0.2%) |
0.0% |
|
Syokimau/Mlolongo |
90.8% |
9.4% |
6.1% |
0.4% |
6.4% |
4.9% |
0.0% |
5.0% |
1.2% |
0.4% |
1.4% |
|
Donholm & Komarock |
86.5% |
9.1% |
4.8% |
1.0% |
5.9% |
4.0% |
0.0% |
4.0% |
0.8% |
1.0% |
1.9% |
|
Athi River |
91.3% |
9.4% |
4.6% |
1.2% |
5.9% |
4.9% |
(0.6%) |
4.3% |
(0.3%) |
1.8% |
1.6% |
|
Ngong |
90.2% |
7.6% |
5.5% |
0.2% |
5.7% |
5.2% |
1.2% |
6.4% |
0.3% |
(1.0%) |
(0.3%) |
|
Average |
90.9% |
10.1% |
5.9% |
1.6% |
7.5% |
5.3% |
0.8% |
6.1% |
0.6% |
0.8% |
1.4% |
|
Detached Average |
91.7% |
9.8% |
5.3% |
1.0% |
6.2% |
4.3% |
0.5% |
5.8% |
1.0% |
0.5% |
0.4% |
-
Apartments
The segment posted an increase in performance with the average total returns to apartments’ investors came in at 6.9%, recording a 0.6%-points increase from the 6.3% recorded during FY’2024. The slightly improved performance was driven by a 0.8%-points increase in the average rental yield to 6.5% in FY’2025, from 5.7% recorded in FY’2024. This was driven by a slightly increased apartment property transactions during the period, attributable to 4.0% points increase in the average occupancy to 93.7% in FY’2025 from 91.6% in FY’2024. The best-performing segment was the lower mid-end satellite towns with average total returns of 8.1%, attributed to a relatively high average y/y price appreciation of 1.6% and rental yield of 6.5%. The impressive performance of the segment was driven by returns from well-performing nodes such as Kikuyu, Ngong and Syokimau that have continued to offer competitive returns to investors in comparison to other segments.
Overall, the best-performing node was Kikuyu, offering investors average total returns of 14.5%, 7.6%-points higher than the apartment market average total return of 6.9%. Kikuyu is attracting apartment investments owing to infrastructural development with the roads such as Southern Bypass, proximity to CBD favouring residents in the area and a high number of middle-class families in the area.The table below shows the NMA residential sector detached units’ performance during FY’2025/26;
|
All values in Kshs unless stated otherwise |
||||||||||||
|
Cytonn Report: Residential Apartments Summary FY’2024/25 |
||||||||||||
|
Area |
Average of Occupancy FY'2025/26 |
Average of Annual Uptake FY'2025/26 |
Average of Rental Yield FY'2025/26 |
Average of Price Appreciation FY' FY'2025/26 |
Average of Total Returns FY'2025/26 |
Average of Rental Yield FY'2024/25 |
Average of Price Appreciation FY'2024/25 |
Average of Total Returns FY'2024/25 |
Change in Rental Yield (% Points) |
Change in Price Appreciation (% Points) |
Change in Total Returns (% Points) |
|
|
Upper Mid-End |
||||||||||||
|
Westlands |
90.1% |
14.5% |
6.3% |
4.4% |
10.6% |
6.3% |
0.3% |
6.6% |
0.6% |
3.6% |
4.1% |
|
|
Parklands |
92.7% |
12.4% |
6.2% |
1.5% |
7.7% |
6.2% |
4.4% |
10.6% |
0.8% |
1.5% |
2.3% |
|
|
Kileleshwa |
96.1% |
10.8% |
6.6% |
0.0% |
6.6% |
6.6% |
0.0% |
6.6% |
1.0% |
(0.5%) |
0.5% |
|
|
Kilimani |
92.8% |
12.8% |
6.3% |
0.3% |
6.6% |
5.8% |
0.5% |
6.2% |
0.5% |
(0.1%) |
0.4% |
|
|
Upperhill |
88.3% |
10.1% |
5.8% |
0.5% |
6.2% |
6.2% |
1.5% |
7.7% |
(0.2%) |
1.3% |
1.0% |
|
|
Average |
92.6% |
11.3% |
5.9% |
1.2% |
7.1% |
5.7% |
0.1% |
5.8% |
0.2% |
1.1% |
1.3% |
|
|
Lower Mid-End Suburbs |
||||||||||||
|
Dagoretti |
94.9% |
9.6% |
9.1% |
(0.5%) |
8.6% |
9.6% |
1.9% |
11.5% |
(2.3%) |
7.3% |
5.1% |
|
|
Imara Daima |
95.7% |
8.7% |
5.0% |
3.1% |
8.1% |
5.8% |
(2.7%) |
3.1% |
3.9% |
1.2% |
5.1% |
|
|
Race Course/Lenana |
96.5% |
13.2% |
7.5% |
0.0% |
7.6% |
5.7% |
0.8% |
6.5% |
0.0% |
(0.9%) |
(0.9%) |
|
|
Waiyaki Way |
92.8% |
12.6% |
5.7% |
0.4% |
6.1% |
5.7% |
0.9% |
6.6% |
(0.4%) |
(0.2%) |
(0.2%) |
|
|
Langata |
95.5% |
9.4% |
5.1% |
0.7% |
5.8% |
4.4% |
(0.6%) |
3.8% |
(1.2%) |
0.3% |
(0.9%) |
|
|
South B |
93.4% |
11.6% |
4.9% |
0.3% |
5.3% |
4.8% |
0.0% |
4.8% |
(1.8%) |
(1.4%) |
(3.2%) |
|
|
South C |
85.3% |
11.7% |
4.1% |
0.0% |
4.1% |
4.0% |
0.0% |
4.0% |
(1.3%) |
(0.4%) |
(1.7%) |
|
|
Kahawa West |
93.2% |
7.7% |
6.6% |
(9.1%) |
(2.5%) |
3.6% |
8.3% |
12.0% |
0.5% |
(4.4%) |
(3.9%) |
|
|
Average |
93.4% |
10.6% |
6.0% |
(0.6%) |
5.4% |
5.8% |
0.8% |
6.6% |
(0.3%) |
0.3% |
(0.1%) |
|
|
Lower Mid-End Satellite Towns |
||||||||||||
|
Kikuyu |
96.1% |
13.8% |
6.3% |
8.2% |
14.5% |
6.5% |
(1.9%) |
2.3% |
0.4% |
2.2% |
2.6% |
|
|
Ngong |
98.3% |
10.9% |
6.8% |
3.0% |
9.8% |
6.2% |
3.1% |
9.3% |
0.0% |
1.7% |
1.7% |
|
|
Syokimau |
90.1% |
10.1% |
6.1% |
1.5% |
7.6% |
5.4% |
2.5% |
7.9% |
0.0% |
1.9% |
1.9% |
|
|
Athi River |
97.4% |
10.1% |
8.7% |
(1.5%) |
7.2% |
9.4% |
(7.1%) |
2.3% |
0.4% |
(1.0%) |
(0.6%) |
|
|
Rongai |
91.7% |
12.1% |
6.4% |
0.5% |
6.9% |
5.5% |
(0.4%) |
5.1% |
(0.5%) |
0.0% |
(0.5%) |
|
|
Ruiru |
92.5% |
11.5% |
6.5% |
0.1% |
6.6% |
5.9% |
0.0% |
5.9% |
1.3% |
(2.2%) |
(1.0%) |
|
|
Ruaka |
91.3% |
20.3% |
5.5% |
0.2% |
5.7% |
5.5% |
3.2% |
8.3% |
3.5% |
(8.6%) |
(5.1%) |
|
|
Average |
93.7% |
12.6% |
6.5% |
1.6% |
8.1% |
5.6% |
0.9% |
6.5% |
0.7% |
(1.5%) |
(0.8%) |
|
|
Apartments Grand Average |
93.7% |
11.6% |
6.5% |
0.4% |
6.9% |
5.7% |
0.6% |
6.3% |
0.2% |
(0.1%) |
0.1% |
|
Source: Cytonn Research
Section IV: Conclusion, Market Outlook, and Investment Opportunity
We incorporated demand, infrastructure, purchasing power, access to credit, and performance, as the key metrics to gauge our sentiment for the sector going forward.
We have identified four neutral outlooks on performance, purchasing power, access to credit and Infrastructure and one positive outlooks on demand. Therefore, our general market outlook for the residential sector in 2026 is NEUTRAL. This is mainly driven by the increase in population, especially in urban areas, which is fueling the need for housing. Although this demand is being continuously addressed by the government through the implementation of the affordable housing program, there still remains a large deficit. Additionally, activities by players in the residential sector are poised to help address the housing shortage and improve the sector's performance. We expect the government to make major progress with the already established infrastructure projects in the pipeline and to launch other new projects in order to open up more satellite areas. We anticipate that the purchasing power of consumers, backed by the improved Kenya shilling and inflation, will sustain performance in the long term. However, we expect sector performance to be dampened by low penetration of mortgages and regulatory hindrances such as approval of building plans, high construction costs, and tough economic conditions such as high taxation. For detached units, investment opportunity lies in areas such as Kitengela, Ngong, and, South B&C, while for apartments, investment opportunity lies in Kahawa West, westlands and Dagorreti, due to their remarkable returns driven by relatively high returns to investors
Disclaimer: The views expressed in this publication are those of the writers where particulars are not warranted. This publication, which is in compliance with Section 2 of the Capital Markets Authority Act Cap 485A, is meant for general information only and is not a warranty, representation, advice or solicitation of any nature. Readers are advised in all circumstances to seek the advice of a registered investment advisor

- Talk to us
- Kenya
- P.O Box 20695 - 00200, Nairobi, Kenya
- Cell +254709101200
- Tel +254709101200
- WhatsApp +254741676635
- United States
- +254709101200
- DOWNLOAD OUR APP
-


- Kenya
- 8th Floor, Pinetree Plaza, Kaburu Drive, Ngong Road, Nairobi, Kenya
- USA
- Suite 1150, 1775 Eye Street NW, USA, Washington DC 20006, USA
- Investments
- High Yield
- Private Equity
- Real Estate
- Real Estate
- RiverRun Estates
- Cytonn Towers
- The Ridge
- Taraji Heights
- The Alma