Cytonn Monthly - February 2025
By Research Team, Mar 2, 2025
Executive Summary
Fixed Income
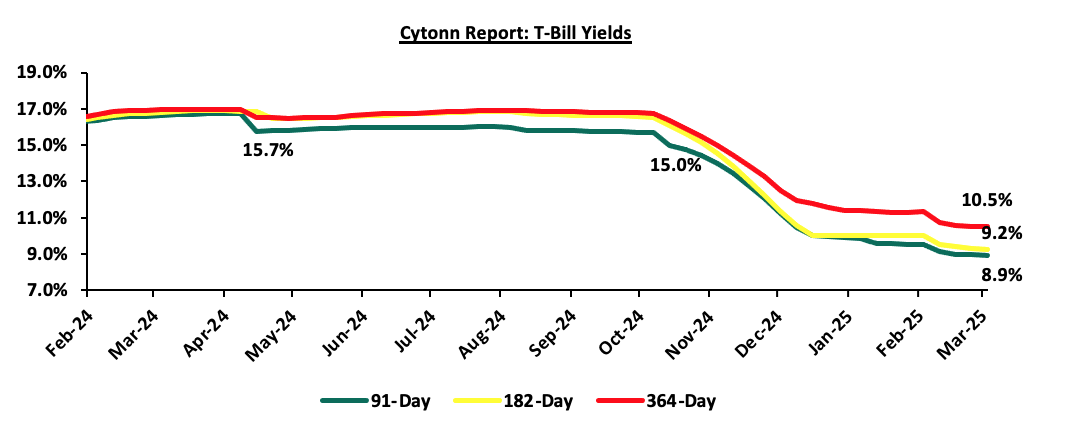
During the month of February 2025, T-bills were oversubscribed, with the overall average subscription rate coming in at 168.6%, higher than the subscription rate of 104.7% recorded in January 2025. The overall average subscription rate for the 182-day and 364-day paper increased to 157.1% and 198.7% respectively, from 62.6% and 84.9% respectively, while the overall average subscription rate for the 91-day paper decreased to 122.0%, from 259.3% recorded in January 2025. The average yields on the government papers were on a downward trajectory during the month, with the 91-day, 182-day, and 364-day papers yields decreasing by 48.8 bps, 46.0 bps, and 52.8 bps to 9.1%, 9.6%, and 10.8% respectively, from 9.6%, 10.0%, and 11.3% recorded the previous month. For the month of February, the government accepted a total of Kshs 130.9 bn of the Kshs 161.8 bn worth of bids received in T-Bills, translating to an acceptance rate of 80.9% compared to an acceptance rate of 90.6% in the month of January;
During the week, T-bills were oversubscribed, with the overall subscription rate coming in at 152.3%, higher than the subscription rate of 137.3% recorded the previous week. Investors’ preference for the shorter 91-day paper persisted, with the paper receiving bids worth Kshs 18.0 bn against the offered Kshs 4.0 bn, translating to an oversubscription rate of 448.9%, significantly higher than the oversubscription rate of 113.1%, recorded the previous week. The subscription rates for the 182-day and 364-day papers decreased to 69.0% and 117.0% respectively, from the 123.6% and 160.6% recorded the previous week. The government accepted a total of Kshs 36.51 bn worth of bids out of Kshs 36.55 bn bids received, translating to an acceptance rate of 99.9%. The yields on the government papers were on a downward trajectory with the yields on the 182-day paper decreasing the most by 7.2 bps to 9.2% from 9.3% recorded the previous week, while the yields on the 364-day and 91-day papers decreased by 2.6 bps and 1.1 bps to remain relatively unchanged from 10.5% and 8.9% respectively recorded the previous week;
Additionally, February 2025 bonds were oversubscribed, with the overall average subscription rate coming in at 277.0%, higher than the average subscription rate of 196.7% recorded in January 2025. The reopened bonds IFB1/2022/014 and IFB1/2023/017 with tenors to maturity of 11.8 years and 15.1 years respectively and fixed coupon rates of 13.9% and 14.4% respectively, received bids worth Kshs 193.9 bn against the offered Kshs 70.0 bn translating to an oversubscription rate of 277.0%. The government accepted bids worth Kshs 130.8 bn, translating to an acceptance rate of 67.5%, with the average accepted yields coming at 14.0% and 14.3% for the IFB/2022/014 and IFB1/2023/0178 respectively. Given the bonds are tax free, compared to 10.0% withholding tax for other long-term bonds, the effective tax yield is 15.5% and 15.9% for the IFB1/2022/014 and IFB1/2023/017 respectively;
During the month, the government announced its first-ever domestic treasury bond buyback aiming to buyback Kshs 50.0 bn of Kshs 185.1 bn for the FXD1/2020/005, FXD1/2022/003 and IFB1/2016/009 with tenors to maturity of 0.4 years, 0.3 years and 0.4 years respectively, and fixed coupon rates of 11.7%, 11.8% and 12.5% respectively. The offer was oversubscribed, with the overall subscription rate coming in at 112.2%, receiving bids worth Kshs 56.1 bn against the offered Kshs 50.0 bn. The government accepted bids worth Kshs 50.1 bn, translating to an acceptance rate of 89.3%, and equivalent to 27.1% of the total outstanding amount of Kshs 185.1 bn for the three bonds. The weighted average yield for the accepted bids for the FXD1/2022/003, FXD1/2020/005 and IFB1/2016/009 came in at 9.1%, 8.9% and 9.1% respectively, well in line with the treasury bill rates;
The government is looking to raise Kshs 25.0 bn through the reopened bond; FXD1/2018/25 with a tenor to maturity of 18.3 years and a fixed coupon rate of 13.4%. The period of sale opened on Friday, 21st February 2025, and will close on 5th March 2025. Our bidding range for the reopened bond is 13.85%-14.55%;
During the week Kenya National Bureau of Statistics (KNBS) released the inflation rates for February 2025 indicating the y/y inflation in February 2025 increased slightly by 0.2% points to 3.5%, from the 3.3% recorded in January 2025. This was in line with our projected range of 3.4% to 3.5%, where our decision was mainly driven by the easing in the Central Bank Rate (CBR) to 10.75% in February 2025, slight depreciation of the Kenya Shilling against the US Dollar and reduced electricity prices in February 2025. The headline inflation in February 2025 was majorly driven by increase in prices of commodities in the following categories; Food & Non-Alcoholic Beverages, and Transport sector by 6.4% and 0.7% respectively. However, the commodity prices in Housing, Water, Electricity, Gas & other fuels declined by 0.8%;
During the week, Kenya announced plan of buying back the 7-year tenor USD 900.0 mn Eurobond notes issued in 2019, with a maturity of May 2027. In the announcement, Kenya stated that the buyback plan would be financed by issuance of a new Eurobond. This follows a similar and successful buyback of its USD 2.0 bn 10-year tenor Eurobond issued in 2014 in February 2024, four months before its maturity in June 2024, and a recent Kshs 50.0 bn bond buyback in the domestic market;
Equities
During the month of February 2025, the equities market was on an upward trajectory, with NSE 20 gaining the most by 6.4%, while NSE 25, NSE 10 and NASI gained by 4.6%, 4.1% and 3.0% respectively. The equities market positive performance was driven by gains recorded by large-cap stocks such as DTB-K, Stanbic and SCBK Group of 11.4%, 9.5%, and 7.8% respectively. The monthly performance was however weighed down by losses recorded by large cap stocks such as Bamburi of 4.6%;
During the week, the equities market recorded a mixed performance, with NSE 20, NSE 25 and NSE 10 gaining by 2.6%, 0.8% and 0.4% respectively, while NASI declined by 0.5%, taking the YTD performance to gains of 11.7%, 5.4%, 4.0% and 3.0% for NSE 20, NASI, NSE 25 and NSE 10, respectively. The week on week equities market performance was driven by gains recorded by large-cap stocks such as BAT, Equity and Stanbic of 4.1 %, 3.6%, and 2.9% respectively. The performance was, however weighed down by losses recorded by large-cap stocks such as Safaricom and Cooperative Bank of 4.5% and 0.9% respectively;
During the week, British American Tobacco Kenya Plc released their FY’2024 financial results, recording a 19.5% decline in Profits after Tax (PAT) to Kshs 4.5 bn, from Kshs 5.6 bn recorded in FY’2023. The decline in PAT was majorly attributed to the 4.4% increase in the cost of sales to Kshs 18.4 bn in FY’2024, from Kshs 17.6 bn recorded in FY’2023, coupled with the 954.6% increase in the finance costs to a finance loss of Kshs 0.8 bn, from a finance income of Kshs 0.1 bn in FY’2023 that outpaced the 0.6% increase in the net revenue to Kshs 25.7 bn from Kshs 25.6 bn;
During the week, Nairobi Securities Exchange (NSE) announced the suspension in the trading of Bamburi Cement shares, effective February,27 2025 until May, 9 2025. The suspension on trading Bamburi Cement PLC shares was enacted following the company’s successful 96.5% acquisition by Amsons Industries (K) Ltd. The suspension was put in place to facilitate the squeeze out process for Amsons to acquire the remaining 3.5% of Bamburi’s shares;
Insolvency Highlights:
- During the week, Savannah Cement attracted 15 potential buyers after its planned sale was revived, with expectations of more bids before the February 28, 2025, deadline. The cement manufacturer was placed under administration by KCB Bank Kenya and Absa Bank over a Kshs 10.0 billion debt, and its key assets, including industrial property valued at Kshs 10.1 bn, remain central to the bidding process;
- During the week, Proctor & Allan, a leading cereals manufacturer, was placed under receivership due to a Kshs 3.7 bn loan from KCB Group. The company has struggled with competition and economic downturns, exacerbated by its relocation from Nairobi to Limuru. The High Court appointed joint receivers to oversee the restructuring;
- Also, during the month, Multiple Hauliers received a six-month extension for its administration process, which has been ongoing since June 2021. The court barred Prime Bank from selling its Mombasa property, emphasizing a fair restructuring process for all creditors. The firm, burdened with Kshs 14.0 bn in debt, awaits an investor to inject funds for recovery;
Real Estate
During the week, the Central Bank of Kenya (CBK) released the Quarterly Economic Review Q3’2024 Report, which highlighted that the year-on-year (y/y) gross loans advanced to the Real Estate sector increased slightly by 0.1% to Kshs 507.6 bn in Q3’2024, from Kshs 507.0 bn in Q3’2023;
During the week, the Kenyan government announced its plan to pursue an ambitious plan to secure Kshs 9.2 bn from private investors to construct 2,820 affordable homes in Stoni Athi, Machakos County, as part of its Affordable Housing Programme;
Additionally, President William Ruto laid the foundation stone for the Mokowe Affordable Housing Project in Lamu County, marking a significant step in Kenya’s quest to address its housing deficit. This ambitious initiative, located in Mokowe within Lamu West Constituency, comprises 468 residential units and 75 commercial shops, reflecting a broader vision to enhance living standards and stimulate economic growth in the coastal region;
During the week, Marriott International broadened its footprint in Kenya’s luxury safari market through an agreement with Lazizi Group of Companies to develop two exceptional tented camps: The Ritz-Carlton, Masai Mara Safari Camp and JW Marriott Mount Kenya Rhino Reserve Safari Camp;
On the Unquoted Securities Platform, Acorn D-REIT and I-REIT traded at Kshs 25.4 and Kshs 22.2 per unit, respectively, as per the last updated data on 14th February 2025. The performance represented a 27.0% and 11.0% gain for the D-REIT and I-REIT, respectively, from the Kshs 20.0 inception price. Additionally, ILAM Fahari I-REIT traded at Kshs 11.0 per share as of 14th February 2025, representing a 45.0% loss from the Kshs 20.0 inception price;
Money Markets, T-Bills Primary Auction:
During the month of February 2025, T-bills were oversubscribed, with the overall average subscription rate coming in at 168.6%, higher than the subscription rate of 104.7% recorded in January 2025. The overall average subscription rate for the 182-day and 364-day paper increased to 157.1% and 198.7% respectively, from 62.6% and 84.9% respectively, while the overall average subscription rate for the 91-day paper decreased to 122.0%, from 259.3% recorded in January 2025. The average yields on the government papers were on a downward trajectory during the month, with the 91-day, 182-day, and 364-day papers yields decreasing by 48.8 bps, 46.0 bps, and 52.8 bps to 9.1%, 9.6%, and 10.8% respectively, from 9.6%, 10.0%, and 11.3% recorded the previous month. For the month of February, the government accepted a total of Kshs 130.9 bn of the Kshs 161.8 bn worth of bids received in T-Bills, translating to an acceptance rate of 80.9% compared to an acceptance rate of 90.6% in the month of January;
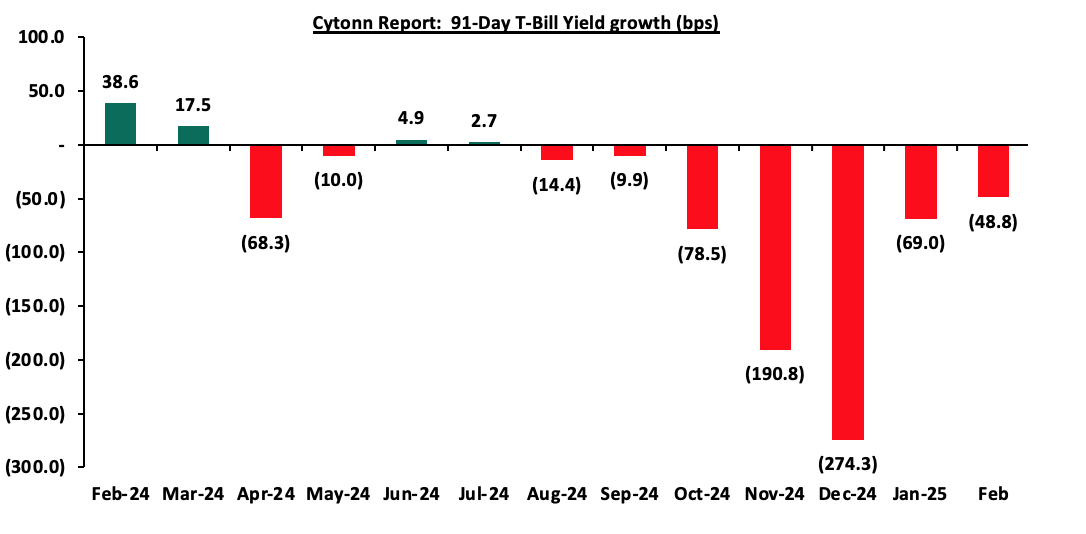
During the week, T-bills were oversubscribed, with the overall subscription rate coming in at 152.3%, higher than the subscription rate of 137.3% recorded the previous week. Investors’ preference for the shorter 91-day paper persisted, with the paper receiving bids worth Kshs 18.0 bn against the offered Kshs 4.0 bn, translating to an oversubscription rate of 448.9%, significantly higher than the oversubscription rate of 113.1%, recorded the previous week. The subscription rates for the 182-day and 364-day papers decreased to 69.0% and 117.0% respectively, from the 123.6% and 160.6% recorded the previous week. The government accepted a total of Kshs 36.51 bn worth of bids out of Kshs 36.55 bn bids received, translating to an acceptance rate of 99.9%. The yields on the government papers were on a downward trajectory with the yields on the 182-day paper decreasing the most by 7.2 bps to 9.2% from 9.3% recorded the previous week, while the yields on the 364-day and 91-day papers decreased by 2.6 bps and 1.1 bps to remain relatively unchanged from 10.5% and 8.9% respectively recorded the previous week;
The charts below show the performance of the 91-day, 182-day and 364-day papers from February 2024 to March 2025:
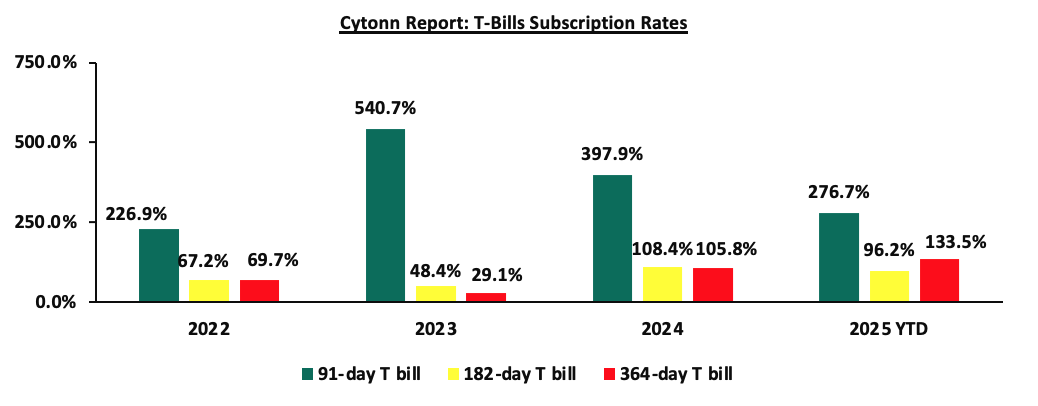
So far in the current FY’2024/25, government securities totaling Kshs 1,244.0 bn have been advertised. The government has accepted bids worth Kshs 1,531.2 bn, of which Kshs 1,002.3 bn and Kshs 529.0 bn were treasury bills and bonds, respectively. The government has a domestic borrowing surplus of Kshs 717.0 bn in FY’2024/25, 20.8% ahead of its net domestic borrowing target of Kshs 593.7 bn for FY’2024/25.
The chart below compares the overall average T-bill subscription rates obtained in 2022,2023, 2024 and 2025 Year-to-date (YTD):
Additionally, February 2025 bonds were oversubscribed, with the overall average subscription rate coming in at 277.0%, higher than the average subscription rate of 196.7% recorded in January 2025. The reopened bonds IFB1/2022/014 and IFB1/2023/017 with tenors to maturity of 11.8 years and 15.1 years respectively and fixed coupon rates of 13.9% and 14.4% respectively, received bids worth Kshs 193.9 bn against the offered Kshs 70.0 bn translating to an oversubscription rate of 277.0%. The government accepted bids worth Kshs 130.8 bn, translating to an acceptance rate of 67.5%, with the average accepted yields coming at 14.0% and 14.3% for the IFB/2022/014 and IFB1/2023/0178 respectively. Given the bonds are tax free, compared to 10.0% withholding tax for other long-term bonds, the effective tax yield is 15.5% and 15.9% for the IFB1/2022/014 and IFB1/2023/017 respectively.
The table below provides more details on the bonds issued in January and February 2025:
|
Cytonn Report: Bond Issuances in January and February 2025 |
||||||||||
|
Issue Date |
Bond Auctioned |
Effective Tenor to Maturity (Years) |
Coupon |
Amount offered (Kshs bn) |
Actual Amount Raised (Kshs bn) |
Total bids received |
Average Accepted Yield |
Subscription Rate |
Acceptance Rate |
|
|
17/02/2025 |
IFB1/2022/014 - Reopened |
11.8 |
13.9% |
70.0 |
65.3 |
93.1 |
14.0% |
277.0% |
67.5% |
|
|
IFB1/2023/017 - Reopened |
15.1 |
14.4% |
65.6 |
100.8 |
14.3% |
|||||
|
20/01/2025 |
FXD1/2022/025 -Reopened |
22.8 |
14.2% |
30.0 |
24.7 |
28.4 |
15.7% |
196.7% |
82.2% |
|
|
FXD1/2018/015-Reopened |
8.3 |
12.7% |
23.8 |
30.6 |
14.2% |
|||||
|
February 2025 Average |
13.5 |
14.2% |
70.0 |
130.8 |
193.9 |
14.1% |
277.0% |
67.5% |
||
|
January 2025 Average |
15.6 |
13.4% |
30.0 |
48.5 |
59.0 |
14.9% |
196.7% |
82.2% |
||
|
2024 Average |
6.7 |
15.6% |
27.7 |
28.9 |
37.9 |
16.7% |
116.8% |
74.9% |
||
During the month, the government announced its first-ever domestic treasury bond buyback aiming to buyback Kshs 50.0 bn of Kshs 185.1 bn for the FXD1/2020/005, FXD1/2022/003 and IFB1/2016/009 with tenors to maturity of 0.4 years, 0.3 years and 0.4 years respectively, and fixed coupon rates of 11.7%, 11.8% and 12.5% respectively. The offer was oversubscribed, with the overall subscription rate coming in at 112.2%, receiving bids worth Kshs 56.1 bn against the offered Kshs 50.0 bn. The government accepted bids worth Kshs 50.1 bn, translating to an acceptance rate of 89.3%, and equivalent to 27.1% of the total outstanding amount of Kshs 185.1 bn for the three bonds. The weighted average yield for the accepted bids for the FXD1/2022/003, FXD1/2020/005 and IFB1/2016/009 came in at 9.1%, 8.9% and 9.1% respectively, well in line with the treasury bill rates;
The government is looking to raise Kshs 25.0 bn through the reopened bond; FXD1/2018/25 with a tenor to maturity of 18.3 years and a fixed coupon rate of 13.4%. The period of sale opened on Friday, 21st February 2025, and will close on 5th March 2025. Our bidding range for the reopened bond is 13.85%-14.55%.
Secondary Bond Market:
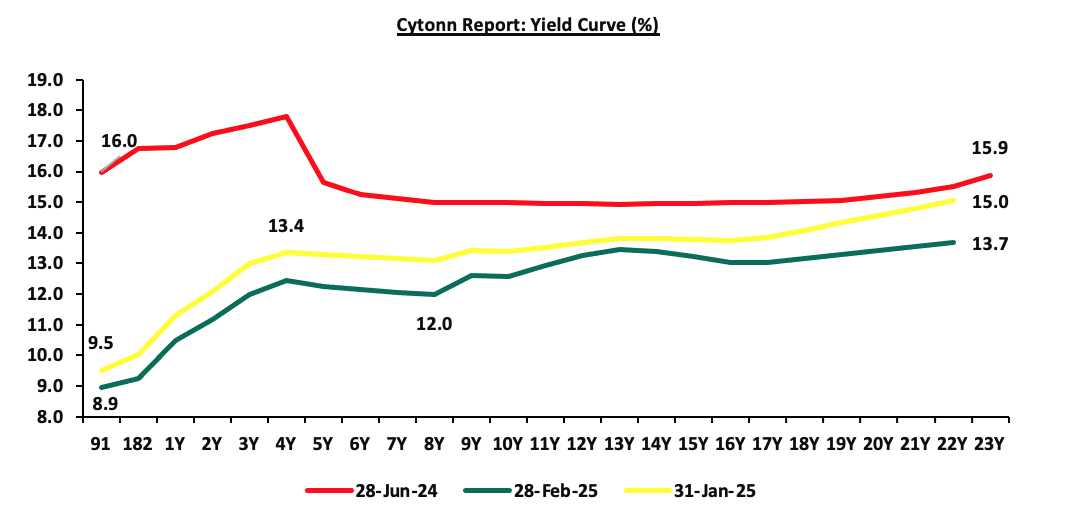
The yields on the government securities were on a downward trajectory during the month compared to January, primarily driven by continued effort by the government to reject highly priced bids, local currency stabilization, and eased inflation. These factors reduced the need for investors to demand higher yields as compensation for inflation and currency depreciation risks, resulting in an overall decline across the yield curve. Notably, the yield curve has adjusted from a humped yield curve observed in 2023 and most part of 2024, towards a normal upward sloping curve, with long-term bonds registering highest yields. The shift in sentiment indicates increased confidence in the economic landscape. The chart below shows the yield curve movement during the period:
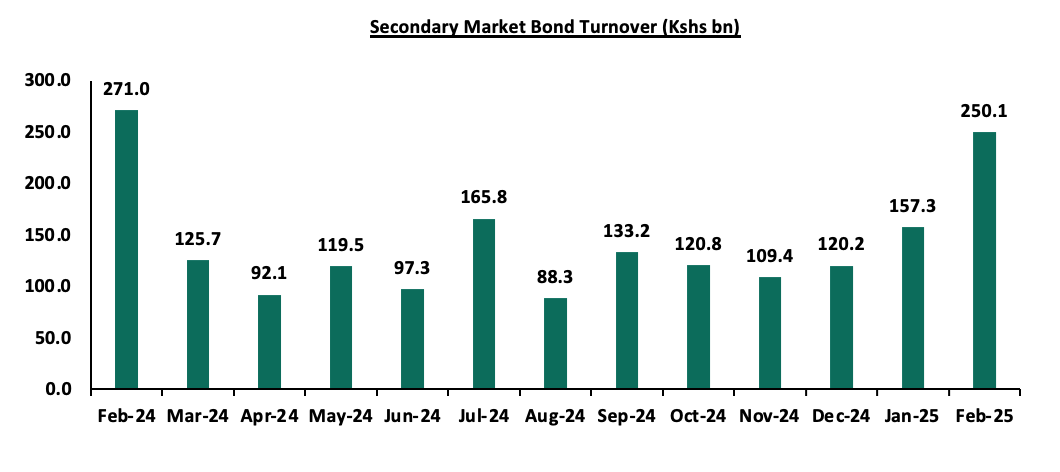
The secondary bond turnover increased significantly by 59.0% to Kshs 250.1 bn, from Kshs 157.3 bn recorded in January 2025, pointing towards increased activities by commercial banks in the secondary bonds market for the month of February. However, on a year-on-year basis, the bond turnover decreased by 7.7% from Kshs 271.0 bn worth of treasury bonds transacted over a similar period last year. The chart below shows the bond turnover over the past 12 months;
Money Market Performance:
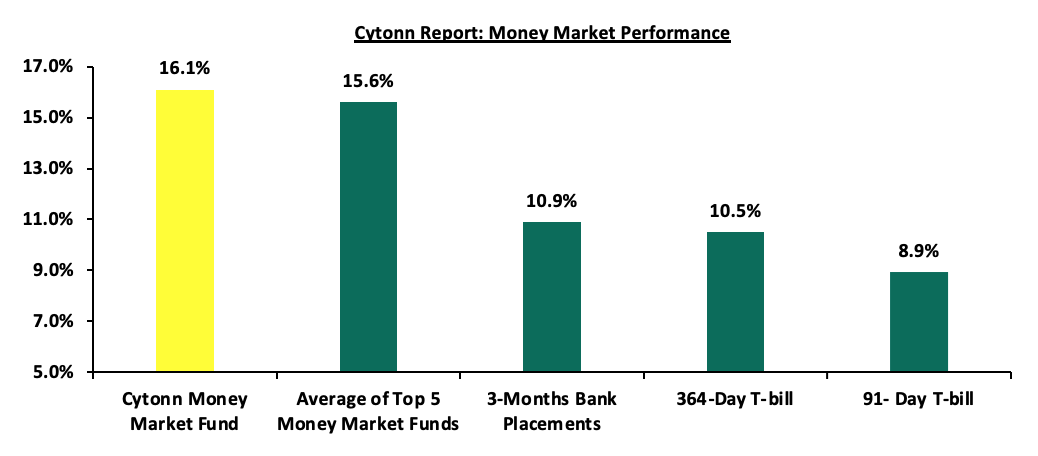
In the money markets, 3-month bank placements ended the week at 10.9% (based on what we have been offered by various banks), and yields on the government papers were on a downward trajectory, with the yields on the 364-day and 91-day papers decreasing by 2.6 bps and 1.1 bps to remain relatively unchanged from 10.5% and 8.9% respectively recorded the previous week. The yield on the Cytonn Money Market Fund decreased marginally by 5.0 bps to close the week at 16.1%, from the 16.2% recorded the previous week, while the average yields on the Top 5 Money Market Funds decreased by 2.4 bps to close the week at 15.6% relatively unchanged from the previous week.
The table below shows the Money Market Fund Yields for Kenyan Fund Managers as published on 28th February 2025:
|
Cytonn Report: Money Market Fund Yield for Fund Managers as published on 28th February 2025 |
||
|
Rank |
Fund Manager |
Effective Annual Rate |
|
1 |
Gulfcap Money Market Fund |
16.3% |
|
2 |
Cytonn Money Market Fund USD (Dial *809# or download the Cytonn app) |
16.1% |
|
3 |
Ndovu Money Market Fund |
15.5% |
|
4 |
Mali Money Market Fund |
15.2% |
|
5 |
Etica Money Market Fund |
14.9% |
|
6 |
Kuza Money Market fund |
14.9% |
|
7 |
Lofty-Corban Money Market Fund |
14.9% |
|
8 |
Arvocap Money Market Fund |
13.8% |
|
9 |
Orient Kasha Money Market Fund |
13.4% |
|
10 |
Genghis Money Market Fund |
13.3% |
|
11 |
British-American Money Market Fund |
12.8% |
|
12 |
GenAfrica Money Market Fund |
12.6% |
|
13 |
Enwealth Money Market Fund |
12.6% |
|
14 |
Madison Money Market Fund |
12.6% |
|
15 |
Old Mutual Money Market Fund |
12.6% |
|
16 |
Dry Associates Money Market Fund |
12.5% |
|
17 |
Nabo Africa Money Market Fund |
12.4% |
|
18 |
Sanlam Money Market Fund |
12.3% |
|
19 |
Apollo Money Market Fund |
12.2% |
|
20 |
Faulu Money Market Fund |
12.1% |
|
21 |
Jubilee Money Market Fund |
12.0% |
|
22 |
Co-op Money Market Fund |
11.8% |
|
23 |
ICEA Lion Money Market Fund |
11.7% |
|
24 |
CIC Money Market Fund |
11.2% |
|
25 |
KCB Money Market Fund |
11.0% |
|
26 |
Absa Shilling Money Market Fund |
11.0% |
|
27 |
AA Kenya Shillings Fund |
10.9% |
|
28 |
Mayfair Money Market Fund |
9.8% |
|
29 |
Stanbic Money Market Fund |
9.1% |
|
30 |
Ziidi Money Market Fund |
7.5% |
|
31 |
Equity Money Market Fund |
6.8% |
Source: Business Daily
Liquidity:
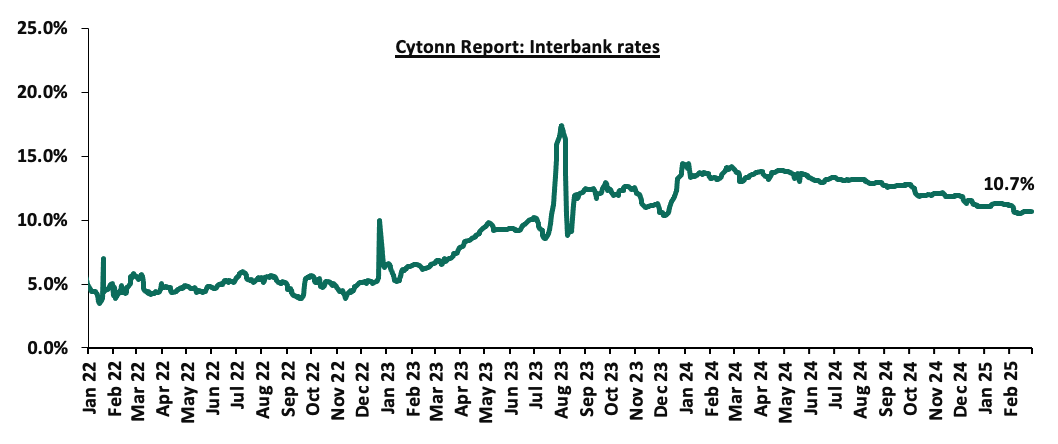
Liquidity in the money markets eased in the month of February 2025, with the average interbank rate decreasing by 52.0 bps to 10.7% from 11.2% recorded the previous month. Additionally, during the month of February, the average interbank volumes traded decreased by 41.3% to Kshs 15.9 bn, from Kshs 27.1 bn recorded in January.
Additionally, during the week, liquidity in the money markets marginally tightened, with the average interbank rate increasing by 3.3 bps, to remain relatively unchanged at 10.7 from the previous week, partly attributable to government payments that were offset by tax remittances. The average interbank volumes traded decreased by 26.4% to Kshs 14.5 bn from Kshs 19.6 bn recorded the previous week. The chart below shows the interbank rates in the market over the years:
Kenya Eurobonds:
During the month, the yields on the Eurobonds were on a downward trajectory, with the yield on the 7-year Eurobond issued in 2019 decreasing the most by 115.0 bps to 7.2% from 8.4% recorded at the beginning of the month.
During the week, the yields on Kenya’s Eurobonds were on a downward trajectory, with the yield on the 7-year Eurobond issued in 2019 decreasing the most by 98.6 bps to 7.2% from 8.2% recorded the previous week. The table below shows the summary performance of the Kenyan Eurobonds as of 27th February 2025;
|
Cytonn Report: Kenya Eurobond Performance |
|||||||
|
|
2018 |
2019 |
2021 |
2024 |
2025 |
||
|
Tenor |
10-year issue |
30-year issue |
7-year issue |
12-year issue |
13-year issue |
7-year issue |
11-year issue |
|
Amount Issued (USD) |
1.0 bn |
1.0 bn |
0.9 bn |
1.2 bn |
1.0 bn |
1.5 bn |
1.5 bn |
|
Years to Maturity |
3.0 |
23.0 |
2.2 |
7.2 |
9.3 |
6.0 |
11.0 |
|
Yields at Issue |
7.3% |
8.3% |
7.0% |
7.9% |
6.2% |
10.4% |
9.9% |
|
02-Jan-25 |
9.1% |
10.3% |
8.5% |
10.1% |
10.1% |
10.1% |
|
|
31-Jan-25 |
8.9% |
10.2% |
8.4% |
9.9% |
10.0% |
10.0% |
|
|
20-Feb-25 |
8.6% |
10.2% |
8.2% |
9.8% |
9.9% |
9.9% |
|
|
21-Feb-25 |
8.6% |
10.2% |
8.2% |
9.7% |
9.8% |
9.8% |
|
|
24-Feb-25 |
8.4% |
10.1% |
7.5% |
9.8% |
9.9% |
9.8% |
|
|
25-Feb-25 |
8.4% |
10.1% |
7.4% |
9.7% |
9.9% |
9.8% |
|
|
26-Feb-25 |
8.1% |
10.0% |
7.3% |
9.5% |
9.6% |
9.6% |
|
|
27-Feb-25 |
8.0% |
10.0% |
7.2% |
9.5% |
9.6% |
9.5% |
9.9% |
|
Weekly Change |
(0.6%) |
(0.1%) |
(1.0%) |
(0.3%) |
(0.3%) |
(0.4%) |
- |
|
MTM Change |
(0.9%) |
(0.2%) |
(1.2%) |
(0.4%) |
(0.3%) |
(0.5%) |
- |
|
YTD Change |
(1.0%) |
(0.2%) |
(1.3%) |
(0.6%) |
(0.5%) |
(0.6%) |
- |
Source: Central Bank of Kenya (CBK) and National Treasury
Kenya Shilling:
During the month, the Kenya Shilling depreciated by 0.5 bps against the US Dollar, to close the month at Kshs 129.2 relatively unchanged from the end of January. During the week, the Kenya Shilling appreciated against the US Dollar by 27.6 bps, to close the week at Kshs 129.2, from 129.6 recorded the previous week. On a year-to-date basis, the shilling has appreciated by 6.2 bps against the dollar, a contrast to the 17.4% appreciation recorded in 2024.
We expect the shilling to be supported by:
- Diaspora remittances standing at a cumulative USD 4,960.2 mn in the twelve months to January 2025, 16.6. % higher than the USD 4,252.0 mn recorded over the same period in 2024.These has continued to cushion the shilling against further depreciation. In the January 2025 diaspora remittances figures, North America remained the largest source of remittances to Kenya accounting for 56.9% in the period,
- The tourism inflow receipts which came in at USD 352 bn in 2023, a 31.5% increase from USD 268.1 bn inflow receipts recorded in 2022, and owing to tourist arrivals that improved by 14.6% to 2,394,376 in 2024 from 2,089,259 in 2023, and,
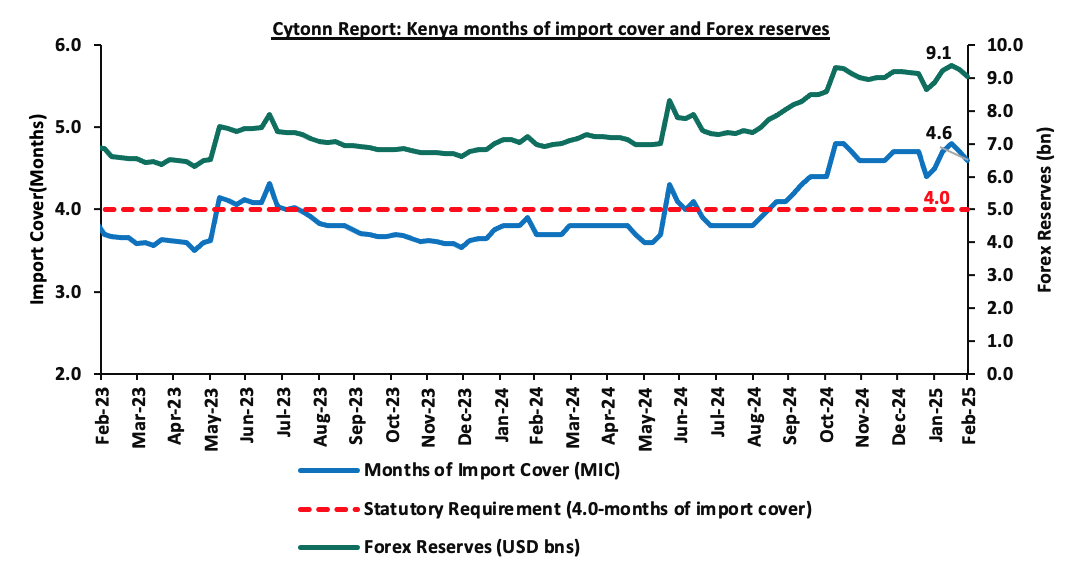
- Improved forex reserves currently at USD 9.1 bn (equivalent to 4.6-months of import cover), which is above the statutory requirement of maintaining at least 4.0-months of import cover and above the EAC region’s convergence criteria of 4.5-months of import cover.
The shilling is however expected to remain under pressure in 2025 as a result of:
- An ever-present current account deficit which came at 4.0% of GDP in Q3’2024, and,
- The need for government debt servicing, continues to put pressure on forex reserves given that 62.1% of Kenya’s external debt is US Dollar-denominated as of September 2024.
Key to note, Kenya’s forex reserves increased by 2.0% during the month of February 2025, to USD 9.1 bn, from the USD 8.9 bn recorded in the previous month, equivalent to 4.6 months of import cover and above the statutory requirement of maintaining at least 4.0-months of import cover. Additionally, during the month, the months of import cover increased to 4.6 from 4.5 recorded in the previous month.
The chart below summarizes the evolution of Kenya's months of import cover over the years:
Weekly Highlights
- Inflation Highlight February 2025
The y/y inflation in February 2025 increased slightly by 0.2% points to 3.5%, from the 3.3% recorded in January 2025. This was in line with our projected range of 3.4% to 3.5%, where our decision was mainly driven by the easing in the Central Bank Rate (CBR) to 10.75% in February 2025, slight depreciation of the Kenya Shilling against the US Dollar and reduced electricity prices in February 2025. The headline inflation in February 2025 was majorly driven by increase in prices of commodities in the following categories; Food & Non-Alcoholic Beverages, and Transport sector by 6.4% and 0.7% respectively. However, the commodity prices in Housing, Water, Electricity, Gas & other fuels declined by 0.8%.
|
Cytonn Report: Major Inflation Changes – February 2025 |
|||
|
Broad Commodity Group |
Price change m/m (February-2025/ January -2025) |
Price change y/y (February-2025/February-2024) |
Reason |
|
Food and non-alcoholic beverages |
0.6% |
6.4% |
The m/m increase was mainly driven by the increase in prices of commodities such as sugar, cooking oil and tomatoes by 3.2%, 1.6% and 1.3% respectively. However, the increase was weighed down by decrease in prices of wheat flour and Irish potatoes by 2.4% and 1.8% respectively |
|
Transport |
0.1% |
0.7% |
The transport index recorded a slight m/m increase mainly due to a 4.8% increase in local flights prices. Prices of Super Petrol and Diesel remained unchanged at Kshs 176.6 and Kshs 167.1 respectively |
|
Housing, water, electricity, gas and other fuels |
0.1% |
(0.8%) |
The slight m/m increase was mainly driven by an increase in prices of gas/LPG by 0.6%. The increase was however weighed down by decrease in prices of 50kWh electricity and 200kWh electricity by 1.4% and 1.2% respectively. |
|
Overall Inflation |
0.3% |
3.5% |
The m/m increase was mainly attributable to the 0.6% increase in Food and non-alcoholic beverages. |
Notably, February’s overall headline inflation increased slightly for the fourth consecutive month, remaining within the CBK’s preferred range of 2.5%-7.5% for the twentieth consecutive month. The increase in headline inflation in February 2025 comes amid the maximum allowed price for Super Petrol and Diesel remaining unchanged at Kshs 176.6 and Kshs 167.1 respectively. The Kenya Shilling also recorded a marginal 0.5 bps month-to-date depreciation as of 28th February 2025 to remain relatively unchanged at Kshs 129.2 and a 6.2 bps year-to-date gain from the Kshs 129.3 recorded at the beginning of the year. This stabilization in the exchange rate and fuel prices is expected to continue anchoring inflationary pressures in the country. The chart below shows the inflation rates for the past 5 years:
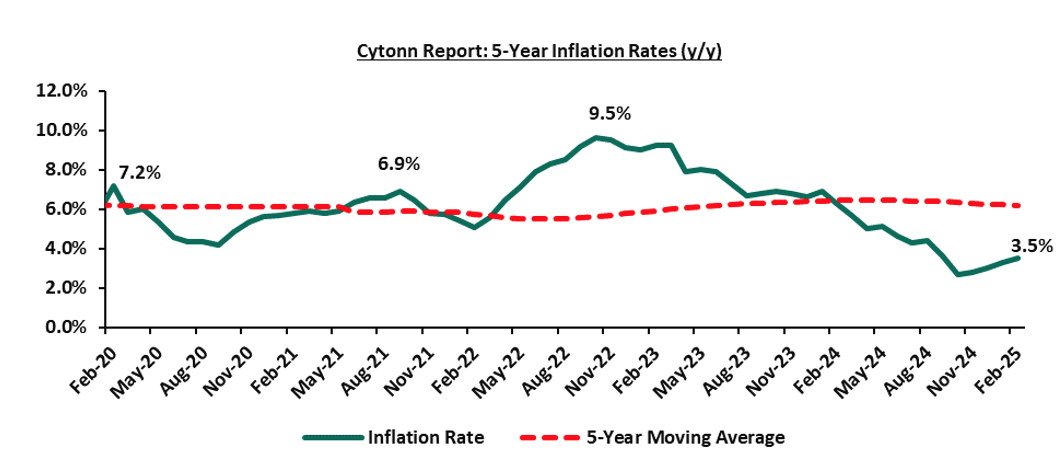
Going forward, we expect inflation to remain within the CBK’s preferred range of 2.5%-7.5%, mainly on the back of a stable currency and stable fuel prices. Additionally, favourable weather conditions will also contribute to stabilizing food prices, further supporting lower inflation rates. The risk, however, lies in the fuel prices which despite their decline over the last months, still remain elevated compared to historical levels. Key to note is that the Monetary Policy Committee cut the Central Bank Rate by 50.0 bps to 10.75% from 11.25% in its February 2025 meeting, with the aim of easing the monetary policy, while maintaining exchange rate stability, and will meet again in April 2025. This cut in the Central Bank Rate is likely to elevate inflationary pressures as consumer spending rises leading to demand- pull inflation. The committee is expected to lower rates further, though gradually, to provide further support for the economy.
- Kenya’s Eurobond Buyback and New Issue
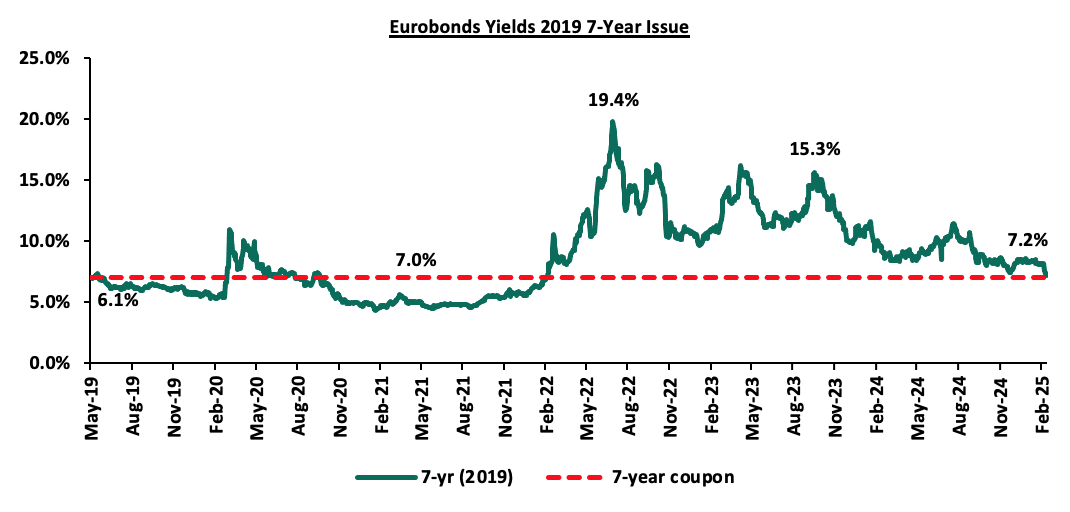
During the week, Kenya announced plan of buying back the 7-year tenor USD 900.0 mn Eurobond tenders issued in 2019 with a maturity of May 2027. In the announcement, Kenya stated that the buyback plan would be financed by issuance a new Eurobond. This followed a similar buyback of its USD 2.0 bn 10-year tenor Eurobond issued in 2014 in February 2024, four months before its maturity date in June 2024. The Kenyan 7-year tenor bond that was issued in 2019 at a coupon rate of 7.0% is due for maturity in May 2027, and was to be repaid in installments of USD 300.0 mn starting from May 2025, into May 2026 and May 2027.
As a result, Kenya issued a new USD 1.5 bn 11-year Eurobond to facilitate the buyback. The Government, on 27th February 2025, announced the results of the tender offer, highlighting that the new issue attracted a yield of 9.95% and a coupon rate of 9.5%. The new Eurobond offer received high traction, receiving tenders worth USD 4.9 bn, translating to a subscription rate of 326.7%, with Kenya accepting bids worth USD 1.5 bn, translating to an acceptance rate of 30.6%. The surplus of 0.6 bn will be used to refinance other existing external debt. Kenya is set to receive loan disbursement of USD 1.5 bn from the UAE.
In the buyback offer, which will close on 3rd March 2025, will see Kenya purchase notes from their holders at a premium. The purchase price is set at USD 1,002.5 per USD 1,000.0 plus the accrued interest payments on the notes. The maximum tender amount for the offer is expected to be equal to the principal amount, which in this case will be USD 900.0 bn. The results of the offer and issue will be announced on the 4th of March 2025 and the settlement date is scheduled for 10th March 2025.
Following the announcement of the buyback, the 2019 7-Year Eurobond saw a sharp decline of 98.9 bps to 7.2% on 27th February 2025 from the 8.2% recorded on 21st February 2025. This reaction can be attributed to a number of factors, including:
- Investor Expectations: Investors interpreted the development as a positive signal from the Kenyan government, showing its commitment to managing its debt profile more efficiently and taking proactive measures to address debt sustainability concerns. This increased investor confidence contributed in driving down the yields.
- Perceived Risk Reduction: The first instalment of the payment of the Eurobond was set on May 2025. The buyback and issuance of the new 11-year bond aims to reduce the pressure of upcoming debt servicing costs. This announcement by Kenya was, therefore, perceived by investors as a positive development, as it reduces the risk of default and improves the creditworthiness of the government.
- Supply & demand dynamics: The buyback announcement of the existing bond pointed to reduced supply of that bond in the market, while the issuance of new bonds likely attracting more investors increased the demand in the market. This change in supply and demand dynamics helped pressure the yields downwards.
The graph below shows the yields for the bond since it was issued in 2019:
In the Sub-Saharan African market, 7 countries issued Eurobonds in 2024 making a revival after a one-year hiatus resulting from high interest rates. Kenya has again in 2025 become the first country in the SSA to tap in to the international markets with this new issue. The table below shows the 2024 and 2025 Eurobond issuance for Sub-Saharan African countries along with their Fitch’s ratings’ Long-Term Foreign Currency IDR:
|
Fitch Rating's Long-Term Foreign-Currency Issuer Default Rating (IDR) |
2024 Eurobond Issues |
2025 Eurobond Issues |
|||||||||
|
Country |
IDR Credit Rating |
Issue Date |
Value USD Mn |
Tenor (Years) |
Coupon Rate |
Issue Date |
Value USD Mn |
Tenor (Years) |
Coupon Rate |
||
|
Ivory Coast
|
BB-
|
Stable
|
Aug-24
|
Jan-24
|
1100.0 |
9 |
7.650% |
|
|
|
|
|
1500.0 |
13 |
8.250% |
|||||||||
|
Benin |
B+ |
Stable |
Feb-25 |
Feb-24 |
750.0 |
14 |
8.375% |
|
|
|
|
|
Kenya |
B- |
Stable |
Jan-25 |
Feb-24 |
1500.0 |
7 |
9.750% |
Feb-25 |
1500.0 |
11 |
9.500% |
|
Senegal |
B- |
Stable |
Nov-24 |
Jun-24 |
750.0 |
7 |
7.750% |
|
|
|
|
|
Cameroon |
B |
Negative |
May-24 |
Jul-24 |
550.0 |
7 |
10.750% |
|
|
|
|
|
South Africa |
BB- |
Stable |
Sep-24 |
Nov-24 |
2000.0 |
12 |
7.100% |
|
|
|
|
|
1500.0 |
30 |
7.950% |
|||||||||
|
Nigeria |
B- |
Positive |
Nov-24 |
Dec-24 |
700.0 |
6.5 |
9.625% |
|
|
|
|
|
1500.0 |
10 |
10.375% |
|||||||||
Questions have been raised on whether Kenya will be able to meet its obligations on the debt and how it would affect the country’s credit ratings. According to Moody’s, S&P Global, and Fitch Kenya’s credit rating currently stands at Caa1 (Positive), B- (Stable), and B (Stable) respectively. Kenya’s high public debt to GDP ratio of 66.6% as of September 2024, which is 16.6% points higher than the IMF recommended threshold of 50.0%, has compounded these concerns. Kenya is retiring its 7-Year 2019 USD 900.0 mn Eurobond which has a lower coupon of 7.0% by issuing a new USD 1.5 bn Eurobond at a significantly higher rate of 9.5% implying the country is replacing a cheaper debt with a more expensive one, increasing its future interest costs. However, Kenya managed to have a buyback and new issue run concurrently in the market. Kenya’s Eurobond buyback is a strategic move aimed at managing its external debt and easing repayment pressure to reduce refinancing risks and prevent disruptions in the economy.
Monthly Highlights:
- During the month, the Monetary Policy Committee met on February 5th, 2024, to review the outcome of its previous policy decisions against a backdrop of improved global outlook for growth, lower but sticky inflation in advanced economies as well as the persistent geopolitical tensions. The MPC decided to lower the CBR rate by 50.0 bps to 10.75%, from 11.25% .For more information please see our Cytonn weekly #6/2025
- During the month, Stanbic Bank released its monthly Purchasing Manager's Index (PMI) highlighting that the index for the month of January 2025 dropped slightly, coming in at 50.5, down from 50.6 in December 2024, signaling another marginal improvement in business conditions, though at a slower pace. For more information please see our Cytonn weekly #6/2025
- During the month the Energy and Petroleum Regulatory Authority (EPRA) released their monthly statement on the maximum retail fuel prices in Kenya, effective from 15th February 2025 to 14th March 2025. Notably, the maximum allowed prices for Super Petrol, Diesel, and Kerosene remained unchanged at Kshs 176.6, Kshs 167.1, and Kshs 151.4 per litre respectively. For more information please see our Cytonn weekly #7/2025
- During the month the National Treasury gazetted the revenue and net expenditures for the seventh month of FY’2024/2025, ending 31st January 2025, highlighting that the total revenue collected as at the end of January 2025 amounted to Kshs 1,352.8 bn, equivalent to 51.4% of the revised estimates of Kshs 2,631.4 bn for FY’2024/2025 and is 88.1% of the prorated estimates of Kshs 1,535.0 bn. For more information please see our Cytonn weekly #8/2025
Rates in the Fixed Income market have been on a downward trend due to high liquidity in the money market which allowed the government to front load most of its borrowing. The government is 79.4% ahead of its prorated net domestic borrowing target of Kshs 399.6 bn, and 20.8% ahead of the total FY’2024/25 net domestic borrowing target of Kshs 593.7 bn, having a net borrowing position of Kshs 717.0 bn (inclusive of T-bills). However, we expect a continued downward readjustment of the yield curve in the short and medium term, with the government looking to increase its external borrowing to maintain the fiscal surplus, hence alleviating pressure in the domestic market. As such, we expect the yield curve to normalize in the short to medium-term and hence investors are expected to shift towards the long-term papers to lock in the high returns
Market Performance:
During the month of February 2025, the equities market was on an upward trajectory, with NSE 20 gaining the most by 6.4%, while NSE 25, NSE 10 and NASI gained by 4.6%, 4.1% and 3.0% respectively. The equities market positive performance was driven by gains recorded by large-cap stocks such as DTB-K, Stanbic and SCBK Group of 11.4%, 9.5%, and 7.8% respectively. The monthly performance was however weighed down by losses recorded by large cap stocks such as Bamburi of 4.6%.
During the week, the equities market recorded a mixed performance, with NSE 20, NSE 25 and NSE 10 gaining by 2.6%, 0.8% and 0.4% respectively, while NASI declined by 0.5%, taking the YTD performance to gains of 11.7%, 5.4%, 4.0% and 3.0% for NSE 20, NASI, NSE 25 and NSE 10, respectively. The week on week equities market performance was driven by gains recorded by large-cap stocks such as BAT, Equity and Stanbic of 4.1 %, 3.6%, and 2.9% respectively. The performance was, however weighed down by losses recorded by large-cap stocks such as Safaricom and Cooperative Bank of 4.5% and 0.9% respectively.
Equities turnover decreased by 10.8% in the month of February 2025 to USD 66.0 mn, from USD 74.0 mn recorded in January 2025. Foreign investors remained net sellers, with a net selling position of USD 9.9 mn, an increase from a net selling position of USD 8.1 mn recorded in January 2025.
During the week, equities turnover decreased by 14.8% to USD 13.7 mn from USD 16.0 mn recorded the previous week, taking the YTD total turnover to USD 139.9 mn. Foreign investors became net sellers for the first time in two weeks with a net selling position of USD 2.0 mn, from a net buying position of USD 0.7 mn recorded the previous week, taking the YTD foreign net selling position to USD 18.0 mn, compared to a net selling position of USD 16.9 mn recorded in 2024.
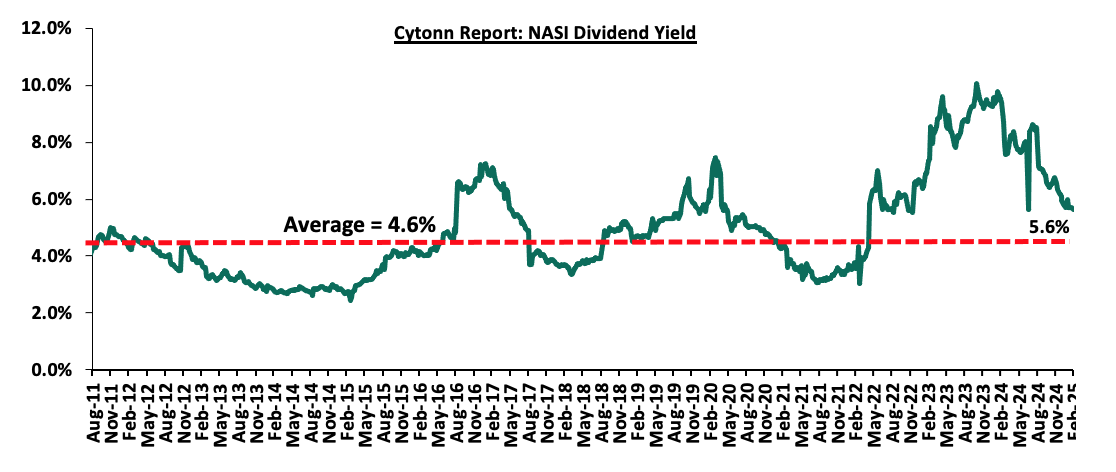
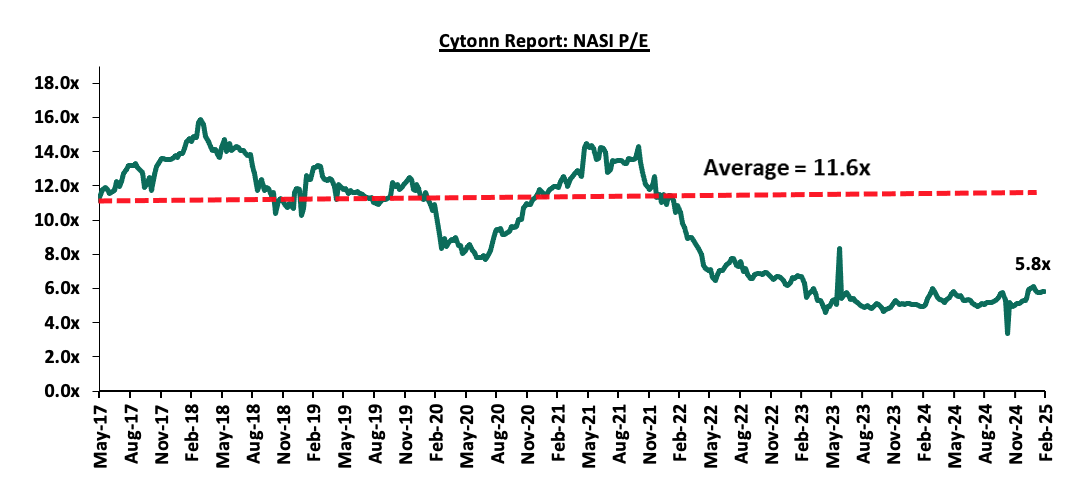
The market is currently trading at a price-to-earnings ratio (P/E) of 5.8x, 49.7% below the historical average of 11.6x. The dividend yield stands at 5.6%, 1.0% points above the historical average of 4.6%. Key to note, NASI’s PEG ratio currently stands at 0.7x, an indication that the market is undervalued relative to its future growth. A PEG ratio greater than 1.0x indicates the market is overvalued while a PEG ratio less than 1.0x indicates that the market is undervalued. The charts below indicate the historical P/E and dividend yields of the market;
Universe of Coverage:
|
Cytonn Report: Equities Universe of Coverage |
|
||||||||||||
|
Company |
Price as at 21/02/2025 |
Price as at 28/02/2025 |
w/w change |
m/m change |
YTD Change |
Year Open 2025 |
Target Price* |
Dividend Yield*** |
Upside/ Downside** |
P/TBv Multiple |
Average |
|
|
|
Jubilee Holdings |
204.3 |
205.3 |
0.5% |
2.6% |
17.5% |
174.8 |
260.7 |
7.0% |
34.0% |
0.3x |
Buy |
|
|
|
Equity Group |
47.0 |
48.7 |
3.6% |
3.2% |
1.5% |
48.0 |
60.2 |
8.2% |
31.8% |
1.0x |
Buy |
|
|
|
Co-op Bank |
17.0 |
16.9 |
(0.9%) |
1.8% |
(3.4%) |
17.5 |
18.8 |
8.9% |
20.5% |
0.8x |
Buy |
|
|
|
NCBA |
49.3 |
50.3 |
2.0% |
3.6% |
(1.5%) |
51.0 |
53.2 |
9.5% |
15.3% |
0.9x |
Accumulate |
|
|
|
KCB Group |
44.0 |
45.0 |
2.3% |
5.1% |
6.0% |
42.4 |
50.3 |
0.0% |
11.9% |
0.7x |
Accumulate |
|
|
|
ABSA Bank |
19.0 |
19.0 |
0.3% |
5.8% |
0.8% |
139.8 |
145.3 |
8.2% |
8.7% |
1.5x |
Hold |
|
|
|
CIC Group |
2.9 |
3.0 |
4.5% |
10.3% |
40.2% |
18.9 |
19.1 |
4.3% |
7.7% |
0.9x |
Hold |
|
|
|
Standard Chartered Bank |
293.0 |
300.3 |
2.5% |
7.8% |
5.3% |
285.3 |
291.2 |
9.7% |
6.6% |
2.0x |
Hold |
|
|
|
Diamond Trust Bank |
77.8 |
78.0 |
0.3% |
11.4% |
16.9% |
66.8 |
71.1 |
6.4% |
6.5% |
0.3x |
Hold |
|
|
|
Stanbic Holdings |
148.0 |
152.3 |
2.9% |
9.5% |
8.9% |
2.1 |
2.8 |
10.1% |
5.5% |
1.0x |
Hold |
|
|
|
I&M Group |
35.4 |
36.0 |
1.7% |
6.7% |
(0.1%) |
36.0 |
32.3 |
7.1% |
(3.1%) |
0.7x |
Sell |
|
|
|
Britam |
7.3 |
7.8 |
6.3% |
7.2% |
33.7% |
5.8 |
7.5 |
0.0% |
(3.6%) |
1.1x |
Sell |
|
|
|
*Target Price as per Cytonn Analyst estimates **Upside/ (Downside) is adjusted for Dividend Yield ***Dividend Yield is calculated using FY’2023 Dividends |
|||||||||||||
Weekly Highlights:
- British American Tobacco (BAT) Kenya Plc FY’2024 Financial Performance
During the week, British American Tobacco Kenya Plc released their FY’2024 financial results, recording a 19.5% decline in Profits after Tax (PAT) to Kshs 4.5 bn, from Kshs 5.6 bn recorded in FY’2023. The decline in PAT was majorly attributed to the 4.4% increase in the cost of sales to Kshs 18.4 bn in FY’2024, from Kshs 17.6 bn recorded in FY’2023, coupled with the 954.6% increase in the finance costs to a finance loss of Kshs 0.8 bn, from a finance income of Kshs 0.1 bn in FY’2023 that outpaced the 0.6% increase in the net revenue to Kshs 25.7 bn from Kshs 25.6 bn. The tables below show the breakdown of BAT’s FY’2024 financial performance;
|
Cytonn Report: British American Tobacco (BAT) Kenya Plc Summarized Income Statement |
|||
|
Income Statement |
FY’2023 |
FY’2024 |
Y/Y Change |
|
Kshs (bn) |
Kshs (bn) |
||
|
Gross Sales including Indirect Taxes |
41.2 |
41.1 |
(0.4%) |
|
Excise Duty and Value-Added Taxes |
(15.7) |
(15.4) |
(2.1%) |
|
Net Revenue |
25.6 |
25.7 |
0.6% |
|
Cost of operations |
(17.6) |
(18.4) |
4.4% |
|
Profit from operations |
7.9 |
7.3 |
(7.7%) |
|
Gross Margin |
31.0% |
28.4% |
(2.6%) |
|
Net Finance Costs |
0.1 |
(0.8) |
954.6% |
|
Profit Before Income Tax |
8.0 |
6.5 |
(19.2%) |
|
Income Tax Expenses |
(2.5) |
(2.0) |
(18.5%) |
|
Profit After Tax |
5.6 |
4.5 |
(19.5%) |
|
Dividend Per Share (Kshs) |
50.0 |
50.0 |
0.0% |
|
Dividend Yield |
12.0% |
13.2% |
1.1% |
|
Dividend Payout |
85.1% |
104.9% |
19.8% |
|
Earnings Per Share (Kshs) |
55.7 |
44.8 |
(19.5%) |
Source: British American Tobacco (BAT) Kenya Plc FY’2024 Financial Report
|
Cytonn Report: British American Tobacco (BAT) Kenya Plc Summarized Balance Sheet |
|||
|
Balance Sheet |
FY’2023 |
FY’2024 |
Y/Y Change |
|
Kshs (bn) |
Kshs (bn) |
||
|
Current Assets |
12.2 |
13.6 |
11.0% |
|
Non-Current Assets |
11.8 |
10.1 |
(14.8%) |
|
Total Assets |
24.1 |
23.7 |
(1.6%) |
|
Current Liabilities |
5.8 |
6.0 |
3.9% |
|
Non-Current Liabilities |
2.0 |
1.9 |
(5.2%) |
|
Total Liabilities |
7.8 |
7.9 |
1.6% |
|
Total Equity |
16.3 |
15.7 |
(3.2%) |
|
Total Equity and Liabilities |
24.1 |
23.7 |
(1.6%) |
Source: British American Tobacco (BAT) Kenya Plc FY’2024 Financial Report
Key take outs from the financial performance include;
- Net revenue increased by 0.6% to Kshs 25.7 bn in FY’2024, from Kshs 25.6 bn recorded in FY’2023, mainly driven by the 2.1% decrease in indirect taxes that came in at Kshs 15.4 bn in FY’2024, from Kshs 15.7 bn in FY’2023. The growth was however weighed down by the 0.4% decline in gross sales to Kshs 41.1 bn in 2024, from Kshs 41.2 bn in 2023.
- Net finance costs increased significantly by 954.6% to a net finance loss of Kshs 0.8 bn from a net finance income of Kshs 0.1 bn in FY’2023, attributable to the 17.4% appreciation of the Shilling against the dollar in 2024, leading to exchange losses,
- Cost of sales increased by 4.4% to Kshs 18.4 bn in FY’2024, from Kshs 17.6 bn in FY’2023, largely driven by the higher cost of doing business that offset the company’s cost saving initiatives such as optimization of raw materials sourcing and adopting digital solutions for warehouse and logistics management implemented during the period,
- The Group’s balance sheet contracted as total assets declined by 1.6% to Kshs 23.7 bn in FY’2024, from Kshs 24.1 bn in FY’2023, majorly attributable to the 14.8% decrease in the non-current assets to Kshs 10.1 bn from Kshs 11.8 bn in FY’2023,
- The Group’s current liabilities increased by 3.9% to Kshs 6.0 bn in FY’2024, from Kshs 5.8 bn recorded in FY’2023, mainly attributable to an increase in short term loans coupled with the significant decline in the net financial income to a loss of Kshs 0.8 bn in FY’2024, from a financial income of Kshs 0.1 bn recorded in FY’2023,
- Earnings per share decreased significantly by 19.5% to Kshs 44.8 in FY’2024, from Kshs 55.7 in FY’2023, due to the 19.5% decline in profit after tax to Kshs 4.5 bn in FY’2024, from Kshs 5.6 bn recorded in FY’2023, and,
- The board of directors proposed a final dividend of Kshs 45.0 per share with an expected book closure on 23rd May 2025 and a payment date of on or about 25th June 2024. The total dividend to be paid for the FY’2024 amounts to Kshs 50.0 per share, translating to a dividend yield of 13.2%, as at 28th February 2024 and a dividend payout ratio of 104.9%, compared to a dividend yield and payout ratio of 12.0% and 85.1% respectively in a similar period in 2024 for FY’2023 dividend.
BAT’s profit after tax dropped by 19.5% to Kshs 4.5 billion in FY 2024, down from Kshs 5.6 billion in FY 2023, highlighting a challenging year for the business. The tough operating environment was characterized by the local currency’s appreciation, resulting in significant foreign exchange losses from exports traded in USD, alongside higher taxes and elevated borrowing costs. Additionally, the company faced challenges due to unclear and prolonged regulatory issues, hindering the sale of modern oral nicotine pouches in the local market. This, in turn, affected their ability to fully operationalize their manufacturing facility in Nairobi. The increase in taxes continues to weigh down on the Group’s overall performance and profitability. Key to note, the Group’s announcement of a final dividend of Kshs 45.0 per share for the period ending 31st December 2024, adding to the interim dividend of Kshs 5.0 per share brings the total dividend for FY’2024 to Kshs 50.0, unchanged from Kshs 50.0 total dividend per share paid in FY’2023, despite a 19.5% decline in PAT which is expected to improve investors’ confidence in the Group’s stock. Due to the restriction on selling modern oral nicotine pouches in the local market, the Company decided to accept offers for the disposal of related machinery to safeguard shareholder value. The company continues to engage transparently on establishing a sustainable regulatory framework to facilitate the resumption of commercial operations in the modern oral nicotine category. Going forward BAT’s profit margins remain under pressure due to the rising taxes and regulatory challenges impacting their sale of modern oral nicotine pouches leading to subdued revenue growth. However, the company’s commitment to shareholder returns through consistent dividend payments will likely uphold investor confidence in the stock.
- Suspension in the Trading of Bamburi Cement Plc Securities Highlight
During the week, Nairobi Securities Exchange (NSE) announced the suspension in the trading of Bamburi Cement shares, effective February,27 2025 until May, 9 2025. The suspension on trading Bamburi Cement PLC shares was lifted following the company’s successful buyout by Amsons Industries (K) Ltd. The suspension was put in place to facilitate the squeeze out process for Amsons to acquire the remaining 3.5% of Bamburi’s shares.
Holcim, the previous majority shareholder, sold its 58.6% stake in Bamburi to Amsons Industries. Amsons was in a competing bid with Savannah Clinker, however, Savannah Clinker withdrew its bid before the offer closure date, leaving Amsons as the sole bidder. Consequently, Amsons acquired 96.5% of Bamburi’s shares for Kshs 23.5 bn, aligning with its objectives to expand various industries across East Africa.
Apart from the 58.6% stake held by Holcim, Kenyan individuals and organizations owned 32.1%, while foreigners held 9.2% of Bamburi’s shareholding. Amsons’ offer to acquire 100.0% of Bamburi's shares, however, was unsuccessful, resulting in a 96.5% acquisition. As a result, the Capital Markets Authority (CMA) allowed the suspension of trading Bamburi’s shares to enable Amsons to acquire the remaining 3.5% from the shareholders. According to the Capital Markets Act, an investor holding more than 90.0% of the shares, can offer the remaining shareholders either the current market price of the voting shares or the price offered to other shareholders, whichever is higher. Amsons offered acquisition of the shares at Kshs 65.0 per share on 24th July 2024. Consequently, Amsons will buy the remaining 12.6 mn shares at Kshs 65.0 per share at Kshs 815.8 mn.
The Capital Markets Authority approved the suspension in accordance with Regulation 73(2)(d) of the Capital Markets (Public Offers, Listings and Disclosures) Regulations, 2023. Bamburi Cement PLC has been listed on the Nairobi Securities Exchange (NSE) since 1970 and is not listed on any other stock exchange. Amsons will delist Bamburi from the NSE after acquiring more than the 75.0% stakehold needed for delisting.
As of 28th February 2025, Bamburi Cement Plc had a Market Cap of 20.5 bn. The share price had gained by 2.7% on a year-to-date basis, trading at Kshs 56.5 as of 28th February 2025, up from Kshs 55.0 at the beginning of the year.
- Insolvency
During the week, the planned sale of Savannah Cement attracted 15 local and international suitors, with expectations of more firms picking up bid documents before the February 28, 2025 deadline. The bidding window was extended after the initial sale process was canceled due to bidders failing to meet conditions. Savannah Cement was placed under administration by KCB Bank Kenya and Absa Bank in May 2023, over a Ksh10.0 bn debt, though its financial troubles date back to November 2022, when it unsuccessfully attempted administration while struggling with Kshs14.1 bn in debt. Its largest asset, industrial property valued at Kshs10.1 bn, and a 2.5-acre Kitengela land worth Kshs 0.8 bn, remain key attractions for bidders. KCB Bank is owed Kshs 8.9 bn, while Absa Bank has Ksh 5.2 bn in exposure, making them preferential creditors. Despite this, administrator Peter Kahi remains optimistic about finding buyers, citing the region’s cement demand outpacing supply.
Also, during the week Proctor & Allan, a leading cereals manufacturer, was placed under receivership over a Kshs 3.7 bn KCB Group loan. The High Court appointed Ponangipalli Venkata Ramana Rao and Swaroop Rao Ponangipalli as joint receivers, effective February 24, 2025. The move follows the company’s struggle to service its debt, exacerbated by competition and economic downturns since relocating from Nairobi’s Lusaka Road to Limuru.
During the month, the High Court extended the administration of Multiple Hauliers for another six months, keeping the company under administration for nearly three years since it was placed in administration on June 7th, 2021. The court also barred Prime Bank from proceeding with a commercial suit seeking the sale of the company’s Mombasa Property, ruling that it would be prejudicial to the ongoing administration process and unfair to other creditors. Multiple Hauliers has been struggling with a total debt of Kshs 14.0 bn, with major creditors including NCBA Bank, which is owed Kshs 7.2 bn, KCB Bank at Kshs 3.6 bn, Synergy Credit Limited at Kshs 0.5 bn and the National Social Security Fund at Kshs 6.9 mn. The court also upheld restraining orders preventing secured creditors like KCB, Cooperative Bank, and NCBA from auctioning company assets, emphasizing the need to complete the restructuring process. The official receiver, tasked with overseeing the company’s financial recovery, has been given additional time to secure an investor to inject funds for debt settlement, with the company's fate hinging on the success of these efforts.
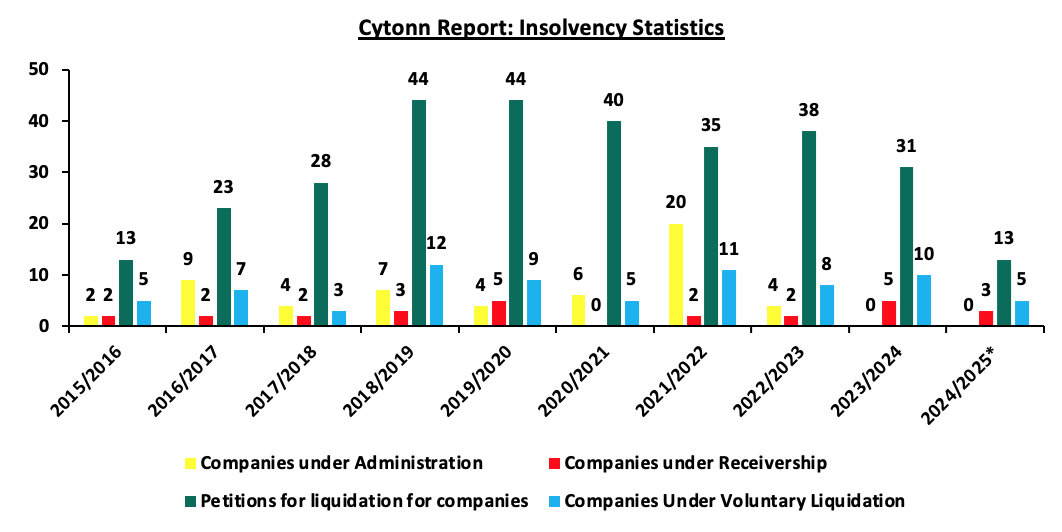
According to the latest statistics by the Kenya’s State Receiver’s office, the total number of petitions for liquidation of companies by courts has averaged 31 every year. Additionally, on average, the total number of companies under administration, companies under receivership, and companies under voluntary liquidation during each year is 6, 2, and 7, respectively. This situation is partly attributable to the increase in Gross non-performing loans due to a tough business environment.
The graph below shows the trend in the number of applications for insolvency during each year;
Source: Cytonn Research
Kenya’s business environment remains challenging, with firms grappling with high debt levels, economic slowdowns, and stiff competition. The reduced access to credit by the private sector due to high borrowing costs and a tough operating climate, making it hard to honor debt maturities have led to an increase in corporate insolvencies. The insolvency process, often marked by administration and receivership, aims to restructure firms and preserve value for creditors while ensuring business continuity where possible. However, lengthy legal proceedings, personal interests by insolvency practitioners and creditor disputes often complicate recovery efforts, making asset sales and investor attraction the norm to resolving financial distress.
Monthly Highlights
- Kenya Electricity Generating Company (KenGen) H1’2025 Financial Performance
During the month, Kenya Electricity Generating Company (KenGen), released its H1'2025 financial results for the period ended 31st December 2024, recording a Profit After Tax (PAT) of Kshs 5.3 bn, a 79.0% increase from the Kshs 3.0 bn recorded in H1’2024, majorly attributable to the 13.7% decrease in operating expenses to Kshs 17.7 bn from Kshs 20.5 bn recorded in H1’2024, which was driven by cost optimization strategies and cutting edge-efficiency enhancements across the power plants. However, net revenue decreased by 5.6% to Kshs 23.4 bn in H1’2025, from Kshs 24.7 bn in H1’2024 mainly driven by the 3.6% decrease in topline revenue to Kshs 27.5 bn from Kshs 28.5 bn in H1’2024. Notably, finance costs reduced by 23.8% to Kshs 1.1 bn, from Kshs 1.5 bn in H1’2024, showcasing improved capital efficiency and optimized debt management. Please see our Cytonn Weekly #06/2025 for more info
We are “Bullish” on the Equities markets in the short term due to current cheap valuations, lower yields on short-term government papers and expected global and local economic recovery, and, “Neutral” in the long term due to persistent foreign investor outflows. With the market currently trading at a discount to its future growth (PEG Ratio at 0.7x), we believe that investors should reposition towards value stocks with strong earnings growth and that are trading at discounts to their intrinsic value. We expect the current high foreign investors sell-offs to continue weighing down the economic outlook in the short term.
- Industry Report
- Q3’2024 Economic Review by Central Bank of Kenya (CBK)
During the week, the Central Bank of Kenya (CBK) released the Q3’2024 Economic Review Report, which highlighted the status and performance of Kenya’s economy of the period under review. The following were the key take outs from the report, with regards to the Real Estate and related sectors;
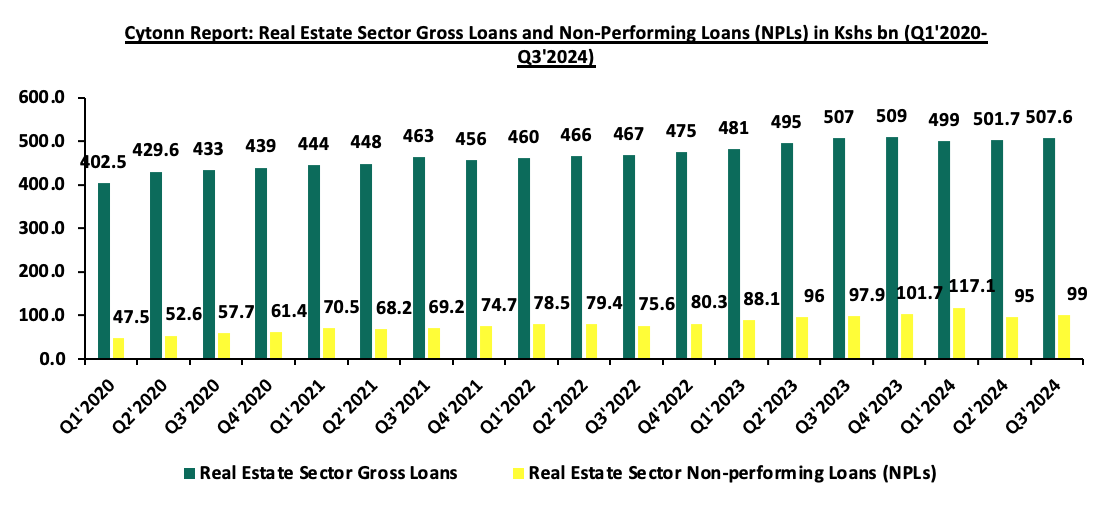
- The year-on-year (y/y) gross loans advanced to the Real Estate sector increased slightly by 0.1% to Kshs 507.6 bn in Q3’2024, from Kshs 507.0 bn in Q3’2023. The advanced loans also represented a 1.2% quarter-on-quarter (q/q) increase from Kshs 501.7 bn realized in Q2’2024. The slight increase is attributable to the prevailing demand for Real Estate funding in the country, however this was weighed down by 8.4% decrease in value of buildings approved to Kshs 55.9 bn in Q3’2024 from Kshs 61.1 bn in Q3’2023 in the Nairobi Metropolitan Area (NMA)
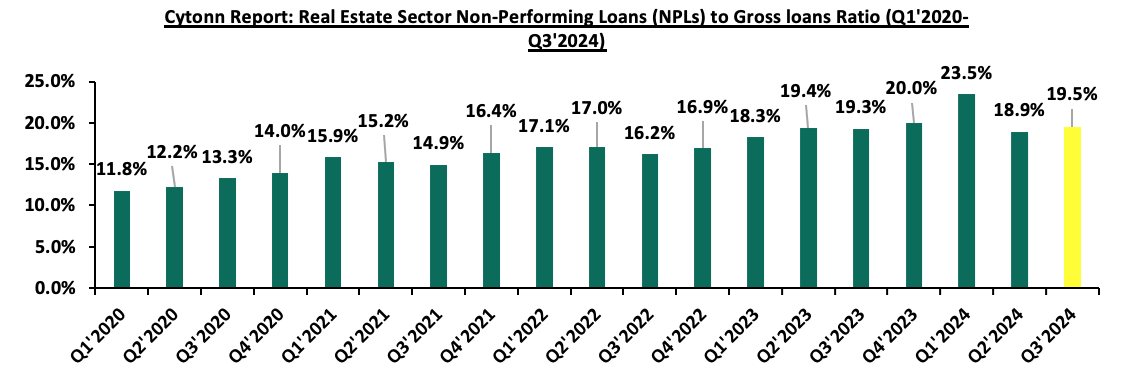
- The gross Non-Performing Loans (NPLs) in the Real Estate sector realized a slight y/y increase of 1.1% to Kshs 99.0 bn in Q3’2024, from Kshs 97.9 bn in Q3’2023, equivalent to 19.5% of the total loans advanced compared to 19.3% recorded in the same period in 2023. This increase can be attributed to; i) Slow uptake of properties due to the economic and political demonstrations ongoing during the quarter which made it hard for developers and practitioners in real estate to fail meeting their financial obligations ii) higher existing taxes and new tax implementations, and, iii) Long incubation periods for real estate projects, and, iv) increased cost of borrowing. The graph below shows the Gross Loans advanced to the Real Estate sector against Non-Performing Loans in the sector from Q1’2020 to Q3’2024;
Source: Central Bank of Kenya (CBK)
The graph below shows the Gross NPLs to Gross Loans ratio extended to the Real Estate sector from Q1’2020 to Q3’2024;
Source: Central Bank of Kenya (CBK)
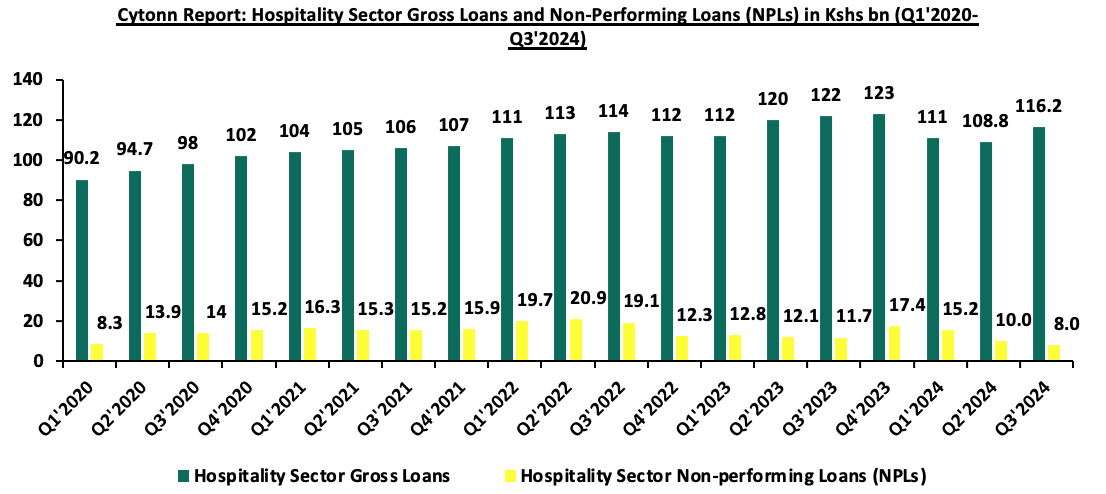
- The gross loans advanced to the hospitality sector decreased by 4.8% to Kshs 116.2 bn in Q3’2024, from Kshs 122.0 bn in Q3’2023 on a y/y basis. On q/q basis, the performance represented 6.8% points increase to Kshs 116.2 bn recorded in Q3’2024 from Kshs 108.8 bn in Q2’2024. The y/y decrease can be attributed to increased borrowing costs which discouraged borrowing, even as banks imposed more stringent measures to cab non-performance, while the increase on q/q comparison is partly attributable to easing of the monetary policies whereby the MPC decided to lower the CBR rate by 0.25% points to 12.75% in August 2024 from 13.0% in June 2024, which could have spurred more borrowing in the sector in Q3’2024.
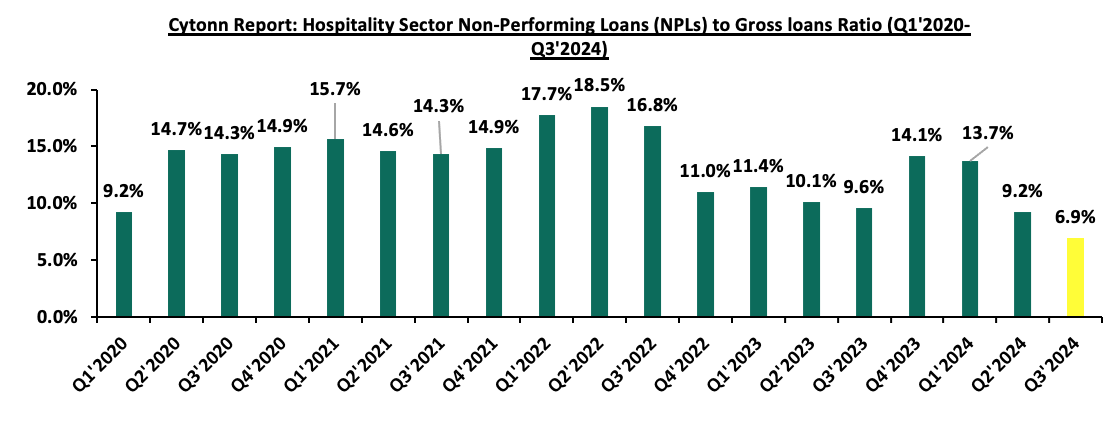
- Gross NPLs in the hospitality sector reduced on a y/y basis by 31.6% to Kshs 8.0 bn in Q3’2024 from Kshs 11.7 bn in Q3’2023 equivalent to 6.9% of total loans advanced as compared to 9.6% in Q3’2023. The performance can be attributed to; i) the sector expansion by 13.7% in Q3’2024 at the back of increased international arrivals through Jomo Kenyatta International Airport (JKIA) and Moi International Airport (MIA) on y/y basis by 8.5% to 489,831 in Q3’2024, from the 451,441 visitors recorded in Q3'2023 at the back of receding adverse effects of COVID-19 pandemic leading to increased tourism activities in the sector. Additionally, there was a year-round repayment by outstanding loans, as the sector was experiencing recovery post Covid-19 Pandemic
The graph below shows Gross Loans advanced to the Hospitality sector against Non-Performing Loans in the sector from Q1’2020 to Q3’2024;
Source: Central Bank of Kenya (CBK)
The graph below shows the Gross NPLs to Gross Loans extended to the hospitality sector from Q1’2020 to Q3’2024;
Source: Central Bank of Kenya (CBK)
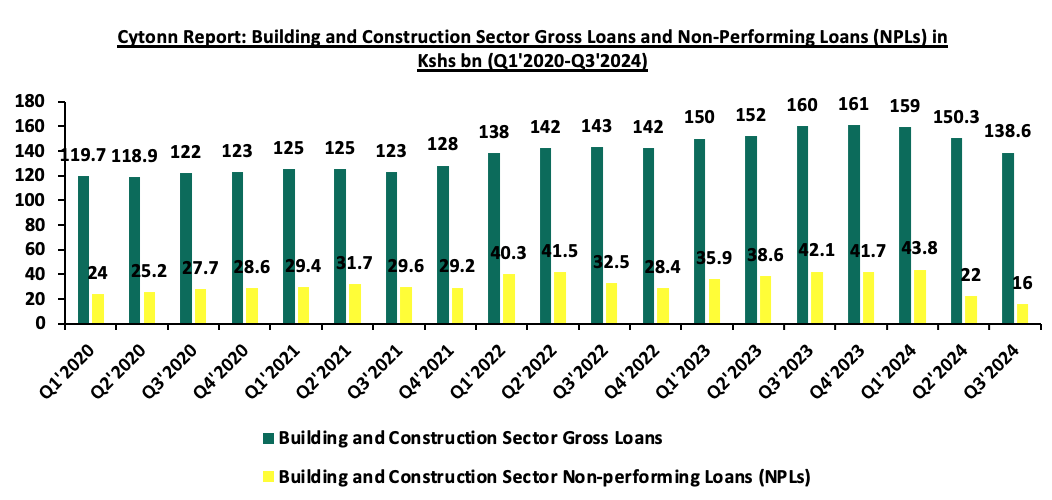
- Gross loans advanced to the building and construction sector recorded a y/y decline of 13.4% to Kshs 138.6 bn in Q3’2024, from Kshs 160.0 bn in Q3’2023 equivalent to 11.5% of the total loans advanced as compared to 26.3% in Q3’2024. This also represented a 7.8% q/q decrease from Kshs 150.3 bn recorded in Q2’2024. The decrease in gross loans were mainly driven by reduced construction activities particularly in the housing and infrastructure sectors by both private and public sectors as evidenced by decrease in the value of building plans approved in NMA by 8.4% to 55.9 bn in Q3’2024 from 61.1 bn in the same period last year.
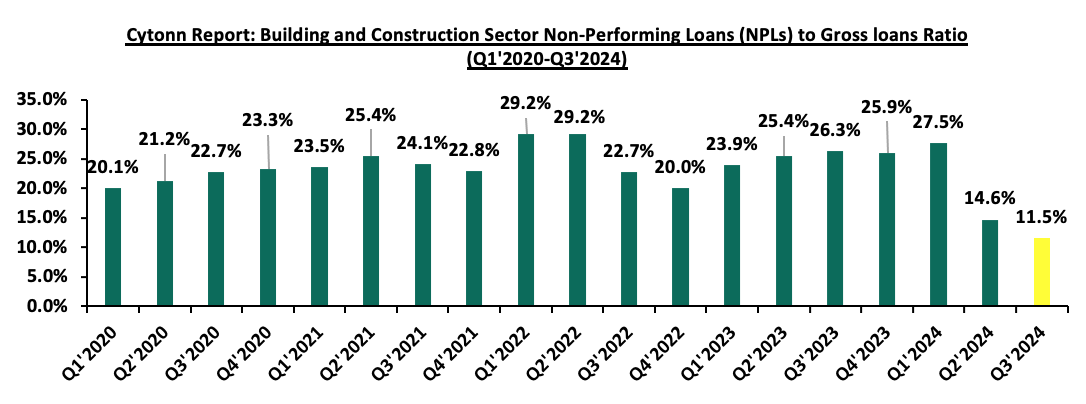
- Gross NPLs in the building and construction sector decreased by 62.0% on a y/y to Kshs 16.0 bn in Q3’2024 from Kshs 42.1 bn in Q3’2023 basis on the back of operational improvements such as decrease in construction cost, stabilization of the Kenyan shilling improving import affordability, eased inflation rates during the period under review, coming at 3.6% in September 2024 as compared to 6.8% in September 2023, enhancing borrower repayment capacity, and, Central Bank Rate cut to 12.75% in August 2024 reducing borrowing costs. The performance represents a 27.3% q/q decrease from Kshs 22.0 bn recorded in Q2’2023 supported by reduced cost of construction.
The graph below shows Gross Loans advanced to the Hospitality sector against Non-Performing Loans in the sector from Q1’2020 to Q3’2024;
Source: Central Bank of Kenya (CBK)
The graph below shows the Gross NPLs to Gross Loans extended to the building and cnstruction sector from Q1’2020 to Q3’2024;
Source: Central Bank of Kenya (CBK)
During the month of February, the following industry reports were released and the key take-outs were as follows;
|
Cytonn Report: Notable Industry Reports During the Month of February 2025 |
|||
|
# |
Theme |
Report |
Key Take-outs |
|
1. |
Leading Economic Indicators |
Leading Economic Indicators (LEI) December 2024 Report by the Kenya National Bureau of Statistics |
· In December 2024, the number of arrivals was 166,961, reflecting a 29.1% increase from 129,335 arrivals recorded in November 2024. On a year-on-year basis, this represented a 16.0% increase compared to 143,942 arrivals in December 2023. · The total value of building plans approved in the Nairobi Metropolitan Area (NMA) decreased y/y basis by 22.5% to Kshs 40.7 bn in Q4’2024, from Kshs 52.6 bn recorded in Q4’2023. In addition, on a q/q basis, the performance represented a 27.1% decrease from Kshs 55.9 bn recorded in Q3’2024. · The consumption of cement came in at 2.4 mn metric tonnes in Q4’2024, a 5.7% increase from 2.3 mn metric tonnes recorded in Q3’2024. On a y/y basis, the performance represented a 3.7% increase from 2.3 mn metric tonnes recorded in Q4’2023. · For more information, please see our Cytonn Weekly #08/2025
|
|
2. |
Real Estate Market to update |
· In the residential sector, the average selling prices for prime housing units increased by 8.3% points in H2’2024, the performance was higher than the 2.5% surge recorded in H2’2023. · The average monthly asking rents for prime commercial office spaces remained relatively unchanged at USD 1.2 per SQFT in H2’2024 since H1’2023. · In the retail sector, monthly rents for prime retail space range from over Kshs 600 per per SQFT to Kshs 700 per SQFT in Nairobi. · The industrial sector continues to grow, driven by the expansion of Export Processing Zones (EPZs), Special Economic Zones (SEZs), and increasing demand for data centers. During the period under review, Nairobi Gate Industrial Park SEZ began its USD 7.0 mn fifth phase adding 130,000 sqm of modular warehouses to boost light manufacturers. For more information, please see our Cytonn Weekly #06/2025 |
|
- Residential Sector
- Stoni Athi Affordable housing project
During the week, the Kenyan government announced its plan to pursue an ambitious plan to secure Kshs 9.2 bn from private investors to construct 2,820 affordable homes in Stoni Athi, Machakos County, as part of its Affordable Housing Programme. This initiative aligns with the government’s goal of delivering 200,000 housing units annually to address Kenya’s pressing housing deficit, a challenge that demands hundreds of thousands of new homes each year. The National Housing Corporation (NHC) is driving this effort through a Public-Private Partnership (PPP) model, where private developers fund construction on NHC-owned land, while the government contributes infrastructure, including roads and electricity. This collaboration optimizes resources, enabling faster development without straining public finances.
The Stoni Athi project is a key element of the Kshs 20.0 bn Stoni Athi Waterfront City development, which plans 10,500 housing units across 150 acres. Of these, 5,000 units are affordable, with the remainder targeting medium to high-income residents, promoting a mixed-income community that enhances social and economic diversity. The government has already invested Kshs 120.0 mn in an access road, signaling its commitment to the project’s success. Located near Nairobi, this development taps into the rising demand for housing in peri-urban areas.
Nationwide, the Affordable Housing Programme oversees 78 projects, though only a few, such as Buxton Point in Mombasa and Bondeni in Nakuru, are complete. It also encompasses housing for military, police, correctional services, students, and private sector workers. Funding partly relies on a housing levy—1.5% of salaried Kenyans’ earnings, matched by employers—supporting President William Ruto’s vision, despite public concerns over ownership guarantees. Within the PPP portfolio of 37 projects, Stoni Athi stands alone as the housing-focused initiative, underscoring its importance. By leveraging private investment, the government aims to efficiently close the housing gap while boosting economic growth in regions like Machakos County.
- Mokowe Affordable Housing Project: A Milestone for Lamu’s Development
During the week, President William Ruto laid the foundation stone for the Mokowe Affordable Housing Project in Lamu County, marking a significant step in Kenya’s quest to address its housing deficit. This ambitious initiative, located in Mokowe within Lamu West Constituency, comprises 468 residential units and 75 commercial shops, reflecting a broader vision to enhance living standards and stimulate economic growth in the coastal region. Valued at Kshs 1.2 bn, the project is part of the government’s Affordable Housing Programme, which aims to construct over 200,000 units annually nationwide. The launch underscores a collaborative effort to transform Lamu into a thriving hub.
The Mokowe project is designed to integrate residential and commercial spaces, fostering a self-sustaining community. Its 393 housing units cater to various income levels, ensuring accessibility, while the 75 shops provide opportunities for local entrepreneurs. Beyond housing, the initiative prioritizes economic empowerment by employing over 120 workers daily—electricians, plumbers, and masons—during construction. The government has committed to sourcing materials locally and partnering with institutions like Mokowe Vocational Training Center to train artisans, injecting over Kshs 400 mn into the local economy. This focus on local labor and suppliers amplifies the project’s ripple effect, from job creation to supporting micro-enterprises.
The project also aligns with broader regional goals, complementing the operational Lamu Port and anticipated trade with Ethiopia. However, its success hinges on addressing historical challenges in Lamu, such as land disputes, which have required equitable resolutions to avoid delays. Environmentally, sustainable construction practices are emphasized to balance development with the region’s ecological sensitivity. By tackling housing shortages, boosting employment, and enhancing infrastructure, the Mokowe Affordable Housing Project promises to reshape Lamu, fostering prosperity and stability in a historically underserved area.
We expect increased activities in the residential sector within the country sustained by; i)ongoing residential developments under the Affordable Housing Agenda, aiming to reduce the housing deficit in the country currently estimated at 80.0%, ii) increased investment from local and international investors in the housing sector, iii) favourable demographics in the country, shown by high population and urbanization rates of 3.8% p.a and 2.0% p.a, respectively, leading to higher demand for housing units. However, challenges such as strain on infrastructure development, and limited access to financing will continue to restrict the optimal performance of the residential sector.
- Hospitality
During the week, Marriott International is broadening its footprint in Kenya’s luxury safari market through a recent agreement with Lazizi Group of Companies to develop two exceptional tented camps: The Ritz-Carlton, Masai Mara Safari Camp and JW Marriott Mount Kenya Rhino Reserve Safari Camp. This move builds on the triumph of the JW Marriott Masai Mara Lodge, launched in 2023, and reflects Marriott’s ambition to meet the rising appetite for exclusive, nature-immersive travel experiences across Africa. The Ritz-Carlton camp, slated for an August 2025 opening, will nestle within the Masai Mara National Reserve, a globally acclaimed haven for wildlife, notably the Great Migration. It will boast 20 luxurious tented suites, including a standout four-bedroom presidential suite, each featuring private plunge pools, outdoor showers, and sophisticated designs that fuse opulence with the wild surroundings. Guests can anticipate tailored game drives, a rejuvenating spa, an outdoor gym, and a variety of dining experiences, from a refined wine cellar to a traditional open-air boma.
Meanwhile, the JW Marriott camp, set to welcome visitors in early 2026, will rise in the Solio Game Reserve, framed by the majestic Mount Kenya and Aberdare Mountains. Known for its pivotal role in rhino conservation, this location will offer a serene retreat where guests can participate in meaningful wildlife preservation efforts while indulging in JW Marriott’s hallmark hospitality. These camps are more than lavish getaways; they aim to elevate Kenya’s luxury safari offerings while championing conservation and community upliftment. By partnering with Lazizi Group, Marriott underscores a shared vision to honor Kenya’s rich natural and cultural tapestry. As these developments unfold, they promise to strengthen Marriott’s standing in Africa’s luxury travel sector, delivering unforgettable escapes in some of the continent’s most breathtaking landscapes.
We expect that such development will continue to significantly enhance the hospitality sector given that such high-end tented camps initiative will attract affluent tourists, boosting revenue and creating jobs. By offering exclusive, conservation-focused experiences, they elevate Kenya’s global appeal as a premier luxury safari destination, stimulate investment, and set new standards for sustainability and luxury, benefiting local communities and the economy in a single impactful sweep.
- Retail Sector
There were Three notable highlights during the month;
- Naivas, a leading supermarket chain in Kenya, launched a new store at Tatu City in Ruiru, marking its 110th store in the country. The new store aims to enhance convenience and accessibility for customers around Tatu City and its environs and has created direct employment opportunities, contributing to the companies growing workforce across Kenya. For more information, please see our Cytonn Weekly #7/2025, and,
- Majid Al Futtaim, the operator of Carrefour in Kenya, launched a new store at Masai Mall in Rongai, marking its 28th store in the country. The new store aims to improve convenience and accessibility for customers around Rongai area and has so far created direct jobs contributing to its current workforce of over 2,800 employees the company has in Kenya. For more information, please see our Cytonn Weekly #6/2025,
We expect to witness more retail expansions activities for the year 2025, driven by increased investments from both local and international retailers, the availability of retail space, a growing consumer base, and evolving consumer preferences in the country.
- Infrastructure
There were two notable highlights during the month;
- A US-based infrastructure investment firm Everstrong Capital initiated efforts to secure local pension funds amounting to Kshs 452.2bn for financing the construction of the 440.0 kilometer Nairobi-Mombasa Expressway. This move comes as Everstrong Capital, in partnership with CPF Capital & Advisory, seeks to channel billions of shillings from pension funds to support the ambitious infrastructure project. For more information, please see our Cytonn Weekly #6/2025, and,
- President Willian Ruto launched the upgrade of 205-Kilometer road connecting Isiolo, Kulamawe and Modogashe areas in Garba Tula during his visit to North Eastern Kenya. The upgrade is estimated to cost Kshs 21.6 bn according to Kenya National Highway Authority (KENHA). This upgrade is part of the governments border plan to connect Isiolo town and Mandera to boost access and trade with Somalia and Ethiopia. This road will connect Meru, Garissa, Isiolo, Wajir and Mandera counties and it will be a major boost to trade, economic growth and integration between the counties. Additionally, the president launched the Horn of Africa gateway development project in Garbatula Isiolo. For more information, please see our Cytonn Weekly #6/2025.
We expect these road developments will boost trade and economic activities between the areas improving the livelihood of the locals in these areas. Also, these roads will open up areas where accessibility has been an issue and more interactions will be witnessed. Properties along the road will see a surge in prices boosted by the infrastructure.
- Real Estate Investments Trusts (REITs)
On the Unquoted Securities Platform, Acorn D-REIT and I-REIT traded at Kshs 25.4 and Kshs 22.2 per unit, respectively, as per the last updated data on 14th February 2025. The performance represented a 27.0% and 11.0% gain for the D-REIT and I-REIT, respectively, from the Kshs 20.0 inception price. The volumes traded for the D-REIT and I-REIT came in at Kshs 12.8 mn and Kshs 35.6 mn shares, respectively, with a turnover of Kshs 323.5 mn and Kshs 791.5 mn, respectively, since inception in February 2021. Additionally, ILAM Fahari I-REIT traded at Kshs 11.0 per share as of 14th February 2025, representing a 45.0% loss from the Kshs 20.0 inception price. The volume traded to date came in at 138,600 shares for the I-REIT, with a turnover of Kshs 1.5 mn since inception in November 2015.
REITs offer various benefits, such as tax exemptions, diversified portfolios, and stable long-term profits. However, the ongoing decline in the performance of Kenyan REITs and the restructuring of their business portfolios are hindering significant previous investments. Additional general challenges include:
- Insufficient understanding of the investment instrument among investors leading to a slower uptake of REIT products,
- Lengthy approval processes for REIT creation,
- High minimum capital requirements of Kshs 100.0 mn for REIT trustees compared to Kshs 10.0 mn for pension funds Trustees, essentially limiting the licensed REIT Trustee to banks only
- The rigidity of choice between either a D-REIT or and I-REIT forces managers to form two REITs, rather than having one Hybrid REIT that can allocate between development and income earning properties
- Limiting the type of legal entity that can form a REIT to only a trust company, as opposed to allowing other entities such as partnerships, and companies,
- We need to give time before REITS are required to list – they would be allowed to stay private for a few years before the requirement to list given that not all companies maybe comfortable with listing on day one, and,
- Minimum subscription amounts or offer parcels set at Kshs 0.1 mn for D-REITs and Kshs 5.0 mn for restricted I-REITs. The significant capital requirements still make REITs relatively inaccessible to smaller retail investors compared to other investment vehicles like unit trusts or government bonds, all of which continue to limit the performance of Kenyan REITs.
We expect the performance of Kenya’s Real Estate sector to remain resilient supported by several factors: i) heightened activities from both private and government sectors, ii) an expanding population driving the need for housing, iii) government efforts under the Affordable Housing Program and the incentives advanced to developers aligned with the program, iv) an increase in deals in the commercial office sector likely to boost occupancy, v) increased investment by international and local investors in the retail sector, and vi) increased international arrivals in the country boosting the hospitality and tourism sector. However, challenges such as rising construction costs, an oversupply in select Real Estate classes, strain on infrastructure development, and high capital demands in REITs sector will continue to impede the real estate sector’s optimal performance by restricting developments and investments.
Disclaimer: The views expressed in this publication are those of the writers where particulars are not warranted. This publication, which is in compliance with Section 2 of the Capital Markets Authority Act Cap 485A, is meant for general information only and is not a warranty, representation, advice, or solicitation of any nature. Readers are advised in all circumstances to seek the advice of a registered investment advisor.
Investment Updates:
- Weekly Rates: Cytonn Money Market Fund closed the week at a yield of 16.1% p.a. To invest, dial *809# or download the Cytonn App from Google Play store here or from the Appstore here;
- We continue to offer Wealth Management Training every Tuesday, from 7:00pm to 8:00 pm. The training aims to grow financial literacy among the general public. To register for any of our Wealth Management Trainings, click here;
- If interested in our Private Wealth Management Training for your employees or investment group, please get in touch with us through wmt@cytonn.com;
- Cytonn Insurance Agency acts as an intermediary for those looking to secure their assets and loved ones’ future through insurance namely; Motor, Medical, Life, Property, WIBA, Credit and Fire and Burglary insurance covers. For assistance, get in touch with us through insuranceagency@cytonn.com;
- Cytonn Asset Managers Limited (CAML) continues to offer pension products to meet the needs of both individual clients who want to save for their retirement during their working years and Institutional clients that want to contribute on behalf of their employees to help them build their retirement pot. To more about our pension schemes, kindly get in touch with us through pensions@cytonn.com;
Hospitality Updates:
- We currently have promotions for Staycations. Visit cysuites.com/offers for details or email us at sales@cysuites.com;

- Talk to us
- Kenya
- P.O Box 20695 - 00200, Nairobi, Kenya
- Cell +254709101200
- Tel +254709101200
- WhatsApp +254741676635
- United States
- +254709101200
- DOWNLOAD OUR APP
-


- Kenya
- 8th Floor, Pinetree Plaza, Kaburu Drive, Ngong Road, Nairobi, Kenya
- USA
- Suite 1150, 1775 Eye Street NW, USA, Washington DC 20006, USA
- Investments
- High Yield
- Private Equity
- Real Estate
- Real Estate
- RiverRun Estates
- Cytonn Towers
- The Ridge
- Taraji Heights
- The Alma