Q1’2023 Unit Trust Funds Performance, & Cytonn Monthly – July 2023
By Research, Aug 6, 2023
Executive Summary
Fixed Income
During the month of July 2023, T-bills were oversubscribed, with the overall average subscription rate coming in at 103.9%, up from the 98.6% recorded in June 2023. The overall average subscription rate for the 91-day and 182-day papers increased to 506.7% and 29.4%, respectively, from the 491.8% and 17.7% recorded in June 2023, while the overall average subscription rate for the 364-day paper declined to 17.3% from 22.1% recorded in June 2023. The average yields on the 364-day, 182-day and 91-day papers increased by 76.6 bps, 68.3 bps and 63.7 bps to 12.5%, 12.2% and 12.1%, respectively. For the month of July, the government accepted a total of Kshs 117.5 bn of the Kshs 124.7 bn worth of bids received, translating to an acceptance rate of 94.3%.
Additionally, the July 2023 bonds were oversubscribed, with the overall subscription rate coming in at 160.3%, albeit lower than the oversubscription rate of 245.6% recorded in June 2023. The newly issued bond FXD1/2023/05 and the reopened FXD1/2016/10 received bids worth Kshs 51.8 bn against the offered Kshs 40.0 bn, translating to an oversubscription rate of 129.4%, with the government accepting bids worth Kshs 38.6 bn, translating to an acceptance rate of 74.5%. Their subsequent tap sale received bids worth Kshs 44.4 bn against the offered Kshs 20.0 bn, translating to an oversubscription rate of 222.1%, with the government accepting bids worth Kshs 43.4 bn translating to an acceptance rate of 97.8%;
During the week, T-bills were undersubscribed for a second consecutive week, with the overall subscription rate coming in at 47.1%, up from 38.1% recorded the previous week. Investor’s preference for the shorter 91-day paper persisted, with the paper receiving bids worth Kshs 6.7 bn against the offered Kshs 4.0 bn, translating to an oversubscription rate of 167.4%, albeit lower than the 176.8% recorded the previous week. The subscription rate for the 364-day paper decreased to 2.6% from 7.1% recorded the previous week, while the subscription rate for the 182-day paper increased to 43.5% from the 13.6% recorded the previous week. The government accepted bids worth Kshs 10.3 bn out of the Kshs 11.3 bn total bids received, translating to an acceptance rate of 91.4%. The yields on the government papers continued to rise, with the yields on the 364-day, 182-day, and 91-day papers increasing by 37.9 bps, 16.6 bps, and 33.3 bps to 13.1%, 12.6%, and 12.7%, respectively;
In the primary bond market, the government is seeking to raise additional Kshs 40.0 bn for budgetary support by issuing a new 2-year bond FXDI/2023/02 and reopening FXD1/2023/05 with a tenor to maturity of 4.9 years. The coupon rate for the FXD1/2023/2 will be market-determined; however, that of FXD1/2023/05 is set at 16.8%. The bidding closes on 16th August 2023. We anticipate the bonds to be oversubscribed, given the short tenor to maturity of the FXD1/2023/02, however, investors are expected to attach higher yields as they seek to cushion themselves against future losses on the back of the government’s debt sustainability concerns and the sustained inflationary pressures experienced in the country. Our recommended bidding range for the bonds are 15.8% – 16.3% for FXD1/2023/02 and 16.9% –17.4% for FXD1/2023/05, based on bonds of similar tenor trading ranges;
During the week, the Kenya National Bureau of Statistics (KNBS) released the year-on-year inflation highlighting that the inflation rate in the month of July 2023 eased to 7.3%, from the 7.9% inflation rate recorded in the month of June 2023, marking the first time in 14 months that the inflation has fallen within the CBK target range of 2.5%-7.5%;
During the week, Stanbic Bank released its monthly Purchasing Manager's Index (PMI), highlighting that the index for the month of July 2023 came in at 45.5, down from 47.8 in June 2023, signaling a stronger downturn of the business environment at the start of Q3’2023. The strong downturn is mainly attributable to the high cost of living amid rising fuel prices and the sustained depreciation of the Kenya shilling;
The Monetary Policy Committee (MPC) is set to meet on Wednesday, 9th August 2023, to review the outcome of its previous policy decisions and recent economic developments, and to decide on the direction of the Central Bank Rate (CBR). We expect the MPC to maintain the Central Bank Rate (CBR) at the current rate of 10.50%, with their decision mainly supported by the ease in y/y inflation in July 2023 to 7.3% from 7.9% recorded in June 2023 and the need to support the economy by adopting an accommodative policy that will support the private sector, given that an additional hike in the CBR rate might curtail economic growth;
Additionally, the National Treasury gazetted the revenue and net expenditures for the FY’2022/2023, highlighting that, the total revenue collected as at the end of FY’2022/2023 amounted to Kshs 2,044.6 bn, equivalent to 95.3% of the revised estimates of Kshs 2,145.4 bn and 95.5% of the original estimates of Kshs 2,141.6 bn;
Equities
During the month of July, the equities market recorded a mixed performance with NASI declining by 1.4% while NSE 20 and NSE 25 gained by 0.1% and 0.01%, respectively. The equities market performance was driven by losses recorded by large cap stocks such as EABL, Diamond Trust Bank (DTB-K) and Safaricom of 9.0%, 4.3%, and 3.4%, respectively. The losses were however mitigated by gains recorded by banking stocks such as Equity Group, ABSA Bank, and Standard Chartered Bank of Kenya (SCBK) of 7.2%, 4.7% and 2.8% respectively. During the week, the equities market was on an upward trajectory, with NASI, NSE 20 and NSE 25 gaining by 1.0%, 0.8% and 0.7%, respectively, taking the YTD performance to losses of 16.6%, 4.8%, and 12.1% for NASI, NSE 20, and NSE 25, respectively. The equities market performance was mainly driven by gains recorded by large cap stocks such as NCBA, Diamond Trust Bank (DTB-K) and Bamburi of 8.7%, 4.9% and 4.2%, respectively. The gains were however weighed down by losses recorded by other large cap stocks such as EABL of 6.8%.
Real Estate
During the week, Laptrust Imara I-REIT and Acorn Holdings released their H1’2023 financial results highlighting that both Acorn D-REIT and I-REIT recorded profits of Kshs 170.2 mn and Kshs 113.3 mn, respectively. Additionally, Laptrust Imara I-REIT recorded Kshs 99.6 mn in net earnings, and Kshs 203.3 mn in total operating income for the period H1’2023.
In regulated Real Estate Funds, under the Real Estate Investment Trusts (REITs) segment, Fahari I-REIT closed the week trading at an average price of Kshs 6.5 per share in the Nairobi Securities Exchange, representing a 3.9% gain from the Kshs 6.2 recorded the previous week. On the Unquoted Securities Platform as at 4 August 2023, Acorn D-REIT and I-REIT closed the week trading at Kshs 23.9 and Kshs 21.6 per unit, a 19.5% and 8.0% gain for the D-REIT and I-REIT, respectively, from the Kshs 20.0 inception price. In addition, Cytonn High Yield Fund (CHYF) closed the week with an annualized yield of 13.6%, remaining relatively unchanged from what was recorded the previous week;
Focus of the Week
Following the release of the Capital Markets Authority (CMA) Quarterly Statistical Bulletin-Q2’2023 we examine the performance of Unit Trust Funds for the period ending 31st March 2023. During the period of review, Unit Trusts Funds’ Assets under Management grew by 2.0% to Kshs 164.3 bn as at the end of Q1’2023 from Kshs 161.0 bn recorded in FY’2022. Additionally, as at the end of Q1’2023, there were 4 Unit Trusts Funds that became active, increasing the total number of active funds to 25 from 21 in FY’2022;
Investment Updates:
- Weekly Rates:
- Cytonn Money Market Fund closed the week at a yield of 12.73%. To invest, dial *809# or download the Cytonn App from Google Playstore here or from the Appstore here;
- Cytonn High Yield Fund closed the week at a yield of 13.56% p.a. To invest, email us at sales@cytonn.com and to withdraw the interest, dial *809# or download the Cytonn App from Google Playstore here or from the Appstore here;
- We continue to offer Wealth Management Training every Wednesday and every third Saturday of the month, from 9:00 am to 11:00 am, through our Cytonn Foundation. The training aims to grow financial literacy among the general public. To register for any of our Wealth Management Trainings, click here;
- If interested in our Private Wealth Management Training for your employees or investment group, please get in touch with us through wmt@cytonn.com;
- Cytonn Insurance Agency acts as an intermediary for those looking to secure their assets and loved ones’ future through insurance namely; Motor, Medical, Life, Property, WIBA, Credit and Fire and Burglary insurance covers. For assistance, get in touch with us through insuranceagency@cytonn.com;
- Cytonn Asset Managers Limited (CAML) continues to offer pension products to meet the needs of both individual clients who want to save for their retirement during their working years and Institutional clients that want to contribute on behalf of their employees to help them build their retirement pot. To more about our pension schemes, kindly get in touch with us through pensions@cytonn.com;
Real Estate Updates:
- For an exclusive tour of Cytonn’s real estate developments, visit: Sharp Investor's Tour, and for more information, email us at sales@cytonn.com;
- Phase 3 of The Alma is now ready for occupation and the show house is open daily. To join the waiting list to rent, please email properties@cytonn.com;
- For Third Party Real Estate Consultancy Services, email us at rdo@cytonn.com;
- For recent news about the group, see our news section here;
Hospitality Updates:
- We currently have promotions for Staycations. Visit cysuites.com/offers for details or email us at sales@cysuites.com;
Money Markets, T-Bills Primary Auction:
During the month of July 2023, T-bills were oversubscribed, with the overall average subscription rate coming in at 103.9%, up from the 98.6% recorded in June 2023. The overall average subscription rate for the 91-day and 182-day papers increased to 506.7% and 29.4%, respectively, from the 491.8% and 17.7% recorded in June 2023, while the overall average subscription rate for the 364-day paper declined to 17.3% from 22.1% recorded in June 2023. The average yields on the 364-day, 182-day and 91-day papers increased by 76.6 bps, 68.3 bps and 63.7 bps to 12.5%, 12.2% and 12.1%, respectively. For the month of July, the government accepted a total of Kshs 117.5 bn of the Kshs 124.7 bn worth of bids received, translating to an acceptance rate of 94.3%.
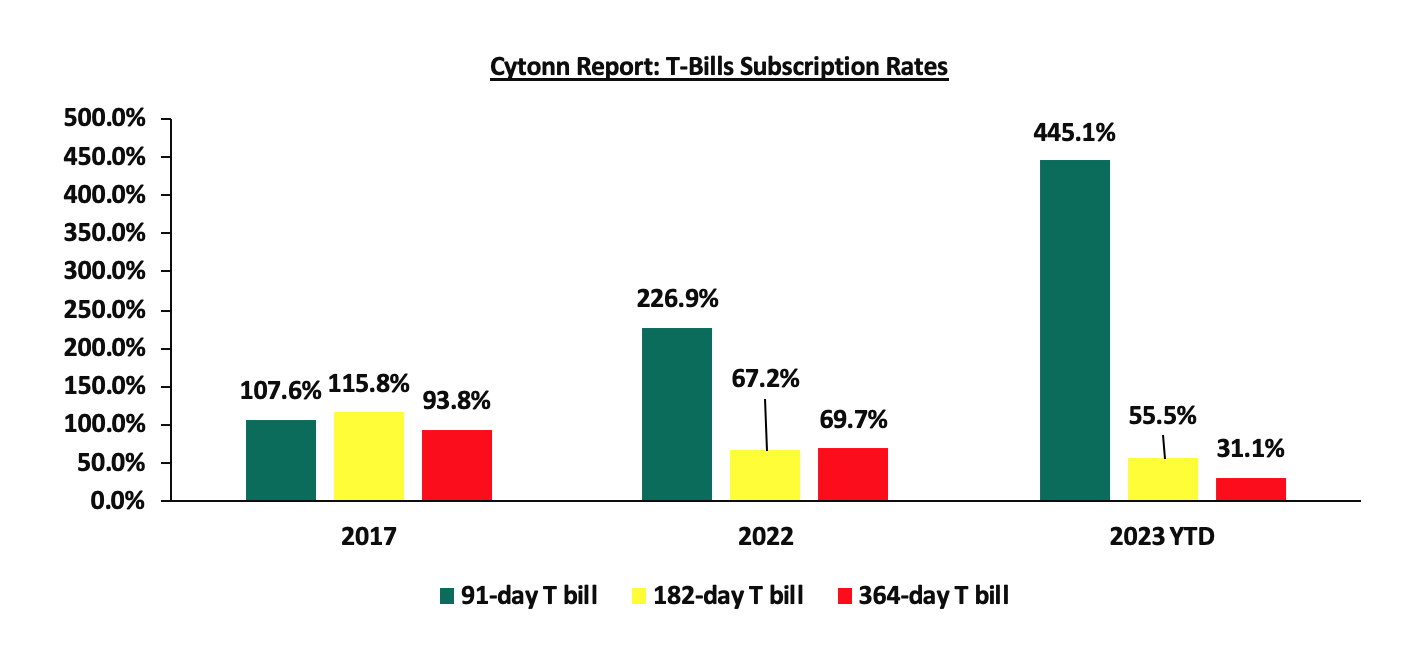
During the week, T-bills were undersubscribed for a second consecutive week, with the overall subscription rate coming in at 47.1%, up from 38.1% recorded the previous week. Investor’s preference for the shorter 91-day paper persisted, with the paper receiving bids worth Kshs 6.7 bn against the offered Kshs 4.0 bn, translating to an oversubscription rate of 167.4%, albeit lower than the 176.8% recorded the previous week. The subscription rate for the 364-day paper decreased to 2.6% from 7.1% recorded the previous week, while the subscription rate for the 182-day paper increased to 43.5% from the 13.6% recorded the previous week. The government accepted bids worth Kshs 10.3 bn out of the Kshs 11.3 bn total bids received, translating to an acceptance rate of 91.4%. The yields on the government papers continued to rise, with the yields on the 364-day, 182-day, and 91-day papers increasing by 37.9 bps, 16.6 bps, and 33.3 bps to 13.1%, 12.6%, and 12.7%, respectively. The chart below compares the overall average T- bills subscription rates obtained in 2017, 2022 and 2023 Year to Date (YTD):
The July 2023 bonds were oversubscribed, with the overall subscription rate coming in at 160.3%, albeit lower than the oversubscription rate of 245.6% recorded in June 2023. The newly issued bond FXD1/2023/05 and the reopened FXD1/2016/10 received bids worth Kshs 51.8 bn against the offered Kshs 40.0 bn, translating to an oversubscription rate of 129.4%, with the government accepting bids worth Kshs 38.6 bn, translating to an acceptance rate of 74.5%. Their subsequent tap sale received bids worth Kshs 44.4 bn against the offered Kshs 20.0 bn, translating to an oversubscription rate of 222.1%, with the government accepting bids worth Kshs 43.4 bn translating to an acceptance rate of 97.8%. The table below provides more details on the bonds issued during the month of July 2023:
|
Cytonn Report: Treasury Bonds Issued in July 2023 |
|||||||||
|
Issue Date |
Bond Auctioned |
Effective Tenor to Maturity (Years) |
Coupon |
Amount offered (Kshs bn) |
Actual Amount Raised/Accepted (Kshs bn) |
Total bids received (Subscription) |
Average Accepted Yield |
Subscription Rate |
Acceptance Rate |
|
17/07/2023 |
FXD1/2016/10 |
3.2 |
15.04% |
40.0 |
38.6 |
51.8 |
16.3% |
129.4% |
74.5% |
|
FXD1/2023/05 |
5.0 |
16.84% |
16.8% |
||||||
|
24/07/2023 |
FXD1/2016/10 - tap sale |
3.2 |
15.04% |
20.0 |
43.4 |
44.4 |
16.3% |
222.1% |
97.8% |
|
FXD1/2023/05 - tap sale |
5.0 |
16.84% |
16.8% |
||||||
|
July 2023 Average |
|
4.1 |
15.9% |
60.0 |
82.0 |
96.2 |
16.6% |
160.3% |
85.3% |
|
June 2023 Average |
|
4.9 |
15.0% |
75.0 |
116.0 |
119.5 |
15.0% |
245.6% |
98.4% |
Source: Central Bank of Kenya (CBK)
In the primary bond market, the government is seeking to raise additional Kshs 40.0 bn for budgetary support by issuing a new 2-year bond FXDI/2023/02 and reopening FXD1/2023/05 with a tenor to maturity of 4.9 years. The coupon rate for the FXD1/2023/02 will be market-determined; however, that of FXD1/2023/05 is set at 16.8%. The bidding closes on 16th August 2023. We anticipate the bonds to be oversubscribed, given the short tenor to maturity of the FXD1/2023/02, however, investors are expected to attach higher yields as they seek to cushion themselves against future losses on the back of the government’s debt sustainability concerns and the sustained inflationary pressures experienced in the country. Our recommended bidding range for the bonds are 15.8% – 16.3% for the FXD1/2023/02 and 16.9% –17.4% for FXD1/2023/05, based on bonds of similar tenor trading ranges.
Secondary Bond Market:
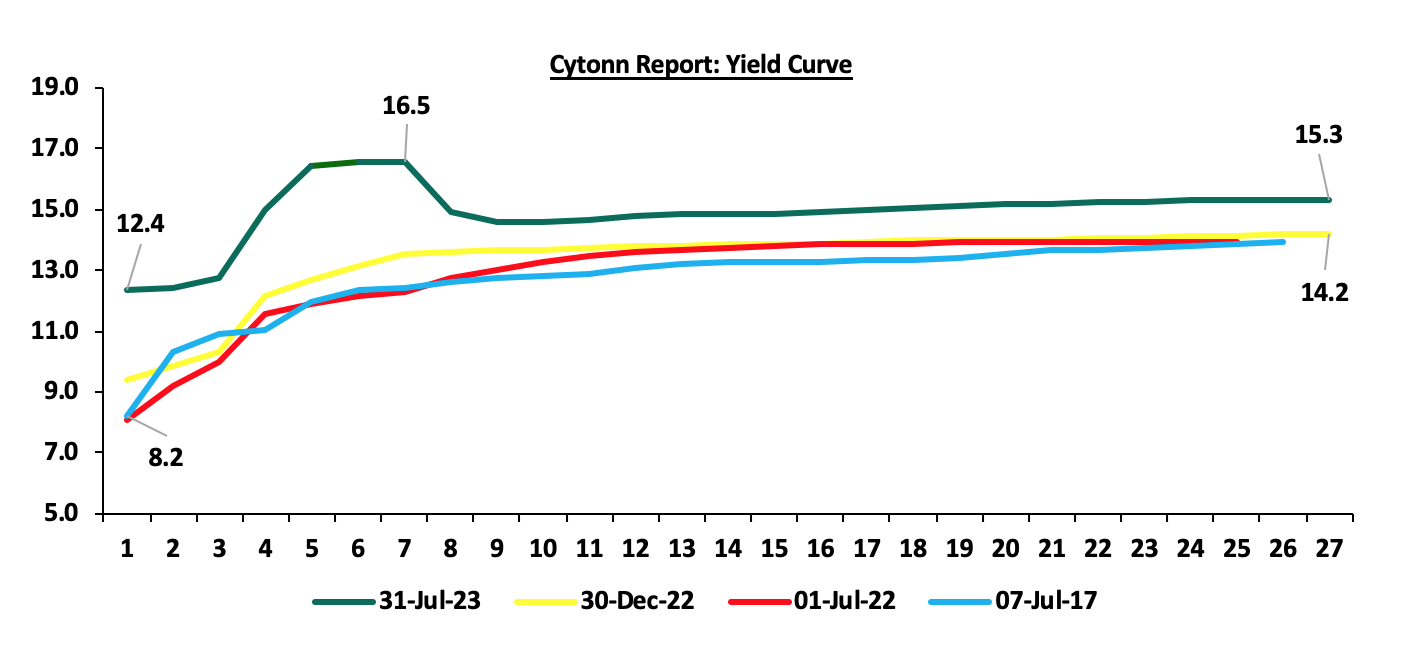
The yields on the government securities were on an upward trajectory during the month compared to the same period in 2022, as a result of the elevated inflationary pressures leading to investors attaching higher risk premiums. The chart below shows the yield curve movement during the period:
The secondary bond turnover increased by 27.5% to Kshs 58.5 bn from Kshs 45.8 bn recorded in June 2023, pointing towards increased activities by commercial banks in the secondary bonds market. However, on a year on year basis, the bonds turnover decreased by 4.1% from Kshs 60.9 bn worth of treasury bonds transacted over a similar period last year.
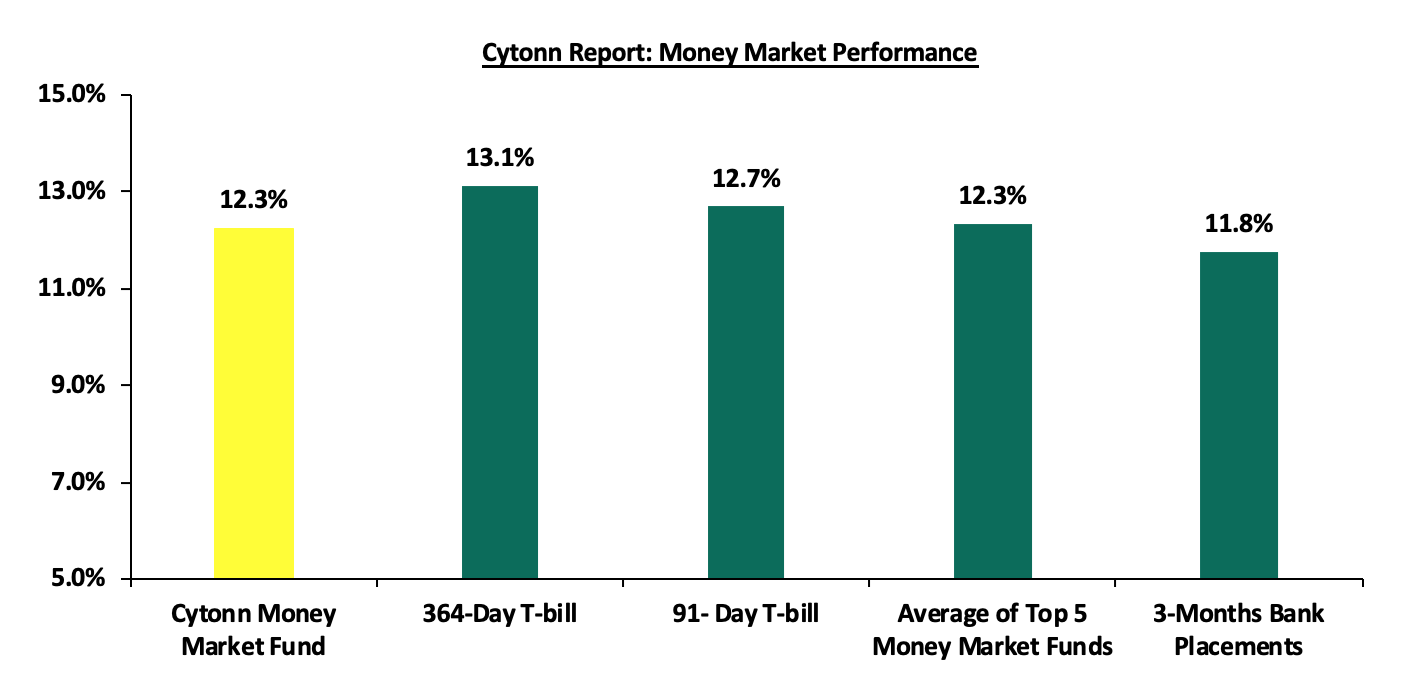
Money Market Performance:
In the money markets, 3-month bank placements ended the week at 11.8% (based on what we have been offered by various banks), while the yields on the 364-day and 91-day T-bills increased by 37.9 bps and 33.3 bps to 13.1% and 12.7%, respectively. The yield of Cytonn Money Market Fund increased by 2.0 bps, remaining relatively unchanged at 12.4%, while the average yields on the Top 5 Money Market Funds decreased by 5.8 bps to 12.3% from 12.4% recorded the previous week.
The table below shows the Money Market Fund Yields for Kenyan Fund Managers as published on 4th August 2023:
|
Cytonn Report: Money Market Fund Yield for Fund Managers as published on 4th August 2023 |
||
|
Rank |
Fund Manager |
Effective Annual |
|
1 |
Enwealth Money Market Fund |
12.42% |
|
2 |
Lofty-Corban Money Market Fund |
12.39% |
|
3 |
Cytonn Money Market Fund (dial *809# or download Cytonn App) |
12.37% |
|
4 |
GenAfrica Money Market Fund |
12.25% |
|
5 |
Etica Money Market Fund |
12.03% |
|
6 |
Jubilee Money Market Fund |
11.69% |
|
7 |
Madison Money Market Fund |
11.59% |
|
8 |
Kuza Money Market fund |
11.37% |
|
9 |
Old Mutual Money Market Fund |
11.35% |
|
10 |
AA Kenya Shillings Fund |
11.35% |
|
11 |
Sanlam Money Market Fund |
11.32% |
|
12 |
ICEA Lion Money Market Fund |
11.31% |
|
13 |
Apollo Money Market Fund |
10.91% |
|
14 |
Co-op Money Market Fund |
10.90% |
|
15 |
Nabo Africa Money Market Fund |
10.78% |
|
16 |
GenCap Hela Imara Money Market Fund |
10.66% |
|
17 |
KCB Money Market Fund |
10.48% |
|
18 |
NCBA Money Market Fund |
10.47% |
|
19 |
Dry Associates Money Market Fund |
10.44% |
|
20 |
CIC Money Market Fund |
10.08% |
|
21 |
Absa Shilling Money Market Fund |
10.08% |
|
22 |
Orient Kasha Money Market Fund |
9.63% |
|
23 |
British-American Money Market Fund |
9.60% |
|
24 |
Mali Money Market Fund |
9.44% |
|
25 |
Equity Money Market Fund |
8.47% |
Source: Business Daily
Liquidity:
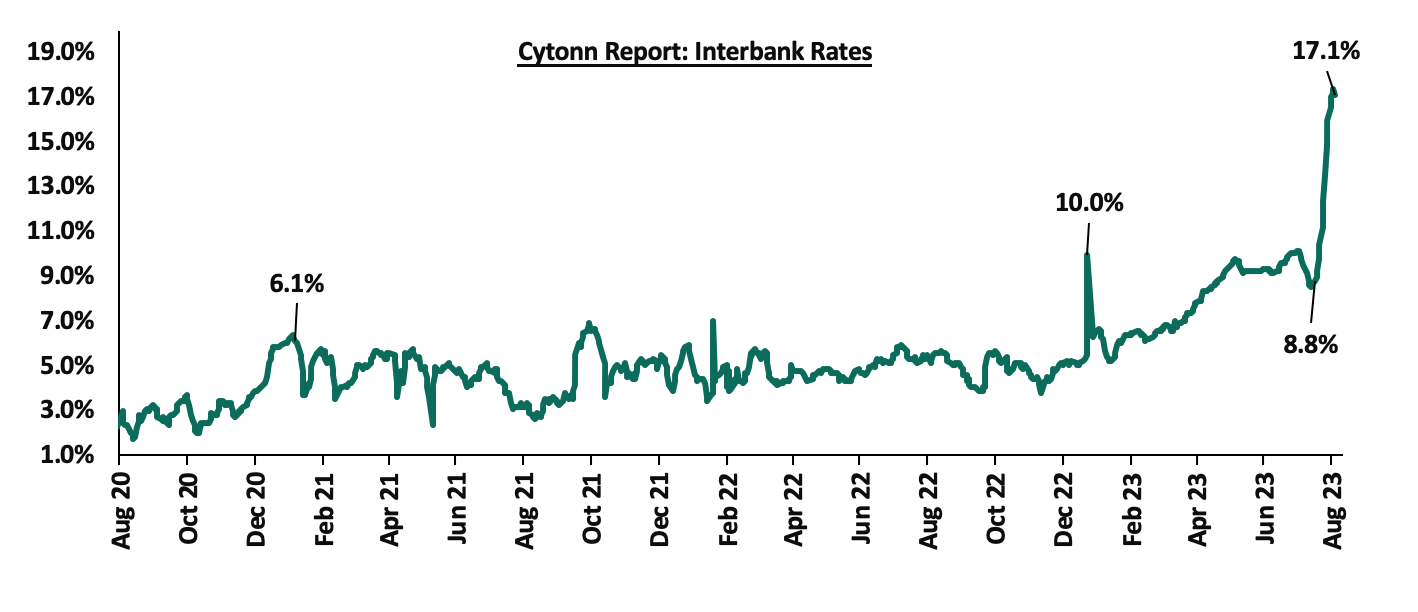
Liquidity in the money markets tightened in the month of July 2023, with the average interbank rate increasing to 10.7% from 9.6% recorded in June 2023. Also, during the week, liquidity in the money markets tightened, with the average interbank rate increasing to 17.0%, from 13.6% recorded the previous week, partly attributable to tax remittances that offset government payments. The average interbank volumes traded increased by 139.5% to Kshs 26.7 bn, from Kshs 11.2 bn recorded the previous week. The chart below shows the interbank rates in the market over the years:
Kenya Eurobonds:
During the month, the yields on the Eurobonds were on a downward trajectory despite the concerns around debt sustainability amid local currency depreciation and sustained inflationary pressures. The yield on the 12-year Eurobond issued in 2019 recorded the largest decline of 0.4% points to 10.7% from 11.1% recorded in June 2023.
During the week, the yields on Eurobonds were on an upward trajectory, with the yield on the 10-year Eurobond issued in 2014 recording the largest increase, having increased by 0.9% points to 13.5%, from 12.6%, recorded the previous week, partly attributable to government debt sustainability concerns amid the recent downward revision of the outlook on Kenya's Long-Term Foreign-Currency Issuer Default Rating (IDR) to negative from stable by Fitch ratings. The table below shows the summary of the performance of the Kenyan Eurobonds as of 3rd Aug 2023;
|
Cytonn Report: Kenya Eurobonds Performance |
||||||
|
|
2014 |
2018 |
2019 |
2021 |
||
|
Date |
10-year issue |
10-year issue |
30-year issue |
7-year issue |
12-year issue |
12-year issue |
|
Amount Issued (USD) |
2.0 bn |
1.0 bn |
1.0 bn |
0.9 bn |
1.2 bn |
1.0 bn |
|
Years to Maturity |
1.1 |
4.8 |
24.8 |
4.0 |
9.0 |
11.1 |
|
Yields at Issue |
6.6% |
7.3% |
8.3% |
7.0% |
7.9% |
6.2% |
|
02-Jan-23 |
12.9% |
10.5% |
10.9% |
10.9% |
10.8% |
9.9% |
|
30-Jun-23 |
12.5% |
11.0% |
11.1% |
11.3% |
11.1% |
10.3% |
|
27-Jul-23 |
12.6% |
10.9% |
11.0% |
11.4% |
10.9% |
10.5% |
|
28-Jul-23 |
12.8% |
10.9% |
11.0% |
11.0% |
10.9% |
10.5% |
|
31-Jul-23 |
12.3% |
10.7% |
10.8% |
11.2% |
10.7% |
10.3% |
|
01-Aug-23 |
12.5% |
10.8% |
10.8% |
11.3% |
10.8% |
10.3% |
|
02-Aug-23 |
13.3% |
11.2% |
11.0% |
11.7% |
11.0% |
10.6% |
|
03-Aug-23 |
13.5% |
11.3% |
11.1% |
11.8% |
11.2% |
10.7% |
|
Weekly Change |
0.9% |
0.4% |
0.1% |
0.4% |
0.3% |
0.2% |
|
MTM Change |
(0.2%) |
(0.3%) |
(0.3%) |
(0.1%) |
(0.4%) |
(0.03%) |
|
YTD Change |
0.6% |
0.8% |
0.2% |
0.9% |
0.4% |
0.8% |
Source: Source: Central Bank of Kenya (CBK) and National Treasury
Kenya Shilling:
During the month, the Kenya Shilling depreciated by 1.3% against the US Dollar, to close the month at Kshs 142.3, from Kshs 140.5 recorded at the end of June 2023, partly attributable to the increased dollar demand from importers, especially oil and energy sectors
Also, during the week, the Kenya Shilling depreciated by 0.4% against the US dollar to close the week at Kshs 142.9, from Kshs 142.3 recorded the previous week. On a year to date basis, the shilling has depreciated by 15.8% against the dollar, adding to the 9.0% depreciation recorded in 2022. We expect the shilling to remain under pressure in 2023 as a result of:
- An ever-present current account deficit, which came at 2.3% of GDP in Q1’2023 from 4.2% recorded in a similar period last year, and,
- The need for government debt servicing, continues to put pressure on forex reserves given that 66.8% of Kenya’s external debt is US Dollar denominated as of April 2023, and,
The shilling is however expected to be supported by:
- Diaspora remittances standing at a cumulative USD 2,033.8 mn in 2023 as of June 2023, albeit 0.5% lower than the USD 2,044.6 mn recorded over the same period in 2022, and,
- The tourism inflow receipts which came in at Kshs 268.1 bn in 2022, a significant 82.9% increase from Kshs 146.5 bn inflow receipts recorded in 2021.
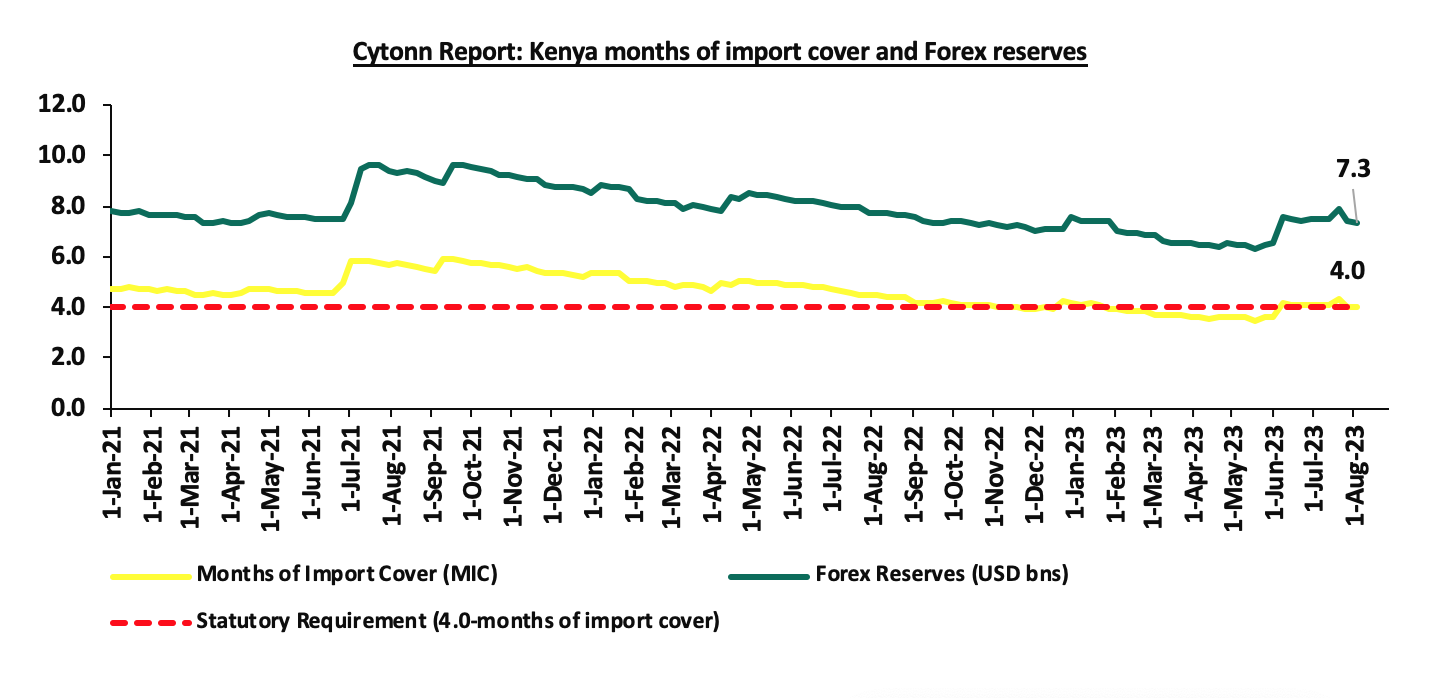
- Adequate forex reserves currently at USD 7.3 bn (equivalent to 4.0-months of import cover), which is within the statutory requirement of maintaining at least 4.0-months of import cover.
The chart below summarizes the evolution of Kenya months of import cover over the years:
Weekly Highlights:
- July 2023 Inflation
The year-on-year inflation rate in the month of July 2023 eased to 7.3%, from the 7.9% inflation rate recorded in the month of June 2023, marking the first time in 14 months that the inflation has fallen within the CBK target range of 2.5%-7.5%. The overall easing of the headline inflation in the month of July 2023 came on the back of tight monetary policy following the Monetary Policy Committee (MPC) move to raise the Central Bank Rate by 100.0 bps to 10.5% in June 2023 from 9.5% in May 2023, a move aimed to anchor inflation. The table below shows a summary of both the year on year and month on month commodity indices performance:
|
Cytonn Report: Major Inflation Changes – 2023 |
|||
|
Broad Commodity Group |
Price change m/m (June-2023/July-2023) |
Price change y/y (July-2022/July-2023) |
Reason |
|
Food and Non-Alcoholic Beverages |
(0.5%) |
8.6% |
The m/m decrease was mainly driven by decrease in prices of commodities such as potatoes, tomatoes and cabbages. However, the decrease was weighed down by increase in prices of onions during the same period. |
|
Housing, Water, Electricity, Gas and Other Fuel |
(1.2%) |
7.8% |
The m/m decrease was mainly driven by decline in prices of gas/LPG and Electricity. However, there was an increase in prices of Kerosene in the same period which rose by 5.0%. |
|
Transport cost |
3.5% |
13.0 |
The m/m increase was driven by increase in prices of petrol and diesel in the period which rose by 6.9% and 7.4% respectively. |
|
Overall Inflation |
0.1% |
7.3% |
The m/m increase was mainly driven by 3.5% increase in transport cost. |
Source: Kenya National Bureau of Statistics (KNBS)
The chart below shows the inflation rates for the past 5 years:
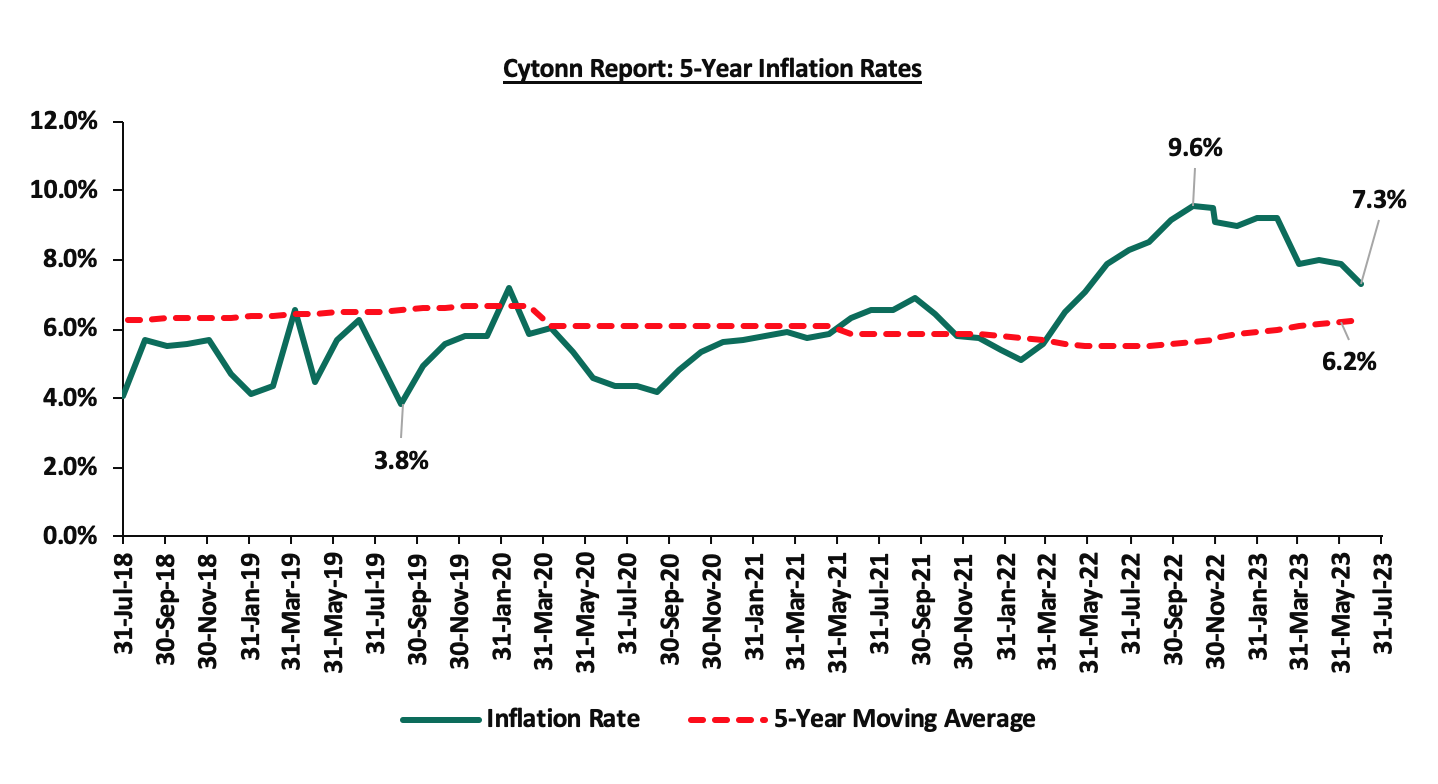
Despite the easing of the year-on-year inflation, the risk of an elevation of inflation above the CBK target range remains high following the effectuation of the Finance Act 2023, which provisions a double increase in VAT on petroleum products to 16.0% from 8.0%. With fuel being a major input in most businesses, the cost of production is expected to remain elevated. Additionally, the sustained depreciation of the Kenyan shilling against major currencies is also expected to underpin inflationary pressures in the country as manufacturers pass on the high cost of importation to consumers through hikes in consumer prices in order to maintain their margins.
- July 2023 Purchasing Managers Index (PMI)
During the week, Stanbic Bank released its monthly Purchasing Manager's Index (PMI), highlighting that the index for the month of July 2023 came in at 45.5, down from 47.8 in June 2023, signaling a stronger downturn of the business environment at the start of Q3’2023. The strong downturn is mainly attributable to the high cost of living amid rising fuel prices and the sustained depreciation of the Kenya shilling. As a result, firms recorded fall in new business inflows as consumers cut back on spending. In addition, the political protests witnessed in the country has been a major accelerator to the downturn as output recorded sharp contraction, the fastest since August 2022, with firms noting adverse effect on sales from the demonstrations.
The services, wholesale and retail sectors registered continued declines in activity attributable to price pressures, however, the agriculture sector continued supporting economic activity as it recorded growth. Notably, exports rose for the fifth consecutive month, attributable to the weak shilling, which made Kenyan exports more affordable in the global market, however, number of new export orders slowed down. Hiring activities in the private sector remained strong, however the momentum has slowed down compared to June 2023, attributable to heightened business costs and reduced demand. Key to note, a PMI reading of above 50.0 indicates an improvement in the business conditions, while readings below 50.0 indicate a deterioration. The chart below summarizes the evolution of PMI over the last 24 months:
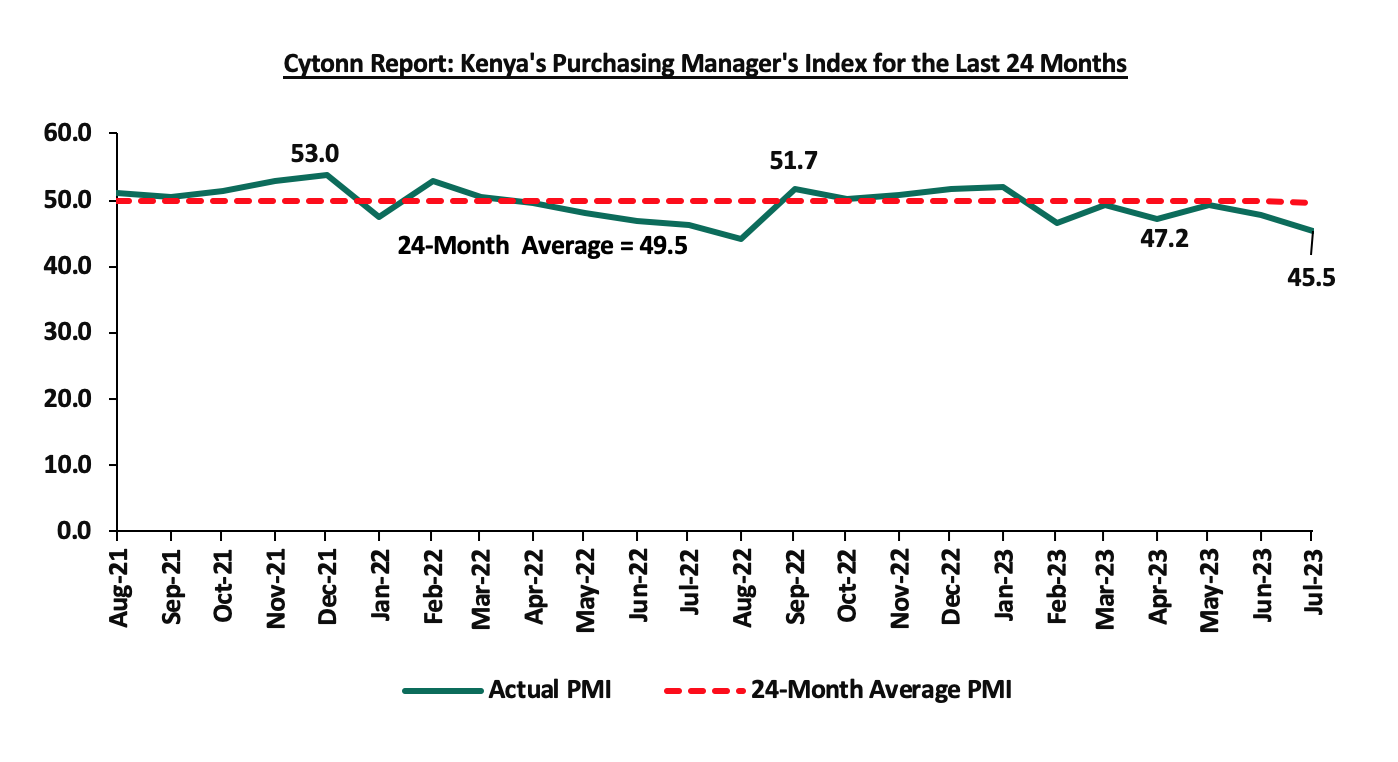
The July 2023 PMI marks 6 months in a row that the index has remained below the 50.0 no change threshold. Going forward, we project that the business environment will be restrained in the short to medium term on the back of high food and fuel prices, as well as the sustained depreciation of the Kenyan shilling, which continues to raise the cost of production and importation. As a result, the volume of new businesses is expected to remain stifled as consumers cut back on spending due to a lack of purchasing power. In addition, the provisions of the Finance Act 2023, characterized by the introduction of new taxes as well as upward revisions of existing taxes, are expected to dampen growth in the private sector owing to the high cost of doing business.
- August 2023 MPC Meeting
The Monetary Policy Committee (MPC) is set to meet on Wednesday, 9th August 2023, to review the outcome of its previous policy decisions and recent economic developments, and to decide on the direction of the Central Bank Rate (CBR). We expect the MPC to maintain the Central Bank Rate (CBR) at the current rate of 10.50% with their decision mainly being supported by:
- The ease in y/y inflation in July 2023 to 7.3% from 7.9% recorded in June 2023, marks the first time in 14 months that inflation has fallen within the CBK target range of 2.5%-7.5%. However, the risk lies on the back of elevated fuel prices following the increase in VAT on petroleum products to 16.0% from 8.0%. As such, we expect the MPC to maintain the CBR as the current monetary stance still transmits in the economy, and
- The need to support the economy by adopting an accommodative policy that will support the private sector. The Purchasing Managers Index (PMI) has for the last 6 months remained below the 50.0 no change threshold, with the July 2023 PMI dropping to 45.5 from 47.8 recorded in June 2023 and indication of greater deterioration in the business environment. An additional hike in the CBR rate might curtail economic growth given the current macroeconomic and business environment, which cannot accommodate further hikes.
Notably, despite the positive growth in all sectorial contributors to the GDP in Q1’2023, the overall economic growth slowed down, coming in at 5.3% compared to the 6.2% growth recorded in Q1’2022. As such, a further increase in the Central Bank Rate (CBR) is expected to unleash further negative impacts on the local economy amid a deteriorated local business environment.
For a more detailed analysis, please see our August 2023 MPC note.
- FY’2022/2023 Budget Outturn as at 30th June 2023
The National Treasury gazetted the revenue and net expenditures for the FY’2022/2023. Below is a summary of the performance:
|
Cytonn Report: FY'2022/2023 Budget Outturn - As at 30th June 2023 |
|||||
|
Item |
12-months Original Estimates (A) |
Revised Estimates (B) |
Actual Receipts/Release (C) |
Percentage Achieved of the Revised Estimates (C/B) |
% achieved of the Original Estimates (C/A) |
|
Opening Balance |
|
|
0.6 |
|
|
|
Tax Revenue |
2,071.9 |
2,079.8 |
1,962.0 |
94.3% |
94.7% |
|
Non-Tax Revenue |
69.7 |
65.6 |
82.0 |
125.1% |
117.7% |
|
Total Revenue |
2,141.6 |
2,145.4 |
2,044.6 |
95.3% |
95.5% |
|
External Loans & Grants |
349.3 |
513.4 |
488.3 |
95.1% |
139.8% |
|
Domestic Borrowings |
1,040.5 |
948.1 |
696.4 |
73.5% |
66.9% |
|
Other Domestic Financing |
13.2 |
13.2 |
16.1 |
121.7% |
121.7% |
|
Total Financing |
1,403.0 |
1,474.8 |
1,200.8 |
81.4% |
85.6% |
|
Recurrent Exchequer issues |
1,178.4 |
1,268.8 |
1,221.6 |
96.3% |
103.7% |
|
CFS Exchequer Issues |
1,571.8 |
1,577.7 |
1,313.6 |
83.3% |
83.6% |
|
Development Expenditure & Net Lending |
424.4 |
374.0 |
308.0 |
82.4% |
72.6% |
|
County Governments + Contingencies |
370.0 |
399.6 |
399.6 |
100.0% |
108.0% |
|
Total Expenditure |
3,544.6 |
3,620.2 |
3,242.8 |
89.6% |
91.5% |
|
Fiscal Deficit excluding Grants |
1,403.0 |
1,474.8 |
1,198.2 |
81.2% |
85.4% |
|
Total Borrowing |
1,389.8 |
1,461.5 |
1,184.7 |
81.1% |
85.2% |
|
Amounts in Kshs bns unless stated otherwise |
|
|
|
|
|
The key take-outs from the report include:
- Total revenue collected as at the end of FY’2022/2023 amounted to Kshs 2,044.6 bn, equivalent to 95.3% of the revised estimates of Kshs 2,145.4 bn and is 95.5% of the original estimates of Kshs 2,141.6 bn. We note that the government was not able to meet its revenue targets in the FY’2022/2023, partly attributable to the tough macroeconomic environment in the country as a result of elevated inflationary pressures which averaged at 8.8% in the FY’2022/23. Cumulatively, tax revenues amounted to Kshs 1,962.0 bn, equivalent to 94.3% of the revised estimates of Kshs 2,079.8 bn and 94.7% of the original estimates of Kshs 2,071.9 bn.
- Total financing amounted to Kshs 1,200.8 bn, equivalent to 81.4% of the revised estimates of Kshs 1,474.8 bn and is equivalent to 85.6% of the original estimates of Kshs 1,403.0 bn. Additionally, domestic borrowing amounted to Kshs 696.4 bn, equivalent to 73.5% of the revised estimates of Kshs 948.1 bn and 66.9% of the original estimates of Kshs 1,040.5 bn,
- The total expenditure amounted to Kshs 3,242.8 bn, equivalent to 89.6% of the revised estimates of Kshs 3,620.2 bn, and 91.5% of the original expenditure estimates of Kshs 3,544.6 bn. Additionally, the net disbursements to recurrent expenditures came in at Kshs 1,221.6 bn, equivalent to 96.3% of the revised estimates of Kshs 1,268.8 bn and 103.7% of the original estimates of Kshs 1,178.4 bn, and development expenditure amounted to Kshs 308.0 bn, equivalent to 82.4% of the revised estimates of Kshs 374.0 bn and is 72.6% of the original estimates of Kshs 424.4 bn. Further, Consolidated Fund Services (CFS) Exchequer issues came in at Kshs 1, 1313.6 bn, equivalent to 83.3% of the revised estimates of Kshs 1,577.7 bn, and 83.6% of the original amount of Kshs 1,571.8 bn.
- Total Borrowings as at the end of June 2023 amounted to Kshs 1,184.7 bn, equivalent to 81.1% of the revised estimates of Kshs 1,461.5 bn for FY’2022/2023, and 85.2% of the original estimates of Kshs 1,389.8 bn, and,
- The cumulative public debt servicing cost amounted to Kshs 1,161.6 bn which is 83.9% of the revised estimates of Kshs 1,385.1 bn, and 83.4% of the original estimates of Kshs 1,393.1 bn. Notably, the Kshs 1,161.6 bn debt servicing cost was equivalent to 56.8% of the actual revenues collected as at the end of June 2023, which is 26.8% points above IMF’s recommended threshold of 30.0%, emphasizing on how much public debt servicing weighs on the country’s expenditure.
We note that the government failed to achieve its revenue targets, mainly attributable to the poor business environment experienced during the FY’2022/2023 occasioned by the elevated inflationary pressures during the period, which averaged at 8.8%, coupled with the shilling depreciation. Notably, the shilling depreciated by 19.2% during FY’2022/2023, leading to high cost of importation, and as a result, the volume of new business declined as consumers cut back on spending. In FY’2023/2024 the government projects revenue mobilization of Kshs 3.0 tn of which Kshs 2.6 tn to be mobilized from ordinary taxes. As such, the government relies on the effectiveness of the Kenya Revenue Authority in collecting taxes as well as an increase in some of the existing taxes to meet its revenue target. However, there are still concerns about the government's ability to meet its revenue collection targets in FY’2023/2024 due to the poor operating environment. The business environment has deteriorated, with the Purchasing Managers Index (PMI) in July 2023 slumping to 45.5, signalling a stronger downturn of the business environment at the start of FY’2023/2024.
Monthly Highlights:
- The Kenya National Bureau of Statistics (KNBS) recently released the Q1'2023Quarterly Gross Domestic Product (GDP) Report, highlighting that the Kenyan economy recorded a 5.3% growth in Q1’2023, albeit slower than the 6.2% growth recorded in Q1’2022. For more information, please see our Cytonn weekly #27/2023
- The Kenya National Bureau of Statistics released the Q1’2023 Quarterly Balance of Payment Report,highlighting that Kenya’s balance of payments position recorded a 6.0% deterioration, with the deficit widening to Kshs 127.8 bn in Q1’2023, from a deficit of Kshs 120.6 bn recorded in Q1’2022 and a significant deterioration from the Kshs 29.1 bn deficit recorded in Q4’2022. For more information, please see our Cytonn weekly #27/2023,
- Stanbic Bank released its monthly Purchasing Manager’s Index (PMI), highlighting that the index for the month of June 2023 came in at 47.8, down from 49.4 in May 2023, signalling a stronger downturn of the business environment in the fifth month running in June 2023. For more information, please see our Cytonn weekly #27/2023,
- United Nations Conference on Trade and Development (UNCTD) released the 2023 World Investment Report, highlighting that Kenya recorded an enormous growth in Foreign Direct Investment (FDI), having grown by 63.9% to USD 759.1 mn in 2022 from USD 463.0 mn in 2021 after a five-year dip leading to 2021. The significant increase is mainly attributable to a range of policy interventions to mobilize resources and investments within the renewable energy sector. For more information, please see our Cytonn weekly #28/2023,
- The Energy and Petroleum Regulatory Authority (EPRA) released their monthly statement on the maximum retail fuel prices in Kenya, effective 15 July 2023 to 14 August 2023. Notably, prices for Super Petrol and Kerosene declined 0.4% and 2.3% to Kshs 194.7 and Kshs 169.5, respectively, from Kshs 195.5 and 173.4 per litre. However, the price of diesel remained unchanged at Kshs 179.7 per litre. For more information, please see our Cytonn weekly #28/2023,
- Kenya Revenue Authority (KRA) released the annual revenue performance for FY’2022/2023 highlighting that the total revenue collection amounted to Kshs 2.2 tn against the target of Kshs 2.3 tn, translating to a target achievement of 95.3%. For more information, please see our Cytonn weekly #28/2023,
- International Monetary Fund (IMF) announced that it had completed the fifth review of the 38-month Extended Fund Facility (EFF) and Extended Credit Facility (ECF) financing for Kenya allowing for an immediate disbursement of USD 415.4 mn (Kshs 58.9 bn), inclusive of USD 110.3 mn (Kshs 15.6 bn) from an augmentation of access. The board also approved Kenya’s request for a 20-month arrangement under the Resilience and Sustainability Facility (RSF), amounting to USD 551.4 mn (Kshs 78.1 bn) in a bid to build resilience against the impacts of climate change and attract additional private investment towards climate-related initiatives. For more information, please see our Cytonn weekly #29/2023, and
- Fitch Ratings, a global credit rating agency, revised the outlook on Kenya's Long-Term Foreign-Currency Issuer Default Rating (IDR) to negative from stable and affirmed the IDR at 'B', mainly due to external financing constraints amid high funding requirements, including a USD 2.0 bn Eurobond maturity in 2024, weakening forex reserves, rising financing costs, and uncertainty regarding the fiscal trajectory. For more information, please see our Cytonn weekly #29/2023,
Rates in the Fixed Income market have been on an upward trend given the continued high demand for cash by the government and the occasional liquidity tightness in the money market. The government is 48.7% behind its prorated net domestic borrowing target of Kshs 60.8 bn, having a net borrowing position of Kshs 31.2 bn of the domestic net borrowing target of Kshs 586.5 bn for the FY’2023/2024. Therefore, we expect a continued upward readjustment of the yield curve in the short and medium term, with the government looking to bridge the fiscal deficit through the domestic market. Owing to this, our view is that investors should be biased towards short-term fixed-income securities to reduce duration risk.
Market Performance:
During the month of July, the equities market recorded a mixed performance with NASI declining by 1.4%, while NSE 20 and NSE 25 gained by 0.1% and 0.01%, respectively. The equities market performance was driven by losses recorded by large cap stocks such as EABL, Diamond Trust Bank (DTB-K) and Safaricom of 9.0%, 4.3%, and 3.4%, respectively. The losses were however mitigated by gains recorded by banking stocks such as Equity Group, ABSA Bank, and, Standard Chartered Bank of Kenya (SCBK) of 7.2%, 4.7% and 2.8%, respectively.
During the week, the equities market was on an upward trajectory, with NASI, NSE 20 and NSE 25 gaining by 1.0%, 0.8% and 0.7%, respectively, taking the YTD performance to losses of 16.6%, 4.8%, and, 12.1% for NASI, NSE 20, and NSE 25, respectively. The equities market performance was mainly driven by gains recorded by large cap stocks such as NCBA, Diamond Trust Bank (DTB-K) and Bamburi of 8.7%, 4.9% and 4.2%, respectively. The gains were however weighed down by losses recorded by other large cap stocks such as EABL of 6.8%.
Equities turnover increased by 84.1% in the month of July to USD 53.8 mn from USD 29.2 mn recorded in June 2023. Foreign investors turned net sellers, with a net selling position of USD 21.2 mn, from a net buying position of 0.8 mn recorded in June.
During the week, equities turnover declined by 90.4% to USD 2.9 mn, from USD 30.4 mn recorded the previous week taking the YTD turnover to USD 509.6 mn. Foreign investors turned net buyers, with a net buying position of USD 0.1 mn, from a net selling position of USD 23.4 mn recorded the previous week, taking the YTD foreign net selling position to USD 277.2 mn.
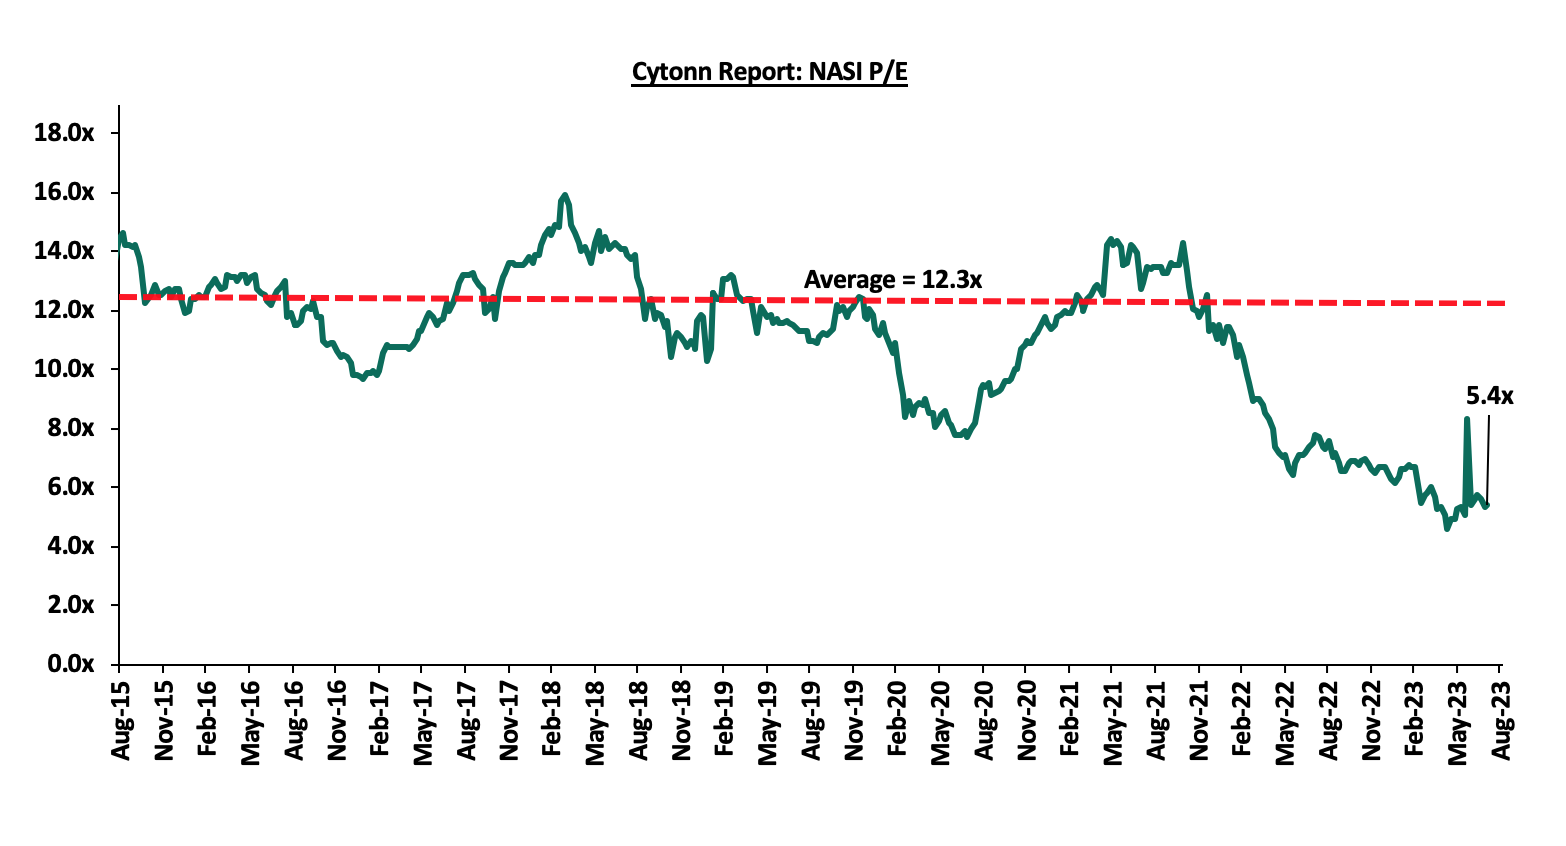
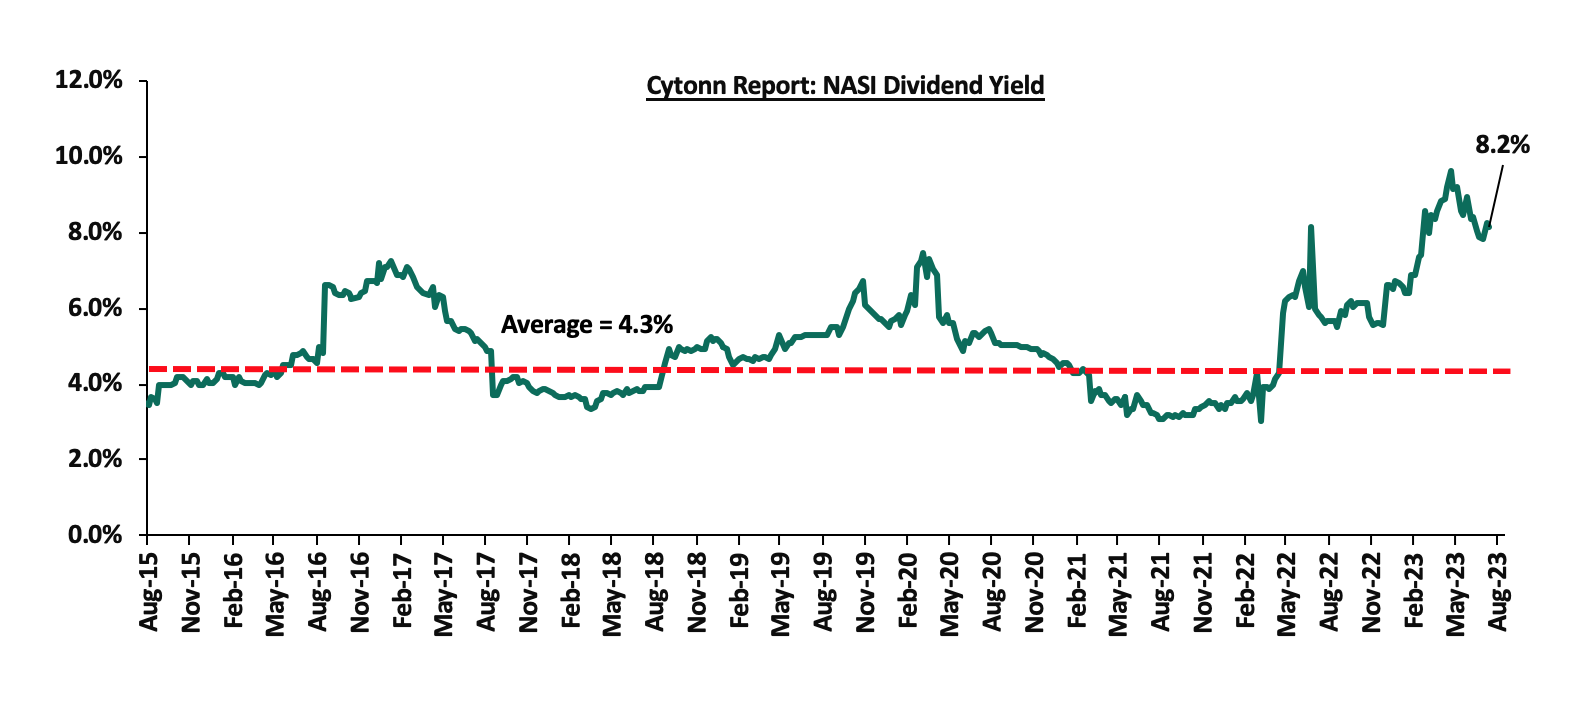
The market is currently trading at a price to earnings ratio (P/E) of 5.4x, 56.2% below the historical average of 12.3x, and a dividend yield of 8.2%, 3.9% points above the historical average of 4.3%. Key to note, NASI’s PEG ratio currently stands at 0.7x, an indication that the market is undervalued relative to its future growth. A PEG ratio greater than 1.0x indicates the market may be overvalued while a PEG ratio less than 1.0x indicates that the market is undervalued. The charts below indicate the historical P/E and dividend yields of the market;
Monthly highlights:
- Cooperative Bank of Kenya disclosed that it had received a USD 100.0 mn (Kshs 13.8 bn) loan facility with a maturity of 7 years from the consortium of financial institutions led by DEG which is aimed at providing loans to Micro Small and Medium Enterprises ( MSMEs) operating in Kenya. For more information, please see our Cytonn Weekly #29/2023.
Universe of coverage:
|
Company |
Price as at 28/07/2023 |
Price as at 04/08/2023 |
w/w change |
m/m change |
YTD Change |
Year Open 2023 |
Target Price* |
Dividend Yield |
Upside/ Downside** |
P/TBv Multiple |
Recommendation |
|
Liberty Holdings |
3.6 |
4.0 |
9.9% |
(3.7%) |
(20.6%) |
7.1 |
5.9 |
0.0% |
48.0% |
0.3x |
Buy |
|
KCB Group*** |
28.6 |
29.4 |
3.0% |
(2.7%) |
(23.3%) |
45.6 |
41.3 |
6.8% |
47.1% |
0.5x |
Buy |
|
Jubilee Holdings |
185.0 |
186.3 |
0.7% |
2.8% |
(6.3%) |
316.8 |
260.7 |
6.4% |
46.4% |
0.3x |
Buy |
|
Kenya Reinsurance |
1.8 |
1.9 |
6.1% |
2.8% |
2.1% |
2.3 |
2.5 |
10.5% |
41.9% |
0.2x |
Buy |
|
Britam |
5.0 |
4.4 |
(12.8%) |
0.4% |
(16.3%) |
7.6 |
6.0 |
0.0% |
37.2% |
0.6x |
Buy |
|
Co-op Bank*** |
11.9 |
12.1 |
1.7% |
(2.5%) |
(0.4%) |
13.0 |
15.0 |
12.4% |
36.5% |
0.6x |
Buy |
|
Sanlam |
7.4 |
7.6 |
2.2% |
3.0% |
(20.9%) |
11.6 |
10.3 |
0.0% |
35.8% |
2.1x |
Buy |
|
Equity Group*** |
40.6 |
41.0 |
1.0% |
7.2% |
(9.0%) |
52.8 |
51.2 |
9.8% |
34.6% |
0.9x |
Buy |
|
ABSA Bank*** |
12.4 |
12.4 |
0.0% |
4.7% |
1.6% |
11.8 |
14.7 |
10.9% |
29.2% |
1.0x |
Buy |
|
NCBA*** |
38.4 |
41.7 |
8.7% |
(1.0%) |
7.1% |
25.5 |
48.9 |
10.2% |
27.3% |
0.8x |
Buy |
|
Standard Chartered*** |
164.8 |
165.5 |
0.5% |
2.8% |
14.1% |
130.0 |
183.9 |
13.3% |
24.4% |
1.1x |
Buy |
|
Diamond Trust Bank*** |
46.1 |
48.4 |
4.9% |
(4.3%) |
(3.0%) |
59.5 |
54.6 |
10.3% |
23.2% |
0.2x |
Buy |
|
CIC Group |
2.2 |
2.2 |
0.5% |
14.7% |
15.7% |
2.2 |
2.5 |
5.9% |
19.0% |
0.7x |
Accumulate |
|
Stanbic Holdings |
120.0 |
120.3 |
0.2% |
7.9% |
17.9% |
87.0 |
127.9 |
10.5% |
16.8% |
0.9x |
Accumulate |
|
HF Group |
4.7 |
5.0 |
7.1% |
(4.8%) |
58.1% |
3.8 |
5.8 |
0.0% |
16.7% |
0.2x |
Accumulate |
|
I&M Group*** |
18.7 |
19.0 |
1.9% |
11.1% |
11.4% |
21.4 |
19.5 |
11.8% |
14.3% |
0.4x |
Accumulate |
|
Target Price as per Cytonn Analyst estimates **Upside/ (Downside) is adjusted for Dividend Yield ***For Disclosure, these are stocks in which Cytonn and/or its affiliates are invested in |
|||||||||||
We are “Neutral” on the Equities markets in the short term due to the current adverse operating environment and huge foreign investor outflows, and, “Bullish” in the long term due to current cheap valuations and expected global and local economic recovery.
With the market currently trading at a discount to its future growth (PEG Ratio at 0.7x), we believe that investors should reposition towards value stocks with strong earnings growth and that are trading at discounts to their intrinsic value. We expect the current high foreign investors sell-offs to continue weighing down the equities outlook in the short term.
- Industry Reports
During the month, the following industry reports were released and the key take-outs were as follows:
|
Cytonn Report: Notable Industry Reports During the Month of July 2023 |
|||
|
# |
Theme |
Report |
Key Take-outs |
|
1 |
Residential and Land Sectors |
House Price Index Q2’2023, and, Land Price Index Q2’2023 Reports by Hass Consult |
|
|
2 |
General Real Estate |
Q1’2023 Gross Domestic Product (GDP) Report by the Kenya National Bureau of Statistics (KNBS) |
|
We expect to continue witnessing growth in Kenya's Real Estate sector in terms of activity, propelled by: i) the government's increased focus on affordable housing leading to growth of the construction sector, ii) the accommodation and food sectors' sustained recovery and continued resilience in post COVID-19, and, iii) positive demographics above the global averages, thus driving the demand for Real Estate upward. However, we expect hindrances to the sector's optimal performance, primarily due to high construction costs worsened by inflationary pressures, resulting from both local and global economic shocks. Additionally, the depreciation of the Kenyan shilling against major international trading currencies such as the United States Dollar (USD) could potentially amplify the import bill for crucial construction materials like cement, paint, and steel, thereby further decelerating the growth of the construction sector.
- Residential Sector
Notable highlights in the sector during the month include;
- The International Finance Corporation (IFC), the development and investment affiliate of the World Bank Group, disclosed details of its proposed Kshs 3.0 bn (USD 20.9 mn) equity co-investment package to support the development and acquisition of approximately 5,000 newly built, resource-efficient, and affordable green housing properties in the Nairobi Metropolitan Area (NMA), with a minimum of 15.0% of the committed funds set to be allocated selectively to other counties in Kenya. For more information, please see our Cytonn Weekly #29/2023.
We expect to continue seeing prioritized efforts by the current administration to address the annual housing deficit in Kenya, which is estimated to be at 80.0% according to the National Housing Corporation (NHC). The government has aimed to address this deficit by partnering with the private sector and implementing public sector interventions to provide supporting infrastructure, and streamline transactions in the sector for execution of affordable housing options for its citizens. However, exorbitant cost of financing in the development of housing units, and, the rising constructions costs to hinder optimal performance of the sector by increasing development costs for developers.
- Retail Sector
Notable highlights during the month include;
- Chain store Naivas Supermarket opened two new outlets located at Kisii Retail Centre mall along Hospital Road, Kisii, and at the newly opened Festival mall along the Mombasa-Malindi Highway, bringing the retailer’s number of operating outlets countrywide to 97. For more information, please see our Cytonn Weekly #30/2023,
- Retail chain store Quickmart Supermarket opened a new outlet located in Eastlands next to Total Petrol Station, along Kangundo Road, Nairobi, bringing the retailer’s number of operating outlets countrywide to 59. For more information, please see our Cytonn Weekly #30/2023, and,
- IBL Group, a Mauritian business conglomerate, announced plans to subscribe to additional shares in Mambo Retail Limited, which will acquire an additional 11.0% stake worth Kshs 5.8 bn in Naivas International Limited, bringing the firm’s holding to 51.0% of the shares in Naivas. This comes several months after the group of foreign firms acquired an 8.5% stake in Naivas worth Kshs 4.5 bn which brought their ownership of the retail chain to 40.0%. For more information, please see our Cytonn Weekly #27/2023.
We anticipate a sustained upsurge in activities within the Kenyan retail industry, supported by; i) ongoing expansion efforts by retailers in pursuit of a larger market share and dominance, ii) increased capital investments from foreign entities in the Kenyan retail market, iii) growing demand for goods, services, and retail space, driven by favorable demographics in the country, and, iv) infrastructural developments enhancing accessibility in regions, thus opening up new opportunities for retail investment. However, the sector's optimal performance is expected to be subdued by challenging economic conditions such as inflationary pressures, weighing down on consumer purchasing power. Additionally, the oversupply of retail spaces, currently estimated at 3.3 mn SQFT in the Nairobi Metropolitan Area (NMA) and 2.1 mn SQFT in the larger Kenyan retail sector (excluding NMA), will continue to subdue the sector.
- Industrial Sector
Notable highlights in the sector include;
- Tatu City Limited, Chandaria Properties, M&T Construction and Steel Structures broke ground for the construction of ‘The Link’, a warehousing and logistics park, located in Tatu City, Kiambu County. The facility will offer quality warehouse spaces ranging across 800 SQM to 8,000 SQM, targeting Small and Medium Enterprise (SME) businesses in the Tatu City Special Economic Zone (SEZ). For more information, please see our Cytonn Weekly #30/2023.
We expect Kenya's industrial sector will continue to experience growth and development activities, driven by several factors including; i) increased demand for warehousing facilities in the retail sector, resulting from the rising demand for physical space to store e-commerce goods, ii) government's accelerated focus on spurring the production of agricultural and horticultural products in order to enhance the volumes of Kenya-farmed produce exported to international markets, iii) Kenya's continued recognition as a regional hence attracting investments, iv) increased financial capital injection for the growth of MSMEs in the country by foreign Private Equity (PE) funds and multilateral organizations like the World Bank, with facilitations managed by local financial institutions, and, v) infrastructural developments supporting the output of Special Economic Zones (SEZs) such as Tatu City.
- Regulated Real Estate Funds
- Real Estate Investment Trusts (REITs)
During the week, Laptrust Imara I-REIT and Acorn Holdings released their H1’2023 financial results, highlighting that both Acorn D-REIT and I-REIT recorded profits of Kshs 170.2 mn and Kshs 113.3 mn, respectively. Additionally, Laptrust Imara I-REIT recorded Kshs 99.6 mn in net earnings, and Kshs 203.3 mn in total operating income for the period H1’2023.
The table below includes a summary of the three REIT’s performance in H1’2023;
|
Cytonn Report: Laptrust Imara and Acorn Holdings REITS H1'2023 Financial Results Summary |
|||||||
|
|
Laptrust Imara I-REIT |
Acorn I-REIT |
Acorn D-REIT |
||||
|
Balance Sheet |
H1'2023 |
H1'2022 |
H1'2023 |
y/y Change |
H1'2022 |
H1'2023 |
y/y Change |
|
(Figures in Kshs bn Unless Stated Otherwise) |
|||||||
|
Total Assets |
7.3 |
4.9 |
7.3 |
51.0% |
9.7 |
11.3 |
16.1% |
|
Investment Property |
6.9 |
4.4 |
6.6 |
47.9% |
9.3 |
10.5 |
13.3% |
|
Total Equity |
7.0 |
4.7 |
6.3 |
34.4% |
5.6 |
6.5 |
17.4% |
|
Total Liabilities |
0.3 |
0.1 |
1.0 |
623.3% |
4.1 |
4.7 |
14.2% |
|
Income Statement |
|||||||
|
(Figures in Kshs mn Unless Stated Otherwise) |
|||||||
|
Rental Income |
167.1 |
185.9 |
324.8 |
74.7% |
138.9 |
162.0 |
16.6% |
|
Income from Other Sources |
36.2 |
0.2 |
0.3 |
53.4% |
0.0 |
0.02 |
0.0% |
|
Total Operating Income |
203.3 |
186.0 |
325.0 |
74.7% |
397.5 |
515.6 |
35.9% |
|
Operating Expenses |
103.6 |
115.5 |
197.0 |
70.6% |
146.2 |
181.4 |
24.1% |
|
Profit/Loss |
99.6 |
123.2 |
113.3 |
(8.0%) |
105.3 |
170.2 |
61.7% |
|
Basic EPS (Kshs) |
0.3 |
0.6 |
0.4 |
(29.0%) |
0.5 |
0.7 |
45.9% |
|
Ratios Summary |
|||||||
|
ROA |
1.36% |
2.5% |
1.5% |
(1.0%) |
1.1% |
1.5% |
0.4% |
|
ROE |
1.42% |
2.6% |
1.8% |
(0.8%) |
1.9% |
2.6% |
0.7% |
|
Debt Ratio |
4.2% |
2.8% |
13.5% |
10.7% |
42.5% |
41.9% |
(0.7%) |
|
Operating Expense to Total Income Ratio |
51.0% |
62.1% |
60.6% |
(1.5%) |
38.5% |
35.2% |
(3.3%) |
|
Operating Expense to Investment Property Ratio |
1.5% |
2.6% |
3.0% |
0.4% |
1.6% |
1.7% |
0.1% |
|
PBT Margin |
59.6% |
66.3% |
34.9% |
(31.4%) |
27.7% |
33.0% |
5.3% |
|
Rental Yield |
2.4% |
4.2% |
5.0% |
0.8% |
1.5% |
1.5% |
0.0% |
|
Annualized Rental Yield |
4.9% |
8.6% |
10.1% |
1.5% |
3.0% |
3.1% |
0.1% |
The key take-outs include;
Laptrust Imara I-REIT
- The basic earnings per unit came in at Kshs 0.3 in H1’2023. The performance was driven by Kshs 99.6 mn recorded in net earnings in H1’2023, and Kshs 203.3 mn in total operating income.
- Rental and related income for the REIT stood at 167.1 mn in H1’2023, implying a gross rental yield of 2.4% on interest earning assets. This was attributed to lower rental and related income realized in H1’2023 coming in at Kshs 167.1 mn, while investment property came in at Kshs 6.9 bn. Annualized rental yield stands at 4.9%,
- Interest income in the period under review came in at Kshs 3.6 mn attributable to the high interest rates being experienced in the market currently,
- Total operating expenses for the REIT came in at Kshs 103.6 mn in H1’2023, attributed to Kshs 69.5 mn incurred in property expenses and Kshs 34.1 mn in fund operating expenses. Notably, utility expenses came in at Kshs 25.3 mn, whereas property valuation fees stood at 14.5 mn, accounting for 57.2% of the total property expenses in H1’2023,
- Trustee fees in H1’2023 stood at Kshs 21.6 mn, accounting for 63.3% of the total fund operation expenses. Key to note, expenses made up 51.0% of the total operating income,
- Total assets for the REIT stood at Kshs 7.3 bn in H1’2023, comprising of Kshs 6.9 bn in investment property, Kshs 0.3 bn in cash and cash equivalents, and Kshs 0.1 bn in trade and other receivables, and,
- Total liabilities in H1’2023 came in at Kshs 308.1 mn in H1’2022 wholly attributable to trade and other payables. For a more comprehensive analysis, please see our Laptrust Imara I-REIT H1’2023 Earnings Note.
Acorn I-REIT
- The basic earnings per unit for the Acorn I-REIT decreased by 29.0% to Kshs 0.39, from Kshs 0.55 in H1’2022, driven by a 8.0% decrease in the I-REIT’s profits which came in at Kshs 113.3 mn, from Kshs 123.2 mn in H1’2022. The decrease in profits was attributable to a significant increase in finance costs to Kshs 45.6 mn in H1’2023 from Kshs 0.06 mn coupled with a 70.6% increase in total operating expenses to Kshs 197.0 mn from Kshs 115.5 mn in H1’2022,
- Total operating expenses came in at Kshs 197.0 mn in H1’2023, a 70.6% increase from Kshs 115.5 mn in H1’2022. This was mainly driven by increase in; i) administrative expenses by 78.5% to Kshs 120.7 mn in H1’2023 from Kshs 67.6 mn in H1’2022, and, ii) fund-operating expenses by 59.4% to Kshs 76.3 mn in H1’2023 from Kshs 47.8 mn in H1’2022,
- Total assets for the I-REIT increased by 51.0% to Kshs 7.3 bn in H1’2023, from Kshs 4.9 bn in H1’2022. The increase in assets was mainly on the back of a 47.9% increase in investment property, coming in at Kshs 6.6 bn, from Kshs 4.4 bn in H1’2022 as it acquired the Qwetu Aberdare Heights I in October 2022, and,
- Total liabilities for the I-REIT increased by 623.3% to Kshs 1.0 bn in H1’2023, from Kshs 0.1 bn in H1’2023 as a result of increase in payables to Kshs 172.3 mn in H1’2023, from Kshs 136.6 mn in H1’2022.
Acorn D-REIT
- The basic earnings per unit for the Acorn D-REIT increased by 45.9% to Kshs 0.66 in H1’2023 from Kshs 0.45 in H1’2022. This was mainly driven by a 16.6% increase in the rental income to Kshs 162.0 mn, from Kshs 138.9 mn in H1’2022, coupled with a 47.0% increase in fair value of investment properties to Kshs 353.6 mn, from Kshs 240.6 mn in H1’2022,
- The total operating expenses for the D-REIT increased by 26.6% to Kshs 181.4 mn in H1’2023 from Kshs 146.2 mn in H1’2022. This was driven by an increase in the; i) administrative expenses by 45.0% to Kshs 77.1 mn in H1’2023 from Kshs 53.2 mn in H1’2022, and, ii) fund-operating expenses by 12.1% to Kshs 104.3 mn in H1’2023 from Kshs 93.0 mn in H1’2022,
- Total assets for the D-REIT increased by 16.1% to Kshs 11.3 bn in H1’2023, from Kshs 9.7 bn in H1’2022. The increase in assets was mainly on the back of increased investment property with the D-REIT, coming in at Kshs 10.5 bn, an 13.3% increase from Kshs 9.3 bn in H1’2022,
- Total liabilities for the D-REIT increased by 14.2% to Kshs 4.7 bn, from Kshs 4.1 bn in H1’2022 largely driven by; i) 19.5% increase in long-term borrowings which came in at Kshs 3.9 bn in H1’2023 from Kshs 3.3 bn in H1’2022, and ii) 28.0% increase in trade and other payables to Kshs 504.1 mn from Kshs 393.8 mn in H1’2022.
For a more comprehensive analysis, please see our, and Acorn Holdings H1’2023 Earnings Note.
Notably, as at 30th June 2023,
- Acorn Student Accommodation (ASA) I-REIT had five completed student housing properties with 3,003 beds under their management serving up to 128 universities and colleges. These properties include; i) Qwetu Jogoo Road, ii) Qwetu Ruaraka, iii) Qwetu Karen, iv) Qwetu WilsonView in Lang’ata, v) Qwetu Parklands, vi) Qejani Karen, and vii) Qwetu Aberdare Heights I along Thika Road next to United States International University Africa (USIU-A),
- The ASA I-REIT and ASA D-REIT have entered into a legally bidding agreement for the acquisition of Qwetu Hurlingham, along Arwings Kodhek Road. The property commenced operations in January 2022 and caters to serve tertiary- education students within Hurlingham area and surrounding regions, primarily targeting Daystar University, University of Nairobi (UoN) School of Medicine, Riara University and Strathmore University students. The transaction is scheduled to be finalized in Q3’2023. The acquisition decision by ASA I-REIT was driven by the impressive performance exhibited by the property since its inception, achieving stabilization within just 11 months of operation, and consistently high monthly occupancy rate of over 90.0% since project completion,
- Sale proceeds from the acquisition will serve a dual purpose as a significant portion of the funds will be allocated towards repaying the Acorn Green Bond amounting to Kshs 860.6 mn that was floated in 2020. The planned transfer of both Qwetu Hurlingham will make it the third project acquired by Acorn I-REIT, after successful acquisitions of Qwetu WilsonView in February 2021, and Qwetu Aberdare Heights I in October 2022. Additionally, the I-REIT is on another roadmap for a planned acquisition of Qwetu Aberdare Heights II with bed capacity of 601 in Ruaraka, and,
- Currently ongoing projects by Acorn holdings include; i) Qwetu Chiromo and Qejani Chiromo projects on Riverside drive at a cost of Kshs 833.0 mn and Kshs 852.2 mn respectively set to be opened in H1’2023, with a total bed capacity of 2,695, ii) Qejani JKUAT at a cost of Kshs 639.6 mn, iii) Qejani Hurlingham at a cost of Kshs 772.2 mn to supplement supply on Qwetu Hurlingham phase one offering, with a total bed capacity of 1,280, and, iv) Qwetu Kenyatta University (KU) and Qejani KU at a cost of Kshs 717.6 mn and Kshs 815.8 mn respectively, expected to deliver 2,186 beds to the D-REIT portfolio.
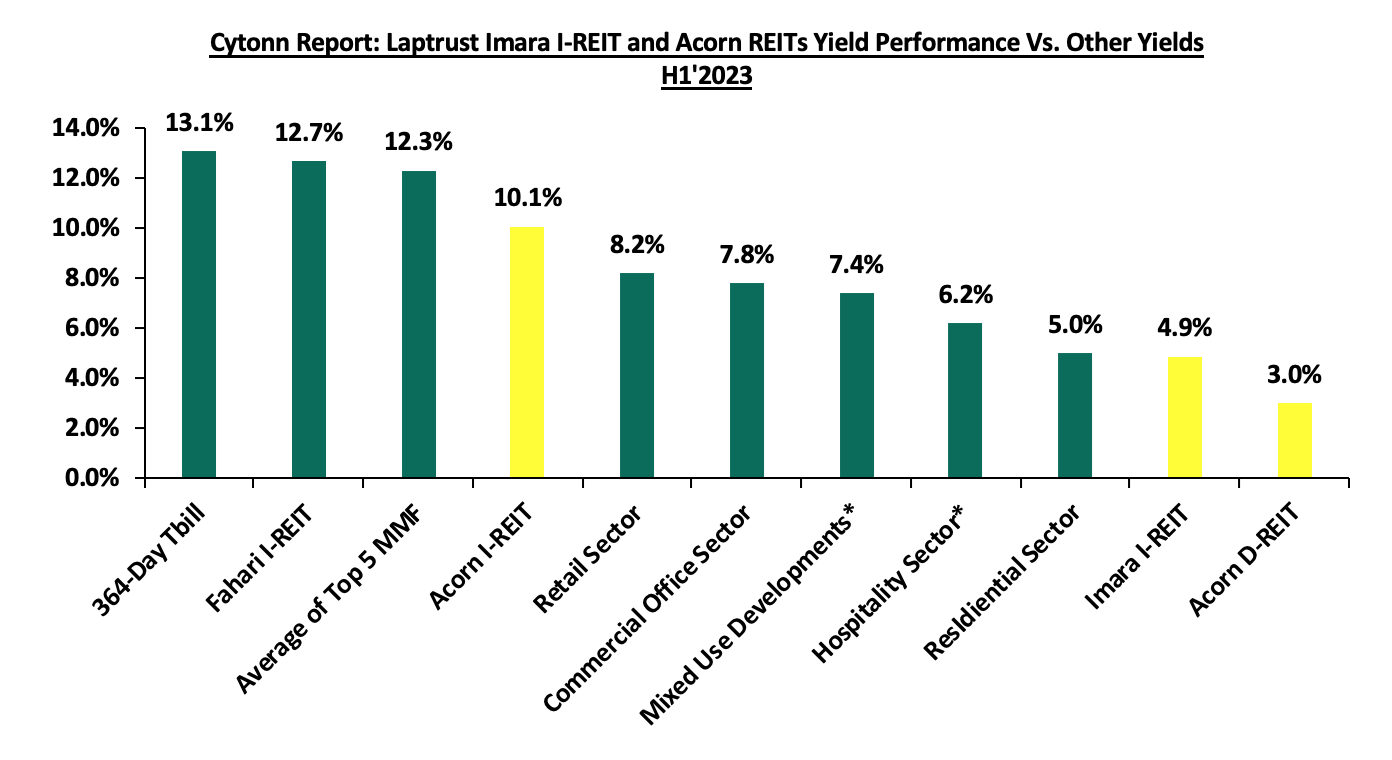
The chart below shows the comparison of Laptrust Imara I-REIT and Acorn REITs yield performance versus other yields in H1’2023;
*FY’2022
Source: Cytonn Research
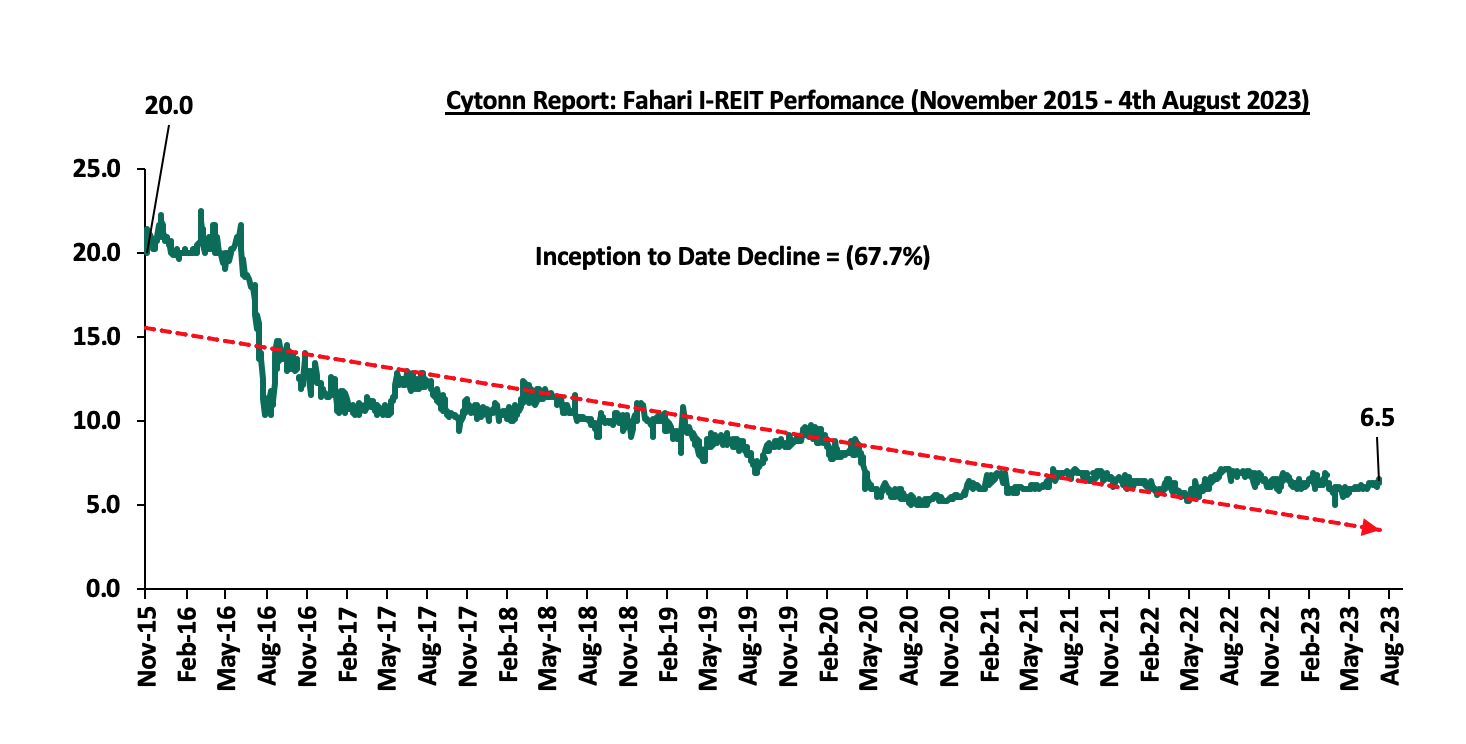
In the Nairobi Securities Exchange, ILAM Fahari I-REIT closed the week trading at an average price of Kshs 6.5 per share. The performance represented a 3.9% gain from the Kshs 6.2 recorded the previous week, taking it to a 4.7% Year-to-Date (YTD) decline from Kshs 6.8 per share recorded on 3 January 2023. In addition, the performance represented a 67.7% Inception-to-Date (ITD) loss from the Kshs 20.0 price. The dividend yield currently stands at 10.1%. The graph below shows Fahari I-REIT’s performance from November 2015 to 4 August 2023;
In the Unquoted Securities Platform, Acorn D-REIT and I-REIT traded at Kshs 23.9 and Kshs 21.6 per unit, respectively, as at 4 August 2023. The performance represented a 19.5% and 8.0% gain for the D-REIT and I-REIT, respectively, from the Kshs 20.0 inception price. The volumes traded for the D-REIT and I-REIT came in at 12.3 mn and 30.2 mn shares, respectively, with a turnover of Kshs 257.5 mn and Kshs 624.4 mn, respectively, since inception in February 2021.
REITs provide numerous advantages, including; access to larger capital pools, consistent and prolonged profits, tax exemptions, diversified portfolios, transparency, liquidity, and flexibility as an asset class. Despite these benefits, the performance of the Kenyan REITs market remains limited by several factors, such as; i) insufficient investor understanding of the investment instrument, ii) time-consuming approval procedures for REIT creation, iii) high minimum capital requirements of Kshs 100.0 mn for trustees, and, iv) high minimum investment amounts set at Kshs 5.0 mn discouraging investments.
- Cytonn High Yield Fund (CHYF)
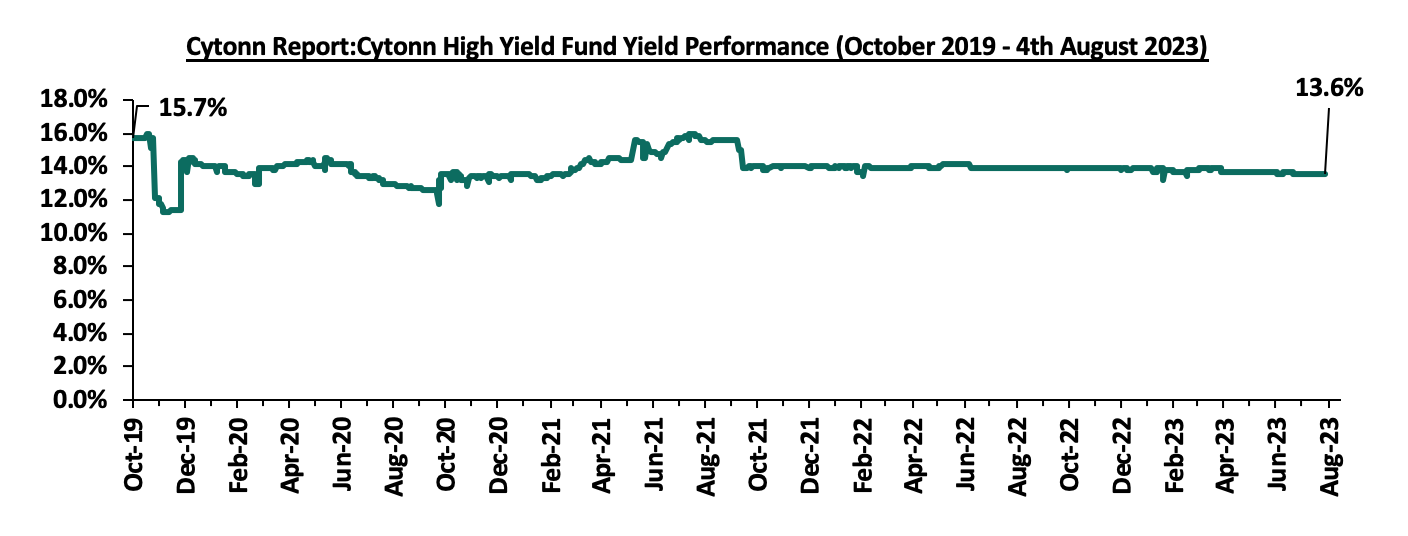
Cytonn High Yield Fund (CHYF) closed the week with an annualized yield of 13.6%, remaining relatively unchanged from the previous week. The performance also represented 0.3% points Year-to-Date (YTD) decline from 13.9% yield recorded on 1 January 2023, and 2.1% points Inception-to-Date (ITD) decline from the 15.7% yield. The graph below shows Cytonn High Yield Fund’s performance from October 2019 to 4 August 2023;
Notably, the CHYF has outperformed other regulated Real Estate funds with an annualized yield of 13.6%, as compared to Fahari I-REIT, Acorn I-REIT and Laptrust Imara I-REIT with yields of 12.7%, 10.1%, and, 4.9% respectively. As such, the higher yields offered by CHYF makes the fund one of the best alternative investment resource in the Real Estate sector. The graph below shows the yield performance of the Regulated Real Estate Funds:
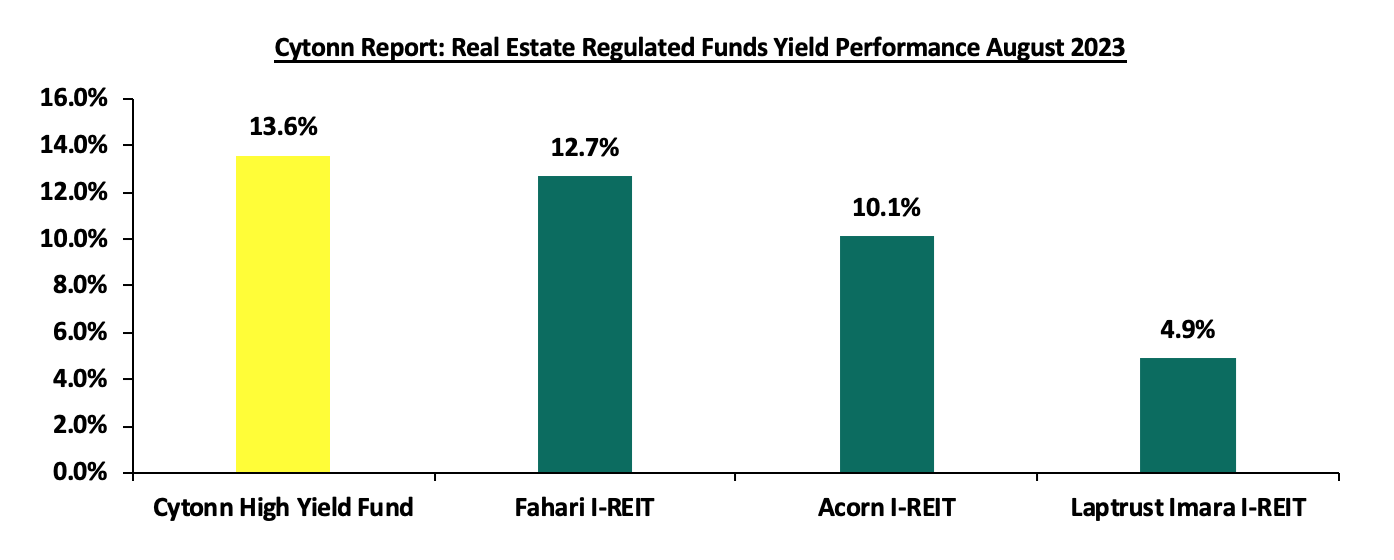
Source: Cytonn Research
We expect the performance of Kenya’s Real Estate sector to remain on an upward trajectory, mainly driven by factors such as; i) aggressive expansion drive by both local and international retailers to increase market share, ii) increased focus in the affordable housing initiative leading to growth of the construction industry, and iii) increased development activities in the industrial sector. However, i) the oversupply of space in select Real Estate sectors, including commercial office and retail, ii) rising construction costs on the back of rising inflation, and iii) limited investor knowledge and interest in REITs, are expected to weigh down on the sector's optimal performance.
Unit Trust Funds (UTFs) are Collective Investment Schemes that pool funds from multiple investors and are managed by professional fund managers. The fund managers invest the pooled funds in a diversified portfolio of securities such as equities, bonds or any authorized financial securities, with the aim of generating returns to meet the specific objectives of the fund. Following the release of the Capital Markets Authority (CMA) Quarterly Statistical Bulletin-Q2’2023, we analyze the performance of Unit Trust Funds for the period ending 31st March 2023, whose total Assets Under Management (AUM) have been steadily increasing, and are among the most popular investment options in the Kenyan market. We will further analyze the performance of Money Market Funds, a product under Unit Trust Funds.
In our previous focus on Unit Trust Funds, we looked at the Unit Trust Funds Performance – FY’2022 by Fund Managers, where we highlighted that their AUM stood at Kshs 161.0 bn, a 3.3% increase from Kshs 155.9 bn recorded in Q3’2022. In this topical, we focus on the Q1’2023 performance of Unit Trust Funds where we shall analyze the following:
- Performance of the Unit Trust Funds Industry,
- Performance of Money Market Funds,
- Comparing Unit Trust Funds AUM Growth with other Markets, and,
- Recommendations.
Section I: Performance of the Unit Trust Funds Industry
Unit Trust Funds are Investment schemes that pool funds from investors and are managed by professional Fund Managers. The fund manager invests the pooled funds with the aim of generating returns in line with the specific objectives of the fund. The Unit Trust Funds earn returns in the form of dividends, interest income, rent and/or capital gains depending on the underlying security. The main types of Unit Trust Funds include:
- Money Market Funds – These are funds that invest in fixed income securities such as fixed deposits, treasury bills and bonds, commercial papers, etc. They are very liquid, have stable returns, and, they are suitable for risk averse investors,
- Equity Funds – These are funds which largely invest in listed securities and seek to offer superior returns over the medium to long-term by maximizing capital gains and dividend income. The funds invest in various sectors to reduce concentration risk and maintain some portion of the fund’s cash in liquid fixed income investments to maintain liquidity and pay investors if need be without losing value,
- Balanced Funds – These are funds whose investments are diversified across the Equities and the Fixed Income market. Balanced Funds offer investors long-term growth as well as reasonable levels of stability of income,
- Fixed Income Funds – These are funds which invest in interest-bearing securities, which include treasury bills, treasury bonds, preference shares, corporate bonds, loan stock, approved securities, notes and liquid assets consistent with the portfolio’s investment objective, and,
- Sector Specific Funds – These are funds that invest primarily in a particular sector or industry. The funds provide a greater measure of diversification within a given sector than may be otherwise possible for the other funds. They are specifically approved by the Capital Markets Authority as they are not invested as per the set rules and regulations.
As per the Capital Markets Authority (CMA) Quarterly Statistical Bulletin-Q2’2023, the industry’s overall Assets under Management (AUM) grew by 2.0% on a quarter on quarter basis to Kshs 164.3 bn as at the end of Q1’2023, from Kshs 161.0 bn recorded in FY’2022. On a y/y basis, the total AUM increased by 16.8% to Kshs 164.3 bn, from Kshs 140.7 bn as at the end of Q1’2022. Key to note, Assets under Management of the Unit Trust Funds have registered an upward trajectory over the last five years, growing at a 5-year CAGR of 25.3% from Kshs 53.1 bn recorded in Q1’2018. The chart below shows the growth in Unit Trust Funds’ AUM:
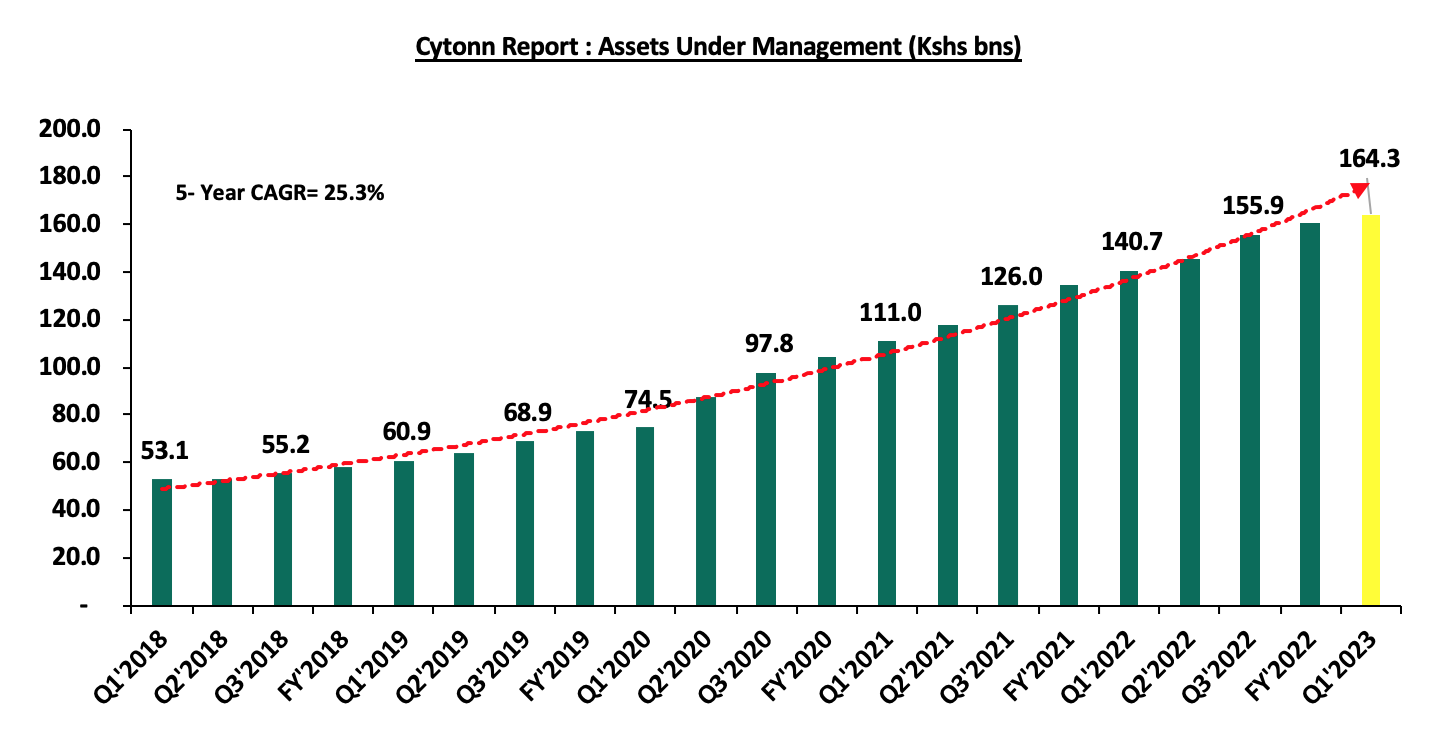
Source: Capital Markets Authority Quarterly Statistical bulletins
The growth can be largely attributed to:
- Low Investments minimums: Majority of the Unit Trust Funds Collective Investment Schemes’ (CIS) in the market require a relatively low initial investment ranging between Kshs 100.0 - Kshs 10,000.0. This has in turn has promoted financial inclusion by allowing even small scale investors to access professionally managed investments opportunities
- Increased Investor Knowledge: There has been a drive towards investor education mainly by the Capital Markets Authority (CMA) and the fund managers on the various products offered by trust funds, which has meant that more people are aware and have a deeper understanding of the investment subject. As a result, their confidence has been boosted leading to increased uptake,
- Diversified product offering: Unit Trust Funds are also advantageous in terms of providing investors with access to a wider range of investment securities through pooling of funds. This allows investors the opportunity of diversifying their portfolios which would have not been accessible if they invested on their own. Additionally, they also ensure investors are able to shield themselves against the risks associated with market volatility associated with some asset classes
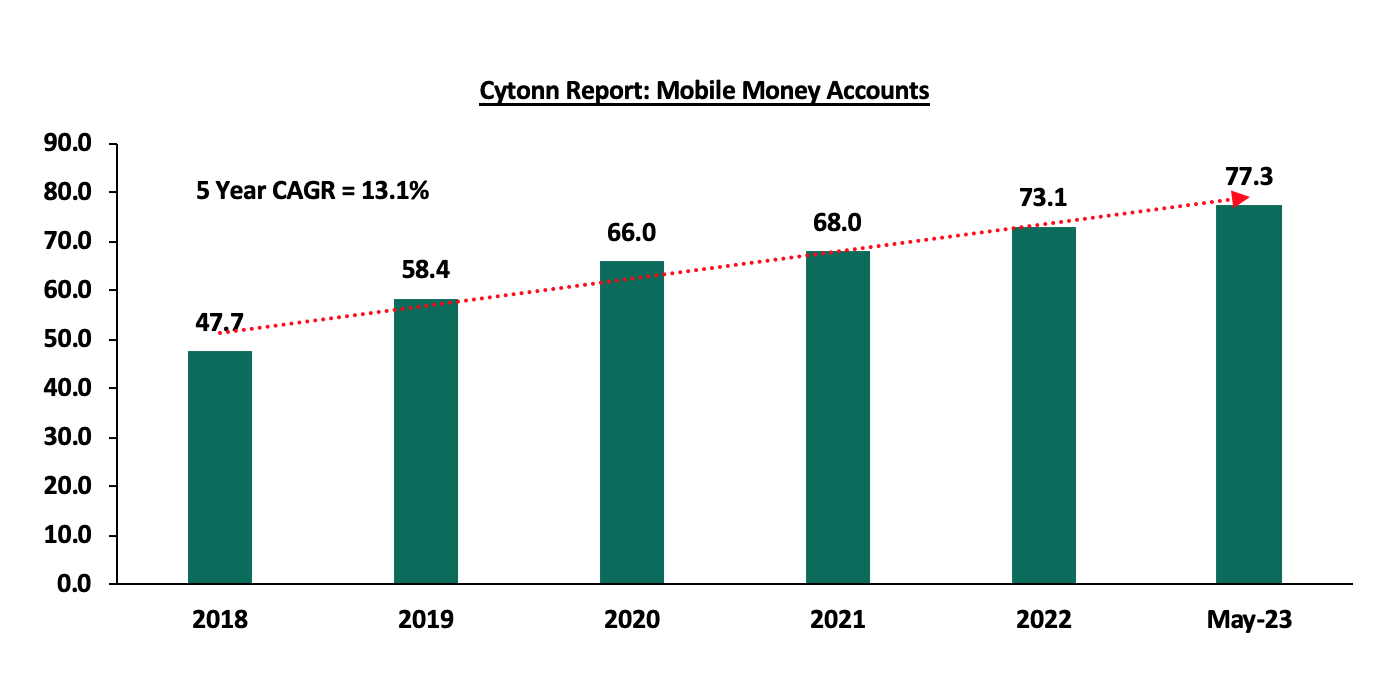
- Adoption of Fintech: Digitization and automation within the industry has enhanced ease in cash accessibility, enabling investors to immediately access their investments via mobile payment platforms. According to the Central Bank of Kenya, more individuals are transacting through mobile money services as evidenced by the increase in the total number of registered mobile money accounts to 77.3 mn in May 2023, up from 41.7 mn recorded in May 2018, translating to a 5-year CAGR of 13.1%. The graph below shows the growth in the number of mobile money accounts in the period 2018 to May 2023;
Source: CBK
Additionally, investors can easily track their investments based on principal invested as well as interest earned during various periods and the charges incurred via mobile apps,
- Competitive returns - Positive performance and competitive returns have been instrumental in attracting investors to unit trust funds. As these funds consistently outperform certain traditional investment options, more investors are drawn to their potential for generating wealth over the long term
According to the Capital Markets Authority, as at the end of Q1’2023, there were 36 Collective Investment Schemes (CISs) in Kenya, up from 34 recorded at the end of FY’2022 and 30 recorded at the end of Q1’2022. Out of the 36, 25 schemes equivalent to 69.4% were active while 11 (30.6%) were inactive. The table below outlines the performance of the Collective Investment Schemes comparing FY’2022 and Q1’2023:
|
|
Cytonn Report: Assets Under Management (AUM) for the Approved Collective Investment Schemes |
|||||
|
No. |
Collective Investment Schemes |
FY'2022 AUM |
FY’2022 |
Q1'2023 AUM |
Q1’2023 |
AUM Growth |
|
(Kshs mn) |
Market Share |
(Kshs mn) |
Market Share |
FY'2022 –Q1'2023 |
||
|
1 |
CIC Unit Trust Scheme |
61,263.9 |
38.1% |
56,970.2 |
34.7% |
(7.0%) |
|
2 |
NCBA Unit Trust Scheme |
25,342.0 |
15.7% |
27,739.7 |
16.9% |
9.5% |
|
3 |
Sanlam Unit Trust Scheme |
15,841.6 |
9.8% |
16,915.2 |
10.3% |
6.8% |
|
4 |
ICEA Unit Trust Scheme |
14,758.9 |
9.2% |
14,558.6 |
8.9% |
(1.4%) |
|
5 |
British American Unit Trust Scheme |
13,318.0 |
8.3% |
13,201.8 |
8.0% |
(0.9%) |
|
6 |
Old Mutual Unit Trust Scheme |
7,570.5 |
4.7% |
8,035.6 |
4.9% |
6.1% |
|
7 |
Dry Associates Unit Trust |
3,881.8 |
2.4% |
4,497.9 |
2.7% |
15.9% |
|
8 |
Coop Unit Trust Scheme |
3,567.4 |
2.2% |
4,011.4 |
2.4% |
12.4% |
|
9 |
Nabo Capital Ltd |
3,291.4 |
2.0% |
3,943.2 |
2.4% |
19.8% |
|
10 |
Madison Asset Unit Trust Funds |
2,923.2 |
1.8% |
3,565.4 |
2.2% |
22.0% |
|
11 |
ABSA Unit Trust Scheme |
2,342.1 |
1.5% |
2,869.6 |
1.7% |
22.5% |
|
12 |
Zimele Unit Trust Scheme |
2,605.5 |
1.6% |
2,692.9 |
1.6% |
3.4% |
|
13 |
African Alliance Kenya Unit Trust Scheme |
1,579.3 |
1.0% |
1,595.8 |
1.0% |
1.0% |
|
14 |
Mali Money Market Fund |
- |
0.0% |
877.4 |
0.5% |
0.0% |
|
15 |
Apollo Unit Trust Scheme |
871.1 |
0.5% |
862.0 |
0.5% |
(1.0%) |
|
16 |
Cytonn Unit Trust Fund |
774.5 |
0.5% |
701.4 |
0.4% |
(9.4%) |
|
17 |
Genghis Unit Trust Funds |
608.9 |
0.4% |
620.0 |
0.4% |
1.8% |
|
18 |
Orient Collective Investment Scheme |
248.0 |
0.2% |
252.2 |
0.2% |
1.7% |
|
19 |
Equity Investment Bank |
185.5 |
0.1% |
185.7 |
0.1% |
0.1% |
|
20 |
Kuza Asset Managers |
- |
0.0% |
72.1 |
0.0% |
0.0% |
|
21 |
KCB Asset Managers |
- |
0.0% |
56.3 |
0.0% |
0.0% |
|
22 |
Amana Unit Trust Funds |
27.8 |
0.0% |
26.5 |
0.0% |
(5.0%) |
|
23 |
GenAfrica Unit Trust Scheme |
2.9 |
0.0% |
19.1 |
0.0% |
549.6% |
|
24 |
Etica Capital Limited |
- |
0.0% |
5.3 |
0.0% |
0.0% |
|
25 |
Wanafunzi Investments |
0.7 |
0.0% |
0.7 |
0.0% |
2.2% |
|
26 |
Genghis Specialized Funds |
- |
- |
- |
- |
- |
|
27 |
Standard Investment Trust Funds |
- |
- |
- |
- |
- |
|
28 |
Diaspora Unit Trust Scheme |
- |
- |
- |
- |
- |
|
29 |
Dyer and Blair Unit Trust Scheme |
- |
- |
- |
- |
- |
|
30 |
Jaza Unit Trust Fund |
- |
- |
- |
- |
- |
|
31 |
Masaru Unit Trust Fund |
- |
- |
- |
- |
- |
|
32 |
Adam Unit Trust Fund |
- |
- |
- |
- |
- |
|
33 |
First Ethical Opportunities Fund |
- |
- |
- |
- |
- |
|
34 |
Amaka Unit Trust (Umbrella) Scheme |
- |
- |
- |
- |
- |
|
35 |
Jubilee Unit Trust Scheme |
|
|
|
|
|
|
36 |
Enwealth Capital Unit Trust |
|
|
|
|
|
|
|
Total |
161,004.8 |
100.0% |
164,276.0 |
100.0% |
2.03% |
Source: Capital Markets Authority: Quarterly Statistical Bulletin, Q2’2023
Key take outs from the above table include:
- Assets Under Management: CIC Unit Trust Scheme remained the largest overall Unit Trust Fund, with an AUM of Kshs 57.0 bn in Q1’2023, albeit lower than the AUM of Kshs 61.3 bn in FY’2022, translating to a 7.0% decline in AUM growth,
- Growth: In terms of AUM growth, GenAfrica Unit Trust Scheme recorded the highest growth of 549.6% with its AUM increasing to Kshs 19.1 mn, from Kshs 2.9 mn in FY’2022, equivalent to a 549.6% AUM growth, due to the low base effect. On the other hand, Cytonn Unit Trust Fund recorded the largest decline with its AUM declining by 9.4% to Kshs 701.4 mn in Q1’2023, from Kshs 774.5 mn in FY’2022,
- Market Share: CIC Unit Trust Scheme remained the largest overall Unit Trust with a market share of 34.7%, 3.4% points decline from 38.1% recorded in FY’2022. The decline in market share is an indication of increasing competition as new collective schemes enter the market,
- New Collective Investment Schemes: Mali Money Market Fund scheme, Kuza Unit trust scheme, KCB unit trust schemes, and Etica Unit trusts schemes, with AUMs of Kshs 877.4 mn, Kshs 72.1 mn, Kshs 56.3 and Kshs 5.3 mn respectively, became active collective investment schemes in the capital market during Q1’2023, increasing the number of active collective schemes to 25.
- 11 UTFs remained inactive during at the end of Q1’2023: First Ethical Opportunities Fund, Adam Unit Trust Fund, Masaru Unit Trust Fund, Jaza Unit Trust Fund, Dyer and Blair Unit Trust Scheme, Diaspora Unit Trust Scheme, Standard Investments Bank, Genghis Specialized Fund, Jubilee Unit Trust, Enwealth Capital Trust and Amaka Unit Trust remained inactive as at the end of Q1’2023,
Section II: Performance of Money Market Funds
Money Market Funds (MMFs) have continued to gain popularity in Kenya, with one of the main reasons is being the higher returns from money market funds compared to the returns on bank deposits. According to the Central Bank of Kenya data, the average deposit rate in March 2023 increased to 7.6% from 7.5% recorded in January 2023. Despite the increase, the average deposit rate continues to offer the lowest returns in compared to 91-day T-bill and money market funds average yields of 9.8% and 9.5% respectively. The graph below shows the performance of the Money Market Fund to other short-term financial instruments:
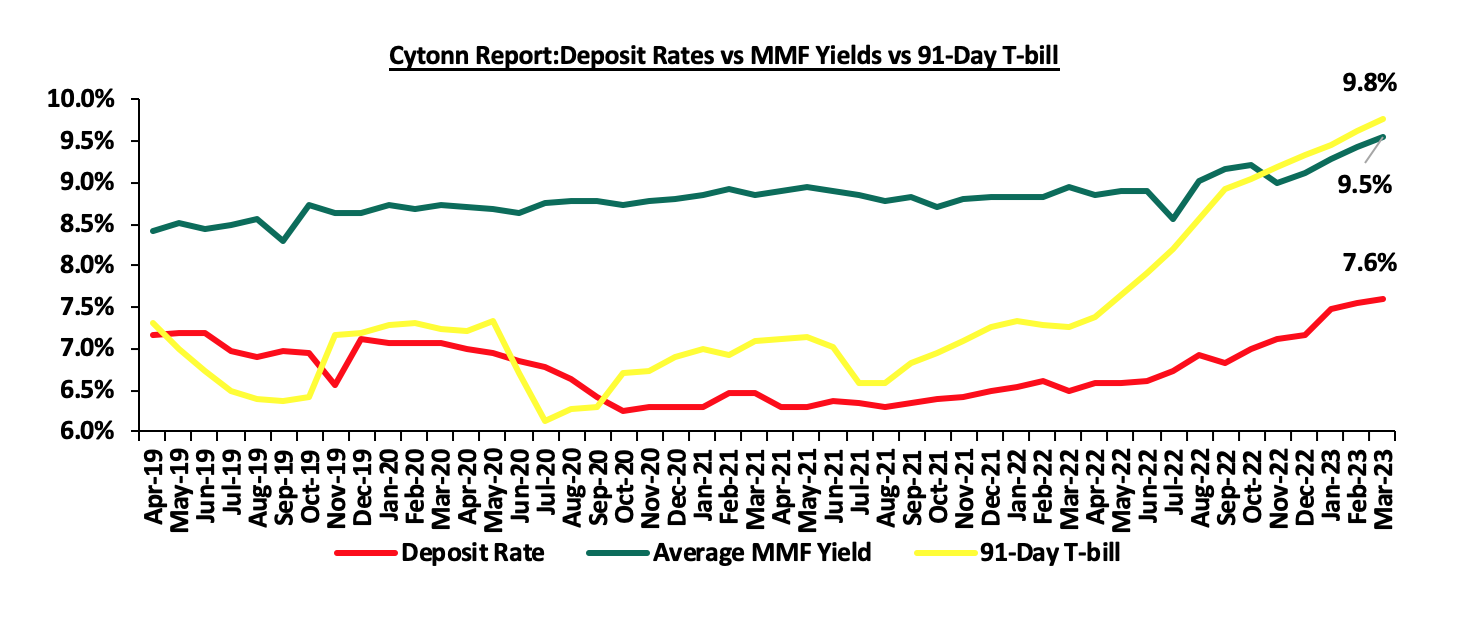
Source: Central Bank of Kenya, Cytonn Research
As per the regulations, funds in MMFs should be invested in short-term liquid interest-bearing securities with a weighted tenor to maturity of 13 months or less. The short-term securities include treasury bills, call deposits, commercial papers and fixed deposits in commercial banks and deposit taking institutions, among others as specified by CBK. As a result, the Money Market funds are best suited for investors who require a low-risk investment that offers capital stability, liquidity, but with a high-income yield. The fund is also a good safe haven for investors who wish to switch from a higher risk portfolio to a low risk portfolio, especially during times of uncertainty.
Top Five Money Market Funds by Yields
During the period under review, the following Money Market Funds had the highest average effective annual yield declared, with the Cytonn Money Market Fund having the highest effective annual yield at 10.9% against the industry Q1’2023 average of 9.4%.
|
Cytonn Report: Top 5 Money Market Fund Yield in Q1’2023 |
||
|
Rank |
Money Market Fund |
Effective Annual Rate (Average Q1'2023) |
|
1 |
Cytonn Money Market Fund |
10.9% |
|
2 |
Apollo Money Market Fund |
10.2% |
|
3 |
GenCap Hela Imara Money Market Fund |
9.9% |
|
4 |
NCBA Money Market Fund |
9.9% |
|
5 |
Zimele Money Market Fund |
9.9% |
|
|
Average of Top 5 Money Market Funds |
10.2% |
|
Industry average |
9.4% |
|
Source: Cytonn Research
Section IV: Comparison between Unit Trust Funds AUM Growth and other Markets
Unit Trust Funds’ assets recorded a y/y growth of 16.8% in Q1’2023, while the listed banks cumulative deposits recorded a slightly higher growth of 18.2% over the same period. For the Unit Trust Funds, the growth of 16.8% was a decline, compared to 19.6% growth recorded in FY’2022. On the other hand, listed banks deposits, recorded an increase of 3.6% points to 18.2%, from the 14.6% growth recorded in FY’2022. The chart below highlights the year on year AUM growths for Unit Trust Funds AUM vs Listed banks deposits growth since 2017;
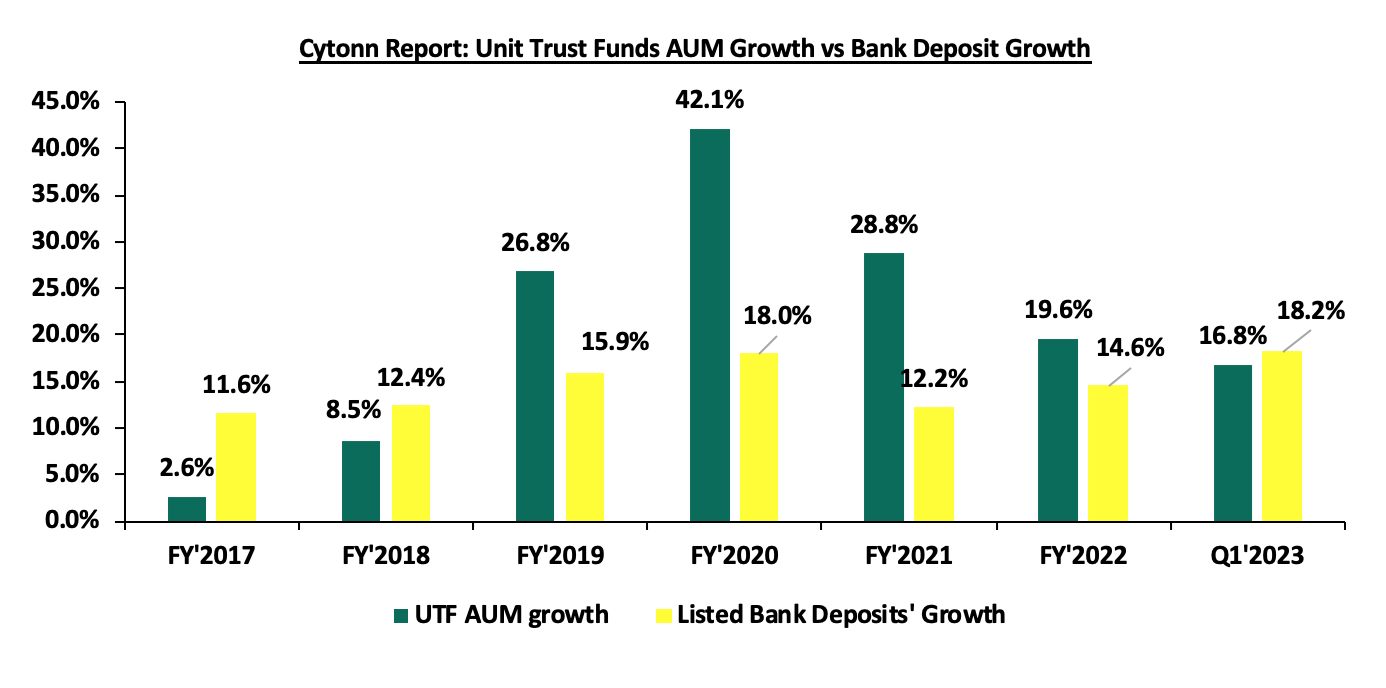
Source: Cytonn Research
We note that the 2.8% points q/q decline in UTF growth compared to listed bank deposits growth of 3.6% points during the same period is an indication of a relative slowdown in our capital markets with the faster growth of bank deposits pointing towards a constrained capital market. According to the World Bank data, in well-functioning economies, businesses rely on bank funding for a mere 40.0%, with the larger percentage of 60.0% coming from the Capital markets. Closer home, the World Bank noted that businesses in Kenya relied on banks for 99.0% of their funding while less than 1.0% come from the capital markets. Kenya’s capital market remains stunted, driven by overreliance on the banking sector for funding.
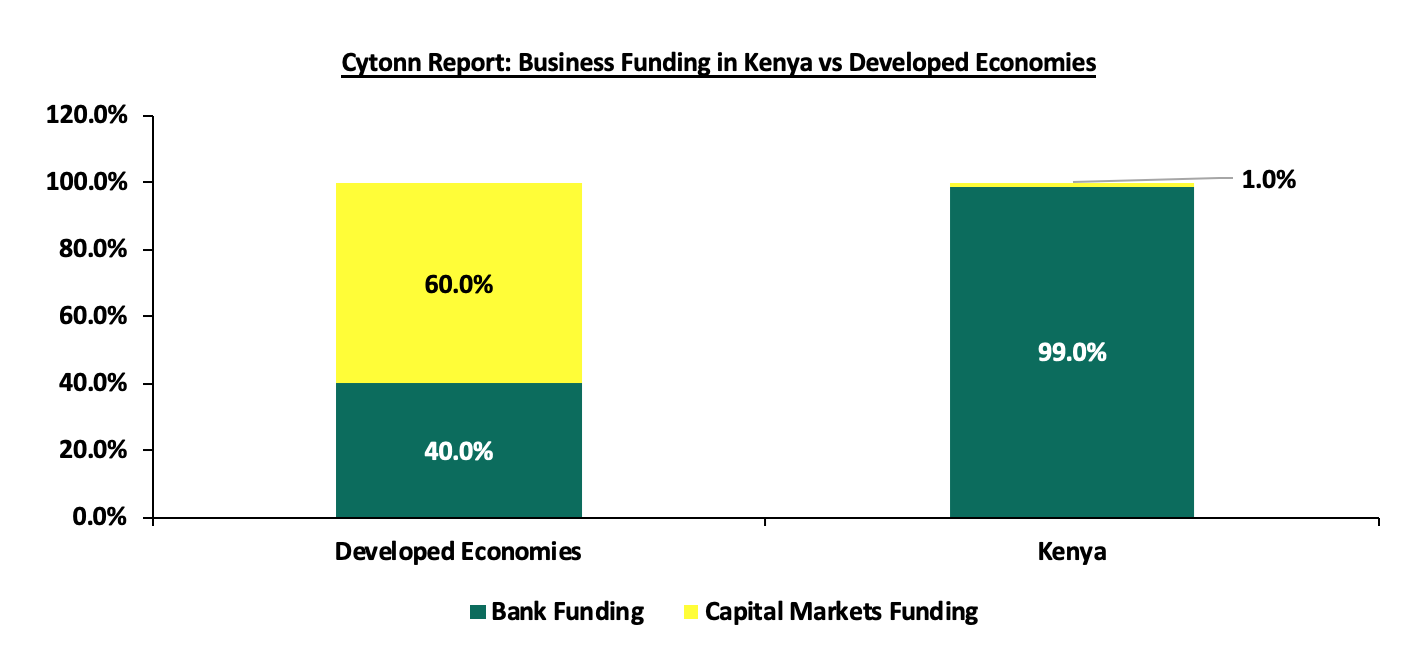
Source: World Bank
Notably, Kenya’s Mutual Funds/UTFs to GDP ratio at the end of Q1’2023 came in at 4.6% significantly lower compared to an average of 57.6% amongst select global markets an indication of a need to enhance our capital markets Additionally, Sub-Saharan African countries such as South Africa and Namibia have higher mutual funds to GDP ratios of 61.5% and 43.1%, respectively as at end of 2020, compared to Kenya. The chart below shows select countries’ mutual funds as a percentage of GDP:
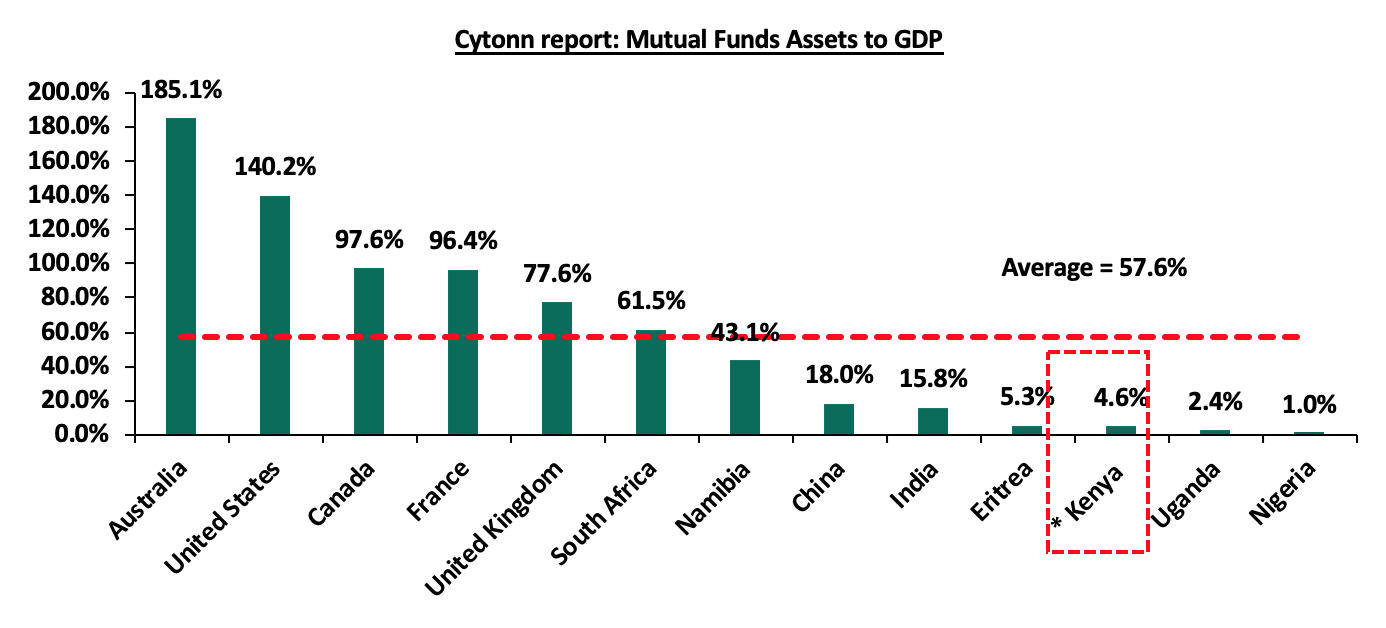
*
*Data as of March 2023
Source: World Bank Data
Over the past 5 years, Unit Trust Funds (UTFs) AUM has exhibited positive performance, with the Unit Trust Funds AUM having grown at a 5-year CAGR of 25.3% to Kshs 164.3 bn in Q1’2023, from Kshs 53.1 bn recorded in Q1’2018. However, the industry is still dwarfed when compared to other deposit taking institutions such as bank deposits, with the entire banking sector deposit coming in at Kshs 4.8 tn as at March 2023 and the pension industry at Kshs 1.6 tn as of December 2022. Below is a graph showing the sizes of different saving channels and capital market products in Kenya;
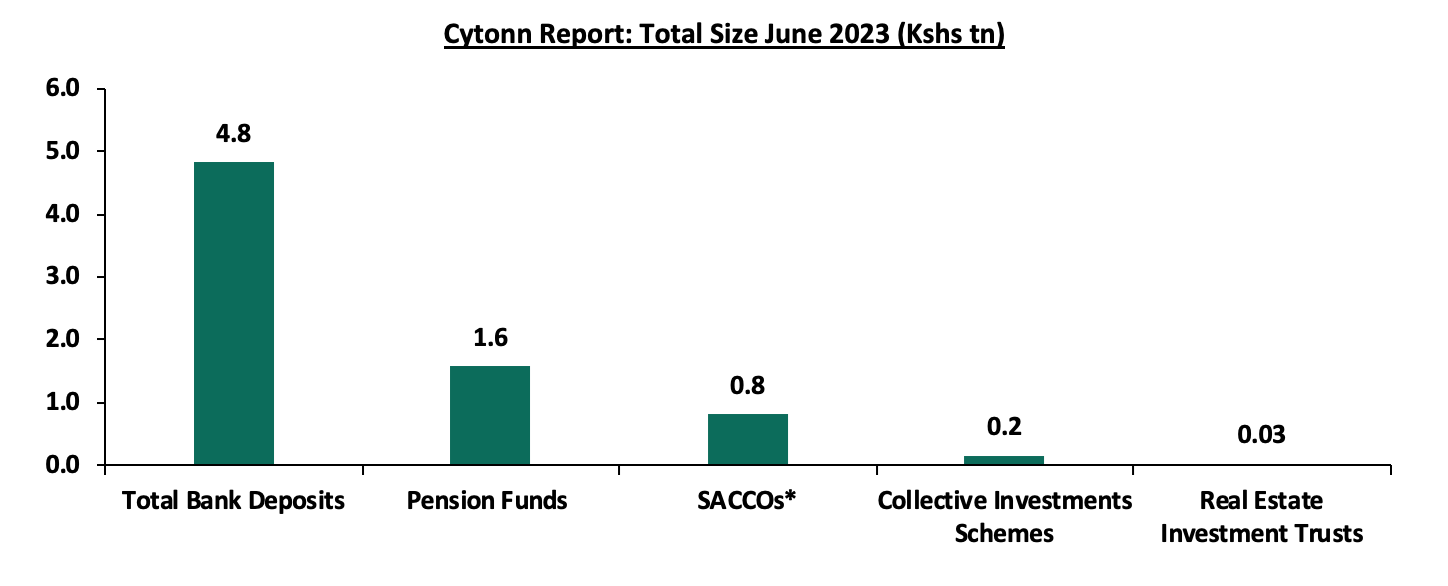
* Data as of December 2021
Total Bank Deposit as of 31st March 2023
Pension Funds as of 31st December 2023
Source: CMA, RBA, CBK, SASRA Annual Reports and REITs Financial Statements
Comparing other Capital Markets products like REITS, Kenya has made strides in the sector, however, there is still a lot of room for improvement. The REITs’ numbers remain low, with the only 4 registered REITS, out of which, only the ILAM Fahari I-REIT currently openly trading on the NSE main investment market. The table below show the authorized REITs in the country:
|
Cytonn Report: Authorized REITs in Kenya |
||||||
|
No |
Issuer |
Name |
Type of REIT |
Listing Date |
Market Segment |
Status |
|
1 |
ICEA Lion Asset Management (ILAM) |
Fahari |
I-REIT |
October 2015 |
Main Investment Segment |
Trading |
|
2 |
Acorn Holdings Limited |
Acorn Student Accommodation (ASA) – Acorn ASA |
I-REIT |
February 2021 |
Unquoted Securities Platform |
Trading |
|
3 |
Acorn Holdings Limited |
Acorn Student Accommodation (ASA) – Acorn ASA |
D-REIT |
February 2021 |
Unquoted Securities Platform |
Trading |
|
4 |
Local Authorities Pension Trust (LAP Trust) |
Imara |
I-REIT |
November 2022 |
Main Investment Segment – Restricted Sub segment |
Restricted |
The listed REITs capitalization as a percentage of total market cap in Kenya stands at 1.1%, as compared to 2.7% in the United States (US) and 1.3% in South Africa, as of 4 August 2023. The perfomance of the Kenya’s listed REIT is due to the decline in the total market capitalization that has adversely affected Nairobi Stock Exchange, with NASI registering 16.6% YTD decline, attributable foreign investors leaving the NSE Market, with NSE registering a net outflow position of USD 277.2 bn as at 4th August 2023. Below is a graph showing comparison of Kenya’s REITs to Market Cap Ratio to that of US and South Africa:
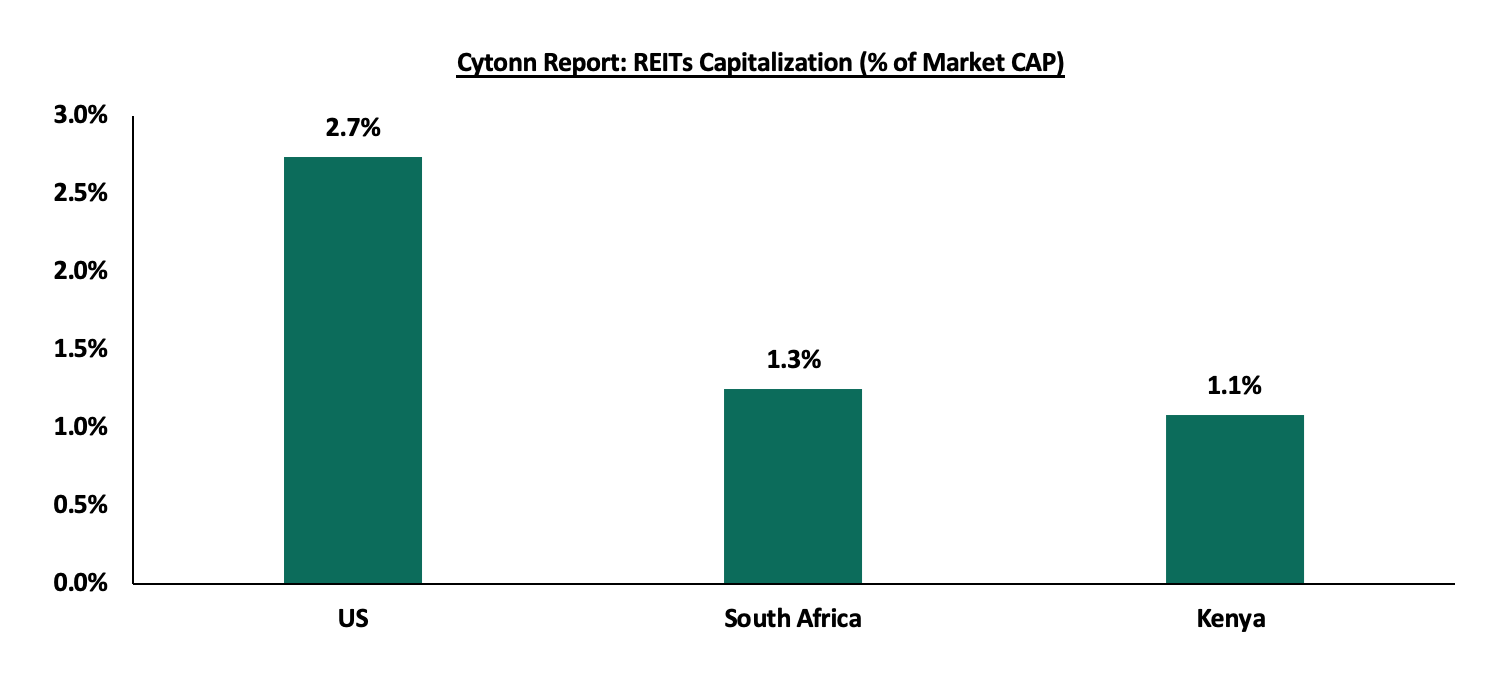
Source: European Public Real Estate Association (EPRA), Nairobi Securities Exchange (NSE)
Section V: Recommendations
In conclusion, as witnessed by the growing numbers of total registered Mobile Money Accounts there is need to leverage more on innovation and digitization in order to further propel the growth of unit trust products in Kenya. The use of technology as a distribution channel for unit trusts products opens up the funds to the retail segment, which is characterized by strong demand among retail clients for convenient and innovative products. In addition, we recommend the following actions to stimulate growth of UTFs in the Kenyan capital market;
- Lower the minimum investment amounts: Currently, the minimum investment for sector specific funds is Kshs 1.0 mn, while that for Development REITS is currently at Kshs 5.0 mn. According to the Kenya National Bureau of Statistics, 87.7% of employees are earning below Kshs 100,000.0 monthly. As such, the high minimum initial and top up investments amounts for investing in sector specific funds deter potential investors. Furthermore, these high amounts disadvantage the majority of retail investors by restricting their options for investments,
- Encourage innovation and diversification of UTFs’ investments: Majority of UTFs’ investments are either in fixed income or fixed deposits, highlighting high concentration risks. There is need to encourage fund managers to invest in different sectors of the economy as this will spur diversification of investments such as real estate and private offers. As at 31st March 2023, the total allocation to Government securities and Fixed deposit stood at 46.2% and 39.5% respectively, accounting for 85.7% of the total AUM for unit trust, thus bringing about concentration risk
- Update regulations: The current Collective Investments Schemes Regulations in Kenya were formulated in 2001 and have not been updated since, despite the dynamic nature of the capital markets worldwide. This has led to the regulations lagging behind. For instance, the regulations do not include provisions for private offers that have grown in importance over the years. The regulations also lack stipulated guidelines on special funds to cater for the sophisticated investors’ interest in regulated alternative investments products. While there are efforts to update the regulations, we note that they remain in progress and are yet to be completed,
- Allow for sector funds: Under the current capital markets regulations, UTFs are required to diversify. However, one has to seek special dispensation in the form of sector funds such as a financial services fund, a technology fund or a Real Estate Unit Trust Fund. Regulations allowing unit holders to invest in sector funds would go a long way in expanding the scope of unit holders interested in investing. For example, in Kenya, Real Estate continues to play an important role in the economy contributing 10.0% to the GDP as of March 2023 and remains a popular investment option due to the stable returns it delivers and low correlation with traditional investments. However, looking at the various types of Unit trust we have, investments in real estate are conspicuously missing.
- Incentives: Introduce incentives such as tax benefits or government subsidies for unit trust fund investments, to encourage more people to consider them as part of their investment portfolio, similar to pensions and Education plans. This will be of great importance in encouraging investors to invest in a long time horizon
- Better disclosure by UTFs: For an investor to make an informed decision they need to be provided with a detailed portfolio holding of the UTFs. Investors need to understand where they moneys are invested so as to be aware of the risk their investments are exposed to. The information should be available to the investors and also to prospective clients
- Eliminate conflicts of interest in the capital markets governance and allow non-financial institutions to also serve as Trustees: The capital markets regulations should foster a governance structure that is more responsive to both market participants and market growth. In particular, restricting Trustees of Unit Trust Schemes to Banks only limits options, especially given the direct competition between the banking industry and capital markets. Notably, the pension industry has 6 non-bank Trustees yet the capital market only has one non-bank Trustee. Opening up the corporate trustee will bring about a more competitive and predictable trustee environment and consequently bring about more innovation and better services by trustees and growth in capital markets
- Provide Support to Fund Managers: In our opinion, the regulator, CMA needs to include market stabilization tools as part of the regulations/Act that will help Fund Managers meet fund obligations especially during times of distress like when there are a lot of withdrawals from the funds. We commend and appreciate the regulator’s role in safeguarding investor interests. However, since Fund Managers also play a significant role in the capital markets, the regulator should also protect the reputation of different fund managers in the industry.
We believe that the UTF market is still underdeveloped, however, it has great opportunity and potential to gain in terms of number of investors and AUM. The Authority and the services providers should proactively and decisively address any challenges that may occur so as to improve on the investor confidence. This will come a long way in encouraging more people to invest through our UTFs and enable the UTFs to have a significant contribution to the economic growth of Kenya
Disclaimer: The views expressed in this publication are those of the writers where particulars are not warranted. This publication, which is in compliance with Section 2 of the Capital Markets Authority Act Cap 485A, is meant for general information only and is not a warranty, representation, advice or solicitation of any nature. Readers are advised in all circumstances to seek the advice of a registered investment advisor.

- Talk to us
- Kenya
- P.O Box 20695 - 00200, Nairobi, Kenya
- Cell +254709101200
- Tel +254709101200
- WhatsApp +254741676635
- United States
- +254709101200
- DOWNLOAD OUR APP
-


- Kenya
- 8th Floor, Pinetree Plaza, Kaburu Drive, Ngong Road, Nairobi, Kenya
- USA
- Suite 1150, 1775 Eye Street NW, USA, Washington DC 20006, USA
- Investments
- High Yield
- Private Equity
- Real Estate
- Real Estate
- RiverRun Estates
- Cytonn Towers
- The Ridge
- Taraji Heights
- The Alma