The Private Sector Credit Growth in Kenya, & Cytonn Weekly #13/2025
By Cytonn Research, Mar 30, 2025
Executive Summary
Fixed Income
During the week, T-bills were undersubscribed for the first time in seven weeks, with the overall subscription rate coming in at 61.4%, a reversal from the oversubscription rate of 129.0% recorded the previous week. Investors’ preference for the shorter 91-day paper waned, with the paper receiving bids worth Kshs 2.8 bn against the offered Kshs 4.0 bn, translating to an undersubscription rate of 69.8%, higher than the undersubscription rate of 43.2% recorded the previous week. The subscription rates for the 182-day paper decreased to 17.1% from the 84.0% recorded the previous week, while the 364-day paper decreased to 102.5% from the 208.2% recorded the previous week. The government accepted a total of Kshs 14.5 bn worth of bids out of Kshs 14.7 bn bids received, translating to an acceptance rate of 98.4%. The yields on the government papers were on a downward trajectory with the yields on the 364-day paper decreasing by 4.9 bps to 10.4%, from 10.5% recorded the previous week, while the yields on the 91-day and 182-day papers decreased by 4.9 bps and 2.8 bps to remain relatively unchanged from 8.8% and 9.1% respectively recorded the previous week;
Also, we are projecting the y/y inflation rate for March 2025 to increase marginally to within the range of 3.6% - 3.8% mainly on the back of the decrease in the Central Bank Rate (CBR) by 50.0 bps to 10.75% from 11.25%. The lower rates are expected to translate to lower borrowing costs and increasing consumer spending;
Equities
During the week, the equities market recorded mixed performance, with NASI and NSE 10 each gaining by 0.5%, while NSE 20 and NSE 25 lost by 0.8% and 0.1% respectively, taking the YTD performance to gains of 8.2%, 4.4%, 2.2% and 1.1% for NSE 20, NASI, NSE 25 and NSE 10, respectively. The equities market performance was driven by gains recorded by large-cap stocks such as Safaricom, Stanbic and Absa of 3.1%, 1.1%, and 1.1%, respectively. The performance was however weighed down by losses recorded by large cap stocks such as DTB-K, EABL and Standard Chartered of 5.0%, 2.8% and 1.6% respectively;
During the week, Equity Group released its FY’2024 financial results, Equity Group’s Profit After Tax (PAT) increased by 11.6% to Kshs 48.8 bn, from Kshs 43.7 bn in FY’2023. The performance was mainly driven by a 6.7% increase in Total Operating Income to kshs 193.8 bn, from kshs 181.7 bn in FY’2023, which outpaced the 2.5% increase in total operating expense to kshs 133.0 bn in FY’2024, from kshs 129.8 bn in FY’2023;
During the week, NCBA Group released its FY’2024 financial results, NCBA Group’s Profit After Tax (PAT) increased by 1.9% to Kshs 21.9 bn, from Kshs 21.5 bn in FY’2023. The performance was mainly driven by a 1.6% decrease in operating expenses to Kshs 37.6 bn, from Kshs 38.2 bn in FY 2023, which outpaced 1.5% decrease in total operating income to Kshs 62.7 bn, from Kshs 63.7 bn in FY’2023.The decrease in Operating expenses was largely driven by the 40.1% decrease in loan loss provisions expense to Kshs 5.5 bn, from 9.2 bn in FY’2023.
During the week, I&M Group released its FY’2024 financial results, I&M Group’s Profit After Tax (PAT) increased by 24.8% to Kshs 16.7 bn, from Kshs 13.3 bn in FY’2023. The performance was mainly driven by a 20.0% increase in Total Operating Income to Kshs 51.2 bn, from Kshs 42.7 bn in FY’2023, which outpaced the 15.2% increase in Total Operating expense to Kshs 31.3 bn in FY’2024, from Kshs 27.2 bn in FY’2023;
During the week, DTB-K released its FY’2024 financial results, DTB-K’s Profit After Tax (PAT) increased by 13.1% to Kshs 8.8 bn, from Kshs 7.8 bn in FY’2023. The performance was mainly driven by a 4.3% increase in Total Operating Income to Kshs 41.4 bn, from Kshs 39.7 bn in FY’2023, coupled with the 2.3% decrease in Total Operating expense to Kshs 30.2 bn in FY’2024, from Kshs 30.9 bn in FY’2023;
During the week HF Group released its FY’2024 financial results, HF Group’s Profit After Tax (PAT) increased by 35.2% to Kshs 0.5 bn, from Kshs 0.4 bn in FY’2023. The performance was mainly driven by a 9.9% increase in Total Operating Income to Kshs 4.2 bn, from Kshs 3.8 bn in FY’2023, which outpaced the 7.0% increase in Total Operating expense to Kshs 3.7 bn in FY’2024, from Kshs 3.5 bn in FY’2023;
During the week, CIC Group released their FY’2024 results. CIC’s Profit After Tax (PAT) increased by 98.0% to Kshs 2.9 bn from Kshs 1.4 bn, recorded in FY’2023. The performance was mainly driven by a 35.7% increase in Net investment income to Kshs 8.8 bn in FY’2024, from Kshs 2.9 bn in FY’2023, and further supported by a 14.0% decrease in Net expenses from reinsurance contracts to Kshs 1.8 bn, from Kshs 2.1 bn in FY’2023. However, the performance was weighed down by the 56.4% decrease in net income from insurance services to Kshs 0.3 bn, from Kshs 0.8 bn in FY’2024;
During the week, Britam Holdings released their FY’ 2024 results. Britam’s Profit After Tax (PAT) increased by 53.5% to Kshs 5.0 bn, from Kshs 3.3 bn recorded in FY’2023. The performance was mainly driven by a 163.4% increase in Net Investment income to Kshs 30.6 bn, from Kshs 11.6 bn in FY’2023 as well as a 35.5% increase in net insurance and investment result to Kshs 9.2 bn from 6.8 bn in FY 2023 but was weighed down by the 208.8% increase in Insurance Expenses to Kshs 26.4 bn in FY’2024, from Kshs 8.6 bn in FY’2023;
During the week, Liberty Kenya Holdings released their FY’ 2024 results, with Profit After Tax (PAT) increasing by 119.7% to Kshs 1.4 bn, from Kshs 0.6 bn recorded in FY’2023, mainly driven by a 99.8% increase in Net investment income to Kshs 2.0 bn, from Kshs 1.0 bn in FY’2023, and further supported by 5.6 % increase in Net insurance income to Kshs 1.00 bn, from Kshs 0.95 bn in FY’2023;
During the week, Kenya Airways Plc released their FY’2024 results, recording a significant 123.9% increase in Profit After Tax to Kshs 5.4 bn, from the Kshs 22.7 bn loss recorded in FY’2023. The performance was mainly driven by a 106.5% increase in forex gains on borrowings, attributable to the 17.4% appreciation of the Kenyan shilling in 2024, coupled with a 57.8% increase in operating profit to Kshs 16.6 bn, from the Kshs 10.5 bn recorded in FY’2023. The Kshs 5.4 bn profit after tax was the highest ever recorded in Kenya Airways’ history due to the recovery strategy under Project Kifaru;
During the week KCB Group Plc disclosed its plan of acquisition of a 75.0% controlling interest in Riverbank Solutions Limited, a fintech entity focused on payment systems, as part of its strategic initiative to bolster digital capabilities and reinforce its footprint in banking, agency solutions, and business services across Kenya, Uganda, and Rwanda. The integration of Riverbank’s capabilities is expected to facilitate the unification of KCB’s agent banking channels into a single platform, optimizing operational efficiency;
Real Estate
During the week, the Kenya National Bureau of Statistics (KNBS) released the Leading Economic Indicators (LEI) January 2025 Reports, which highlighted the performance of major economic indicators;
During the week, state-backed mortgage lender, Kenya Mortgage Refinance Company (KMRC) released its FY’2024 financial results, which reported a 55.9% increase in Profit After Tax (PAT) to Kshs 1.3 bn from Kshs 847.8 mn recorded in FY’2023 majorly attributable to 33.9% increase in interest income to Kshs 3.2 bn in FY’2024 from 2.4 bn in FY’2023;
Additionally, during the week, on the Real Estate Investments Trusts Sector, Acorn I-REIT, D-REIT, Laptrust I-REIT and ILAM Fahari I-REIT released their FY’2024 results that showed performance of these REITs;
On the Unquoted Securities Platform, Acorn D-REIT and I-REIT traded at Kshs 25.4 and Kshs 22.2 per unit, respectively, as per the last updated data on 21st March 2025. The performance represented a 27.0% and 11.0% gain for the D-REIT and I-REIT, respectively, from the Kshs 20.0 inception price. Additionally, ILAM Fahari I-REIT traded at Kshs 11.0 per share as of 21st March 2025, representing a 45.0% loss from the Kshs 20.0 inception price;
Focus of the Week
The private sector contributes significantly to Kenya's economic growth, with increased access to credit driving real GDP expansion. Credit availability is essential for businesses to expand, innovate, and stay competitive. Recent data from the Central Bank of Kenya (CBK) shows that credit to the private sector contracted by 1.4% as of December 2024, reflecting the impact of exchange rate valuation effects on foreign currency-denominated loans due to the Shilling's appreciation, along with decreased demand driven by high lending interest rates. As the government aims to reduce its fiscal deficit, fostering a supportive environment for private sector growth, especially for micro, small, and medium enterprises (MSMEs), will be crucial for increasing revenue collection. Achieving this requires policy reforms to strengthen the credit market and the introduction of sector-specific funds to drive business growth in key industries like finance, agriculture, manufacturing, and transport. Compared to developed economies, Kenya's private sector faces limited credit access, relying heavily on commercial banks with minimal availability of alternative financing options such as venture capital, equity financing, or government-backed credit programs. Banks continue to be the primary source of business credit, supplying a total Kshs 3.9 trillion extended to the private sector as of December 2024, 81.2% of the total extended to the sector (inclusive of microfinances and SACCOs), with the highest allocations directed towards trade (17.6%), manufacturing (15.0%), and private households (14.8%);
Investment Updates:
- Weekly Rates:
- Cytonn Money Market Fund closed the week at a yield of 15.09% p.a. To invest, dial *809# or download the Cytonn App from Google Play store here or from the Appstore here;
- We continue to offer Wealth Management Training every Tuesday, from 7:00 pm to 8:00 pm. The training aims to grow financial literacy among the general public. To register for any of our Wealth Management Trainings, click here;
- If interested in our Private Wealth Management Training for your employees or investment group, please get in touch with us through wmt@cytonn.com;
- Cytonn Insurance Agency acts as an intermediary for those looking to secure their assets and loved ones’ future through insurance namely; Motor, Medical, Life, Property, WIBA, Credit and Fire and Burglary insurance covers. For assistance, get in touch with us through insuranceagency@cytonn.com;
- Cytonn Asset Managers Limited (CAML) continues to offer pension products to meet the needs of both individual clients who want to save for their retirement during their working years and Institutional clients that want to contribute on behalf of their employees to help them build their retirement pot. To more about our pension schemes, kindly get in touch with us through pensions@cytonn.com;
Hospitality Updates:
- We currently have promotions for Staycations. Visit cysuites.com/offers for details or email us at sales@cysuites.com;
Money Markets, T-Bills Primary Auction:
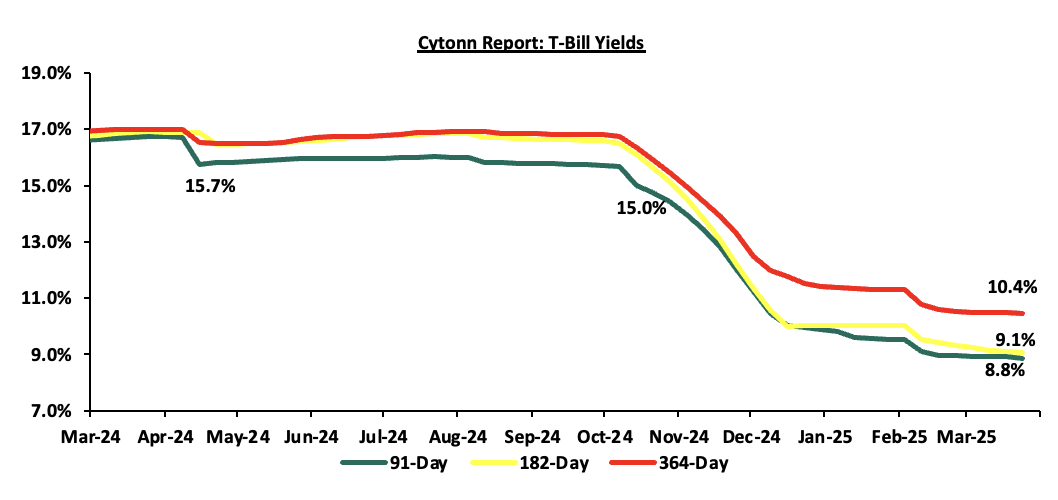
During the week, T-bills were undersubscribed for the first time in seven weeks, with the overall subscription rate coming in at 61.4%, a reversal from the oversubscription rate of 129.0% recorded the previous week. Investors’ preference for the shorter 91-day paper waned, with the paper receiving bids worth Kshs 2.8 bn against the offered Kshs 4.0 bn, translating to an undersubscription rate of 69.8%, higher than the undersubscription rate of 43.2% recorded the previous week. The subscription rates for the 182-day paper decreased to 17.1% from the 84.0% recorded the previous week, while the 364-day paper decreased to 102.5% from the 208.2% recorded the previous week. The government accepted a total of Kshs 14.5 bn worth of bids out of Kshs 14.7 bn bids received, translating to an acceptance rate of 98.4%. The yields on the government papers were on a downward trajectory with the yields on the 364-day paper decreasing by 4.9 bps to 10.4%, from 10.5% recorded the previous week, while the yields on the 91-day and 182-day papers decreased by 4.9 bps and 2.8 bps to remain relatively unchanged from 8.8% and 9.1% respectively recorded the previous week;
The charts below shows the yield performance of the 91-day, 182-day and 364-day papers from March 2024 to March 2025:
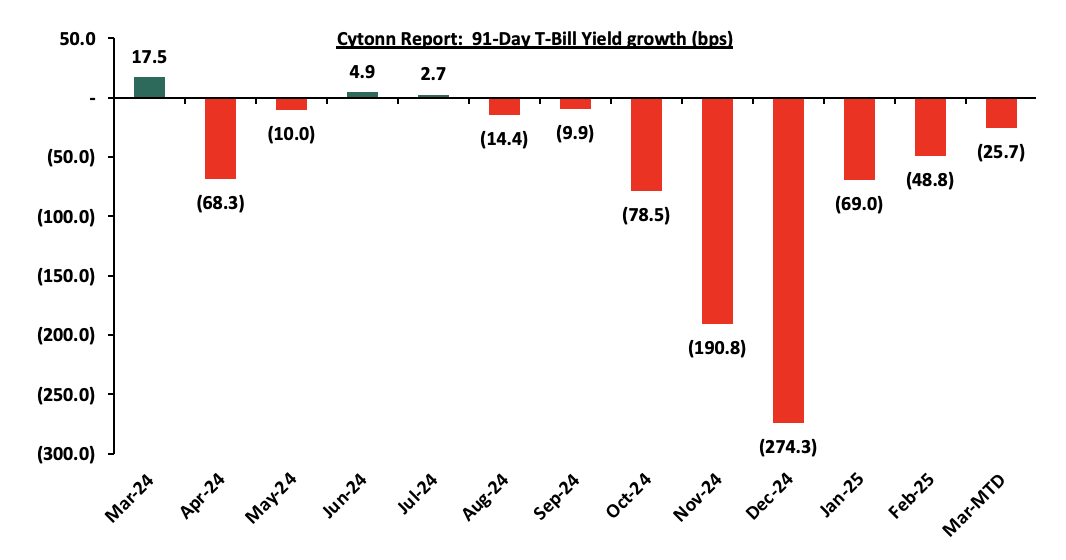
The chart below shows the yield growth for the 91-day T-bill:
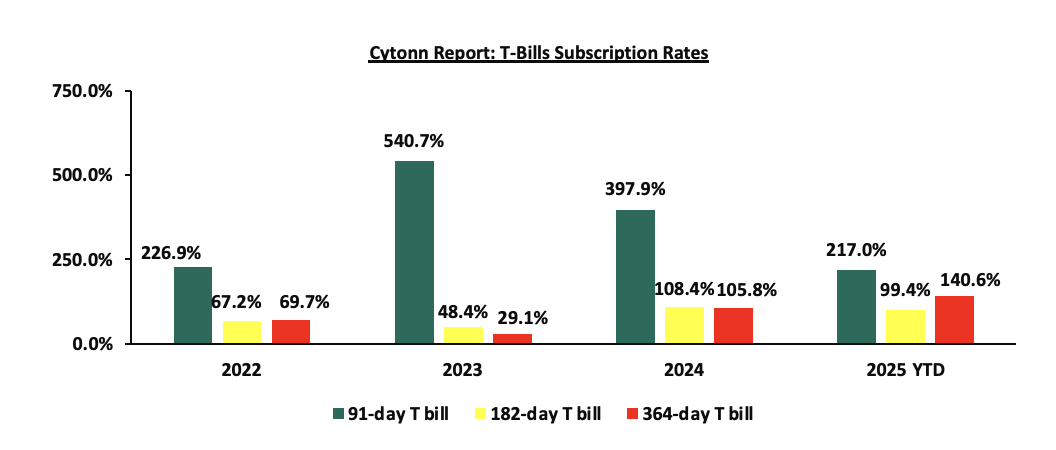
The chart below compares the overall average T-bill subscription rates obtained in 2022,2023, 2024 and 2025 Year-to-date (YTD):
Money Market Performance:
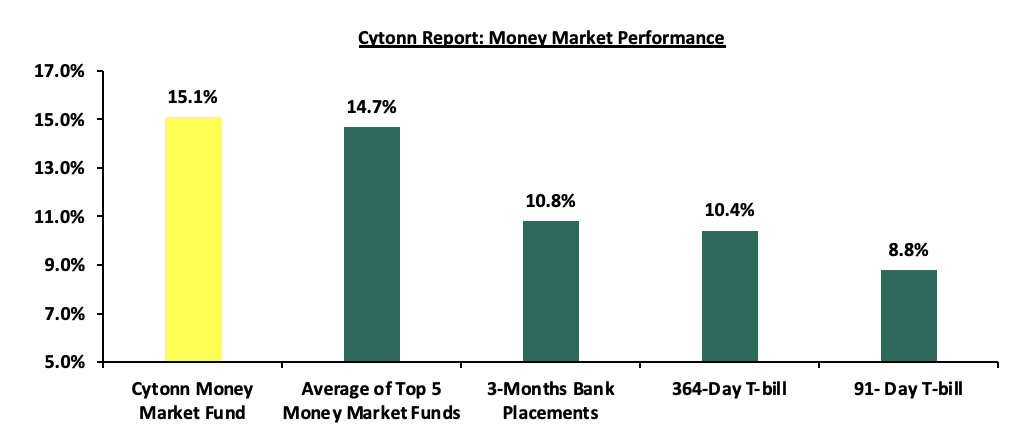
In the money markets, 3-month bank placements ended the week at 10.8% (based on what we have been offered by various banks), the yields on the government papers were on a downward trajectory with the yields on the 364-day paper decreasing by 4.9 bps to 10.4% from 10.5% recorded the previous week, while yields on the 91-day paper decreased by 4.9 bps to remain relatively unchanged from 8.8% recorded the previous week. The yield on the Cytonn Money Market Fund decreased by 49.0 bps to 15.1% from the 15.6% recorded the previous week, while the average yields on the Top 5 Money Market Funds decreased by 12.4 bps to close the week at 14.7%, from the 14.8% recorded the previous week.
The table below shows the Money Market Fund Yields for Kenyan Fund Managers as published on 28th March 2025:
|
Cytonn Report: Money Market Fund Yield for Fund Managers as published on 28th March 2025 |
||
|
Rank |
Fund Manager |
Effective Annual Rate |
|
1 |
Gulfcap Money Market Fund |
16.3% |
|
2 |
Cytonn Money Market Fund (Dial *809# or download the Cytonn app) |
15.1% |
|
3 |
Etica Money Market Fund |
14.1% |
|
4 |
Kuza Money Market fund |
14.0% |
|
5 |
Arvocap Money Market Fund |
14.0% |
|
6 |
Lofty-Corban Money Market Fund |
13.8% |
|
7 |
Orient Kasha Money Market Fund |
13.4% |
|
8 |
Ndovu Money Market Fund |
13.1% |
|
9 |
Enwealth Money Market Fund |
12.7% |
|
10 |
British-American Money Market Fund |
12.6% |
|
11 |
Old Mutual Money Market Fund |
12.4% |
|
12 |
Apollo Money Market Fund |
12.4% |
|
13 |
Madison Money Market Fund |
12.3% |
|
14 |
Nabo Africa Money Market Fund |
12.2% |
|
15 |
Dry Associates Money Market Fund |
12.1% |
|
16 |
Jubilee Money Market Fund |
12.1% |
|
17 |
Sanlam Money Market Fund |
11.9% |
|
18 |
Faulu Money Market Fund |
11.7% |
|
19 |
GenAfrica Money Market Fund |
11.6% |
|
20 |
Co-op Money Market Fund |
11.4% |
|
21 |
ICEA Lion Money Market Fund |
11.2% |
|
22 |
Absa Shilling Money Market Fund |
11.2% |
|
23 |
CIC Money Market Fund |
11.2% |
|
24 |
Genghis Money Market Fund |
11.0% |
|
25 |
KCB Money Market Fund |
10.9% |
|
26 |
Mali Money Market Fund |
10.8% |
|
27 |
AA Kenya Shillings Fund |
10.7% |
|
28 |
Mayfair Money Market Fund |
9.7% |
|
29 |
Stanbic Money Market Fund |
8.1% |
|
30 |
Ziidi Money Market Fund |
7.5% |
|
31 |
Equity Money Market Fund |
5.9% |
Source: Business Daily
Liquidity:
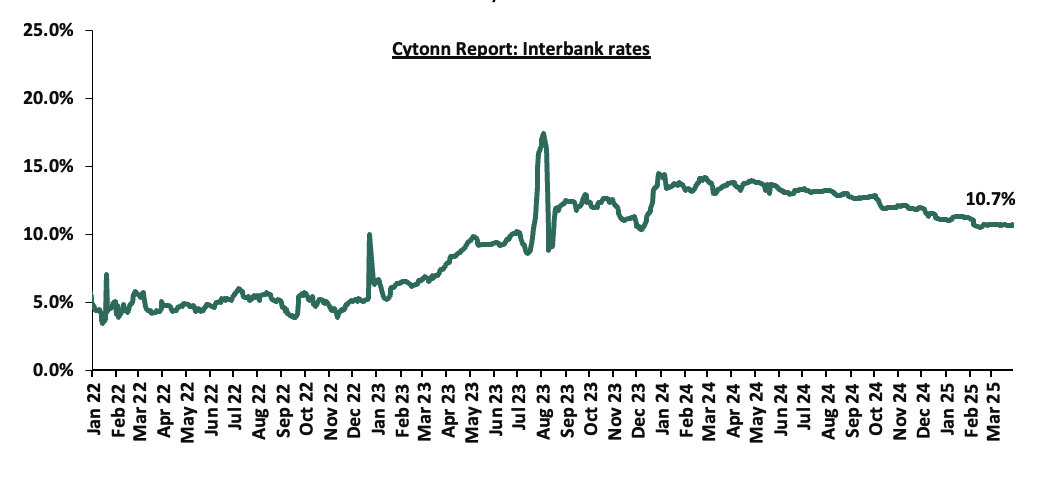
During the week, liquidity in the money markets marginally eased, with the average interbank rate decreasing by 2.7 bps, to remain unchanged from the 10.7% recorded the previous week, partly attributable to tax remittances that were offset by government payments. The average interbank volumes traded increased by 30.1% to Kshs 12.1 bn from Kshs 9.3 bn recorded the previous week. The chart below shows the interbank rates in the market over the years:
Kenya Eurobonds:
During the week, the yields on Kenya’s Eurobonds recorded a mixed performance, with the yield on the 7-year issued in 2024 increasing the most by 46.6 bps to 10.2% from the 9.7% recorded the previous week, while the 13-year Eurobond issued in 2021 decreased the most by 1.0 bps to remain unchanged from the 10.3% recorded the previous week. The table below shows the summary performance of the Kenyan Eurobonds as of 20th March 2025;
|
Cytonn Report: Kenya Eurobonds Performance |
|
||||||
|
|
2018 |
2019 |
2021 |
2024 |
2025 |
||
|
Tenor |
10-year issue |
30-year issue |
7-year issue |
12-year issue |
13-year issue |
7-year issue |
11-year issue |
|
Amount Issued (USD) |
1.0 bn |
1.0 bn |
0.3 bn |
1.2 bn |
1.0 bn |
1.5 bn |
1.5 bn |
|
Years to Maturity |
3.0 |
23.0 |
2.2 |
7.2 |
9.3 |
5.9 |
11.0 |
|
Yields at Issue |
7.3% |
8.3% |
7.0% |
7.9% |
6.2% |
10.4% |
9.9% |
|
02-Jan-25 |
9.1% |
10.3% |
8.5% |
10.1% |
10.1% |
10.1% |
|
|
03-Mar-25 |
8.0% |
10.0% |
7.3% |
9.5% |
9.6% |
9.4% |
|
|
20-Mar-25 |
8.5% |
10.3% |
7.2% |
9.8% |
10.3% |
9.7% |
|
|
21-Mar-25 |
8.7% |
10.5% |
7.2% |
10.1% |
10.1% |
10.0% |
|
|
02-Mar-25 |
8.6% |
10.4% |
7.2% |
10.0% |
10.1% |
10.0% |
|
|
25-Mar-25 |
8.6% |
10.4% |
7.1% |
9.9% |
10.0% |
10.0% |
|
|
26-Mar-25 |
8.7% |
10.6% |
7.2% |
10.1% |
10.2% |
10.0% |
|
|
27-Mar-25 |
8.7% |
10.6% |
7.5% |
10.2% |
10.3% |
10.2% |
|
|
Weekly Change |
0.2% |
0.4% |
0.2% |
0.4% |
(0.0%) |
0.5% |
- |
|
MTD Change |
0.7% |
0.6% |
0.1% |
0.7% |
0.6% |
0.8% |
- |
|
YTD Change |
(0.3%) |
0.4% |
(1.0%) |
0.1% |
0.2% |
0.1% |
- |
Source: Central Bank of Kenya (CBK) and National Treasury
Kenya Shilling:
During the week, the Kenyan Shilling appreciated marginally against the US Dollar by 6.0 bps, to Kshs 129.3 from the Kshs 129.4 recorded the previous week. On a year-to-date basis, the shilling has depreciated by 0.8 bps against the dollar, compared to the 17.4% appreciation recorded in 2024.
We expect the shilling to be supported by:
- Diaspora remittances standing at a cumulative USD 4,956.5 mn in the twelve months to February 2025, 14.5% higher than the USD 4,329.7 mn recorded over the same period in 2024. These has continued to cushion the shilling against further depreciation. In the February 2025 diaspora remittances figures, North America remained the largest source of remittances to Kenya accounting for 53.0% in the period,
- The tourism inflow receipts which came in at Kshs 452.2 bn in 2024, a 19.8% increase from Kshs 377.5 bn inflow receipts recorded in 2023, and owing to tourist arrivals that improved by 14.6% to 2,394,376 in 2024 from 2,089,259 in 2023, and,
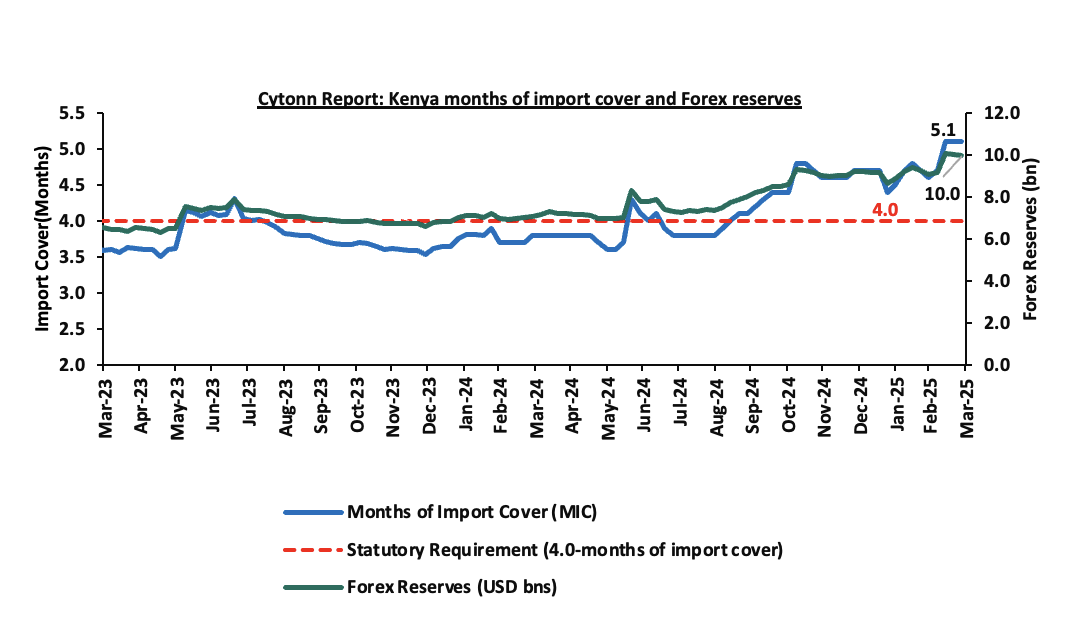
- Improved forex reserves currently at USD 10.0 bn (equivalent to 5.1-months of import cover), which is above the statutory requirement of maintaining at least 4.0-months of import cover and above the EAC region’s convergence criteria of 4.5-months of import cover.
The shilling is however expected to remain under pressure in 2025 as a result of:
- An ever-present current account deficit which came at 4.0% of GDP in Q3’2024, and,
- The need for government debt servicing, continues to put pressure on forex reserves given that 62.1% of Kenya’s external debt is US Dollar-denominated as of September 2024.
Key to note, Kenya’s forex reserves decreased by 0.5% during the week, to remain relatively unchanged from the USD 10.0 bn recorded in the previous week, equivalent to 5.1 months of import cover to remain relatively unchanged from the months of import cover recorded last week, and above the statutory requirement of maintaining at least 4.0-months of import cover.
The chart below summarizes the evolution of Kenya's months of import cover over the years:
Weekly Highlights
- March Inflation projection
We are projecting the y/y inflation rate for March 2025 to increase marginally to within the range of 3.6% - 3.8% mainly on the back of:
- The decrease in the Central Bank Rate (CBR) by 50.0 bps to 10.75% from 11.25% – In 2025, the CBK Monetary Policy Committee continued reducing the Central Bank Rate (CBR) with a 50.0 bps cut in February, lowering it to 10.75% in February 2025 from 11.25% in December 2024. In their previous meeting on 5th December 2024, they implemented a more significant reduction, cutting the CBR by 75.0 bps to 11.00%. This reduction in the CBR is likely to increase the money supply through lower borrowing costs, which may cause a slight rise in inflation rates as the effects of the CBR gradually take hold in the broader economy.
- Depreciation of the Kenya Shilling against the US Dollar – The Kenya Shilling has remained relatively stable recording a slight depreciation of 12.7 bps on a month-to-date. If the shilling continues on that trend, there could be an increase in inflationary pressures.
- Increased electricity prices – In March 2025, electricity prices increased marginally on the back of a rise in fuel cost charges and forex adjustment charges. EPRA set the fuel cost charge at Kshs 3.5, up from Kshs 3.4 in February 2025, while the forex adjustment was raised to Kshs 0.8 from Kshs 0.7 in February 2025. With electricity being one the major inputs of inflation, this increase is expected to increase production costs for businesses as well as increase electricity costs for households and thus tightening inflation.
We, however, expect that inflation rate will, however, be supported by:
- Stable Fuel Prices in January– In their last fuel prices release, EPRA announced that the maximum allowed price for Super Petrol, Diesel and Kerosene remained unchanged at Kshs 176.6, Kshs 167.1, and Kshs 151.4 per litre respectively effective from 15th March 2025 to 14th April 2024. This stability in fuel prices is likely to decrease pressure on consumers’ purchasing power as well as business operational costs, since fuel is a major input cost for businesses, and,
Going forward, we expect inflationary pressures to remain anchored in the short term, remaining within the CBK’s target range of 2.5%-7.5% aided by the stable fuel prices, decreased energy costs and stability in the exchange rate. However, risks remain, particularly from the potential for increased demand-driven inflation due to accommodative monetary policy. The decision to lower the CBR to 10.75% during the latest MPC meeting will likely increase money supply, in turn increasing inflation, especially with further cuts expected in the coming meetings. The CBK’s ability to balance growth and inflation through close monitoring of both inflation and exchange rate stability will be key to maintaining inflation within the target range.
Rates in the Fixed Income market have been on a downward trend due to high liquidity in the money market which allowed the government to front load most of its borrowing. The government is 66.3% ahead of its prorated net domestic borrowing target of Kshs 445.3 bn, and 24.7% ahead of the total FY’2024/25 net domestic borrowing target of Kshs 593.7 bn, having a net borrowing position of Kshs 740.6 bn (inclusive of T-bills). However, we expect a continued downward readjustment of the yield curve in the short and medium term, with the government looking to increase its external borrowing to maintain the fiscal surplus, hence alleviating pressure in the domestic market. As such, we expect the yield curve to stabilize in the short to medium-term and hence investors are expected to shift towards the long-term papers to lock in the high returns
Market Performance
During the week, the equities market recorded a mixed performance, with NASI and NSE 10 each gaining by 0.5%, while NSE 20 and NSE 25 lost by 0.8% and 0.1% respectively, taking the YTD performance to gains of 8.2%, 4.4%, 2.2% and 1.1% for NSE 20, NASI, NSE 25 and NSE 10, respectively. The equities market performance was driven by gains recorded by large-cap stocks such as Safaricom, Stanbic and Absa of 3.1%, 1.1%, and 1.1%, respectively. The performance was however weighed down by losses recorded by large cap stocks such as DTB-K, EABL and Standard Chartered of 5.0%, 2.8% and 1.6% respectively;
During the week, equities turnover decreased by 41.9% to USD 10.3 mn, from USD 17.7 mn recorded the previous week, taking the YTD total turnover to USD 202.7 mn. Foreign investors remained net sellers for the fifth consecutive week, with a net selling position of USD 0.7 mn, from a net selling position of USD 1.2 mn recorded the previous week, taking the YTD foreign net selling position to USD 25.2 mn, compared to a net selling position of USD 16.9 mn in 2024,
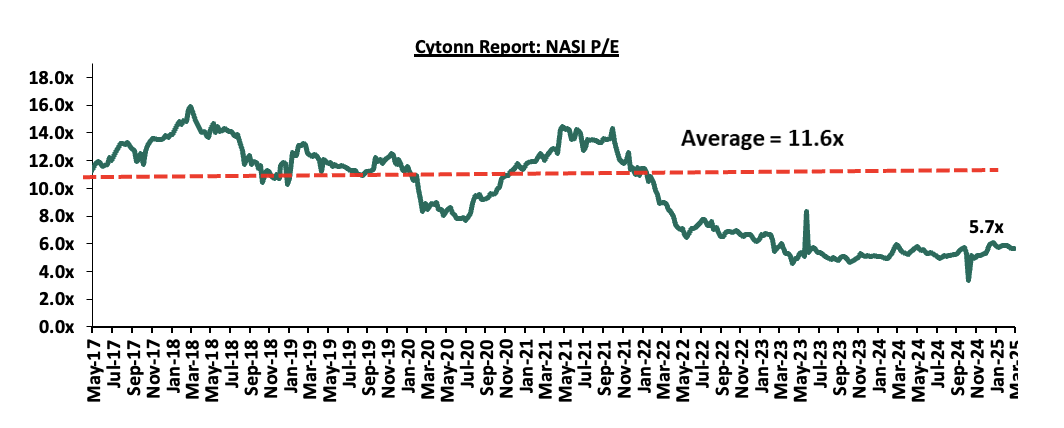
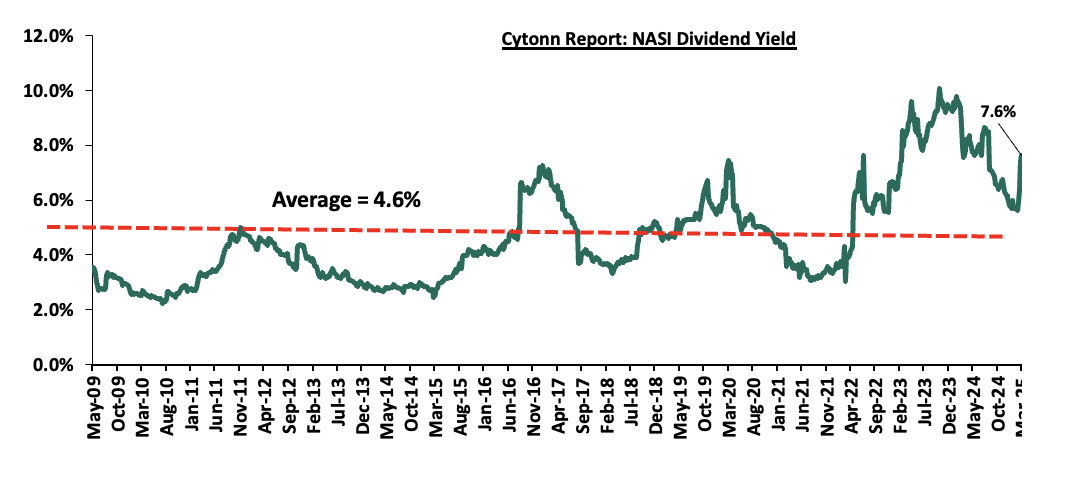
The market is currently trading at a price-to-earnings ratio (P/E) of 5.7x, 50.9% below the historical average of 11.6x. The dividend yield stands at 7.6%, 3.0% points above the historical average of 4.6%. Key to note, NASI’s PEG ratio currently stands at 0.7x, an indication that the market is undervalued relative to its future growth. A PEG ratio greater than 1.0x indicates the market is overvalued while a PEG ratio less than 1.0x indicates that the market is undervalued. The charts below indicate the historical P/E and dividend yields of the market;
Universe of Coverage:
|
Cytonn Report: Equities Universe of Coverage |
||||||||||
|
Company |
Price as at 21/03/2025 |
Price as at 28/03/2025 |
w/w change |
YTD Change |
Year Open 2025 |
Target Price* |
Dividend Yield |
Upside/ Downside** |
P/TBv Multiple |
Recommendation |
|
Jubilee Holdings |
216.3 |
192.3 |
(11.1%) |
10.0% |
174.8 |
260.7 |
7.4% |
43.0% |
0.3x |
Buy |
|
Equity Group |
46.7 |
47.1 |
1.0% |
(1.9%) |
48.0 |
60.2 |
9.0% |
36.8% |
0.9x |
Buy |
|
ABSA Bank |
18.8 |
19.0 |
1.1% |
0.8% |
18.9 |
24.2 |
9.2% |
36.6% |
1.3x |
Buy |
|
Co-op Bank |
16.0 |
16.0 |
0.3% |
(8.3%) |
17.5 |
20.3 |
9.4% |
36.1% |
0.7x |
Buy |
|
KCB Group |
42.0 |
42.2 |
0.4% |
(0.6%) |
42.4 |
50.4 |
7.1% |
26.7% |
0.5x |
Buy |
|
Standard Chartered Bank |
304.0 |
299.3 |
(1.6%) |
4.9% |
285.3 |
328.6 |
15.0% |
24.8% |
1.8x |
Buy |
|
Diamond Trust Bank |
79.8 |
75.8 |
(5.0%) |
13.5% |
66.8 |
84.4 |
9.2% |
20.6% |
0.3x |
Buy |
|
NCBA |
52.3 |
52.5 |
0.5% |
2.9% |
51.0 |
57.4 |
10.5% |
19.8% |
0.9x |
Accumulate |
|
Stanbic Holdings |
160.0 |
161.8 |
1.1% |
15.7% |
139.8 |
171.2 |
12.8% |
18.7% |
0.9x |
Accumulate |
|
CIC Group |
2.9 |
2.8 |
(0.4%) |
32.7% |
2.1 |
3.1 |
4.6% |
13.7% |
0.9x |
Accumulate |
|
I&M Group |
35.0 |
32.4 |
(7.4%) |
(10.1%) |
36.0 |
31.4 |
9.3% |
6.3% |
0.6x |
Hold |
|
Britam |
7.7 |
8.0 |
4.2% |
37.1% |
5.8 |
7.5 |
0.0% |
(6.0%) |
1.2x |
Sell |
|
*Target Price as per Cytonn Analyst estimates **Upside/ (Downside) is adjusted for Dividend Yield ***Dividend Yield is calculated using FY’2024 Dividends, Jubilee using FY’2023 |
||||||||||
Weekly Highlights
- Equity FY’2024 results
During the week Equity Group released its FY’2024 financial results. Below is a summary of Equity Group’s FY’2024 performance:
|
Balance Sheet Items |
FY'2023 |
FY'2024f |
y/y change |
|
Government Securities |
246.7 |
300.9 |
22.0% |
|
Net Loans and Advances |
887.4 |
819.2 |
(7.7%) |
|
Total Assets |
1821.4 |
1804.6 |
(0.9%) |
|
Customer Deposits |
1358.2 |
1399.6 |
3.1% |
|
Deposits/Branch |
3.8 |
3.5 |
(13.0%) |
|
Total Liabilities |
1603.3 |
1557.8 |
(2.8%) |
|
Shareholders’ Funds |
207.8 |
234.0 |
12.6% |
|
Balance Sheet Ratios |
FY'2023 |
FY'2024f |
% y/y change |
|
Loan to Deposit Ratio |
65.3% |
58.5% |
(6.8%) |
|
Government Securities to Deposit Ratio |
27.8% |
36.7% |
8.9% |
|
Return on average equity |
22.8% |
22.1% |
(0.7%) |
|
Return on average assets |
2.7% |
2.7% |
0.0% |
|
Income Statement (Kshs Bn) |
FY'2023 |
FY'2024f |
y/y change |
|
Net Interest Income |
104.8 |
108.7 |
3.7% |
|
Net non-Interest Income |
76.9 |
85.1 |
10.7% |
|
Total Operating income |
181.7 |
193.8 |
6.7% |
|
Loan Loss provision |
(35.6) |
(20.2) |
(43.3%) |
|
Total Operating expenses |
(129.8) |
(133.0) |
2.5% |
|
Profit before tax |
51.9 |
60.7 |
17.1% |
|
Profit after tax |
43.7 |
48.8 |
11.6% |
|
Core EPS |
11.1 |
12.3 |
11.0% |
|
Dividend Per Share |
4.0 |
4.55 |
6.3% |
|
Dividend Payout Ratio |
36.0% |
34.5% |
(1.5%) |
|
Dividend Yield |
8.5% |
9.0% |
1.0% |
|
Income Statement Ratios |
FY'2023 |
FY'2024f |
y/y change |
|
Yield from interest-earning assets |
11.0% |
10.9% |
(0.2%) |
|
Cost of funding |
3.8% |
4.1% |
0.4% |
|
Cost of risk |
19.6% |
10.4% |
(9.2%) |
|
Net Interest Margin |
7.4% |
5.8% |
(1.7%) |
|
Net Interest Income as % of operating income |
57.7% |
56.1% |
(1.6%) |
|
Non-Funded Income as a % of operating income |
42.3% |
43.9% |
1.6% |
|
Cost to Income Ratio |
71.4% |
68.7% |
(2.8%) |
|
CIR without LLP |
51.9% |
58.2% |
6.4% |
|
Cost to Assets |
5.8% |
6.2% |
0.5% |
|
Capital Adequacy Ratios |
FY'2023 |
FY'2024f |
% points change |
|
Core Capital/Total Liabilities |
16.2% |
18.0% |
1.8% |
|
Minimum Statutory ratio |
8.0% |
8.0% |
0.0% |
|
Excess |
8.2% |
10.0% |
1.8% |
|
Core Capital/Total Risk Weighted Assets |
14.3% |
17.3% |
3.0% |
|
Minimum Statutory ratio |
10.5% |
10.5% |
0.0% |
|
Excess |
3.8% |
6.8% |
3.0% |
|
Total Capital/Total Risk Weighted Assets |
18.1% |
19.0% |
0.9% |
|
Minimum Statutory ratio |
14.5% |
14.5% |
0.0% |
|
Excess |
3.6% |
4.5% |
0.9% |
|
Liquidity Ratio |
53.4% |
57.4% |
4.0% |
|
Minimum Statutory ratio |
20.0% |
20.0% |
0.0% |
|
Excess |
33.4% |
37.4% |
4.0% |
Key Take-Outs:
- Increased earnings - Core earnings per share grew by 11.0% to Kshs 12.3, from Kshs 11.1 in FY’2023, driven by the 6.7% increase in total operating income to Kshs 193.8 bn, from Kshs 181.7 bn in FY’2023, which outpaced the 2.5% increase in total operating expenses to Kshs 133.0 bn from Kshs 129.8 bn in FY’2023,
- Deteriorated asset quality – The bank’s Asset Quality deteriorated, with Gross NPL ratio increasing to 13.6% in FY’2024, from 12.1% in FY’2023, attributable to a 6.5% increase in Gross non-performing loans to Kshs 122.0 bn, from Kshs 114.6 bn in FY’2023, relative to the 5.3% decrease in gross loans to Kshs 896.9 bn, from Kshs 947.5 bn recorded in FY’2023,
- Contracted Balanced sheet - The balance sheet recorded a contraction as total assets declined by 9% to Kshs 1,804.6 bn, from Kshs 1,821.4 bn in FY’2023, mainly driven by a 7.7% decrease in net loans and advances to Kshs 819.2 bn, from 887.4 bn in FY’2023, but was supported by a 22.0% increase in government securities holdings to Kshs 300.9 bn, from Kshs 246.7 bn in FY’2023,
- Declaration of dividends - The Board of Directors declared a dividend of Kshs 4.25 per share in FY’2024, from a total dividend of 4.0 in FY’2023. The payout ratio and dividend yield came in at 34.5% and 9.2% respectively in FY’2024, and,
- Reduced lending- Customer net loans and advances decreased by 7.7% to Kshs 819.2 bn in FY’2024, from Kshs 887.4 bn in FY’2023 attributed to increased credit risk with high NPLs in the industry, with the lender preferring to limit customer lending.
For a more detailed analysis, please see the Equity Group’s FY’2024 Earnings Note
- NCBA FY’2024 results
During the week NCBA Group released its FY’2024 financial results. Below is a summary of NCBA Group’s FY’2024 performance:
|
Balance Sheet Items |
FY’2023 |
FY’2024 |
y/y change |
|
Net Loans and Advances |
337.0 |
302.1 |
(10.4%) |
|
Government Securities |
203.4 |
180.8 |
(11.1%) |
|
Total Assets |
734.6 |
665.9 |
(9.35%) |
|
Customer Deposits |
579.4 |
502.0 |
(13.4%) |
|
Deposit per Branch |
5.3 |
4.3 |
(20.0%) |
|
Total Liabilities |
638.0 |
556.2 |
(12.8%) |
|
Shareholder's Funds |
96.7 |
109.7 |
13.5% |
|
Balance Sheet Ratios |
FY’2023 |
FY’2024 |
% points change |
|
Loan to Deposit Ratio |
58.2% |
60.2% |
2.0% |
|
Govt Securities to Deposit ratio |
35.1% |
36.0% |
0.9% |
|
Return on average equity |
24.0% |
21.2% |
(2.8%) |
|
Return on average assets |
3.2% |
3.1% |
(0.0%) |
|
Income Statement |
FY’2023 |
FY’2024 |
y/y change |
|
Net Interest Income |
34.6 |
34.5 |
(0.3%) |
|
Net non-Interest Income |
29.1 |
28.2 |
(3.1%) |
|
Total Operating income |
63.7 |
62.7 |
(1.5%) |
|
Loan Loss provision |
9.2 |
5.5 |
(40.1%) |
|
Total Operating expenses |
38.2 |
37.6 |
(1.6%) |
|
Profit before tax |
25.5 |
25.1 |
(1.3%) |
|
Profit after tax |
21.5 |
21.9 |
1.9% |
|
Core EPS |
13.0 |
13.3 |
1.9% |
|
Dividend Per Share |
4.75 |
5.50 |
15.8% |
|
Dividend payout ratio |
36.5% |
41.4% |
5.0% |
|
Dividend Yield |
10.8% |
10.5% |
(0.4%) |
|
Income Statement Ratios |
FY’2023 |
FY’2024 |
% points change |
|
Yield from interest-earning assets |
11.1% |
12.5% |
1.4% |
|
Cost of funding |
5.5% |
7.4% |
1.8% |
|
Net Interest Spread |
5.5% |
5.1% |
(0.5%) |
|
Net Interest Margin |
5.9% |
5.7% |
(0.2%) |
|
Cost of Risk |
14.4% |
8.7% |
(5.6%) |
|
Net Interest Income as % of operating income |
54.3% |
55.0% |
0.7% |
|
Non-Funded Income as a % of operating income |
45.7% |
45.0% |
(0.7%) |
|
Cost to Income Ratio |
60.0% |
60.0% |
(0.0%) |
|
Cost to Income Ratio without LLP |
45.7% |
51.3% |
5.6% |
|
Capital Adequacy Ratios |
FY’2023 |
FY’2024 |
% points change |
|
Core Capital/Total Liabilities |
16.3% |
20.3% |
4.0% |
|
Minimum Statutory ratio |
8.0% |
8.0% |
|
|
Excess |
8.3% |
12.3% |
4.0% |
|
Core Capital/Total Risk Weighted Assets |
18.0% |
21.2% |
3.2% |
|
Minimum Statutory ratio |
10.5% |
10.5% |
|
|
Excess |
7.5% |
10.7% |
3.2% |
|
Total Capital/Total Risk Weighted Assets |
18.0% |
21.2% |
3.2% |
|
Minimum Statutory ratio |
14.5% |
14.5% |
|
|
Excess |
3.5% |
6.7% |
3.2% |
|
Liquidity Ratio |
52.9% |
53.7% |
0.7% |
|
Minimum Statutory ratio |
20.0% |
20.0% |
|
|
Excess |
32.9% |
33.7% |
0.7% |
Key Take-Outs:
- Increased earnings – Core earnings per share increased by 1.9% to Kshs 13.3, from Kshs 13.0 in FY’2023, mainly driven by the 1.6% decrease in total operating expenses to Kshs 37.6 bn, from Kshs 38.2 bn in FY’2023, which outpaced the 1.5% decrease in total operating income to Kshs 62.7 bn, from Kshs 63.7 bn in FY’2023,
- Improved asset quality – The bank’s Asset Quality improved, with Gross NPL ratio decreasing to 11.5% in FY’2024, from 12.3% in FY’2023, attributable to the 16.6% decrease in gross non-performing loans to Kshs 37.2 bn, from Kshs 44.6 bn in FY’2023, which outpaced the 10.4% decrease in gross loans to Kshs 324.1 bn, from Kshs 361.6 bn recorded in FY’2023,
- Decreased Lending – The bank’s loan book recorded a contraction of 10.4% to Kshs 302.1 bn from Kshs 337.0 bn in FY’2023 attributed to increased credit risk with NPLs rising to 16.4% in December 2024, from 14.8% in December 2023.
- Declaration of dividends - The Board of Directors recommended a final dividend of Kshs 3.25, in addition to an interim dividend of 25 paid during the year, bringing the total dividend to Kshs 5.50 per share compared to Kshs 4.75 per share FY’2023. This translates to a dividend payout ratio of 41.4% and a dividend yield of 10.5% as of 28th March 2025, compared to a dividend payout ratio of 36.5% and a dividend yield of 10.8% in a similar period for FY’2023.
For a more detailed analysis, please see the NCBA Group’s FY’2024 Earnings Note
- I&M FY’2024 results
During the week, I&M Group released their FY’2024 financial results. Below is a summary of the performance
|
Balance Sheet Items |
FY'2023 |
FY'2024 |
y/y change |
|
Government Securities |
78.1 |
102.3 |
31.0% |
|
Net Loans and Advances |
311.3 |
287.1 |
(7.8%) |
|
Total Assets |
579.7 |
581.3 |
0.3% |
|
Customer Deposits |
416.7 |
412.2 |
(1.1%) |
|
Deposits/Branch |
5.0 |
4.2 |
(15.4%) |
|
Total Liabilities |
484.0 |
479.6 |
(0.9%) |
|
Shareholders’ Funds |
88.2 |
94.5 |
7.1% |
|
Balance Sheet Ratios |
FY'2023 |
FY'2024f |
% y/y change |
|
Loan to Deposit Ratio |
74.7% |
69.6% |
(5.1%) |
|
Government Securities to Deposit Ratio |
18.7% |
24.8% |
6.1% |
|
Return on average equity |
15.9% |
14.9% |
(1.0%) |
|
Return on average assets |
2.6% |
2.4% |
(0.2%) |
|
Income Statement (Kshs Bn) |
FY'2023 |
FY'2024f |
y/y change |
|
Net Interest Income |
28.6 |
37.6 |
31.2% |
|
Net non-Interest Income |
14.1 |
13.7 |
(2.8%) |
|
Total Operating income |
42.7 |
51.2 |
20.0% |
|
Loan Loss provision |
(6.9) |
(7.8) |
13.8% |
|
Total Operating expenses |
(27.2) |
(31.3) |
15.2% |
|
Profit before tax |
16.7 |
20.8 |
24.6% |
|
Profit after tax |
13.3 |
16.7 |
24.8% |
|
Core EPS |
7.6 |
9.3 |
21.9% |
|
Dividend Per Share |
2.55 |
3.0 |
17.6% |
|
Dividend Payout Ratio |
31.6% |
29.8% |
(1.8%) |
|
Dividend Yield |
11.6% |
9.3% |
(2.3%) |
|
Income Statement Ratios |
FY'2023 |
FY'2024f |
% points change |
|
Yield from interest-earning assets |
13.0% |
15.4% |
2.4% |
|
Cost of funding |
5.4% |
6.7% |
1.3% |
|
Net Interest Margin |
7.4% |
8.5% |
1.1% |
|
Net Interest Income as % of operating income |
67.1% |
73.3% |
6.3% |
|
Non-Funded Income as a % of operating income |
32.9% |
26.7% |
(6.3%) |
|
Cost to Income Ratio |
63.7% |
61.2% |
(2.6%) |
|
Cost to Income Ratio without LLP |
47.6% |
45.9% |
(1.7%) |
|
Cost to Assets |
3.5% |
4.0% |
0.5% |
|
Capital Adequacy Ratios |
FY'2023 |
FY'2024f |
% points change |
|
Core Capital/Total Liabilities |
19.2% |
20.7% |
1.5% |
|
Minimum Statutory ratio |
8.0% |
8.0% |
0.0% |
|
Excess |
11.2% |
12.7% |
1.5% |
|
Core Capital/Total Risk Weighted Assets |
14.5% |
16.8% |
2.3% |
|
Minimum Statutory ratio |
10.5% |
10.5% |
0.0% |
|
Excess |
4.0% |
6.3% |
2.3% |
|
Total Capital/Total Risk Weighted Assets |
18.9% |
20.2% |
1.3% |
|
Minimum Statutory ratio |
14.5% |
14.5% |
0.0% |
|
Excess |
4.4% |
5.7% |
1.3% |
|
Liquidity Ratio |
44.7% |
51.6% |
6.9% |
|
Minimum Statutory ratio |
20.0% |
20.0% |
0.0% |
|
Excess |
24.7% |
31.6% |
6.9% |
Key Take-Outs:
- Increased earnings - Core earnings per share (EPS) grew by 21.9% to Kshs 9.3, from Kshs 7.6 in FY’2023, driven by the 20.0% increase in total operating income to Kshs 51.2 bn, from Kshs 42.7 bn in FY’2023, which outpaced the 15.2% increase in total operating expenses to Kshs 31.3 bn from Kshs 27.2 bn in FY’2023,
- Deteriorated asset quality –The bank’s Asset Quality deteriorated, with Gross NPL ratio increasing to 11.5% in FY’2024, from 10.7% in FY’2023, attributable to a 0.4% increase in Gross non-performing loans to Kshs 35.5 bn, from Kshs 35.4 bn in FY’2023, relative to the 6.6% decrease in gross loans to Kshs 309.2 bn, from Kshs 331.1 bn recorded in FY’2023,
- Expanded Balanced sheet - The balance sheet recorded an expansion as total assets increased by 3% to Kshs 581.3 bn, from Kshs 579.9 bn in FY’2023, mainly driven by a 31.0% increase in governments securities holdings to Kshs 102.3 bn, from 78.1 bn in FY’2023, however weighed down by a 7.8% decrease in net loans and advances to Kshs 287.1 bn, from Kshs 311.3 bn in FY’2023,
- Declaration of dividends - The Board of Directors recommended a final dividend of Kshs 1.7 per share, in addition to an interim dividend of Kshs 1.3 paid during the year, leading to a total dividend of Kshs 3.0 per share in FY’2024, from a total dividend of 2.55 in FY’2023. The payout ratio and dividend yield came in at 29.8% and 8.7% respectively in FY’2024, and,
- Reduced lending- Customer net loans and advances decreased by 7.8% to Kshs 287.1 bn in FY’2024, from Kshs 311.3 bn in FY’2023 attributed to increased credit risk with high NPLs in the industry, with the lender preferring to limit customer lending.
For a more detailed analysis, please see the I&M Group’s FY’2024 Earnings Note
- DTB-K FY’2024 results
During the week, DTB-K Group released their FY’2024 financial results. Below is a summary of the performance
|
Balance Sheet Items |
FY'2023 |
FY'2024 |
y/y change |
|
Government Securities |
120.1 |
126.2 |
5.0% |
|
Net Loans and Advances |
308.5 |
285.3 |
(7.5%) |
|
Total Assets |
635.0 |
573.9 |
(9.6%) |
|
Customer Deposits |
486.1 |
447.2 |
(8.0%) |
|
Deposits/ Branch |
3.2 |
2.8 |
(10.9%) |
|
Total Liabilities |
548.7 |
481.5 |
(12.2%) |
|
Shareholders’ Funds |
74.9 |
81.8 |
9.2% |
|
Balance Sheet Ratios |
FY'2023 |
FY'2024 |
% y/y change |
|
Loan to Deposit Ratio |
63.5% |
63.8% |
0.3% |
|
Government Securities to Deposit ratio |
24.7% |
28.2% |
3.5% |
|
Return on average equity |
10.8% |
11.3% |
0.4% |
|
Return on average assets |
1.3% |
1.5% |
0.1% |
|
Income Statement |
FY'2023f |
FY'2024f |
y/y change |
|
Net Interest Income |
27.6 |
28.4 |
3.0% |
|
Net non-Interest Income |
12.2 |
13.0 |
7.3% |
|
Total Operating income |
39.7 |
41.4 |
4.3% |
|
Loan Loss provision |
10.3 |
8.7 |
(15.6%) |
|
Other Operating expenses |
12.0 |
11.6 |
(3.2%) |
|
Total Operating expenses |
30.9 |
30.2 |
(2.3%) |
|
Profit before tax |
9.0 |
11.2 |
24.2% |
|
Profit after tax |
7.8 |
8.8 |
13.1% |
|
Core EPS |
24.6 |
31.5 |
28.2% |
|
Dividends per Share |
6.0 |
7.0 |
16.7% |
|
Dividend Payout |
24.4% |
25.6% |
1.3% |
|
Dividend Yield |
10.9% |
9.2% |
0.1% |
|
Income Statement Ratios |
FY'2023 |
FY'2024f |
y/y % points change |
|
Yield from interest-earning assets |
10.6% |
11.5% |
0.9% |
|
Cost of funding |
5.3% |
6.3% |
1.0% |
|
Net Interest Spread |
5.2% |
5.2% |
(0.0%) |
|
Net Interest Income as % of operating income |
69.4% |
68.5% |
(0.9%) |
|
Non-Funded Income as a % of operating income |
30.6% |
31.5% |
0.9% |
|
Cost to Income Ratio (CIR) |
77.7% |
72.8% |
(4.9%) |
|
CIR without provisions |
51.7% |
51.8% |
0.0% |
|
Cost to Assets |
5.3% |
5.0% |
(0.3%) |
|
Net Interest Margin |
5.5% |
5.5% |
0.0% |
|
Capital Adequacy Ratios |
FY'2023 |
FY'2024f |
% points change |
|
Core Capital/Total Liabilities |
19.7% |
17.5% |
(2.2%) |
|
Minimum Statutory ratio |
8.0% |
8.0% |
|
|
Excess |
11.7% |
9.5% |
(2.2%) |
|
Core Capital/Total Risk Weighted Assets |
18.6% |
16.3% |
(2.3%) |
|
Minimum Statutory ratio |
10.5% |
10.5% |
|
|
Excess |
8.1% |
5.8% |
(2.3%) |
|
Total Capital/Total Risk Weighted Assets |
19.2% |
18.0% |
(1.2%) |
|
Minimum Statutory ratio |
14.5% |
14.5% |
|
|
Excess |
4.7% |
3.5% |
(1.2%) |
|
Liquidity Ratio |
60.5% |
52.5% |
(8.0%) |
|
Minimum Statutory ratio |
20.0% |
20.0% |
|
|
Excess |
40.5% |
32.5% |
(8.0%) |
Key Take-Outs:
- Increased earnings - Core earnings per share (EPS) grew by 28.2% to Kshs 31.5, from Kshs 24.6 in FY’2023, driven by the 4.3% increase in total operating income to Kshs 41.4 bn, from Kshs 39.7 bn in FY’2023, coupled with the 2.3% decrease in total operating expenses to Kshs 30.2 bn from Kshs 30.9 bn in FY’2023,
- Improved asset quality –The bank’s Asset Quality improved, with Gross NPL ratio decreasing to 12.6% in FY’2024, from 13.4% in FY’2023, attributable to a 13.3% decrease in Gross non-performing loans to Kshs 37.9 bn, from Kshs 43.6 bn in FY’2023, which outpaced the 8.0% decline in gross loans to Kshs 300.4 bn, from Kshs 326.5 bn recorded in FY’2023,
- Contracted Balanced sheet - The balance sheet recorded a contraction as total assets declined by 9.6% to Kshs 573.9bn, from Kshs 635.0 bn in FY’2024, driven by a 7.2% decrease in net loans and advances to Kshs 285.3 bn, from 308.5 bn in FY’2023,
- Declaration of dividends - The Board of Directors recommended a first and final dividend of Kshs 7.0 per share in FY’2024, from a total dividend of Kshs 6.0 in FY’2023. The payout ratio and dividend yield came in at 25.6% and 9.2% respectively in FY’2024 from 24.4% and 10.9% respectively in FY’2023 and,
- Reduced lending- Customer net loans and advances decreased by 7.5% to Kshs 285.3 bn in FY’2024, from Kshs 308.5 bn in FY’2023 attributed to increased credit risk with high NPLs in the industry, with the lender preferring to limit customer lending.
For a more detailed analysis, please see the DTB-K’s FY’2024 Earnings Note
- HF FY’2024 results
During the week HF Group released its FY’2024 financial results. Below is a summary of HF Group’s FY’2024 performance:
|
Balance Sheet Items |
FY'2023 |
FY'2024f |
y/y change |
|
Government Securities |
9.7 |
17.0 |
75.3% |
|
Net Loans and Advances |
38.8 |
38.9 |
0.2% |
|
Total Assets |
61.6 |
70.1 |
14.0% |
|
Customer Deposits |
43.8 |
47.5 |
8.3% |
|
Deposits/Branch |
2.0 |
2.2 |
8.3% |
|
Total Liabilities |
52.7 |
54.5 |
3.4% |
|
Shareholders’ Funds |
8.9 |
15.7 |
76.9% |
|
Balance Sheet Ratios |
FY'2023 |
FY'2024f |
% y/y change |
|
Loan to Deposit Ratio |
88.5% |
81.9% |
(6.6%) |
|
Government Securities to Deposit Ratio |
22.1% |
35.7% |
13.7% |
|
Return on average equity |
4.4% |
4.3% |
(0.1%) |
|
Return on average assets |
0.7% |
0.8% |
0.1% |
|
Income Statement (Kshs Bn) |
FY'2023 |
FY'2024f |
y/y change |
|
Net Interest Income |
2.5 |
2.7 |
4.4% |
|
Net non-Interest Income |
1.2 |
1.5 |
21.2% |
|
Total Operating income |
3.8 |
4.2 |
9.9% |
|
Loan Loss provision |
(0.3) |
(0.4) |
17.8% |
|
Total Operating expenses |
(3.5) |
(3.7) |
7.0% |
|
Profit before tax |
0.3 |
0.5 |
37.5% |
|
Profit after tax |
0.4 |
0.5 |
35.2% |
|
Core EPS |
1.0 |
0.9 |
-10.8% |
|
Income Statement Ratios |
FY'2023 |
FY'2024f |
y/y change |
|
Yield from interest-earning assets |
11.0% |
10.3% |
(0.8%) |
|
Cost of funding |
5.7% |
6.4% |
0.7% |
|
Net Interest Spread |
5.3% |
3.9% |
(1.5%) |
|
Net Interest Margin |
5.4% |
4.3% |
(1.1%) |
|
Cost of Risk |
8.2% |
8.7% |
0.6% |
|
Net Interest Income as % of operating income |
67.2% |
63.9% |
(3.4%) |
|
Non-Funded Income as a % of operating income |
32.8% |
36.1% |
3.4% |
|
Cost to Income Ratio |
92.0% |
89.5% |
(2.5%) |
|
Cost to Income Ratio (without LLP) |
83.9% |
80.8% |
(3.1%) |
|
Capital Adequacy Ratios |
FY'2023 |
FY'2024f |
% points change |
|
Core Capital/Total Liabilities |
4.7% |
18.1% |
13.4% |
|
Minimum Statutory ratio |
8.0% |
8.0% |
0.0% |
|
Excess |
(3.3%) |
10.1% |
13.4% |
|
Core Capital/Total Risk Weighted Assets |
5.3% |
21.4% |
16.1% |
|
Minimum Statutory ratio |
10.5% |
10.5% |
0.0% |
|
Excess |
(5.2%) |
10.9% |
16.1% |
|
Total Capital/Total Risk Weighted Assets |
9.0% |
24.6% |
15.6% |
|
Minimum Statutory ratio |
14.5% |
14.5% |
0.0% |
|
Excess |
(5.5%) |
10.1% |
15.6% |
|
Liquidity Ratio |
24.5% |
41.8% |
17.3% |
|
Minimum Statutory ratio |
20.0% |
20.0% |
0.0% |
|
Excess |
4.5% |
21.8% |
17.3% |
Key Take-Outs:
- Decreased earnings Core earnings per share declined by 10.8% to Kshs 0.9, from Kshs 1.0 in FY’2023, 7.0% increase in total operating expenses to Kshs 3.7 bn from Kshs 3.5 bn in FY’2023,
- Deteriorated asset quality – The bank’s Asset Quality deteriorated, with Gross NPL ratio increasing to 25.3% in FY’2024, from 23.1% in FY’2023, attributable to a 10.6% increase in Gross non-performing loans to Kshs 12.0 bn, from Kshs 10.8 bn in FY’2023, which outpaced the 0.8% decrease in gross loans to Kshs 47.3 bn, from Kshs 46.9 bn recorded in FY’2023,
- Expanded Balanced sheet - The balance sheet recorded an expansion as total assets increased by 0% to Kshs 70.1 bn, from Kshs 61.6 bn in FY’2023, mainly driven by a 75.3% increase in governments securities holdings to Kshs 17.0 bn, from 9.7 bn in FY’2023 coupled with a 0.2% increase in net loans and advances to Kshs 38.9 bn, from Kshs 38.8 bn in FY’2023,
- Increased lending- Customer net loans and advances increased by 0.2% to Kshs 38.9 bn in FY’2024, from Kshs 38.8 bn in FY’2023.
For a more detailed analysis, please see the HF Group’s FY’2024 Earnings Note
Summary Performance
The table below shows the performance of listed banks that have released their FY’2024 results using several metrics:
|
Cytonn Report: Listed Banks Performance in FY’2024 |
||||||||||||||
|
Bank |
Core EPS Growth |
Interest Income Growth |
Interest Expense Growth |
Net Interest Income Growth |
Net Interest Margin |
Non-Funded Income Growth |
NFI to Total Operating Income |
Growth in Total Fees & Commissions |
Deposit Growth |
Growth in Government Securities |
Loan to Deposit Ratio |
Loan Growth |
Return on Average Equity |
|
|
KCB Group |
64.9% |
26.9% |
25.0% |
28.0% |
7.8% |
16.6% |
33.0% |
0.9% |
(18.3%) |
(13.2%) |
71.7% |
(9.6%) |
24.6% |
|
|
Standard Chartered Bank |
45.0% |
20.0% |
83.4% |
13.4% |
9.6% |
40.4% |
34.4% |
11.9% |
(13.8%) |
34.7% |
51.3% |
(7.1%) |
30.1% |
|
|
Diamond Trust Bank Kenya |
28.2% |
12.0% |
21.6% |
3.0% |
5.5% |
7.3% |
31.5% |
15.8% |
(8.0%) |
5.0% |
63.8% |
(7.5%) |
11.3% |
|
|
Absa Bank Kenya |
27.5% |
15.4% |
30.1% |
15.4% |
10.5% |
10.8% |
25.8% |
27.5% |
1.2% |
30.0% |
84.2% |
(7.9%) |
27.0% |
|
|
I&M Group |
21.9% |
35.0% |
39.9% |
31.2% |
8.5% |
(2.8%) |
26.7% |
15.6% |
(1.1%) |
31.0% |
69.6% |
(7.8%) |
14.9% |
|
|
Stanbic Holdings |
12.8% |
37.8% |
105.7% |
(5.1%) |
5.9% |
(1.7%) |
38.8% |
(13.1%) |
(2.8%) |
70.6% |
71.6% |
(11.6%) |
19.1% |
|
|
Equity Group |
11.0% |
9.2% |
20.3% |
3.7% |
5.8% |
10.7% |
43.9% |
12.9% |
3.1% |
22.0% |
58.5% |
(7.7%) |
22.1% |
|
|
Co-operative Bank of Kenya |
9.8% |
24.9% |
45.7% |
13.9% |
8.4% |
24.5% |
36.1% |
3.2% |
12.1% |
15.1% |
73.8% |
(0.1%) |
19.7% |
|
|
NCBA Group |
1.9% |
16.0% |
34.5% |
(0.3%) |
5.7% |
(3.1%) |
45.0% |
5.5% |
(13.4%) |
(11.1%) |
60.2% |
(10.4%) |
21.2% |
|
|
HF Group |
(10.8%) |
23.1% |
41.0% |
4.4% |
4.3% |
21.2% |
36.1% |
36.1% |
8.3% |
75.3% |
81.9% |
0.2% |
4.3% |
|
|
FY'24 Mkt Weighted Average* |
26.2% |
20.5% |
42.6% |
12.0% |
7.6% |
13.9% |
36.1% |
9.2% |
(4.4%) |
18.9% |
66.5% |
(7.6%) |
22.8% |
|
|
FY'23 Mkt Weighted Average** |
11.4% |
30.5% |
52.4% |
20.6% |
7.5% |
16.4% |
37.0% |
25.0% |
2.2% |
69.0% |
21.2% |
9.5% |
38.3% |
|
|
*Market cap weighted as at 28/03/2025 |
||||||||||||||
|
**Market cap weighted as at 18/04/2024 |
||||||||||||||
Key take-outs from the table include:
- The listed banks that have released their FY’2024 results recorded a 26.2% growth in core Earnings per Share (EPS) in FY2024, compared to the weighted average growth of 11.4% in FY’2023, an indication of improved performance attributable to the improved operating environment experienced during FY’2024,
- Interest income recorded a weighted average growth of 20.5% in FY’2024, compared to 30.5% in FY’2023. Similarly, interest expenses recorded a market-weighted average growth of 42.6% in FY’2024 compared to a growth of 52.4% in FY’2023,
- The Banks’ net interest income recorded a weighted average growth of 12.0% in FY’2024, a decline from the 20.6% growth recorded over a similar period in 2023, while the non-funded income grew by 13.9% in FY’2024 slower than the 16.4% growth recorded in, and,
- The Banks recorded a weighted average deposit decline of 4.4%, compared to the market-weighted average deposit growth of 2.2% in FY’2023.
- CIC FY’2024 results
During the week, CIC Group released their FY’2024 results. CIC’s Profit After Tax (PAT) increased by 98.0% to Kshs 2.9 bn from Kshs 1.4 bn, recorded in FY’2023. The performance was mainly driven by a 35.7% increase in Net investment income to Kshs 8.8 bn in FY’2024, from Kshs 2.9 bn in FY’2023, and further supported by a 14.0% decrease in Net expenses from reinsurance contracts to Kshs 1.8 bn, from Kshs 2.1 bn in FY’2023. However, the performance was weighed down by the 56.4% decrease in net income from insurance services to Kshs 0.3 bn, from Kshs 0.8 bn in FY’2024
|
Cytonn Report: CIC Group Income Statement |
|||
|
Item (All figures in Bns) |
FY’2023 |
FY’2024 |
y/y change |
|
Insurance Revenue |
25.4 |
26.3 |
3.7% |
|
Insurance service expenses |
(22.5) |
(24.2) |
7.5% |
|
Net expenses from reinsurance contracts held |
(2.1) |
(1.8) |
(14.0%) |
|
Net Insurance income |
0.8 |
0.3 |
(56.4%) |
|
Net Investment Income |
2.9 |
8.8 |
35.7% |
|
Net Financial result |
2.2 |
3.8 |
74.0% |
|
Other Operating Expenses |
(1.5) |
(1.7) |
18.8% |
|
Operating Profit |
3.1 |
4.6 |
49.1% |
|
Profit Before Tax |
2.5 |
4.0 |
57.0% |
|
Profit After Tax |
1.4 |
2.9 |
98.0% |
|
Core EPS in Kshs |
0.6 |
1.1 |
98.0% |
|
Dividend Payout Ratio |
23.6% |
11.9% |
(49.5%) |
|
Dividend yield |
5.8% |
4.6% |
(21.5%) |
|
Cytonn Report: CIC Group Balance Sheet |
|||
|
Item (All figures in Bns) |
FY'2023 |
FY'2024 |
y/y change |
|
Investment assets |
7.8 |
3.7 |
(52.4%) |
|
Property & Equipment and Intangibles |
1.4 |
1.4 |
(3.0%) |
|
Total Assets |
50.3 |
61.9 |
23.1% |
|
Insurance Contract Liabilities |
0.0 |
41.8 |
- |
|
Provisions & other payables |
3.2 |
3.7 |
14.7% |
|
Total liabilities |
42.7 |
50.9 |
19.3% |
|
Shareholder funds |
7.6 |
11.0 |
44.7% |
|
Minority Interest |
(0.1) |
(0.1) |
(28.1%) |
|
Total Equity |
7.5 |
11.0 |
45.5% |
Key take outs from the results:
- Core Earnings Per share increased by 98.0% to Kshs 1.1 from Kshs 0.6 in FY’2023, mainly driven by a 35.7% increase in Net investment income to Kshs 8.8 bn in FY’2024, from Kshs 2.9 bn in FY’2023.This increase was however weighed down by a 56.4% decrease in Net income from insurance service to Kshs 0.3 bn, from Kshs 0.8 bn in FY’2023,
- Net financial result increased by 74.0% to Kshs 3.8 bn in FY’2024, from Kshs 2.2 bn in FY’2023. This was majorly attributable to the 35.7% increase in net investment income coupled with 14.0% decrease in net finance expenses from insurance contracts to Kshs 1.8 bn from Kshs 2.1 bn in FY’2023,
- Insurance revenue increased by 3.7% to Kshs 26.3 bn in FY’2024 from Kshs 25.4 bn in FY’2023, while insurance service expenses increased by 7.5% to Kshs 24.2 bn from Kshs 22.5 bn in FY’2023, and the net expenses from reinsurance contracts held decreased by 14.0% to Kshs 1.8 bn, from Kshs 2.1 bn in FY’2023. This translated to a Net insurance income decrease of 56.4% to Kshs 0.3 bn from Kshs 0.8 bn in FY’2023,
- The balance sheet recorded an expansion as total assets increased by 23.1% to Kshs 61.9 bn in FY’2024 from Kshs 50.3 bn in FY’2023 mainly driven by 35.5% increase in reinsurance contract assets to Kshs 5.1 bn from Kshs 3.7 bn in FY’2023. The increase was however weighed down by 52.4% decrease in investment assets to Kshs 3.7 bn form Kshs 7.8 bn in FY’2023, and,
- Total liabilities increased by 19.3% to Kshs 50.9 bn from Kshs 42.7 bn in FY’2023, majorly on the back of the 14.7% increase in provisions and other payables to Kshs 3.7 bn from Kshs 3.2 bn in FY’2023.
Other highlights from the release include:
- Declaration of dividends – The Group’s board of directors declared the first and final dividend of Kshs 0.13 for the FY’2024 to remain unchanged from FY’2023, translating to a dividend yield of 4.6% and a dividend payout of 11.9%.
Key to note, this was the fourth time the company was releasing their results under the new IFRS 17 reporting system. The new standard demands that insurers measure insurance contracts using updated estimates and assumptions that reflect the timing of cashflows and any uncertainty relating to insurance contracts. Going forward, the Group earnings will be boosted by digital transformation to enhance customer service delivery especially through the launch of initiatives such as EasyBima which aims to improve accessibility and convenience for clients. The company is investing in product diversification by establishing new subsidiaries including CIC Micro Insurance Limited and CIC Pharmacy Limited. These ventures are designed to tap into new markets and revenue streams such as micro-insurance and pharmaceuticals. With these strategies, CIC aims to strengthen its market presence.
Valuation Summary:
- We are of the view that CIC Group is an “Buy” with a target price of Kshs 3.1 representing an upside of 2%, from the current price of 2.8 as of 28th March 2025, inclusive of a dividend yield of 4.6%
- CIC Group is currently trading at a P/TBV of 0.9x and a P/E of 6x vs an industry average of 0.4x and 10.8x respectively.
- Britam FY’2024 results
During the week, Britam Holdings released their FY’ 2024 results. Britam’s Profit After Tax (PAT) increased by 53.5% to Kshs 5.0 bn, from Kshs 3.3 bn recorded in FY’2023. The performance was mainly driven by a 163.4% increase in Net Investment income to Kshs 30.6 bn, from Kshs 11.6 bn in FY’2023 as well as a 35.5% increase in net insurance and investment result to Kshs 9.2 bn from 6.8 bn in FY 2023 but was weighed down by the 208.8% increase in Insurance Expenses to Kshs 26.4 bn in FY’2024, from Kshs 8.6 bn in FY’2023
|
Cytonn Report: Britam Holdings Income Statement |
|||
|
Item (All figures in Bns) |
FY'2023 |
FY'2024 |
y/y change |
|
Insurance Revenue |
36.4 |
37.6 |
3.1% |
|
Insurance service expenses |
26.9 |
27.3 |
1.6% |
|
Net Insurance income |
3.8 |
5.1 |
35.1% |
|
Net Investment Income |
11.6 |
30.6 |
163.4% |
|
Net Insurance and Finance expenses |
8.6 |
26.4 |
208.8% |
|
Net Insurance and investment result |
6.8 |
9.2 |
35.5% |
|
Fund management fees |
0.6 |
0.7 |
2.5% |
|
Other Income |
0.8 |
1.3 |
72.6% |
|
Other Finance cost |
(0.2) |
(0.3) |
14.8% |
|
Other operating expenses |
(3.4) |
(4.0) |
19.2% |
|
Profit Before Tax |
4.8 |
7.3 |
52.1% |
|
Profit After Tax |
3.3 |
5.0 |
53.5% |
|
Core EPS |
1.3 |
2.0 |
53.5% |
|
Cytonn Report: Britam Holdings Balance Sheet |
|||
|
Item (All figures in Bns) |
FY'2023 |
FY'2024 |
y/y change |
|
Investment assets |
150.1 |
186.1 |
24.0% |
|
Intangible Assets |
2.0 |
2.2 |
7.5% |
|
Total Assets |
174.4 |
208.5 |
19.6% |
|
Insurance Contract Liabilities |
133.7 |
163.4 |
22.2% |
|
Provisions & other payables |
11.9 |
13.9 |
17.5% |
|
Total liabilities |
148.7 |
179.1 |
20.4% |
|
Shareholder funds |
25.4 |
29.2 |
14.7% |
|
Minority Interest |
0.2 |
0.3 |
11.6% |
|
Total Equity |
25.7 |
29.5 |
14.7% |
Key take outs from the results:
- Core Earnings Per share increased by 53.5% to Kshs 2.0 from Kshs 1.3 in FY’2023, driven by the 163.4% increase in Net Investment income to Kshs 6 bn, from Kshs 11.6 bn in FY’2023, coupled with the xx in in net insurance service result but was weighed down by the 208.8% increase in Insurance Expenses to Kshs 26.4 bn in FY’2024, from Kshs 8.6 bn in FY’2023
- Net Investment Income (NII) increased by 163.4% to Kshs 30.6 bn in FY’2024, from Kshs 11.6 bn in FY’2023. This was majorly attributable to the 24.3% increase in interest and dividend income to 19.4 bn from Kshs 9.1 bn in FY’2023, coupled with a 24.3% increase in income from investment property to 0.8 bn from the Kshs 0.6 bn in FY’2023
- Insurance revenue increased by 3.1% to Kshs 37.6 bn in FY’2024 from Kshs 36.4 bn in FY’2023, while insurance expenses increased by 1.6% to Kshs 27.3 bn from Kshs 26.9 bn in FY’2023, and net expenses from reinsurance contracts decreased by 10.8% to Kshs 5.2 bn from Kshs 5.8 bn in FY’2023, translating to a Net insurance service result increase of 35.1% to Kshs 5.1 bn from Kshs 3.8 bn in FY’2023,
- The balance sheet recorded an expansion as total assets increased by 19.6% to Kshs 208.5 bn in FY’2024 from Kshs 174.4 bn in FY’2023 mainly driven by 24.0% increase in investment assets to Kshs 186.1 bn from Kshs 150.1 bn in FY’2023, the increase was however weighed down by a 0.4% decrease in cash and bank balances assets to Kshs 7.0 bn from Kshs 10.6 bn as well as a 0.4% decrease in reinsurance contracts assets to remain relatively unchanged at 7.0 bn registered in FY 2023.
- Total liabilities increased by 20.4% to Kshs 179.1 bn from Kshs 148.7 bn in FY’2023, majorly on the back of Insurance contract liabilities 22.2% increase to Kshs 163.4 bn from Kshs 133.7 bn in FY’2023, as well as the 20.4% increase in provisions and other payables to Kshs 13.9 bn from Kshs 11.9 bn in FY’2023
Other highlights from the release include:
- Non-declaration of dividends – The Group’s board of directors declined to announce any dividends for the fifth consecutive year citing the group’s attempt to conserve capital.
Going forward, the factors that would drive the company’s growth would be:
- Microinsurance partnerships – With 43.0% market share in microinsurance, Britam continues to leverage on this segment through internal initiatives and partnerships. Partnerships such as that between the company and Bonfire adventures and Digital innovation hub Ohala to offer travel insurance, and another with Voltic Kenya to provide travel insurance and online ticketing are some notable initiatives
- Diversified Products – On top of their mainstream insurance products, Britam has innovatively introduced a number of products into the market. These diversified products, such as school personal accidents, new born baby insurance products and their unit trust products, will contribute to a continued growth of the company’s growth.
Valuation Summary:
- We are of the view that Britam Holdings Plc is a “Sell” with a target price of Kshs 5 representing a downside of 6.0%, from the current price of 8.0 as of 28th March 2025.
Britam is currently trading at a P/TBV of 1.1x and a P/E of 4.0x vs an industry average of 0.8x and 8.1x respectively.
- Liberty FY’2024 results
During the week, Liberty Kenya Holdings released their FY’2024 results, with Profit After Tax (PAT) increasing by 119.7% to Kshs 1.4 bn, from Kshs 0.6 bn recorded in FY’2023, mainly driven by a 99.8% increase in Net investment income to Kshs 2.0 bn, from Kshs 1.0 bn in FY’2023 and further supported by 5.6 % increase in Net insurance income to Kshs 1.00 bn, from Kshs 0.95 bn in FY’2023,
|
Cytonn Report: Liberty Kenya Holdings Income Statement |
|||
|
Item (All figures in Bns) |
FY'2023 |
FY'2024 |
y/y change |
|
Net Insurance Service Revenue |
1.0 |
1.0 |
5.6% |
|
Net Investment Revenue |
1.0 |
2.0 |
99.8% |
|
Total Insurance and Investment Result |
1.9 |
3.0 |
53.8% |
|
Other Operating Result |
(0.9) |
(0.9) |
(4.3%) |
|
Profit Before Tax |
1.0 |
2.1 |
106.6% |
|
Profit after tax |
0.6 |
1.4 |
119.7% |
|
Core EPS |
1.2 |
2.6 |
119.7% |
|
Dividend Per Share |
0.4 |
1.0 |
168.1% |
|
Dividend Yield |
7.4% |
9.7% |
31.2% |
|
Dividend Pay-out Ratio |
31.7% |
38.7% |
22.1% |
|
Cytonn Report: Liberty Kenya Holdings Balance Sheet |
|||
|
Item (All figures in Bns) |
FY'2023 |
FY'2024 |
y/y change |
|
Financial Investments |
20.3 |
27.6 |
35.7% |
|
Re-insurance contract assets |
5.7 |
1.9 |
-67.2% |
|
Total Assets |
43.8 |
48.1 |
10.0% |
|
Insurance contract Liabilities |
23.9 |
18.9 |
(20.6%) |
|
Shareholders’ Funds |
9.6 |
10.6 |
11.2% |
|
Total Liabilities |
34.2 |
37.5 |
9.7% |
Key take outs from the results:
- Core Earnings Per share increased by 119.7% to Kshs 2.6 from Kshs 1.2 in FY’2023, driven by the 99.8% increase in Net investment income to Kshs 2.0 bn, from Kshs 1.0 bn in FY’2023 and further supported by 5.6 % increase in Net insurance income to Kshs 1.00 bn, from Kshs 0.95 bn in FY’2023,
- Net Investment Income increased by 99.8% to Kshs 2.0 bn, from Kshs 1.0 bn in FY’2023.This was majorly attributable to a significant 872.2% increase in investment gains to Kshs. 5.7 bn from Kshs 0.6 bn in FY’2023, that outpaced the 542.8% increase in net insurance finance expenses to 8bn ,from 0.4 bn in FY’2023
- Net insurance revenue before reinsurance contracts held increased by 9.9% to Kshs 2.4 bn in FY’2024 from of Kshs 2.2 bn in FY’2023, while net expense from reinsurance contracts held increased by 13.2% to Kshs 1.4 bn from Kshs 1.3 bn in FY’2023, this translated to an insurance service result increase of 5.6% to Kshs 1.00 bn from Kshs 0.95 bn in FY’2023,
- The balance sheet recorded an expansion as total assets increased by 10.0% to Kshs 48.1 bn in FY’2024 from Kshs 43.8 bn in FY’2023 mainly driven by 35.7% increase in financial investments to Kshs 27.6 bn from Kshs 20.3 bn in FY’2023, however weighed down by 67.2% decrease in reinsurance contract assets Kshs 1.9 bn from Kshs 5.7 bn in FY’2023,
- Total liabilities increased by 9.7% to Kshs 37.5 bn from Kshs 34.2 bn in FY’2023, majorly on the back of the 55.5% increase in financial liabilities under investment contracts to Kshs 11.0 bn from Kshs 7.1 bn in FY’2023, which outpaced the 20.6% decrease in insurance contract liabilities to Kshs 18.9 bn, from Kshs 23.9bn in FY’2023,
- The Board of Directors recommended a normal dividend of Kshs 0.5 per share,and a special dividend of Kshs 0.5per share, bringing the total dividend in FY’2024 to Kshs 0 per share, compared to Kshs 0.373 per share FY’2023. This translates to a dividend payout ratio of 38.7% and a dividend yield of 9.7% as of 28th March 2025, compared to a dividend payout ratio of 31.7% and a dividend yield of 7.4% in a similar period for FY’2023.
Going forward, the factors that would drive the company’s growth would be:
- Technology Architecture – The company seeks to leverage technology to unify policy administration system for Liberty Life, enhance actuarial modeling, upgrade medical business systems, and API/digital
Valuation Summary:
- We are of the view that Liberty Kenya Holdings Plc is an “Accumulate” with a target price of Kshs 11.5 representing an upside of 7%, from the current price of 8.34 as of 25th March 2025, inclusive of a dividend yield of 12.0%
- Liberty Kenya Holdings Plc is currently trading at a P/TBV of 0.7x and a P/E of 5x vs an industry average of 0.6x and 11.3x respectively.
- Kenya Airways FY’2024 results
During the week, Kenya Airways Plc released their FY’2024 results, recording a significant 123.9% increase in Profit After Tax to Kshs 5.4 bn, from the Kshs 22.7 bn loss recorded in FY’2023. The performance was mainly driven by a106.5% increase in forex gains on borrowings, attributable to the 17.4% appreciation of the Kenyan shilling, coupled with a 57.8% increase in operating profit to Kshs 16.6 bn, from the Kshs 10.5 bn recorded in FY’2023. The Kshs 5.4 bn profit after tax was the highest ever recorded in Kenya Airways’ history due to the recovery strategy under Project Kifaru.
|
Cytonn Report: Kenya Airways Plc's Income Statement |
|||
|
Income Statement (Kshs bn) |
FY'2023 |
FY'2024 |
y/y change |
|
Total Income |
178.5 |
188.5 |
5.6% |
|
Total Operating Costs |
(168.0) |
(171.9) |
2.3% |
|
Operating Profit |
10.5 |
16.6 |
57.8% |
|
Forex gains/losses on borrowings and leases |
(19.1) |
1.2 |
106.5% |
|
Finance Costs |
(14.5) |
(12.4) |
(14.6%) |
|
Interest Income |
0.2 |
0.1 |
(58.2%) |
|
Profit before tax |
(22.9) |
5.5 |
124.2% |
|
Income tax |
0.2 |
(0.1) |
(275.8%) |
|
Profit after tax |
(22.7) |
5.4 |
123.9% |
|
EPS |
(4.0) |
1.0 |
123.9% |
|
Cytonn Report: Kenya Airways Plc's Balance Sheet |
|||
|
Balance Sheet items |
FY'2023 |
FY'2024 |
y/y change |
|
Non-current Assets |
146.2 |
137.5 |
(6.0%) |
|
Current Assets |
33.6 |
41.6 |
23.8% |
|
Total Assets |
179.8 |
179.1 |
(0.4%) |
|
Non-current Liabilities |
193.4 |
177.9 |
(8.0%) |
|
Current Liabilities |
124.5 |
119.4 |
(4.0%) |
|
Total Liabilities |
317.9 |
297.4 |
(6.5%) |
|
Share Capital |
5.8 |
5.8 |
0.0% |
|
Share premium |
49.2 |
49.2 |
0.0% |
|
Other reserves |
(193.2) |
(173.3) |
(10.3%) |
|
Shareholder funds |
(138.1) |
(118.2) |
(14.4%) |
|
Minority Interest |
0.1 |
(0.0) |
(112.9%) |
|
Total Equity |
(138.1) |
(118.3) |
(14.3%) |
|
Liabilities and Equities |
179.8 |
179.1 |
(0.4%) |
Key take outs from the results:
- The 57.8% increase in operating profit was driven by the 5.6% increase in total income to Kshs 188.5 bn from Kshs 178.5 bn in FY’2023, which outpaced the 2.3% increase in total operating costs 2.3% to Kshs 171.9 bn from Kshs 168.0 bn in FY’2023.
- Profit before tax increased significantly by 124.2% to Kshs 5.5 bn from the Kshs 22.9 bn loss recorded in FY’2023.
- Forex gains on borrowings and leases increased by 106.5% to Kshs 1.2 bn from a loss of Kshs 19.1 bn recorded in FY’2023 attributable to the 17.4% appreciation of the Kenyan shilling in 2024. Interest income decreased by 58.2% to Kshs 0.1 bn from Kshs 0.2 bn in FY’2023. Additionally, finance costs decreased by 14.6% to Kshs 12.4 bn from Kshs 14.5 bn in FY’2023. Notably, the Income tax decreased by 275.8
- The balance sheet recorded a contraction as total assets decreased by 0.4% to Kshs 179.1 bn in FY’2024 from Kshs 179.8 bn in FY’2023 mainly driven by 6.0% decrease in non-current assets to Kshs 137.5 bn from Kshs 146.2 bn in FY’2023.
- Total liabilities decreased by 6.5% to Kshs 297.4 bn from Kshs 317.9 bn in FY’2023, majorly on the back of the 8.0% decrease in non-current liabilities to Kshs 177.9 bn from Kshs 193.4 bn in FY’2023 coupled with a 4.0% decrease in current liabilities to Kshs 119.4 bn from Kshs 124.5 bn in FY’2023.
- Shareholder funds decreased by 14.4% to Kshs 118.2 bn from Kshs 138.1 bn in FY’2023.
- The board of directors of Kenya Airways PLC did not recommend a dividend for FY’2024 marking the twelfth consecutive year without a dividend, with the last payment paid in 2012.
Going forward, the factors that would drive the company’s growth would be:
- Stable currency – Kenya Airways cited the stability of the Kenyan shilling as part of the factors that supported its positive performance. The Kenyan shilling appreciated by 17.4% in 2024 to close at Kshs 129.3. On a year-to-date basis, the Kenyan shilling has remained stable at Kshs 129.3 as of 28th March 2025. As a result, the continued stability of the currency since 2024 is expected to enhance investor confidence, reduce ticket price volatility and improve the overall financial planning, leading to better profitability. The stability of the Kenyan shilling is expected to reduce foreign exchange losses for Kenya Airways, lowering the cost of servicing foreign debts. This is evident from the Kshs 1.2 bn forex gain on borrowings and leases in 2024.
- Project Kifaru– In 2021, Kenya Airways launched a revitalization strategy called Project Kifaru, focused on ensuring survival, stabilization, and growth. This initiative followed Project Safari, which was introduced in 2017 to address liquidity issues and operational inefficiencies through debt restructuring and capital reorganization. Despite these efforts, the airline continued to incur losses, prompting the launch of Project Kifaru. Phase I of the project aimed to facilitate post-Covid recovery. Phase II aimed to expand fleet to increase passenger capacity and reduce operational costs by phasing out unprofitable aircraft and routes. Consequently, the company witnessed a return to profitability for the first time in 12 years, recording a significant 123.9% increase in Profit After Tax to Kshs 5.4 bn, from the Kshs 22.7 bn loss recorded in FY’2023.
- KCB’s Acquisition of Riverbank Solutions Limited
During the week KCB Group Plc disclosed its acquisition of a 75.0% controlling interest in Riverbank Solutions Limited, a fintech entity focused on payment systems, as part of its strategic initiative to bolster digital capabilities and reinforce its footprint in banking, agency solutions, and business services across Kenya, Uganda, and Rwanda. Riverbank, a collaborator with KCB since 2013 in agency banking, brings expertise in digital payments, payroll management, and financial reporting, which KCB aims to harness to enhance its offerings tailored for small and medium enterprises (SMEs) and micro, small, and medium enterprises (MSMEs). The integration of Riverbank’s capabilities is expected to facilitate the unification of KCB’s agent banking channels into a single platform, optimizing operational efficiency. The table below shows past acquisitions by KCB bank
|
Bank Acquired |
Book Value at Acquisition |
Transaction stake |
Transaction value |
P/Bv Multiple |
Date |
|
Trust Merchant Bank |
12.4 |
85.0% |
15.7 |
1.5x |
Dec-22 |
|
Banque Populaire du Rwanda |
5.3 |
100.0% |
5.6 |
1.1x |
Aug-21 |
|
ABC Tanzania** |
Unknown |
100.0% |
0.8 |
0.4x |
Nov-20 |
|
National Bank of Kenya |
7 |
100.0% |
6.6 |
0.9x |
Sep-19 |
|
Imperial Bank |
Unknown |
Undisclosed |
Undisclosed |
N/A |
Dec-18 |
**Deals that were dropped
The deal awaits regulatory clearance from the Central Bank of Kenya and the Competition Authority of Kenya, after which Riverbank will operate as a subsidiary of KCB Group Plc. This acquisition aligns with KCB’s overarching digital transformation agenda, evidenced by initiatives such as the establishment of a Digital Centre of Excellence and enhancements to its core banking infrastructure. Financially, KCB demonstrated robust growth, posting a 64.9% year-on-year increase in profit to Kshs. 61.8 bn for the 2024 fiscal year, underpinned by business expansion, with its balance sheet reaching Kshs. 2.0 tn despite industry headwinds. This acquisition is poised to solidify KCB’s competitive standing and elevate customer value through advanced financial technology solutions. The graph below shows KCB’s total assets over the years.
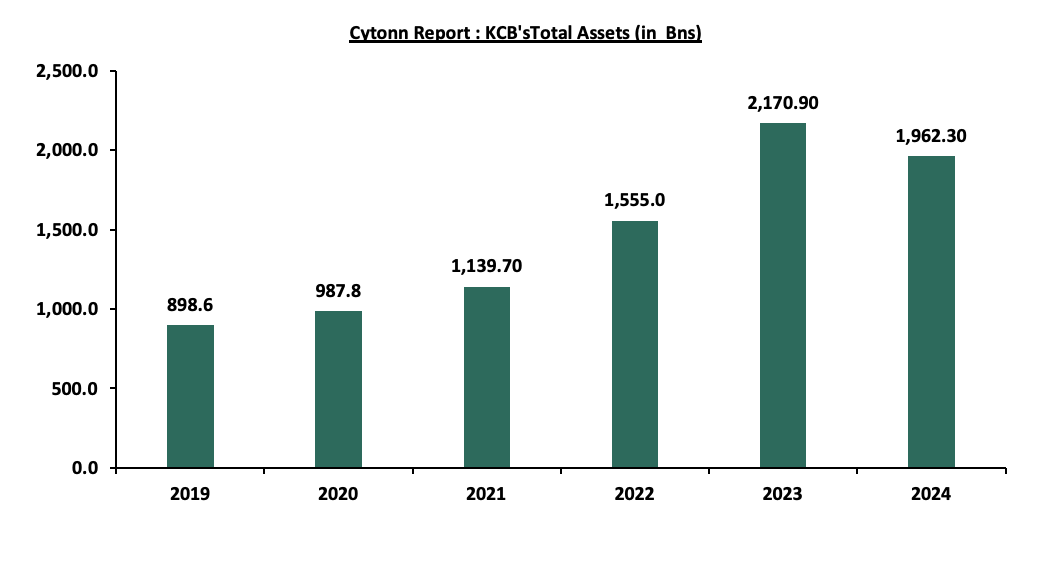
We are “Bullish” on the Equities markets in the short term due to current cheap valuations, lower yields on short-term government papers and expected global and local economic recovery, and, “Neutral” in the long term due to persistent foreign investor outflows. With the market currently trading at a discount to its future growth (PEG Ratio at 0.7x), we believe that investors should reposition towards value stocks with strong earnings growth and that are trading at discounts to their intrinsic value. We expect the current high foreign investors sell-offs to continue weighing down the economic outlook in the short term.
- Industry Report
- January 2025 Leading Economic Indicators
During the week, the Kenya National Bureau of Statistics (KNBS) released the Leading Economic Indicators (LEI) January 2025 Reports, which highlighted the performance of major economic indicators. Key highlights related to the Real Estate sector include;
- The total value of building plans approved in the Nairobi Metropolitan Area (NMA) decreased y/y basis by 31.3 % to Kshs 8.6 bn in January 2025, from Kshs 12.5 bn recorded in January 2024. In addition, on a m/m basis, the performance represented a 60.0% decrease from Kshs 21.4 bn recorded in December 2024. The decrease in performance was attributable to; i) continued high cost of construction materials such as reinforced steel and cement which was increased by 10.7% in 2024 to Kshs 830 from Kshs 750 recorded in 2023, ii) developers and investors shifted strategies, emphasizing operational efficiency and sustainability rather than embarking on new large-scale developments, iii) Lending institutions raised the cost of borrowing due to the increase in Non-Performing loans in the sector. As of September 2024, the gross NPL ratio stood at 16.5%, a slight improvement from 16.6% in June 2024.
The chart below shows the value of building plans approved in the Nairobi Metropolitan Area (NMA) between Q1’2022 and January 2025;
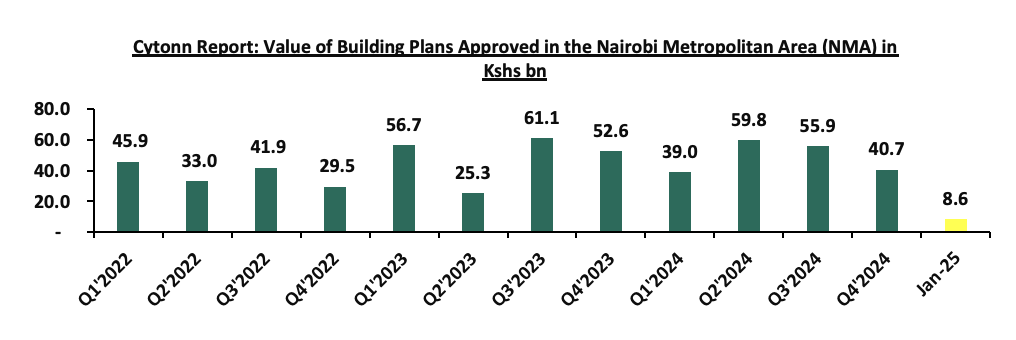
Source: Kenya National Bureau of Statistics (KNBS)
- The consumption of cement came in at 0.8 bn tonnes in January 2025, a 26.9% increase from 0.6 bn tonnes recorded in January 2024. On a m/m basis, the performance represented a 6.6% increase from 0.7 bn tonnes recorded in December 2024. The increase in performance was attributable to; i) Resumption in domestic construction and infrastructure development ii) increased government-led infrastructure investments, iii) strategic focus on stimulating domestic economic activity through public works projects, and, iv) eased costs of the construction, which decreased by 6.8% during the month to Kshs 66,375 per SQM from an average of Kshs 71,200 per SQM recorded in 2024. However, the improvement in construction cost remains subdued due to the increase in building materials such as cement which increased by 10.7% in 2024 to Kshs 830 from Kshs 750 recorded in 2023. The chart below shows cement consumption in metric tonnes in Kenya between Q1’2022 and January 2025;
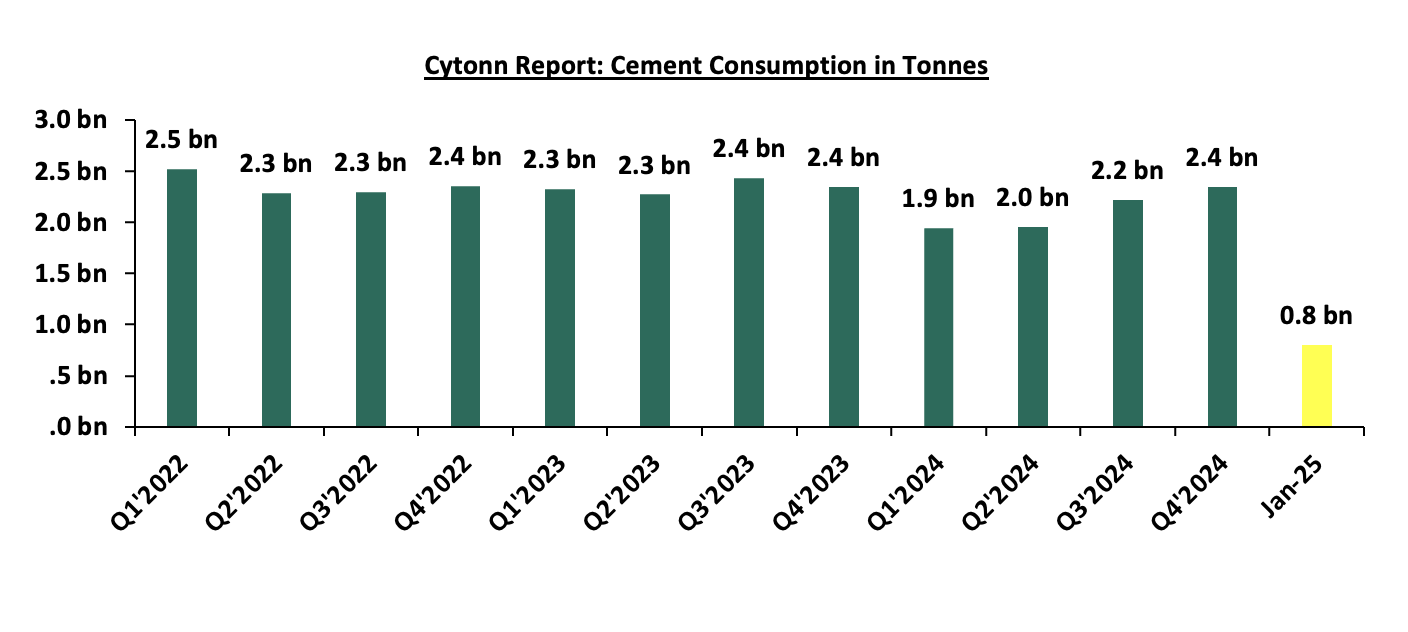
Source: Kenya National Bureau of Statistics (KNBS)
- Kenya Mortgage Refinance Company (KMRC) financial performance FY’ 2024
During the week, state-backed mortgage lender, Kenya Mortgage Refinance Company (KMRC) released its FY’ 2024 financial results, which reported a 55.9% increase in Profit After Tax (PAT) to Kshs 1.3 bn from Kshs 847.8 mn recorded in FY’2023 majorly attributable to 33.9% increase in interest income to Kshs 3.2 bn in FY’2024 from 2.4 bn in FY’2023. Additionally, total assets increased by 24.5% to Kshs 32.3 bn from 26.0 bn posted in FY’2023, owing to the 41.4% and 25.0% increase in Loan and advances and Cash and Cash equivalents respectively. The table below shows a summary of KMRC’s income statement for FY’2022 and FY’2023;
The table below shows a summary of KMRC’s income statement for FY’2023 and FY’2024;
Figures in Kshs mn Unless Stated Otherwise
|
Cytonn Report: Summary of KMRC Statement of Comprehensive Income |
|||
|
|
FY'2023 |
FY'2024 |
y/y Change |
|
REVENUE |
|
|
|
|
Interest Income |
2,400.7 |
3,214.9 |
0.3 |
|
Interest expense |
(1,016.1) |
(1,055.7) |
0.0 |
|
Net interest income |
1,384.6 |
2,159.2 |
0.6 |
|
EXPENSES |
|
|
|
|
Net movement in expected credit losses |
(1.6) |
1.1 |
1.7 |
|
Operating and adminstration expenses |
(279.9) |
(317.5) |
0.1 |
|
Depreciation and amortisation expenses |
(27.7) |
(24.8) |
(0.1) |
|
Total Expenses |
(309.2) |
(341.2) |
0.1 |
|
Net profit before income tax |
1,075.5 |
1,818.0 |
0.7 |
|
Income tax expense |
(227.7) |
(495.9) |
1.2 |
|
PROFIT AFTER TAX |
847.8 |
1,322.1 |
0.6 |
Source: KMRC
The table below shows a summary of KMRC’s balance sheet for FY’2023 and FY’2024;
Figures in Kshs mn Unless Stated Otherwise
|
Cytonn Report: Summary of KMRC Statement of Financial Position |
|||
|
|
FY'2023 |
FY'2024 |
y/y Change |
|
Assets |
|
|
|
|
Loan and Advances |
8,405.5 |
11,888.6 |
41.4% |
|
Cash and Cash equivalents |
11,891.4 |
14,860.5 |
25.0% |
|
Other Assets |
5,660.2 |
5,572.6 |
(1.5%) |
|
Total Assets |
25,957.1 |
32,321.6 |
24.5% |
|
Liabilities |
|
|
|
|
Borrowings |
20,662.6 |
25,731.2 |
24.5% |
|
Debt securities in issue |
1,331.1 |
1,144.2 |
(14.0%) |
|
Lease Liabilities |
23.5 |
14.7 |
(37.6%) |
|
Other Liabilities |
417.0 |
593.4 |
42.3% |
|
Total Liabilities |
22,434.2 |
27,483.5 |
22.5% |
|
Capital Resources |
|
|
|
|
Share Capital |
1,808.4 |
1,808.4 |
0.0% |
|
Revenue reserves |
1,624.2 |
2,911.8 |
79.3% |
|
Other Revenues |
7.1 |
0.3 |
(95.9%) |
|
Statutory Reserve |
83.2 |
117.7 |
41.4% |
|
Total Capital |
3,522.9 |
4,838.2 |
37.3% |
|
Total Liabilities and Equity |
25,957.1 |
32,321.6 |
24.5% |
Source: KMRC
The key take-outs include:
- The profit after tax increased by 55.9% to Kshs 1.3 bn in FY’2024, from Kshs 847.8 mn in FY’2023 majorly attributable to a 33.9% increase in interest income to Kshs 3.2 bn in FY’2024 from Kshs 2.4 bn mn recorded in FY’2023. This was driven by an increase in lending activities with loans and advances to their customers reaching Kshs 11.8 bn in FY’2024 compared to Kshs 8.4 bn in FY’2023,
- The total expenses increased by 10.4% to Kshs 341.2 mn in FY’2024 from Kshs 309.2 mn recorded in FY’2023 mainly attributable to a 166.7% increase in net movement in expected credit losses to Kshs 1.1 mn in FY’2024 from Kshs (1.2) mn in FY’ 2023, coupled by a 13.5% surge in operating and administration expenses, and,
- Total assets increased by 24.5% in to Kshs 32.3 bn in FY’ 2024 from Kshs 25.9 bn in FY’ 2023 mainly attributable 41.4% increase in loans and advances to Kshs 11.9 bn in FY’ 2024 from Kshs 8.4 bn in FY’ 2023. Additionally, Cash and Cash equivalents increased by 25.0% to Kshs 14.9 bn in FY’ 2024 from Kshs 11.9 bn in FY’2023,
- The company borrowings increased by 24.5% to Kshs 25.7 bn in FY’ 2024 from Kshs 20.6 bn in FY’2023 as the lender aimed to improve its capacity to support higher lending, initially at Kshs 8.0mn to Ksh 10.5 mn a move that was effective February 2024 to boost mortgage uptake earlier in the year.
For a more comprehensive analysis, please see our KMRC FY’2024 Earnings Note.
- Real Estate Investments Trusts (REITs)
- Acorn Holdings Financial Performance FY’2024
Acorn Holdings released their FY’2024 financial results for the Acorn D-REIT and I-REIT, which invests in purpose-built student accommodation (PBSA). The Development Real Estate Investment Trust (D-REIT) finances the development of Purpose-Built Student Accommodation (PBSA) housing projects and later exit the projects to the Investment Real Estate Investment Trust (I-REIT) through legally bidding acquisition agreement. Rental incomes and other sources of income play a significant role in driving the investments and operations of the REITs.
Below is a summary of the Acorn’s I-REIT and D-REIT FY’2024 performances:
Figures in Kshs mn Unless Stated Otherwise
|
Cytonn Report: Income Statement |
||||||
|
|
Acorn I-REIT |
Acorn D-REIT |
||||
|
FY’2023 |
FY’2024 |
Change |
FY’2023 |
FY’2024 |
Change |
|
|
Rental Income |
722.3 |
1081.6 |
49.7% |
324.5 |
181.7 |
(44.0%) |
|
Income from Other Sources |
2.2 |
8.6 |
294.3% |
6.8 |
0.0 |
(100.0%) |
|
Total operating income |
724.8 |
1101.2 |
51.9% |
728.0 |
1490.0 |
104.7% |
|
Operating Expenses |
384.7 |
438.6 |
14.0% |
366.2 |
337.3 |
(7.9%) |
|
Finance costs |
(127.5) |
(440.4) |
245.6% |
(0.3) |
(0.3) |
14.2% |
|
Profit Before Tax |
396.1 |
555.6 |
40.3% |
71.6 |
839.9 |
1073.8% |
|
Basic EPS (Kshs) |
1.2 |
1.7 |
39.0% |
0.3 |
3.1 |
972.4% |
Figures in Kshs bn Unless Stated Otherwise
|
Cytonn Report: Balance Sheet |
||||||
|
|
Acorn I-REIT |
Acorn D-REIT |
||||
|
FY’2023 |
FY’2024 |
Change |
FY’2023 |
FY’2024 |
Change |
|
|
Total Assets |
9.2 |
11.1 |
20.9% |
11.5 |
15.4 |
33.7% |
|
Total Equity |
7.4 |
8.1 |
10.1% |
6.6 |
7.3 |
11.9% |
|
Total Liabilities |
1.8 |
3.0 |
65.8% |
4.9 |
8.0 |
62.8% |
Ratios summary for the I-REIT and D-REIT
|
Cytonn Report: Ratios Summary |
||||||
|
|
Acorn I-REIT |
Acorn D-REIT |
||||
|
FY’2023 |
FY’2024 |
Change |
FY’2023 |
FY’2024 |
Change |
|
|
ROA |
4.3% |
5.0% |
0.7% |
0.6% |
5.5% |
4.8% |
|
ROE |
5.4% |
6.8% |
1.5% |
1.1% |
11.4% |
10.4% |
|
Debt Ratio |
19.5% |
26.7% |
7.2% |
42.9% |
52.2% |
9.3% |
|
PBT Margin |
54.8% |
51.4% |
(3.5%) |
9.8% |
56.4% |
46.5% |
|
Annualized Rental Yield |
8.2% |
10.2% |
2.0% |
3.8% |
3.3% |
(0.5%) |
|
Distribution Per Unit |
77.1% |
38.0% |
(39.0%) |
98.3% |
109.7% |
11.6% |
|
Payout Ratio |
73.4% |
22.6% |
(50.8%) |
29.6% |
34.9% |
5.3% |
Key take outs include;
Acorn I-REIT
- The basic earnings per unit increased by 39.0% to Kshs 1.7 in FY’2024, from Kshs 1.2 recorded in FY’2023. This was mainly driven by a 40.3% increase in profit to Kshs 555.6 mn recorded in FY’2024, from Kshs 396.1 mn that was recorded in FY’2023, linked to a 49.7% increase in rental income coming in at Kshs 1.1 bn from 0.7 bn in FY’2023
- The current rental yield for the I-REIT increased by 2.0% points to 10.2% in FY’2024, from 8.2% in FY’2023 following an increase in the rental income and stable average occupancy levels of 89.7% for current properties in their portfolios.
- Total assets for the I-REIT increased by 20.9% to Kshs 11.1 bn in FY’2024 from Kshs 9.2 bn in FY’2023. This was mainly on the back of a 20.5% increase in investment property during the period, coming in at Kshs 10.6 bn from Kshs 8.8 bn in FY’2023. This was as a result of newer acquisitions during the period including Qwetu Aberdare Heights II at a valuation of Kshs 1.5 bn,
- The shareholder’s funds for I-REIT increased by 10.1% to Kshs 8.1 bn in FY’2024, from Kshs 7.4 bn in FY’2023. The I-REIT’s equity increase was as a result of; i) an increase in revaluation reserve at the end of the period by 49.0% to Kshs 942.1 mn in FY’2024 from 632.1mn in FY’2023 and, ii) increase trust capital by 6.8% to Kshs 7.0 bn from 6.5 bn. On the other hand, there was a slight 3.6 % decrease in retained earnings to Kshs 204.3 mn from Kshs 211.8 mn in FY’2023, and,
Acorn D-REIT
- The basic earnings per unit for the REIT increased by 972.4% to Kshs 0.3 in FY’2024, from Kshs 3.2 in FY’2023. This was mainly driven by a 1073.8% increase in total profit to Kshs 839.9 mn in FY’ 2024 from Kshs 71.6 mn in FY’ 2023.
- The total operating expenses for the D-REIT decreased marginally by 7.9% to Kshs 337.3 mn in FY’2024 from Kshs 366.2 mn in FY’2023, mainly driven by a 31.0% decrease in administrative expenses to Kshs 104.5 mn in FY’2024 from Kshs 151.4 mn in FY’2023, and,
- Total assets for the D-REIT increased by 33.7% to Kshs 15.4 bn in FY’2024, from Kshs 11.5 bn in FY’2023. The increase in assets was mainly backed by an increase in cash and cash equivalent which increased by 324.2% to Kshs 792.1 mn in FY’2024 from Kshs 186.7 mn in FY’2023.
- The D-REIT recorded 4.8%-point increase in ROA to 5.5% in FY’2024 from 0.6% in FY’2023. This is attributable to slightly higher returns on assets in FY’2024 compared to FY’ 2023. The ROE recorded a 10.4%-point increase to 11.4% in FY’2024 from 1.1% in FY’2023 which was mainly attributable to a 1,073.8% increase in total comprehensive profit to Kshs 839.9 mn in FY’ 2024 from Kshs 71.6 mn in FY’ 2023.
For a more comprehensive analysis, please see our Acorn I-REIT and D-REIT FY’2024 Earnings Note.
- Laptrust Imara I-REIT Financial Performance FY’2024
Laptrust released the FY’2024 financial results for the Imara I-REIT for the period ended 31st December 2024. The I-REIT was authorized by the Capital Markets Authority (CMA) on 1st November 2022. Laptrust Imara I-REIT holds several properties across the country including; Pension towers, CPF House, Metro Park, Freedom Heights mall, Freedom Heights serviced plot, Man apartments, and Nova Pioneer in Eldoret.
Below is a summary of the Laptrust Imara I-REIT’s FY’2024 Performance;
|
Figures in Kshs bn unless stated otherwise |
|||
|
Balance Sheet |
FY'2023 |
FY’2024 |
FY’2024/FY'2023 Change |
|
Total Assets |
7.3 |
6.7 |
(7.7%) |
|
Total Equity |
7.0 |
6.5 |
(7.6%) |
|
Total Liabilities |
0.3 |
0.3 |
(10.2%) |
|
Figures in Kshs mn unless stated otherwise |
|||
|
Income Statement |
FY'2023 |
FY’2024 |
FY’2024/FY'2023 Change |
|
Rental Income |
305.2 |
479.1 |
57.0% |
|
Income from Other Sources |
90.7 |
100.7 |
11.0% |
|
Operating Expenses |
176.4 |
296.6 |
68.1% |
|
Profit/Loss |
57.2 |
(204.3) |
(457.0%) |
|
Basic EPS (Kshs) |
0.2 |
(0.6) |
(457.0%) |
|
Figures in Kshs mn unless stated otherwise |
|||
|
Ratios Summary |
FY'2023 |
FY’2024 |
FY’2024/FY'2023 Change |
|
ROA |
0.8% |
(3.0%) |
(3.8%) |
|
ROE |
0.8% |
(3.2%) |
(4.0%) |
|
Debt Ratio |
4.2% |
4.1% |
(0.1%) |
|
PBT Margin |
18.8% |
(42.6%) |
(61.4%) |
|
Rental Yield |
4.5% |
7.7% |
3.2% |
Key take-outs include;
- The basic earnings per unit came in at Kshs (0.6) mn in FY’2024, a 457.0% decline from Kshs 0.2 mn recorded in FY’2023. The performance was driven by a 457.0% decline in net earnings to a loss of Kshs 204.3 mn in FY’2024 from Kshs 57.2mn recorded in FY’2023,
- Total operating expenses in FY’2024 for the REIT came in at Kshs 296.6 mn, 68.1% higher than the Kshs 176.4 mn recorded in FY’2023, attributed to Kshs 80.0 mn incurred in utility expenses, 65.2 mn in property expenses, and Kshs 151.4 mn in fund operating expenses.
- Total assets for the REIT stood at Kshs 6.7 bn in FY’2024, a 7.7% decrease from Kshs 7.3 bn recorded in FY’2023, comprising of Kshs 6.3 bn in investment property that saw a 7.7% decrease from Kshs 6.7 bn in FY’2023 attributable to a fair value adjustment of Kshs 558.18 mn, Kshs 0.2 bn in cash and cash equivalents, and Kshs 0.2 bn in trade and other receivables,
- The shareholder’s funds decreased by 7.6% to Kshs 6.5 bn from Kshs 7.0 bn in FY’2023, attributable to 6.9 bn in trust capital which recorded no change, and 272.9 mn in retained earnings which saw a 377.0% increase from 57.2 mn recorded in FY’2023, and,
For a more comprehensive analysis, please see our Laptrust Imara I-REIT FY’2024 Earnings Note.
- ILAM Fahari I-REIT Financial Performance FY’2024
|
Balance Sheet |
H1'2022 |
FY'2022 |
H1'2023 |
FY'2023 |
H1'2024 |
FY'2024 |
∆ Y/Y (FY’23/ FY’24) |
|
Values in Kshs bn unless stated otherwise |
|||||||
|
Total Assets |
3.7 |
3.6 |
3.6 |
3.5 |
3.4 |
3.7 |
5.8% |
|
Total Equity |
3.5 |
3.4 |
3.4 |
3.3 |
3.2 |
3.6 |
7.6% |
|
Total Liabilities |
0.1 |
0.2 |
0.2 |
0.2 |
0.1 |
0.1 |
(30.1%) |
|
Values in Kshs bn unless stated otherwise |
|||||||
|
Income Statement |
H1'2022 |
FY'2022 |
H1'2023 |
FY'2023 |
H1'2024 |
FY'2024 |
∆ Y/Y (FY’23/ FY’24) |
|
Rental Income |
0.2 |
0.4 |
0.2 |
0.3 |
0.1 |
0.3 |
(13.3%) |
|
Income from Other Sources |
0.0 |
0.0 |
0.0 |
0.1 |
0.0 |
0.1 |
4.4% |
|
Operating Expenses |
0.1 |
0.2 |
0.1 |
0.2 |
0.1 |
0.2 |
(2.5%) |
|
Profit/Loss |
0.1 |
(0.03) |
0.1 |
(0.0003) |
0.1 |
0.4 |
12,6631.0% |
|
Basic EPS |
0.5 |
(0.2) |
0.5 |
(0.002) |
0.3 |
2.1 |
12,6631.0% |
|
Ratios Summary |
H1'2022 |
FY'2022 |
H1'2023 |
FY'2023 |
H1 2024 |
FY'2024 |
∆ Y/Y (FY’23/ FY’24) % Points |
|
ROA |
2.3% |
(0.8%) |
2.4% |
(0.01%) |
1.6% |
10.3% |
(0.8%) |
|
ROE |
2.4% |
(0.8%) |
2.5% |
(0.01%) |
1.7% |
10.6% |
(0.9%) |
|
Debt Ratio |
4.0% |
5.3% |
4.9% |
4.7% |
4.3% |
3.1% |
(0.6%) |
|
PBT Margin |
51.2% |
(8.4%) |
48.4% |
(0.1%) |
38.4% |
128.5% |
(9.9%) |
|
Annualized Rental Yield |
10.3% |
9.8% |
12.7% |
11.6% |
10.2% |
9.2% |
(2.4%) |
The key take-outs include:
- The basic earnings per unit increased by 126,631.0% to come in at a gain of Kshs 2.1 bn in FY’2024, from a loss of Kshs 0.002 bn in FY’ 2023. The performance is attributed to an increase in ILAM Fahari’s comprehensive profit to a gain of Kshs 377.2 mn in FY’2024, from a loss of Kshs 0.3 mn recorded in FY’2023. This was mainly driven by a 274.2% Increase in total adjustment in fair value a gain of Kshs 249.6 mn realized in FY’2024 from a loss of Kshs 143.3 mn in FY’2023. Additionally, operating expenses declined by 2.5% to Kshs 220.3 mn in FY’2024 from Ksh 225.8 mn in FY’2023,
- Total earnings available for distribution for the period FY’2024 decreased by 23.6% to Kshs 113.6 mn, from the Kshs 148.8 mn recorded in FY’2023, primarily driven by an increase in fair value loss of investment property, which increased to Kshs 263.6 mn in FY’2024, from a loss of Kshs 149.0 mn realized in FY’2023,
- The REIT Manager recommended a first and final distribution of Kshs 54.3 mn in relation to FY 2024 amounting to 30 cents per unit. This translates to a dividend yield of 2.5% and an implied capitalization rate of 7.4%.
- Total assets increased by 5.8% to Kshs 3.7 bn in FY’2024, from Kshs 3.5 bn in FY’2023. This was primarily attributable to a 102.3% increase in investment securities to Kshs 357.6 mn in FY’2024, from Kshs 176.8 mn recorded in FY’2023,
- The shareholder’s funds increased by 7.6% to Kshs 3.6 bn in FY’2024, from Kshs 3.3 bn in FY’2023, following a revaluation reserve correction of Kshs 4.3 mn, which realized a 98.7% decrease from Kshs 319.36 mn revaluation recorded in FY’2023, and,
For a more comprehensive analysis, please see our ILAM Fahari I-REIT FY’2024 earnings note.
- The REITs registered positive returns of 3.3%,7.7%,9.2% and 1.6% for Acorn I-REIT, Fahari I-REIT, Laptrust Amara IREIT and Acord D-REIT respectfully. Acorn D-REIT registered the lowest yield due to reduction in the rental income by 44.0% to 181.7 bn in 2024 from 324.5 bn in 2023 majorly attributable to the sale of two residential properties Qwetu Hurlingham and Qwetu Aberdare Heights II. On average, REITS yields came in at 5.5% showing low returns as compared to other assets. The chart below shows the comparison of REITs yield performance versus other assets.
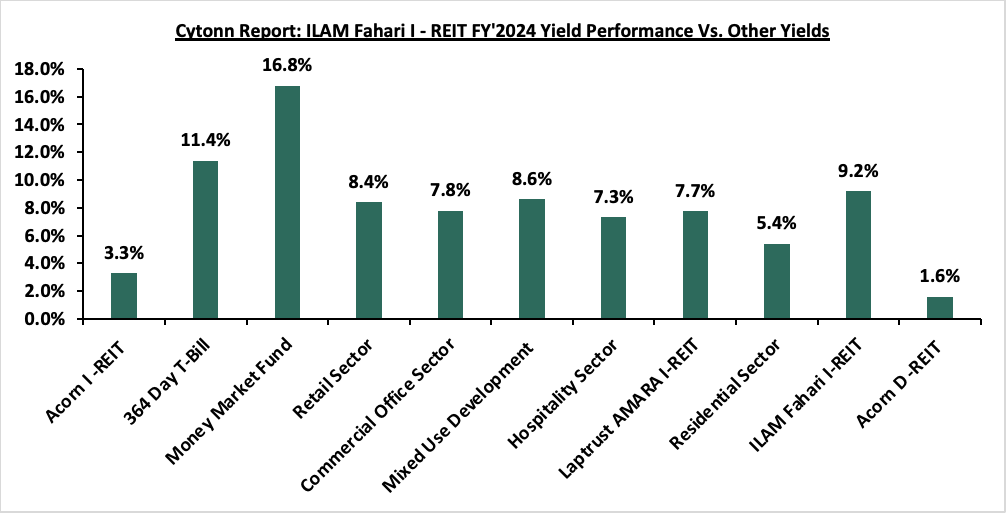
Source:Cytonn Research
On the Unquoted Securities Platform, Acorn D-REIT and I-REIT traded at Kshs 25.4 and Kshs 22.2 per unit, respectively, as per the last updated data on 21st March 2025. The performance represented a 27.0% and 11.0% gain for the D-REIT and I-REIT, respectively, from the Kshs 20.0 inception price. The volumes traded for the D-REIT and I-REIT came in at Kshs 12.8 mn and Kshs 35.6 mn shares, respectively, with a turnover of Kshs 323.5 mn and Kshs 791.5 mn, respectively, since inception in February 2021. Additionally, ILAM Fahari I-REIT traded at Kshs 11.0 per share as of 21st March 2025, representing a 45.0% loss from the Kshs 20.0 inception price. The volume traded to date came in at 138,600 shares for the I-REIT, with a turnover of Kshs 1.5 mn since inception in November 2015.
REITs offer various benefits, such as tax exemptions, diversified portfolios, and stable long-term profits. However, the ongoing decline in the performance of Kenyan REITs and the restructuring of their business portfolios are hindering significant previous investments. Additional general challenges include:
- Insufficient understanding of the investment instrument among investors leading to a slower uptake of REIT products,
- Lengthy approval processes for REIT creation,
- High minimum capital requirements of Kshs 100.0 mn for REIT trustees compared to Kshs 10.0 mn for pension funds Trustees, essentially limiting the licensed REIT Trustee to banks only
- The rigidity of choice between either a D-REIT or and I-REIT forces managers to form two REITs, rather than having one Hybrid REIT that can allocate between development and income earning properties
- Limiting the type of legal entity that can form a REIT to only a trust company, as opposed to allowing other entities such as partnerships, and companies,
- We need to give time before REITS are required to list – they would be allowed to stay private for a few years before the requirement to list given that not all companies maybe comfortable with listing on day one, and,
- Minimum subscription amounts or offer parcels set at Kshs 0.1 mn for D-REITs and Kshs 5.0 mn for restricted I-REITs. The significant capital requirements still make REITs relatively inaccessible to smaller retail investors compared to other investment vehicles like unit trusts or government bonds, all of which continue to limit the performance of Kenyan REITs.
We expect Kenya’s Real Estate sector to remain on a growth trend, supported by: i) demand for housing sustained by positive demographics, such as urbanization and population growth rates of 3.8% p.a and 2.0% p.a, respectively, against the global average of 1.7% p.a and 0.9% p.a, respectively, as at 2023,, ii) activities by the government under the Affordable Housing Program (AHP) iii) heightened activities by private players in the residential sector iv) increased investment by local and international investors in the retail sector. However, challenges such as rising construction costs, strain on infrastructure development (including drainage systems), high capital requirements for REITs, and existing oversupply in select Real Estate sectors will continue to hinder the sector’s optimal performance by limiting developments and investments.
The private sector contributes significantly to Kenya's economic growth, with increased access to credit driving real GDP expansion. Credit availability is essential for businesses to expand, innovate, and stay competitive. Recent data from the Central Bank of Kenya (CBK) shows that credit to the private sector contracted by 1.4% as of December 2024, reflecting the impact of exchange rate valuation effects on foreign currency-denominated loans due to the Shilling's appreciation, along with decreased demand driven by high lending interest rates. As the government aims to reduce its fiscal deficit, fostering a supportive environment for private sector growth, especially for micro, small, and medium enterprises (MSMEs), will be crucial for increasing revenue collection. Achieving this requires policy reforms to strengthen the credit market and the introduction of sector-specific funds to drive business growth in key industries like finance, agriculture, manufacturing, and transport. Compared to developed economies, Kenya's private sector faces limited credit access, relying heavily on commercial banks with minimal availability of alternative financing options such as venture capital, equity financing, or government-backed credit programs. Banks continue to be the primary source of business credit, supplying a total Kshs 3.9 trillion extended to the private sector as of December 2024, 81.2% of the total extended to the sector (inclusive of microfinances and SACCOs), with the highest allocations directed towards trade (17.6%), manufacturing (15.0%), and private households (14.8%).
In 2023, Kenya’s domestic credit to the private sector by banks to GDP ratio stood at 31.6%, indicating Kenya must enhance credit access for the private sector while also broadening the range of available credit sources to reduce its heavy dependence on the banking sector. Diversifying credit options will strengthen the support for businesses and improve overall financial resilience.
We have been tracking the evolution of Kenya’s private sector credit growth and below are the most recent topicals we have done on the subject:
- The State of Credit Availability in Kenya’s Private Sector - In September 2024, we highlighted Kenya’s state of lending to the private sector and gave our recommendations on what can be done to improve credit access to the private sector,
- The Hustler Fund- In December 2022, we highlighted the Financial Inclusion Fund, dubbed the “Hustler Fund” launched on 30th November 2022, aimed at improving credit access to citizens at the bottom of the pyramid who have often struggled to obtain affordable credit,
- Kenya’s Credit Reference Bureau Framework- Released in November 2022, this topical sheds more light on the Credit Reference Bureau (CRB) Framework in Kenya following the announcement by the Central Bank of Kenya that it had updated the Credit Information Sharing Framework in November 2022, which mandated the Credit Reference Bureaus (CRBs) not to use negative credit scores as the only reason to deny credit, and recommended the fast implementation of the risk based pricing model by commercial banks,
- Kenya’s Cost of Credit- Released in January 2022, the topical shed more light on Kenya’s high cost of credit remains with the big banks charging a higher cost of credit in comparison to smaller banks owing to their strong pricing power based on a wide distribution network, multiple services and well- established brands.
In this week’s topical, we shall focus on the status of Kenya’s private sector credit growth, highlighting the evolution and current state of lending to the private sector. We will provide specific recommendations on measures that can be implemented to improve credit access to the private sector. We shall do this by looking into the following:
- Introduction,
- The evolution of Kenya’s Private sector credit,
- Factors influencing private sector credit growth,
- Role of Government and its Impact on Private Sector Credit Availability
- Comparative analysis, and,
- Conclusion and Key consideration to improving private sector credit performance in Kenya
Section I: Introduction
The private sector comprises the segment of the economy operated and owned by individuals, partnerships, and corporations, rather than the government. Private sector credit refers to financial resources extended to these businesses by institutions other than central banks. This includes loans, trade credits, and non-equity securities that come with repayment obligations. In Kenya, primary providers of private sector credit include commercial banks, capital markets, SACCOs, microfinance institutions, and insurance companies.
Kenya's private sector is a key contributor to economic growth and job creation and is mainly composed of small and medium-sized enterprises (SMEs), which account for 90.0% of all private businesses and employ approximately 88.0% of the workforce. However, SMEs and informal enterprises often face significant difficulties in accessing credit due to banks' high-risk perceptions and the elevated costs of borrowing. These challenges have restricted business growth and reduced competitiveness. Unlike developed economies, where only 40.0% of business financing is sourced from banks and 60.0% from capital markets, Kenyan businesses are heavily reliant on banks, with 95.0% of their funding coming from this source and just 5.0% from capital markets, according to the World Bank. This reflects the limited availability of alternative financing options in the country.
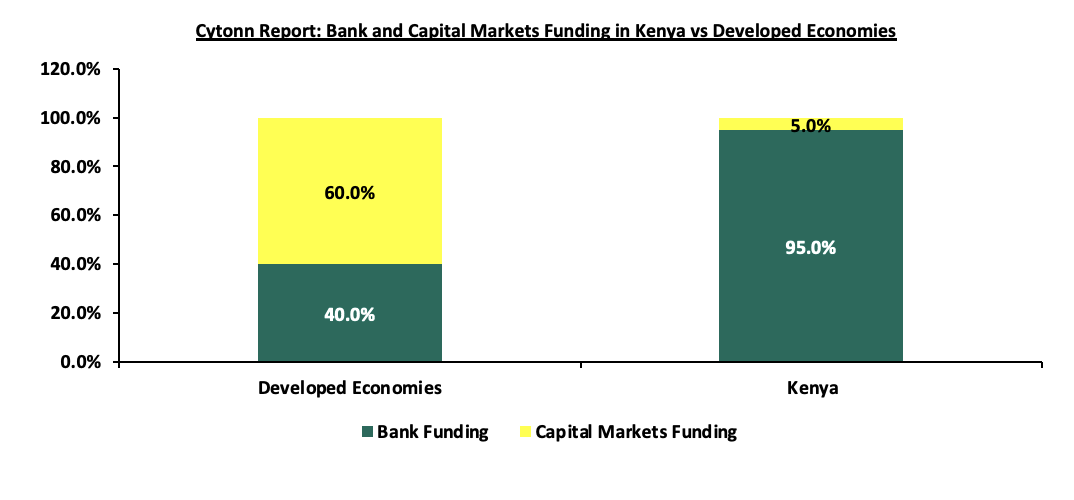
Section II: The evolution of Kenya’s Private sector credit
- Private sector credit Growth
Over the last five years, there has been consistent growth in private sector lending, with the total credit extended to the private sector by banks increasing at a 5-year CAGR of 6.5%, to Kshs 3.9 tn in December 2024 from Kshs 2.8 tn in December 2020, in line with the relative economic growth averaging at 4.8% for the last 5 years. The graph below shows the cumulative private credit over the period under review from the banking sector;
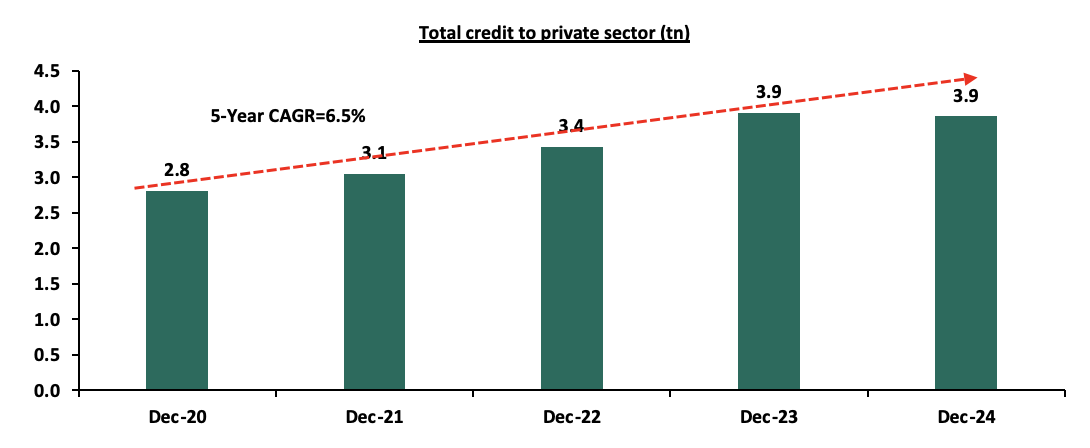
Source: Central Bank of Kenya
The banking sector remains the dominant lender in Kenya's private sector, accounting for 81.2% of total private sector credit equivalent to Kshs 3.9 trillion as of December 2024. SACCOs and microfinance institutions provided the remaining 18.8%, equivalent to Kshs 0.9 trillion. Notably, the contribution from SACCOs and microfinance has been gradually increasing, rising by 1.9% points from 16.9% in December 2023. As of December 2024, private households received the largest share of private sector credit at Kshs 1,317.4 billion, representing 34.1% of the total Kshs 3,857.7 billion extended. Within the banking sector, the trade sector attracted the most credit, amounting to Kshs 678.8 billion or 16.9% of total bank lending. This was followed by the manufacturing sector and private households, which received 15.0% and 14.8% of total bank credit, respectively.
Year-on-year, the private households sector saw the highest credit growth, expanding by 9.2% to Kshs 572.3 billion from Kshs 524.1 billion in December 2023. The mining and quarrying sector also experienced notable decline, with credit decreasing by 22.7% to Kshs 20.1 billion from Kshs 26.0 billion over the same period. The graph below illustrates the cumulative private sector credit over the past four years, comparing contributions from banks, SACCOs, and microfinance institutions.
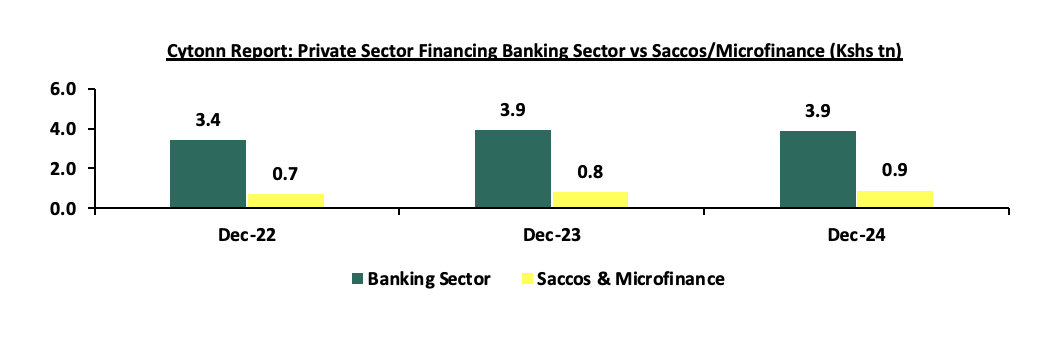
Source: Central Bank of Kenya
Private sector credit growth from the banking sector has been on an downward trajectory in 2024, contracting by 1.4% in the 12-months to December 2024 compared to 13.9% in December 2023.This decline is mainly due to the reduced borrowing capacity of businesses and households, driven by higher interest rates seen in 2024 and the lower disposable income. To combat inflation and stabilize the currency, the Central Bank of Kenya (CBK) adopted for a tighter monetary policy, increasing the Central Bank Rate (CBR) by 50 basis points to 13.00% in February 2024, from 12.50%. The rate was subsequently maintained at 13.00% during the CBK's April and June meetings. As a result, borrowing costs rose, making loans more expensive and reducing demand. However, since August, CBK’s actions has since been reversed with the aim of spurring the growth of the economy, by lowering CBR Rates to present 10.75% in February 2025, a total of 225.0 bps from 13.00% in June 2024. This reduction in the CBR rates will release additional liquidity to banks.
Additionally, in February 2025, CBK reduced the Cash Reserve Ratio (CRR) by 100.0 basis points to 3.25% from 4.25% in order to compliment the lowering of CBR by releasing additional liquidity to the banks. This is expected to have increased liquidity available to commercial banks for lending to the private sector, and thus support growth of credit to the sector. Credit contraction was primarily driven by sectors such as Mining and Quarrying, Finance and Insurance, Other activities, and Manufacturing, which recorded year-on-year decline rates of 22.7%, 21.2%, 18.1%, and 9.4%, respectively. On the other hand, Private households, Agriculture, Consumer durables sector and Trade sectors experienced growth in credit uptake, with year-on-year growth of 9.2%,5.2%,3.3% and 2.3%, respectively. Additionally, the continued rise in gross non-performing loans (NPLs) has led to increased caution among lenders in specific sectors. Elevated NPL levels have heightened the risk profile for banks, with total gross NPLs reaching Kshs 672.6 billion in December 2024, representing 8.3% increase from Kshs 621.3 billion in December 2023. As such, despite the notable decrease in the CBR, banks have been reluctant in lowering their lending rates, coming in at 16.4% as of February 2025, which has necessitated the CBK to take up measures to lead banks into lowering their lending rates. The table below shows the sectoral credit uptake growth on y/y and year-to-date basis from the banking sector:
|
Cytonn Report: Sectoral Credit Uptake (Kshs bn) |
|||||
|
Sector |
Dec-23 |
Jan-24 |
Dec-24 |
Last 12 Months Change (%) |
YTD change (%) |
|
Private households |
524.1 |
552.8 |
572.3 |
9.2% |
3.5% |
|
Agriculture |
141.8 |
150.9 |
149 |
5.1% |
(1.3%) |
|
Consumer durables |
415.5 |
417.1 |
429.2 |
3.3% |
2.9% |
|
Trade |
663.4 |
667.6 |
678.8 |
2.3% |
1.7% |
|
Transport & communication |
361.4 |
352 |
367.2 |
1.6% |
4.3% |
|
Real estate |
452.5 |
457.5 |
458.4 |
1.3% |
0.2% |
|
Business services |
214.8 |
217.5 |
205.1 |
(4.5%) |
(5.7%) |
|
Building and construction |
143.3 |
136.4 |
134.5 |
(6.1%) |
(1.4%) |
|
Manufacturing |
636.7 |
644.1 |
577.1 |
(9.4%) |
(10.4%) |
|
Other activities |
142.7 |
141.1 |
116.8 |
(18.1%) |
(17.2%) |
|
Finance & insurance |
189.1 |
159.1 |
149.1 |
(21.2%) |
(6.3%) |
|
Mining and quarrying |
26 |
24.4 |
20.1 |
(22.7%) |
(17.6%) |
|
Total credit growth |
3911.3 |
3920.5 |
3857.6 |
(1.4%) |
(1.6%) |
Source: Central Bank of Kenya
Kenya's private sector credit growth has remained subdued even after the interest rate cap was removed in November 2019. Although the interest rate cap was initially introduced to regulate lending rates, it led to a contraction in credit supply as banks faced reduced profit margins in a more challenging lending environment. However, with expectations for the shilling to remain strong and inflationary pressures in check, the private sector credit growth is expected to improve by the end of 2025. Additionally, the CBK's move to reduce the central bank rate by 225.0 basis points to 10.75% during its February 2025 meeting from 13.0% in June 2024, combined with the expected gradual easing of monetary policy, and a further decrease in the CRR, is likely to encourage private sector borrowing. With lower interest rates, both businesses and households are expected to access more affordable credit, leading to a rebound in private sector credit growth and offsetting some of the slowdown observed in the first half of the year of 2024. The chart below shows the movement of the private sector credit growth:
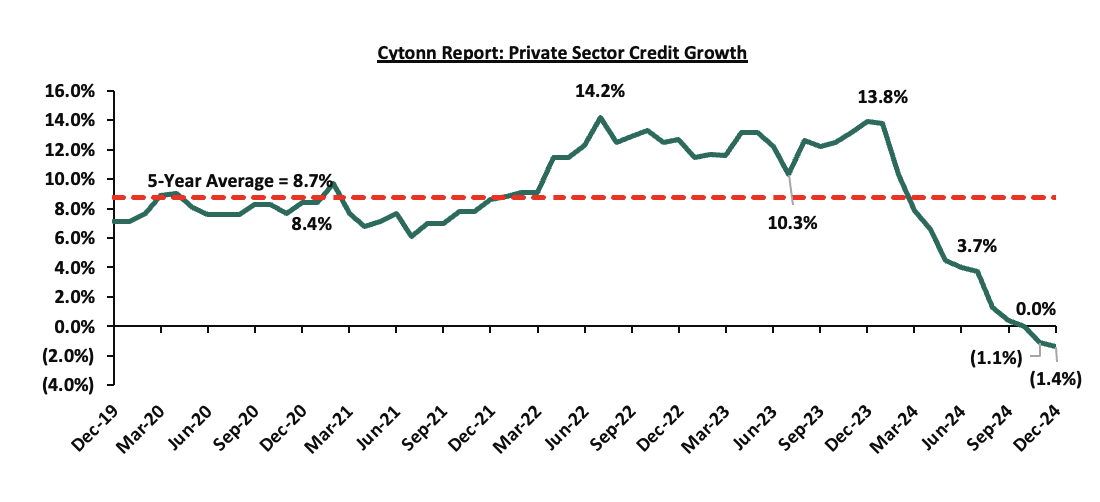
Source: Central Bank of Kenya
Section III: Factors influencing private sector credit growth
Private sector credit uptake is influenced by a number of factors which include;
- Interest rates – Interest rates set by central banks and financial institutions play a significant role influencing the credit market. On the demand side, higher interest rates increase both borrowing costs and debt servicing expenses, limiting the capacity of businesses and individuals to take on additional credit. By February 2025, the average lending rate stood at 16.4%, reflecting an increase of 0% points from 15.9% in February 2024. The Central Bank of Kenya's (CBK) decision to raise the CBR by 50 basis points to 13.00% in February 2024 and maintain it in subsequent meetings until August 2024 tightened liquidity, prompting commercial banks to raise lending rates to cover the increased cost of funds. However, with the CBK lowering the CBR by 50 basis points to 10.75% in February 2025 and further gradual rate cuts anticipated, borrowing conditions are expected to ease, potentially stimulating credit growth in the coming months.
- Elevated Credit Risk which contributes to high risk premiums – The high-risk perception prompts lenders to incorporate risk premiums into the interest rates they charge on loans resulting in higher borrowing costs for individuals and businesses seeking credit. The risk premium acts as a cushion for lenders against potential losses, reflecting the level of uncertainty and perceived risk associated with the borrower. Additionally, according to the Central Bank of Kenya (CBK), Credit risk remained elevated with Gross Non-Performing Loans (NPLs) to Gross Loans Ratio standing at 16.4% at the end of December 2024, a 1.6% points increase from 14.8% recorded at the end of December 2023, attributable to a lower increase in gross NPLs of 0.6% compared to an increase in gross loans of 1.8%. The graph below shows the movement for the years under review;
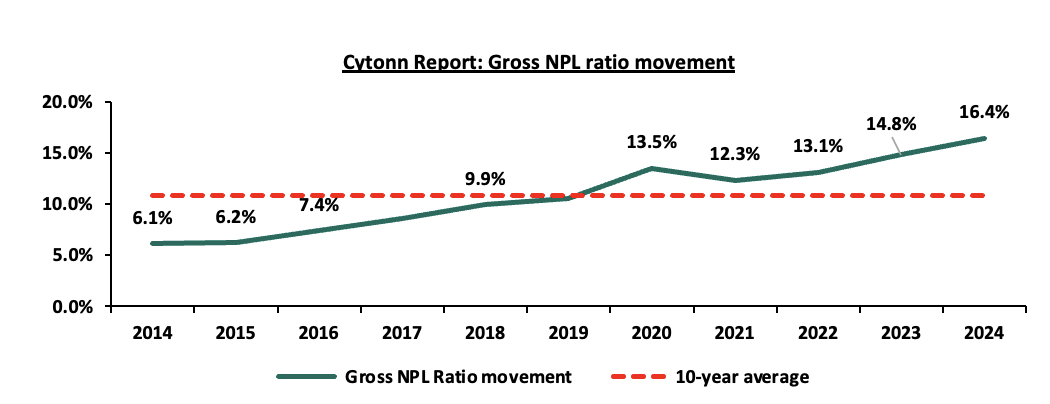
|
Domestic Public Debt by Holder (Percent) |
||||||||
|
|
Dec-18 |
Dec-19 |
Dec-20 |
Dec-21 |
Dec-22 |
Dec-23 |
Dec-24 |
Mar-25 |
|
Banking Institutions |
54.2% |
54.3% |
52.8% |
50.2% |
46.8% |
46.1% |
45.1% |
45.3% |
|
Insurance companies |
6.5% |
6.4% |
6.4% |
6.8% |
7.4% |
7.2% |
7.3% |
7.2% |
|
Parastatals |
6.7% |
6.5% |
5.7% |
5.6% |
6.1% |
5.5% |
5.6% |
6.1% |
|
Pension funds |
28.2% |
28.6% |
30.3% |
31.3% |
33.3% |
29.9% |
28.9% |
28.4% |
|
Other investors |
4.4% |
4.2% |
4.7% |
6.0% |
6.4% |
11.3% |
13.2% |
13.1% |
- Technological Advancements – Technological innovations, including Fintech solutions and mobile banking systems, have significantly enhanced digital lending. Mobile money platforms, in particular, have made credit more accessible, especially for individuals without conventional banking relationships, fostering a more inclusive financial landscape. These advancements highlight the growing role of technology in shaping the future of credit accessibility in Kenya. As digital financial services continue to advance, an increasing number of businesses and individuals can secure the funding they need for growth, ultimately contributing to the country's overall economic development.
- Inflation rates – Rising inflation led the Central Bank of Kenya to implement a tighter monetary policy, driving up borrowing costs for both businesses and households. As lending rates increased, access to credit became more expensive, discouraging many from taking on new loans. This resulted in a slowdown in private sector credit growth, particularly in industries such as manufacturing and trade, which faced challenges in financing operations and investments due to higher debt servicing costs.
However, the Monetary Policy Committee's interventions effectively brought inflation down to 3.5% in February 2025, within the target range of 2.5%–7.5%, compared to a high of 9.2% in February and March 2023 Additionally, the Purchasing Managers Index (PMI) rose to 50.6 in February 2025, up from 49.8 in January 2024, signalling an improving business environment. With inflationary pressures easing, a more favourable credit environment is expected, encouraging businesses and households to seek financing as they anticipate lower interest rates.
- Over-reliance on the banking sector – Historically, banks have played a dominant role in providing credit to the private sector, accounting for 95.0% of total lending as of December 2024. This heavy reliance on banks has resulted in a lack of diversification in funding sources for businesses. To foster a more resilient and well-rounded credit ecosystem, it is crucial to explore alternative financing options such as capital markets and non-banking financial institutions. To mitigate the systemic risks associated with overdependence on the banking sector, the government should implement strategies to strengthen other financial sectors, including leasing, venture capital funds, development finance institutions, and bond and equity markets. Creating an enabling environment for these alternatives would promote a more balanced and inclusive approach to credit access, and,
- High cost of credit –Borrowing comes with additional overhead costs beyond interest charges, including bank fees, legal fees, government levies, valuation fees, and insurance, all of which are the borrower's responsibility. These extra expenses raise the overall cost of credit, making borrowing more expensive and ultimately reducing demand for credit within the private sector.
Section IV: Role of Government and its Impact on Private Sector Credit Availability
Impact of the Government on the Private Sector
The government of Kenya plays a crucial role in shaping the environment for private sector credit availability. The following are some of the ways in which the Kenyan Government impacts the flow of credit to the private sector;
- Government's Fiscal Policy and Debt Management
The government’s fiscal policy, particularly its domestic borrowing practices, has a profound effect on private sector credit availability. Heavy government borrowing from the domestic market competes with private sector borrowers for available credit, leading to a crowding-out effect. This occurs when increased government borrowing reduces the funds available for businesses, thereby driving up interest rates and limiting access to affordable credit. As a result, private sector investments are constrained, and financial market stability may be threatened. According to the Central Bank of Kenya (CBK), gross government domestic debt has grown at a 10-year Compounded Annual Growth Rate (CAGR) of 14.4%, reaching Kshs 5.9 tn in 2024 from Kshs 1.5 tn in 2015. The chart below shows the steady growth of gross domestic debt over this period;
Source: Central Bank of Kenya (CBK)
*data as of 14 th March, 2025
Additionally, as of 14th March 2025 commercial banks held an average of 45.3% of this domestic debt, heightening the risk of crowding out the private sector, as banks prefer lending to the government over private businesses, especially during downturn economic times. The chart below highlights the distribution of government debt holdings across various institutions;
Source: Central Bank of Kenya (CBK)
*data as of 14 th March, 2025
**Others include insurance companies, parastatals and retail holders
- Regulatory Framework
The regulatory framework plays a crucial role in shaping credit availability. The CBK, through capital adequacy requirements and liquidity management rules, ensures that banks have enough funds to support private sector lending while maintaining stability. For instance, the recent proposal by the National Treasury to review the minimum core capital requirement for commercial banks to Kshs 10.0 bn, up from the current Kshs 1.0 bn, is expected to strengthen the resilience of banks, enabling them to better absorb risks and extend more credit to the private sector. However, this could also reduce competition if smaller banks struggle to meet the new requirement, potentially limiting credit options for some businesses in the short term.
Additionally, the integration of Credit Reference Bureaus (CRBs) has allowed lenders to assess the creditworthiness of businesses and individuals, improving access to credit while managing risk exposure. By tailoring credit assessments to individual borrower profiles, the regulatory framework promotes a more informed lending environment, benefiting both banks and the private sector.
- Monetary Policy
The Central Bank of Kenya’s monetary policy, particularly its Central Bank Rate (CBR), directly influences borrowing costs. The relationship between the Central Bank Rate (CBR) and the commercial bank's lending rates is crucial in understanding credit accessibility in Kenya's private sector. The CBR, set by the Central Bank of Kenya, acts as a benchmark for determining the cost of borrowing in the market, and fluctuations in this rate tend to influence the interest rates that commercial banks apply on loans.
The Central Bank Rate (CBR) remained steady at 10.5% from July 2023 through November 2023. However, in December 2023, the CBR was adjusted upward by 200 basis points to 12.5%, indicating a tightening of monetary policy. By February 2024, the CBR further increased by 50 basis points to 13.0%, a rate it maintained through July 2024. Simultaneously, from February 2024 to February 2025, the average lending rates by commercial banks showed a consistent upward trend, to 16.4% by February 2025 from 15.9% recorded in February 2024. This increase in lending rates reflects the rising cost of credit over the year. As the CBR increased, commercial banks adjusted their lending rates upwards, leading to higher borrowing costs for the private sector. This rise in interest rates has had a direct impact on the private sector's ability to access credit, as higher costs may discourage businesses from taking out new loans for expansion or operations. The chart below shows the trend in commercial banks weighted average lending rates between February 2024 and February 2025;
Source: Central Bank of Kenya (CBK)
The steady increase in lending rates, coupled with the rise in the CBR, posed challenges for private sector credit growth. Higher borrowing costs constrained investment and expansion activities within the private sector, particularly for small and medium-sized enterprises (SMEs), which are more sensitive to interest rate changes. However, in a move signaling a gradual easing of monetary policy, the Central Bank of Kenya further lowered the Central Bank Rate (CBR) by 225.0 basis points to 10.75% during its February 2025 meeting from 13.0% in June 2024,influencing the rates to go down by 50 basis points to 16.4% February 2025 from 16.9% in June 2024.This reduction in the CBR is expected to support credit growth and ease financial pressures on borrowers, providing much-needed relief to businesses in the private sector.
- Initiatives placed by the government and CBK to promote private sector credit growth
Based on the importance on private sector contribution to GDP, the Central Bank of Kenya (CBK), in collaboration with other stakeholders, has implemented various measures ranging from licensing of new products, technological innovations and public education to promote credit growth in Kenya. Some of the initiatives include;
- Licensing of Innovative Financial Products – By facilitating the introduction of innovative lending solutions, investment tools, and financial products, the central bank has played a key role in broadening credit access for businesses and individuals. Notably, in October 2024, the Central Bank of Kenya (CBK) approved licenses for 27 additional Digital Credit Providers (DCPs), increasing the total number to 85, following the licensing of 7 DCPs in June 2024. This initiative aligns with CBK’s strategic commitment to enhancing credit availability in the private sector by fostering and expanding digital lending options.
- Diversifying Funding Strategies – Through incorporating alternative borrowing strategies, the government aims to reduce its reliance on domestic credit from commercial banks, and as a result, enhancing the ease of credit access to the private sector. Sourcing of alternative funding by the government mitigates the pressure on the local credit market, creating room for private sector entities to secure loans more easily. Notably, Eurobonds, as a form of commercial borrowing, have been a significant component of the government's debt strategy. However, by exploring concessional options, the government not only broadens its funding sources but also ensures a balance that is more conducive to a sustained economic growth,
- Boosting Liquidity in the Banking sector- In February 2025 the CBK reviewed the Cash Reserve Ratio to 3.25%, from the existing 4.25% to compliment lowering of the CBR rate. This adjustment is expected to release additional liquidity to banks and hence it’s expected to lower the cost of funds as well as the lending rates, and thus support growth of credit to the private sector.
- Empowering MSMEs through the Credit Guarantee Scheme (CGS) Regulation 2020 – MSMES, being one of the largest sectors in the private sector plays a vital role in the enhancing economic growth of the Country. The implementation of the Credit Guarantee Scheme (CGS) Regulation in 2020, facilitated 2,609 business access loans to MSMEs totalling Kshs 4.1 bn as of August 2022 surpassing its initial capital of Kshs 3.0 bn. Key to note, 60.0% of the beneficiaries were small enterprises, while micro and medium enterprises accounted for 25.0% and 15.0% respectively. Additionally, in celebration of the Hustler Fund's second anniversary, the government launched a new product for Small and Medium Enterprises (SMEs), targeting 2.0 bn beneficiaries with strong credit histories. The initiative aims to boost financial inclusion by providing tailored credit solutions to help SMEs grow and integrate into the formal banking sector. Complementing the Credit Guarantee Scheme, this product is expected to further support MSME growth and financial inclusion,
- Implementation of the Financial Inclusion Fund - The Financial Inclusion Fund, commonly known as the Hustler Fund, is a government-sponsored initiative aimed at providing low-income Kenyans with convenient access to credit through their phones. Launched in November 2022, the primary objective of the Hustler Fund is to make credit affordable to a significant portion of the population that has long been excluded from formal credit systems. The introduction of the Hustler Fund underscores the government's commitment to enhancing financial inclusion and expanding access to credit,
- Other government special Funds – Under the Public Finance Management Regulations, the government introduced various loan programs aimed at empowering women, youth, and persons with disabilities (PWDs), including the Youth Development Fund, Uwezo Fund, and Women Enterprise Fund. These initiatives are designed to expand credit access for marginalized and underserved groups, aligning with broader efforts to promote private sector credit growth by addressing financial barriers faced by these special groups.
Additionally, the banking system has put in place measures to aid private sector credit growth such as;
- Tailoring Credit with Risk-Based Pricing – The Central Bank of Kenya approved risk-pricing models for 22 out of the 38 commercial banks as a measure of tailoring loans to a customer’s financial profile while helping banks and other lenders to manage their risk exposure. The initiative has continued to increase credit accessibility to the private sector based on an individual financial profile in terms of borrowing and repayment history, and,
- Digital Transformation – Most Kenyan banks have embraced digital technologies, streamlining and expediting the loan application and approval processes. The implementation of user-friendly mobile and online platforms facilitates quicker access to credit, enhancing the efficiency of transactions for businesses and individuals. Banks such as KCB and NCBA partnered with Safaricom to offer the overdraft credit facility of Fuliza in increasing credit lending to SMEs. Additionally, KCB has the VOOMA app specifically targeting lending to small and medium enterprises.
Section V: Comparative analysis
According to the World Bank, Kenya’s domestic credit extended to the private sector outperformed majority of the Sub-Saharan countries. The Kenya’s domestic credit extended to private sectors as a percentage of the GDP came in at 31.6%, 1.8% points lower than the average Sub-Saharan domestic credit to private sectors lending which stood at 33.4% in the same period. Although Kenya outperformed majority of Sub-Saharan countries in credit extended to the private sector, the country still underperformed against developed economies. The graph below shows domestic credit extended to the private sector over the years and a comparison of Kenya’s performance against selected economies;
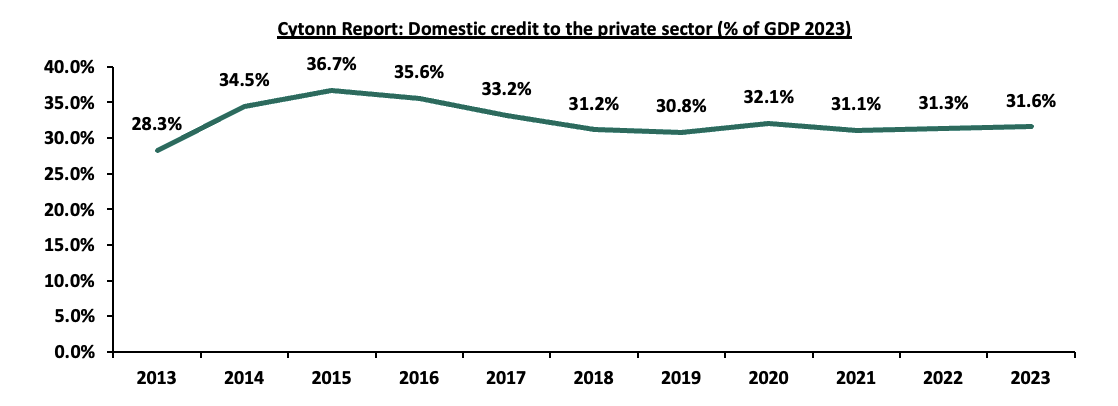
Source: World Bank
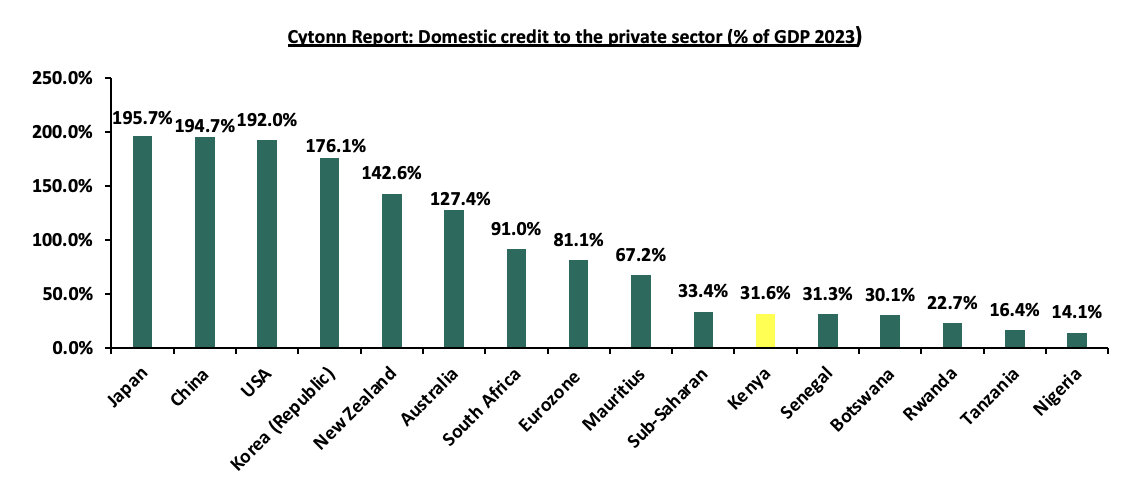
Source: World Bank
Different developed countries have adopted different measures in enhancing private sector credit growth. Some of the successful measures include:
- Project Finance Structuring-This financing method leverages a project’s own operating cash flow and assets to mitigate investment risks and secure funding at a lower cost. A notable historical example is China’s 1997 initiative, where Plantation Timber Products (Hubei) Ltd launched a USD 57.0 mn greenfield project to install modern medium-density fiberbroad plants in interior China. The International Finance Corporation (IFC) played a pivotal role by arranging USD 26.0 mn in syndicated loans, utilizing the limited-recourse nature of project finance. At the time, foreign commercial banks were hesitant to invest in China’s less-developed interior provinces, making this a pioneering effort.
- Universal Supervisory Body to Monitor Fund Disbursements- The United Kingdom’s British Business Bank (BBB) exemplifies this measure by overseeing government-backed funding programs such as the Enterprise Finance Guarantee Scheme (EFGS), the British Growth Fund (BGF), the Funding for Lending Scheme (FLS), and the Start Up Loans Scheme (SLS). The BBB ensures accountability and transparency in fund allocation, fostering trust among private sector participants and encouraging credit uptake.
Section VI: Conclusion and Key Considerations
The private sector is a significant contributor to the Kenyan GDP. However, credit availability remains a major hindrance for the sector’s growth. To offset the downside, the government of Kenya needs to adopt or emulate the funding model used by the developed economies in creating an enabling environment for two or more players to compete within the Kenyan credit market. Currently, the credit market is dominated by commercial banks while the Capital markets and other sources contribute the remaining 54.8% of funding to all businesses. Additionally, the government needs to adopt a consumer-centred approach for borrowing to encourage private sector credit demand. We believe that additional measures need to be implemented in order to promote private sector credit growth. Below are some of the initiatives that the government can adopt;
- Developing the capital markets to expand alternative financing options - The Kenyan credit market is largely dominated by commercial banks, leaving businesses with limited funding choices. Strengthening the bond and equity markets can offer long-term financing solutions for businesses. Regulatory improvements, tax incentives for investors, and awareness campaigns can encourage more companies to raise capital through these markets, reducing reliance on bank loans. Additionally, the government can promote fintech solutions and digital lending platforms to increase accessibility to credit.
- Enhancing financial inclusion and credit awareness - Many small businesses struggle to access credit due to a lack of financial literacy and poor credit histories. Nationwide financial literacy programs can equip businesses with the knowledge to manage credit effectively and improve their creditworthiness. The government, in collaboration with financial institutions, can also develop tools to help businesses understand their credit scores and improve their financial planning.
- Enhancing oversight on government-backed fund initiatives to promote transparency - Government-backed funds such as the Hustler Fund, Uwezo Fund and Youth Enterprise Development Fund play a crucial role in financing small businesses. However, their effectiveness depends on transparency and accountability. Establishing independent monitoring bodies to oversee fund distribution, regularly publishing reports on disbursements and setting clear eligibility criteria can enhance trust and efficiency in these programs.
- Encouraging sector-specific credit policies - Some industries, such as agriculture and manufacturing, require specialized financial products tailored to their unique needs. The government can work with financial institutions to develop sector-specific loan products with favorable terms, such as lower interest rates and longer repayment periods, to support key industries that drive economic growth.
- Strengthening credit guarantee schemes - Many businesses fail to secure loans due to a lack of collateral. Expanding credit guarantee schemes and partnering with financial institutions can help mitigate lender risk to provide loans to SMEs. The government can enhance existing guarantee programs that back a portion of the loans given to small businesses, reducing the perceived risk for lenders.
- Diversify Funding Sources Beyond Banks: To reduce the overreliance on banks for credit, it is essential to develop and expand access to capital markets. Encouraging businesses and individuals to explore alternative financing options, such as corporate bonds, venture capital, and equity financing, will improve financial flexibility and foster economic resilience.
The outlook for private sector growth in Kenya reflects a promising landscape marked by resilience, innovation and a proactive policy environment. The sector remains a cornerstone of economic progress, creating jobs, fostering entrepreneurship and driving innovation. While challenges such as limited credit access have persisted, recent macroeconomic developments signal a more favorable environment for growth. Recent monetary policy adjustments by the Central Bank of Kenya (CBK) have created a favorable environment for private sector credit growth. In February 2025, the CBK lowered the Central Bank Rate (CBR) to 10.75% from 11.25%, and a total of xx bps from a high of 13.00%, which has begun to reduce borrowing costs, making credit more accessible to the private sector. These measures, combined with stable inflation, currently at 3.5% and stable currency, are expected to improve the private sector credit growth. However, sustainable growth requires ongoing collaboration between the government, businesses, and stakeholders to address barriers, enhance infrastructure, and cultivate a conducive business environment. With strategic initiatives and a commitment to fostering inclusive growth, Kenya's private sector is poised to play a pivotal role in shaping the nation's economic success. we are of the opinion that the initiatives already put in place by the government to promote access to credit by the private sector coupled with creating an enabling operating business environment for alternative credit sources will come in handy in promoting credit growth in the private sector. We expect sustained growth in the lending to the private sector on the back of the existing policies aimed at enhancing credit uptake which in turn will contribute to country’s economic growth.
Disclaimer: The views expressed in this publication are those of the writers where particulars are not warranted. This publication, which is in compliance with Section 2 of the Capital Markets Authority Act Cap 485A, is meant for general information only and is not a warranty, representation, advice or solicitation of any nature. Readers are advised in all circumstances to seek the advice of a registered investment advisor

- Talk to us
- Kenya
- P.O Box 20695 - 00200, Nairobi, Kenya
- Cell +254709101200
- Tel +254709101200
- WhatsApp +254741676635
- United States
- +254709101200
- DOWNLOAD OUR APP
-


- Kenya
- 8th Floor, Pinetree Plaza, Kaburu Drive, Ngong Road, Nairobi, Kenya
- USA
- Suite 1150, 1775 Eye Street NW, USA, Washington DC 20006, USA
- Investments
- High Yield
- Private Equity
- Real Estate
- Real Estate
- RiverRun Estates
- Cytonn Towers
- The Ridge
- Taraji Heights
- The Alma