Jan 5, 2020
Economic Growth:
The country's Gross Domestic Product (GDP), adjusted for inflation, was subdued in 2019 having expanded by 5.6%, 5.6% and 5.1% in Q1’2019, Q2’2019, and Q3’2019, respectively, to record an average growth of 5.4% compared to 5.7%, 6.3%, and 6.0% in Q1’2018, Q2’2018 and Q3’2018, respectively, and averaging at 6.0%. The slower growth was as a result of:
- A slowdown in agricultural activities, which saw the sector record an average growth of 4.2% for the first 3 quarters of 2019, representing a 1.1% point decline from the 5.3% recorded in the same period of review in 2018. The slowdown in agriculture was as a result of delayed long rains, which curtailed agricultural production. In terms of sectoral contribution, agriculture remained the highest contributor averaging 22.6% over the same period, and,
- Decreased output in transport and electricity activities, which grew on average by 7.0% and 5.5%, respectively in the first 3 quarters of 2019, compared to the 8.6% and 7.6%, recorded in the same period of review in 2018. The electricity sector was subdued by insufficient long rains in the first and second quarters, while the transport sector was subdued by the rise in prices of fuel.
Analysis by sector showed that there was accelerated growth in the manufacturing sector, though its contribution to GDP recorded a 0.3% points decline to average 9.7% in the first three quarters of 2019 as compared to the 10.0% recorded in 2018. This has continued to raise concerns given that the Kenyan Government has singled it out as one of the key pillars to drive the economy in the Big 4 Agenda. The sector’s contribution is still way below the government’s target of increasing it to 15.0% of GDP by 2022, which in effect is expected to increase manufacturing sector jobs by more than 800,000 per annum over the next four years. For more information, see our Q3’2019 GDP Note.
Below is a table showing average projected GDP growth for Kenya in 2019; noteworthy being that the highest projection is by PNB Paribas at 6.1%, this is after the Central bank revised its projections down to 5.9% from 6.3%, citing the economy is not growing within its potential.
|
Kenya 2019 Annual GDP Growth Outlook |
|||||
|
No |
Organization |
Q1'2019 |
Q2'2019 |
Q3'2019 |
Q4'2019 |
|
1 |
PNB Paribas |
6.0% |
6.0% |
6.1% |
6.1% |
|
2 |
African Development Bank (AfDB) |
6.0% |
6.0% |
6.0% |
6.0% |
|
3 |
UK HSBC |
6.0% |
6.0% |
6.0% |
6.0% |
|
4 |
Central Bank of Kenya |
6.3% |
6.3% |
6.3% |
5.9% |
|
5 |
Citigroup Global Markets |
6.1% |
6.1% |
6.1% |
5.8% |
|
6 |
World Bank |
5.8% |
5.7% |
5.7% |
5.7% |
|
7 |
Euler Hermes |
5.7% |
5.7% |
5.7% |
5.7% |
|
8 |
Euro Monitor International |
5.9% |
5.9% |
6.3% |
5.6% |
|
9 |
International Monetary Fund (IMF) |
6.1% |
5.8% |
5.9% |
5.6% |
|
10 |
Focus Economics |
5.8% |
5.8% |
5.6% |
5.6% |
|
11 |
JP Morgan |
5.7% |
5.7% |
5.6% |
5.6% |
|
12 |
Oxford Economics |
5.6% |
5.6% |
5.6% |
5.6% |
|
13 |
Cytonn Investments Management Plc |
5.8% |
5.8% |
5.8% |
5.6% |
|
|
Average |
5.9% |
5.9% |
5.9% |
5.8% |
Kenya Shilling:
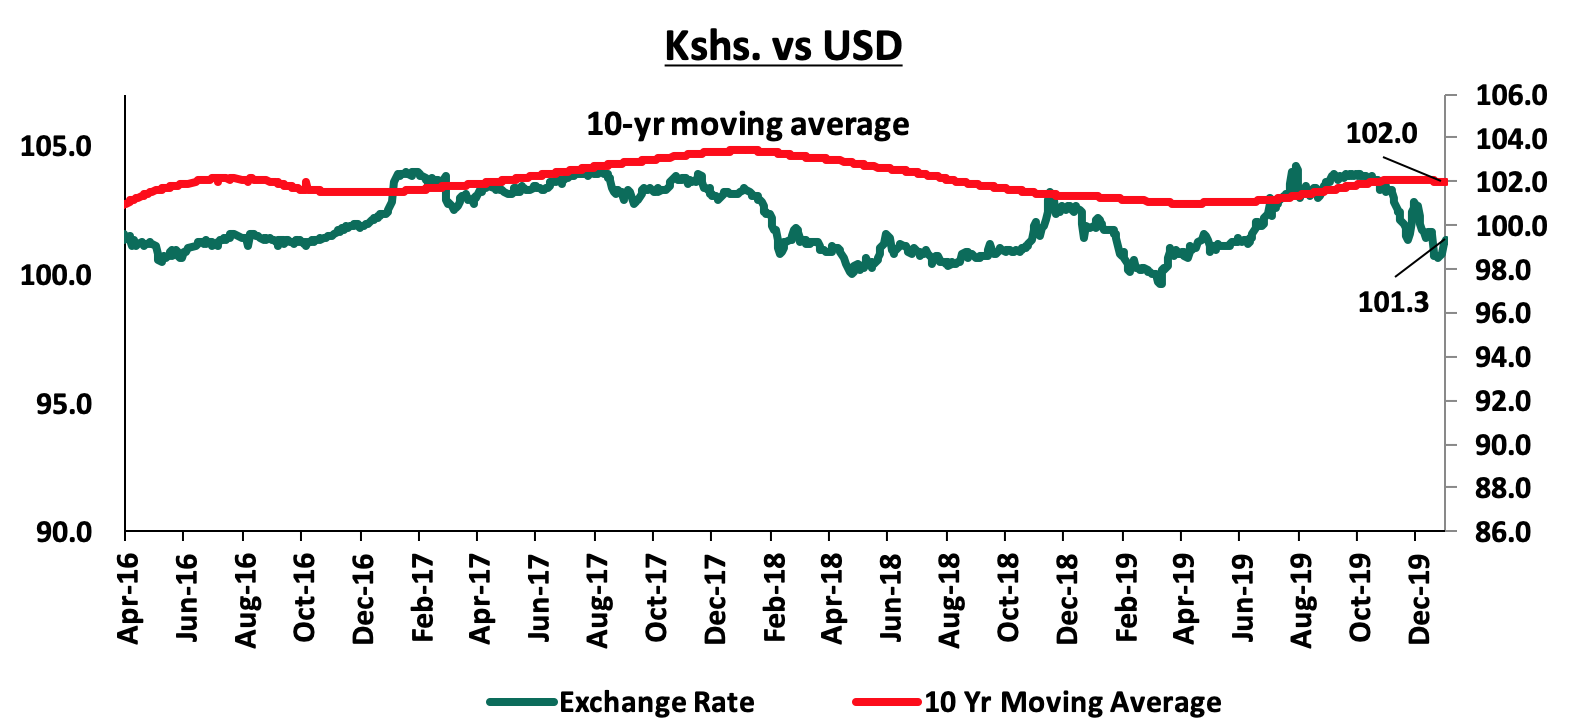
The Kenya Shilling gained by 0.5% against the US Dollar to close at 101.3 in 2019, compared to 101.8 at the end of 2018.

The shilling was supported by inflows of hard currency from remittances by Kenyan workers abroad and offshore investors. In our view, the shilling should remain relatively stable to the dollar in the short term, supported by:
- The narrowing of the current account deficit, with preliminary data indicating that Kenya’s current account deficit improved by 7.6% during Q3’2019, coming in at a deficit of Kshs 101.0 bn, from Kshs 109.3 bn in Q3’2018, equivalent to 8.2% of GDP, from 9.3% recorded in Q3’2018. This was mainly driven by the narrowing of the country’s merchandise trade deficit balance (a scenario where imports are greater than exports) by 6.7% and a rise in secondary income transfers (transfers recorded in the balance of payments whenever an economy provides or receives goods, services, income or financial items) by 4.3%. For more information see our Q3’2019 BOP Note,
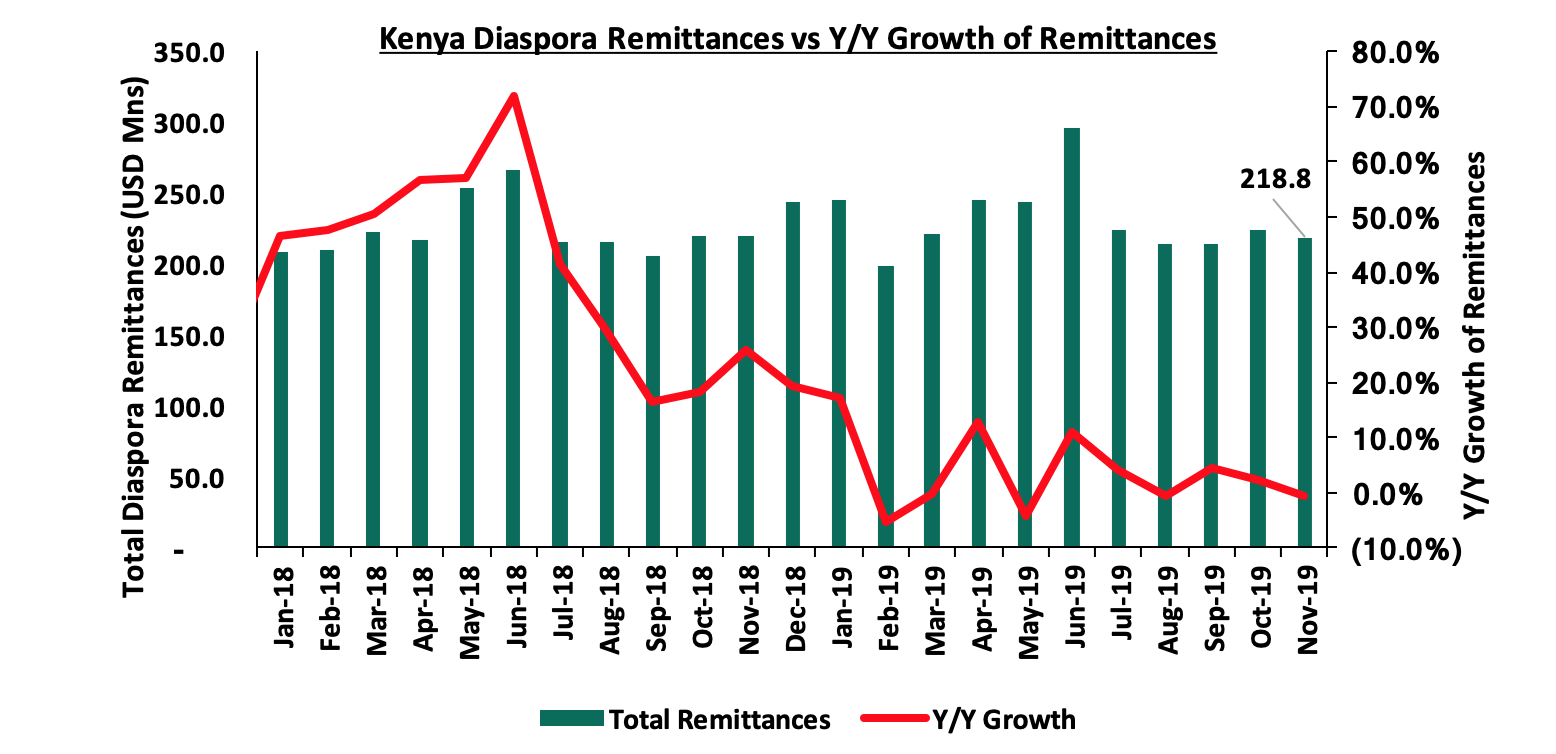
- Improving diaspora remittances, which stood at 218.8 mn in November 2019 and cumulatively increased by 5.0% in the 12-months to November 2019 to USD 2.8 bn, from USD 2.7 bn recorded in a similar period of review in 2018,

- Foreign capital inflows, with investors looking to participate in the equities market to take advantage of the cheap valuations in the market,
- CBK’s supportive activities in the money market, such as repurchase agreements and selling of dollars, and,
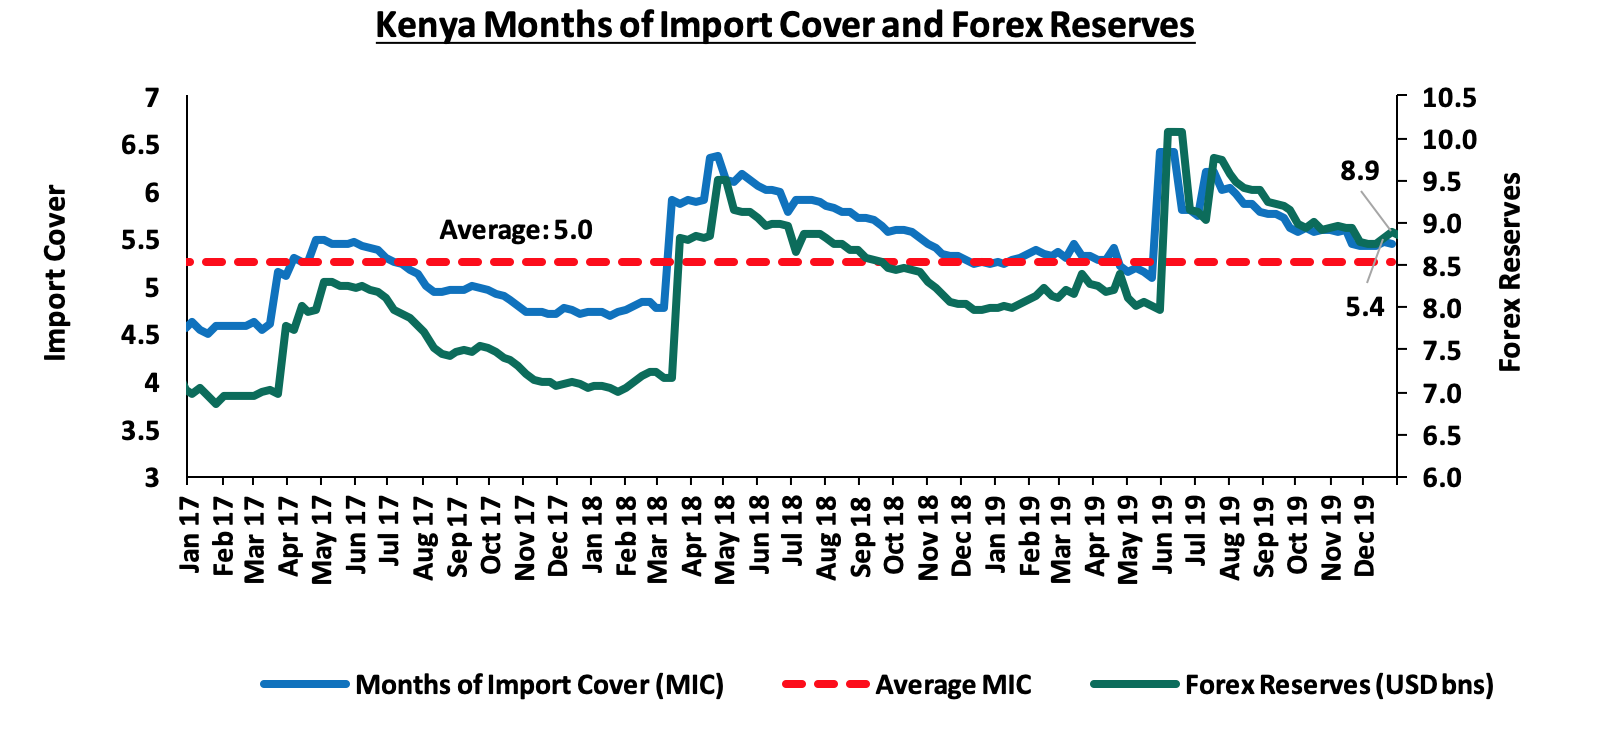
- High levels of forex reserves, currently at USD 8.8 bn (equivalent to 5.4-months of import cover), above the statutory requirement of maintaining at least 4.0-months of import cover, and the EAC region’s convergence criteria of 4.5-months of import cover.

Inflation:
The inflation rate for the month of December 2019 rose to 5.8%, from 5.6% recorded in November, which exceeded our projections of 4.8% - 5.2%, bringing the 2019 average to 5.2%, compared to the 2018 average of 4.7%. Month-on-month inflation increased by 0.9%, which was attributable to;
- A 1.5% increase in the food and non-alcoholic drinks’ index, due to rise in prices of some foodstuffs outweighing decrease recorded in others. High increases of vegetables was recorded despite the ongoing heavy rains with kales, tomatoes, spinach, and onions increasing by 5.6%, 7.8%, 9.1% and 5.1%, respectively,
- A marginal increase of 0.01% in the housing, water, electricity, gas and other fuels index, attributed to higher prices of charcoal, and,
- A 2.1% increase in the transport index on account of the increase in
public transport fares outweighing the decrease in pump prices of diesel and petrol.
Going forward, overall inflation is expected to remain within the target range (of 2.5% - 7.5%) in the near term, mainly due to expected lower food prices as a result of favorable weather conditions.
Monetary Policy:
During the year the Monetary Policy Committee met 6 times. They lowered the Central Bank Rate (CBR) once, in the meeting held on 25th November 2019, citing that inflation expectations remained well anchored within the target range and that the economy was operating below its potential level and as such, the MPC concluded that due to the tightening of fiscal policy, there was room for accommodative monetary policy to support economic activity. During their meeting in November 2019, the MPC lowered the CBR by 50 bps to 8.5%, from the earlier 9.0% that had been set in July 2018. The MPC also welcomed the repeal of the interest rate caps on commercial bank loans, noting that they had led to significant rationing of credit. It noted that this reform would restore clarity of monetary policy decisions and strengthen the transmission of policies by allowing the Central Bank of Kenya (CBK) adjust the monetary policy rates in response to economic developments such as changes in inflation and GDP growth.
Through its assessment of the impact of the interest rate cap in the rate cap era, the Monetary Policy Committee had noted that the implementation of the interest rate cap had weakened the transmission of monetary policy and thus had made it difficult for the CBK to adjust the monetary policy rates in response to economic developments. Expansionary monetary policy was difficult to implement since lowering the CBR had the effect of lowering the lending rates and as a consequence, banks found it even more difficult to price for risk at the lower interest rates, leading to pricing out of more risky borrowers, and hence further reducing access to credit. On the other hand, if the CBK was to employ a contractionary monetary policy, so as to reduce inflation and credit growth for example, then raising the CBR would have the reverse effect of increasing the supply of credit in the economy since banks would be able to admit riskier borrowers.
2019 Key Highlights:
- The Kenyan President signed the Finance Bill 2019 into law, scrapping the law capping interest rates at 4.0% above the Central Bank Rate (CBR). Interest rate caps were introduced in Kenya in September 2016 with the enactment of the Banking (Amendment) Act, 2015, due to the high cost of borrowing that saw banks charge interest rates as high as 21.0% for loans, yet depositors earned approximately 5.0% for their deposits. For a more comprehensive analysis and more information see our Market Post Interest Rate Cap Analysis and Cytonn Weekly #45/2019,
- The National Treasury released the 2019/2020 fiscal year (FY) budgeton 13th June 2019. According to the budget summary, total revenue collected is expected to increase by 14.2% to Kshs 2.1 tn from the Kshs 1.9 tn as per the revised FY’2018/2019 revised Budget, mainly driven by a 12.2% rise in ordinary revenue to Kshs 1.9 tn, from an estimated Kshs 1.7 tn in the revised FY’2018/2019 budget. Total expenditure is set to increase by 10.1% to Kshs 2.8 tn from Kshs 2.5 tn as per the revised FY’2018/19 Budget. The fiscal deficit is projected at Kshs 607.8 bn (5.6% GDP), which will be financed through Kshs 324.3 bn in terms of external financing, domestic borrowing of Kshs 289.2 bn and other domestic receipts worth Kshs 5.7 bn. For more information see Cytonn Weekly #24/2019 and our FY 2019/20 Pre-Budget Discussion Note,
- The National Treasury released the budgetary review for the 2018/2019 financial year indicating that revenues collected had increased by 9.2% to Kshs 1.7 tn from Kshs 1.5 tn collected during the 2017/2018 financial year. The revenue collected was 93.1% of the budgetary target for the year as compared to the previous period where revenue collected was 91.7% of the budgetary target. Total expenditure amounted to Kshs 2.4 tn, a 12.1% increase from Kshs 2.1 tn recorded during the same period last year. This was 94.7% of the Kshs 2.5 tn target, with 62.2% of the expenditure being on recurrent expenditure, while development expenditure only accounted for 22.5%. Total expenditure was, however, 6.3% lower than the targeted expenditure as per the budget. The key concern, however, remains the widening of the fiscal deficit where the expenditure side has continued to grow faster recording a 12.1% growth, compared to the 9.2% growth in revenue collection. For more information see our Cytonn Weekly #34/2019,
- President Uhuru Kenyatta signed the Supplementary Appropriation Bill (No. 2) of 2019 into law, paving way for the release of Kshs 73.2 bn from the government’s consolidated fund. The new funding is expected to impact Ministerial and State departments budgets as the government agencies register varying adjustments in allocations. However, only Kshs 54.3 bn of the Kshs 73.4 bn will be spent after the National Assembly Budget and Appropriations Committee (BAC) approved cuts amounting to Kshs 18.9 bn. For more information see our Cytonn Weekly #49/2019,
- Kenya issued its 3rdEurobond, raising USD 2.1 bn (Kshs 210.0 bn) through a dual-tranche Eurobond of 7-year and 12-year tenors, value dated 15th May 2019. A longer-term issuance would have been more preferable, though it comes at a trade-off on the yields as investors would demand a higher risk premium to compensate for the risk in tandem with the repayment period of the loan. The Eurobond was listed on the London Stock Exchange (LSE). The issue was 4.5x oversubscribed attracting orders worth USD 9.5 bn. The Eurobond was priced at 7.0% for the 7-year tenor and 8.0% for the 12-year tenor. For more information, see our Cytonn Weekly #20/2019,
- The World Bank released the Doing Business 2020 Report, which investigates the regulations that enhance business activity in a country and those that constrain it. Of the 190 countries, Kenya’s ranking improved by 4 positions to #56 in the 2020 report with a score of 73.2, from #61 in the 2019 report. In Africa, Kenya’s ranking declined 1 position to #4, from #3 compared to the previous period. For a more comprehensive analysis, see our Ease of Doing Business 2020 Summary Note,
- Fitch Ratings, an American credit rating agency, affirmed through a press release that Kenya’s Long-Term Foreign-Currency Issuer Default Rating was at B+ with a stable outlook. This rating is informed by the country’s high levels of debt, both domestic and external, against a strong and stable growth outlook. For more information see Cytonn Weekly #50/2019.
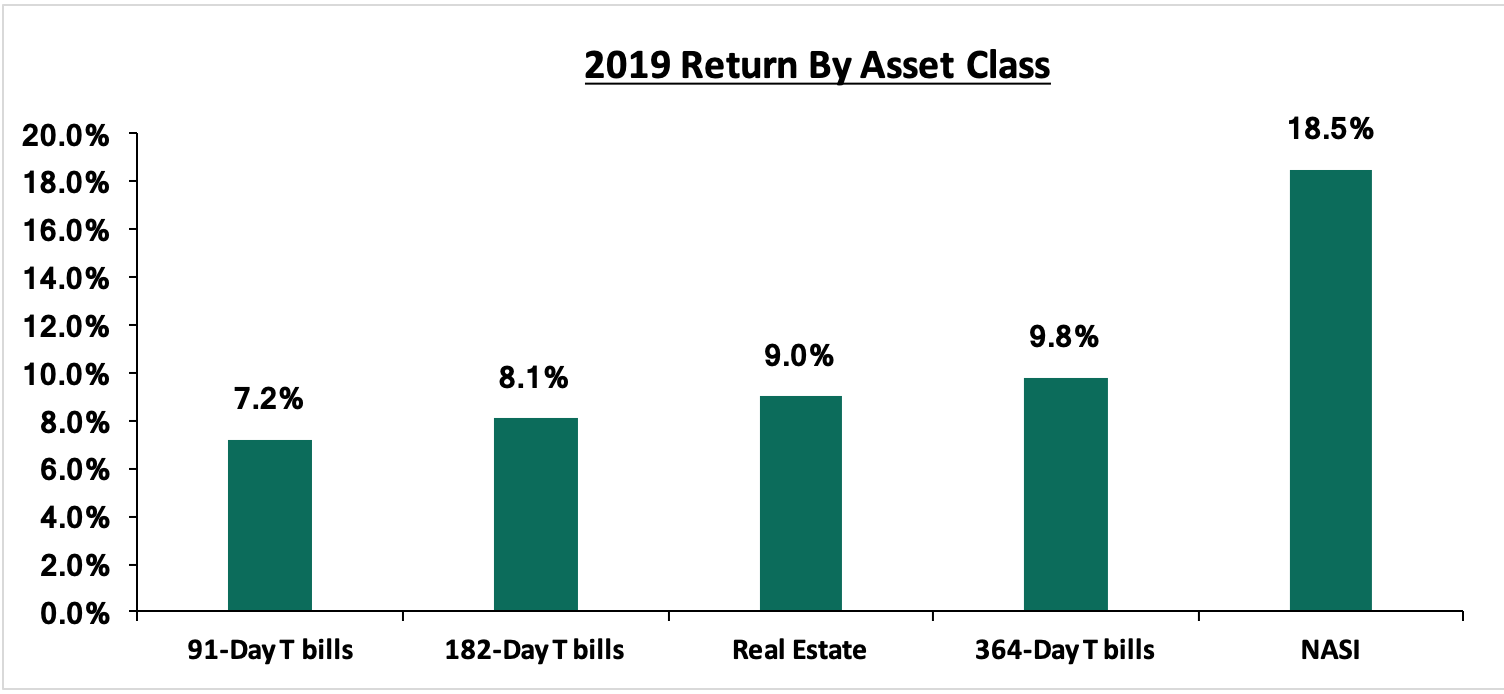
The graph below shows the summary of returns by asset class in 2019 (T- Bonds, T-Bills and Equities). The best performing asset in 2019 was NASI with returns of 18.5% followed by the 364-day Government paper with yields of 9.8%. Real estate recorded returns of 9.0% and the 182-day and 91-day Government papers recorded yields of 8.1% and 7.2%, respectively.

The table below shows the macro-economic indicators that we track, indicating our expectations for each variable at the beginning of 2019 versus the actual experience:
|
Macroeconomic Indicators 2019 Review |
||||
|
Macro-Economic Indicators |
2019 Expectations at Beginning of Year |
Outlook - Beginning of Year |
2019 Experience |
Effect |
|
Government Borrowing |
We expected the government to come under pressure to borrow as it was well behind both domestic and foreign borrowing targets for FY 2018/19, and with the expectations of KRA not achieving the revenue targets and the government having a net external financing target of Kshs 272.0 bn to finance the budget deficit, coupled with the need to retire 3 commercial loans maturing in H1’2019 |
Negative |
During the year the government issued Eurobonds to retire the commercial loans that were maturing. The Government also substituted the debt ceiling that was previously pegged at 50.0% of GDP to an absolute figure of Kshs 9.0 tn, indicating the growing appetite of the government for taking on additional debt. The Government also raised its total revenue target by 14.2% to Kshs 2.1 tn for FY’2019/20 which we doubt it will meet, thus exerting slight pressure on the domestic borrowing front to plug in the deficit. The repeal of the interest rate cap has also made it difficult for the government to access domestic debt. |
Negative |
|
Exchange Rate |
Currency was projected to range between Kshs 101.0 and Kshs 104.0 against the USD in 2019, with CBK to continue supporting the Shilling in the short term through its sufficient reserves of USD 8.0 bn (equivalent to 5.2-months of import cover) |
Neutral |
The Kenya Shilling gained 0.5% against the US Dollar to close at 101.3 in 2019 compared to 101.8 at the end of 2018, and ranging between 100.0 and 103.4. |
Positive |
|
Interest Rates |
We expected slight upward pressure on interest rates, especially in H1’2019, as the government falls behind its domestic borrowing targets for the fiscal year coupled with heavy domestic maturities |
Neutral |
The Monetary Policy Committee lowered the Central Bank Rate (CBR) once by 50 bps to 8.5% from 9.0%, in the 6 meetings held in 2019, citing that inflation expectations remained well anchored within the target range and that the economy was operating below its potential level. During their meeting in November 2019, the MPC lowered the CBR by 50 bps to 8.5% from the earlier 9.0% that had been set in July 2018
|
Neutral |
|
Inflation |
Inflation was expected to average 4.5%, within the government target range of 2.5%- 7.5%, compared to 7.0% last year |
Positive |
The inflation rate for the month of December 2019 rose to 5.8% from 5.6% recorded in November bringing the 2019 average to 5.2% (in line with the government’s target of 2.5% to 7.5%) compared to the 2018 average of 4.7%. |
Positive |
|
GDP |
GDP growth was projected to come in at between 5.7% - 5.9% lower than the expected growth rate of 6.0% in 2018, but higher than the 5-year historical average of 5.4% |
Positive |
Kenya’s economy expanded in 2019 by 5.6% in Q1’2019, 5.2% in Q2’2019 and 5.1% in Q3’2019 to record an average growth of 5.4% for the 3 quarters compared to an average growth of 6.0% over the same period in 2018 |
Positive |
|
Investor Sentiment |
Investor sentiment in 2019 to register improved foreign participation, mainly supported by long term investors who enter the market looking to take advantage of the current low/cheap valuations in select sections of the market |
Neutral |
The Government managed to raise USD 2.1 bn in Eurobonds, in an issue that was oversubscribed by 4.5 times. Foreign investors turned net buyers during the year with a net inflow of USD 18.5 mn compared to net outflows of USD 425.6 mn recorded in 2018 |
Positive |
|
Security |
We expected security to be maintained in 2019, especially given that the political climate in the country has eased, with security maintained and business picking up |
Positive |
The political climate in the country eased during the year. Despite the terror attack experienced during the first half of 2019, Kenya was spared from travel advisories, evidence of the international community’s confidence in the country’s security position |
Positive |
Out of the seven metrics that we track, five had a positive effect while one had a neutral effect and one had a negative effect, compared to the beginning of the year where three had a positive outlook, three had a neutral look and one had a negative outlook. In conclusion, macroeconomic fundamentals remained positive during the year because of an improved business environment created through political goodwill and improved security in the country.

