Cytonn Monthly – July 2024
By Investments Team, Aug 4, 2024
Executive Summary
Fixed Income
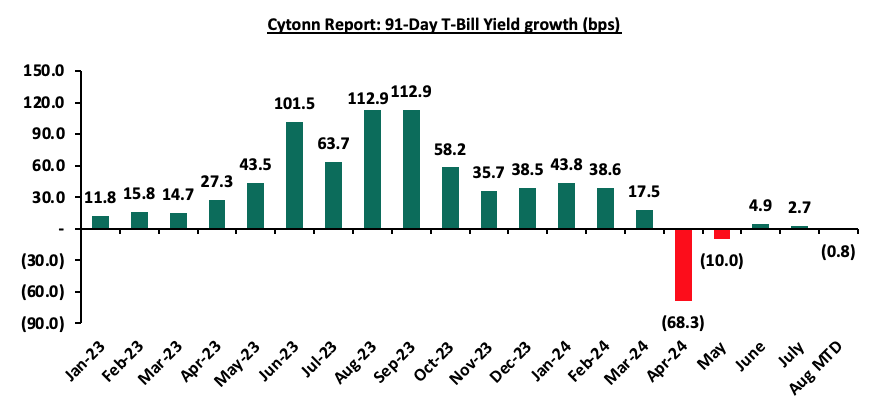
During the month of July 2024, T-bills were oversubscribed, with the overall average oversubscription rate coming in at 102.6%, higher than the oversubscription rate of 101.9% recorded in June 2024. The overall average subscription rate for the 91-day paper increased to 352.2% from 343.9%, while the overall average subscription rates for the 182-day and 364-day paper decreased to 64.8% and 40.6% respectively, from 66.1% and 40.8% respectively, which was recorded in June 2024. The average yields on the government papers increased during the month, with the 364-day, 182-day, and 91-day papers yields decreasing by 11.7 bps, 12.4 bps, and 2.7 bps to 16.9%, 16.8%, and 16.0% respectively from 16.8%, 16.7%, and 16.0% recorded the previous month. For the month of July, the government accepted a total of Kshs 105.9 bn of the Kshs 123.1 bn worth of bids received, translating to an acceptance rate of 86.0% compared to acceptance rate of 93.8% in the month of June;
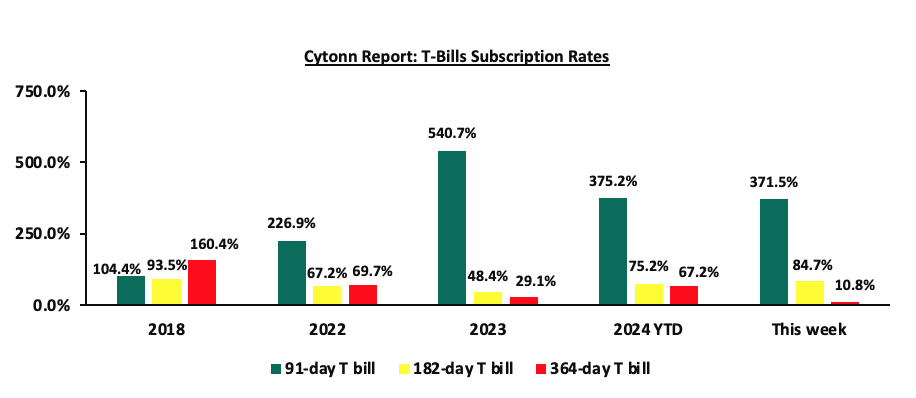
This week, T-bills were oversubscribed for the second consecutive week, with the overall oversubscription rate coming in at 101.7%, albeit lower than the oversubscription rate of 131.9% recorded the previous week. Investors’ preference for the shorter 91-day paper persisted, with the paper receiving bids worth Kshs 14.9 bn against the offered Kshs 4.0 bn, translating to an oversubscription rate of 371.5%, albeit lower than the oversubscription rate of 645.3% recorded the previous week. The subscription rate for the 182-day increased to 84.7% from the 41.5% recorded the previous week while the subscription rate for the 364-day paper decreased to 10.8% from the 16.9% recorded the previous week. The government accepted a total of Kshs 23.0 bn worth of bids out of Kshs 24.4 bn bids received, translating to an acceptance rate of 94.3%. The yields on the government papers were on a downward trajectory, with the yields on the 91-day paper decreasing the most by 1.2 bps to 15.99% from the 16.00% recorded the previous week, while the yields on the 364-day and 182-day papers decreased marginally by 0.1 bps and 0.04 bps to remain relatively unchanged from the 16.92% and 16.85% respectively recorded the previous week;
Additionally, July 2024 bonds were undersubscribed, with the overall undersubscription rate coming in at 17.1%, lower than the oversubscription rate of 46.9% recorded in June 2024. The reopened bonds FXD1/2024/010 and FXD1/2008/020, with fixed coupon rates of 16.0% and 13.8% respectively, received bids worth Kshs 14.7 bn against the offered Kshs 30.0 bn translating to an undersubscription rate of 48.9%, with the government accepting bids worth Kshs 9.8 bn, translating to an acceptance rate of 66.5%, with the average accepted yields coming at 16.6% and 18.3% respectively. Moreover, the tap sale issue for the FXD1/2023/002 received bids worth Kshs 0.5 bn against the offered Kshs 20.0 bn, translating to an undersubscription rate of 2.4%, with the government accepting bids worth Kshs 0.5 bn, translating to an acceptance rate of 99.8%, and a yield of 17.1%;
In the primary bond market, the government is looking to raise Kshs 50.0 bn through the reopened infrastructure bonds IFB1/2023/6.5 with a tenor to maturity of 5.8 years and IFB1/2023/17 with a tenor to maturity of 15.7 years. The bonds will be offered at fixed coupon rates of 17.9% and 14.4% for the IFB1/2023/6.5 and IFB1/2023/17 respectively. Given the current market conditions and the recent bond issues, we expect the average rate of accepted bids for the two bonds to come in at a range of 17.85%-17.95% for the IFB1/2023/6.5 and 14.45%-14.85% for the IFB1/2023/17;
Additionally, during the week, the Kenya National Bureau of Statistics released their monthly consumer price indices and inflation rate report, announcing that The y/y inflation in July 2024 decreased by 0.3% points to 4.3%, from the 4.6% recorded in June 2024. This was contrary to our expectation of an increase, as it came below our projected range of 4.7% to 5.0% mainly on the back of the weakening of the Kenya Shilling against the US Dollar having recorded a 2.4% month-to-date decline to Kshs 132.6 as of 26th July 2024 from the Kshs 129.5 recorded at the beginning of the month;
Also, during the week, the global ratings agency, Fitch Ratings announced its revision of Kenya’s credit score, downgrading it to B- from a credit rating of B while also revising the outlook to stable, from a negative outlook affirmed on 16th February 2024. Their decision comes on the back of the government's decision to forgo proposed tax increases through the Finance Bill 2024 and rely on expenditure cuts, significantly impacting Kenya's fiscal trajectory and financing needs. The downgrade follows Moody’s downgrading Kenya’s IDR to Caa1 from a credit rating of B3 while maintaining a negative outlook on July 8th 2024;
Equities
During the month of July 2024, the equities market was on a downward trajectory, with NSE 10 declining the most by 1.7%, while NSE 25, NSE 20, and NASI declined by 1.6%, 1.3%, and 0.8% respectively. The equities market performance was driven by losses recorded by large-cap stocks such as Safaricom, Equity, and Standard Chartered Group of 8.1%, 4.1%, and 3.0% respectively. The losses were, however, mitigated by gains recorded by large-cap stocks such as Bamburi, EABL, and Stanbic of 48.3%, 7.7%, and 1.5% respectively;
During the week, the equities market was on a downward trajectory, with NSE 10 and NSE 25 being the biggest decliners by 1.0% each, while NASI and NSE 20 declined by 0.9% each, taking the YTD performance to gains of 18.2%, 16.0%, 12.3%, and 10.0% for NSE 10, NSE 25, NASI, and NSE 20 respectively. The equities market performance was driven by losses recorded by large-cap stocks such as NCBA, KCB, and BAT of 4.5%, 3.1%, and 2.9% respectively. The performance was, however, supported by gains recorded by large-cap stocks such as Bamburi, EABL, and Stanbic of 2.0%, 1.6%, and 0.9% respectively;
During the week, East African Breweries Plc (EABL) released their FY’2024 financial results for the period ending 30th June 2024, recording an 11.8% decline in the Profits After Tax (PAT) to Kshs 10.9 bn in FY’2024, from Kshs 12.3 bn in FY’2023. The decline was mainly attributable to an 18.4% increase in Operating costs to Kshs 25.0 bn in FY’2024, from Kshs 21.1 bn in FY’2023, coupled with the 84.3% increase in net finance costs to Kshs 8.2 bn, from Kshs 5.5 bn in FY’2023 that offset the 13.5% growth in Gross profit to Kshs 53.8 bn in FY'2024 from Kshs 47.4 bn in FY'2023.The dividend per share increased by 27.3% to Kshs. 7.0 in FY’ 2024 from Kshs. 5.5 in FY’ 2023
Also, During the week, Centum Investments Company PLC released their FY’2024 financial results for the period ending 31st March 2024, recording a significant 135.6% increase in the Profits After Tax (PAT) to Kshs 2.6 bn in FY’2024, from a loss of Kshs 7.3 bn in FY’2023. The increase was mainly attributable to a 294.9% increase in profit from the finance and investment operations business to Kshs 2.1 bn in FY’2024, from a loss of Kshs 1.1 bn in FY’2023, coupled with a significant 130.5% increase in profit from their Real Estate business to Kshs 1.5 bn, from a loss of Kshs 5.1 bn in FY’2023. However, the performance was weighed down by a significant 493.1% increase in loss in their trading business to Kshs 0.7 bn in FY'2024 from Kshs 0.1 bn in FY'2023. The dividend per share decreased by 46.7% to Kshs. 0.3 in FY’ 2024 from Kshs. 0.6 in FY’ 2023;
Real Estate
During the week, Hass Consult, a Kenyan consulting and Real Estate development firm, released its House Price Index Q2’2024 Report, and Land Price Index Q2’2024 Report focusing on the residential Real Estate and the Land sector's performance in the Nairobi Metropolitan Area (NMA). Notably, the average selling prices for all properties posted a 1.0% increase on a quarter-on-quarter (q/q) basis in Q2’2024, an improvement from a 0.5% decrease in Q2’2023. On the other hand, the average q/q selling prices for land in the Nairobi suburbs grew by 1.8%, compared to a 0.06% decline recorded in Q2’2023. On a y/y basis, the performance represented a 6.9% increase, compared to the 1.2% increase recorded in Q2’2023;
In the commercial office sector, Postal Corporation of Kenya, opened 79,626 square feet of office space for lease to draw revenue from idle assets. The state agency has identified space in 13 branch offices across 7 counties. Mokowe post office in Lamu has the largest space available for lease at 35,000 SQFT;
In the hospitality sector, Accor, a hospitality group in Kenya, opened Gem Forest Hotel along Nairobi’s Limuru Road, marking the ninth property it manages in Kenya’s market. The property comprises 105 rooms, conference spaces with an 80-guests capacity, a swimming pool, a gym, four restaurants, and bars;
In the Real Estate Investments Trusts (REITs) sector, the Capital Markets Authority (CMA) granted a license to Mi Vida Homes Limited to operate as a REIT Manager in efforts to strengthen and develop the country’s capital markets. This brings the total number of REIT Managers in Kenya to 11;
Also during the week, Acorn Holdings released their H1’2024 financial results for the Acorn D-REIT and I-REIT. The I-REIT recorded a 64.5% increase in rental income coming in at Kshs 534.2 mn from 324.8 mn in H1’2023. The performance was attributed to the REIT’s expanding property portfolio through acquisition of Qwetu Hurlingham and Qwetu Aberdare Heights II as well as the rental escalations that took effect in April 2024. Additionally, Acorn D-REIT posted a 67.2% decline in rental income to Kshs 53.1 mn in H1’2024 from Kshs 162.0 mn in H1’2023. The performance is attributed to ASA D-REIT closing the period with only 2 operational properties in Karen (Qwetu Karen and Qejani Karen) compared to 4 at the same time in the previous year after the sale of Qwetu Hurlingham and Qwetu Aberdare Heights II to ASA I-REIT;
On the Unquoted Securities Platform, Acorn D-REIT and I-REIT traded at Kshs 24.5 and Kshs 22.0 per unit, respectively, as per the last updated data on 2nd August, 2024. The performance represented a 22.5% and 10.0% gain for the D-REIT and I-REIT, respectively, from the Kshs 20.0 inception price. Additionally, ILAM Fahari I-REIT traded at Kshs 11.0 per share as of 2nd August, 2024, representing a 45.0% loss from the Kshs 20.0 inception price;
Investment Updates:
- Weekly Rates:
- Cytonn Money Market Fund closed the week at a yield of 18.29% p.a. To invest, dial *809# or download the Cytonn App from Google Play store here or from the Appstore here;
- We continue to offer Wealth Management Training every Monday, from 10:00 am to 12:00 pm. The training aims to grow financial literacy among the general public. To register for any of our Wealth Management Trainings, click here;
- If interested in our Private Wealth Management Training for your employees or investment group, please get in touch with us through wmt@cytonn.com;
- Cytonn Insurance Agency acts as an intermediary for those looking to secure their assets and loved ones’ future through insurance namely; Motor, Medical, Life, Property, WIBA, Credit and Fire and Burglary insurance covers. For assistance, get in touch with us through insuranceagency@cytonn.com;
- Cytonn Asset Managers Limited (CAML) continues to offer pension products to meet the needs of both individual clients who want to save for their retirement during their working years and Institutional clients that want to contribute on behalf of their employees to help them build their retirement pot. To more about our pension schemes, kindly get in touch with us through pensions@cytonn.com;
Hospitality Updates:
- We currently have promotions for Staycations. Visit cysuites.com/offers for details or email us at sales@cysuites.com;
Money Markets, T-Bills Primary Auction:
During the month of July 2024, T-bills were oversubscribed, with the overall average oversubscription rate coming in at 102.6%, higher than the oversubscription rate of 101.9% recorded in June 2024. The overall average subscription rate for the 91-day paper increased to 352.2% from 343.9%, while the overall average subscription rates for the 182-day and 364-day paper decreased to 64.8% and 40.6% respectively, from 66.1% and 40.8% respectively, which was recorded in June 2024. The average yields on the government papers increased during the month, with the 364-day, 182-day, and 91-day papers yields decreasing by 11.7 bps, 12.4 bps, and 2.7 bps to 16.9%, 16.8%, and 16.0% respectively from 16.8%, 16.7%, and 16.0% recorded the previous month. For the month of July, the government accepted a total of Kshs 105.9 bn of the Kshs 123.1 bn worth of bids received, translating to an acceptance rate of 86.0% compared to acceptance rate of 93.8% in the month of June. The chart below shows the yield growth rate for the 91-day paper during the year:
This week, T-bills were oversubscribed for the second consecutive week, with the overall oversubscription rate coming in at 101.7%, albeit lower than the oversubscription rate of 131.9% recorded the previous week. Investors’ preference for the shorter 91-day paper persisted, with the paper receiving bids worth Kshs 14.9 bn against the offered Kshs 4.0 bn, translating to an oversubscription rate of 371.5%, albeit lower than the oversubscription rate of 645.3% recorded the previous week. The subscription rate for the 182-day increased to 84.7% from the 41.5% recorded the previous week while the subscription rate for the 364-day paper decreased to 10.8% from the 16.9% recorded the previous week. The government accepted a total of Kshs 23.0 bn worth of bids out of Kshs 24.4 bn bids received, translating to an acceptance rate of 94.3%. The yields on the government papers were on a downward trajectory, with the yields on the 91-day paper decreasing the most by 1.2 bps to 15.99% from the 16.00% recorded the previous week, while the yields on the 364-day and 182-day papers decreased marginally by 0.1 bps and 0.04 bps to remain relatively unchanged from the 16.92% and 16.85% respectively recorded the previous week.
So far in the current FY’2024/25, government securities totalling Kshs 194.0 bn have been advertised. The government has accepted bids worth Kshs 139.1 bn, of which Kshs 128.9 bn and Kshs 10.3 bn were treasury bills and bonds, respectively. Total redemptions so far in FY’2024/25 equal to Kshs 88.3 bn, with treasury bills accounting for Kshs 88.3 bn. As a result, the government has a domestic borrowing surplus of Kshs 50.8 bn in FY’2024/25.
The chart below compares the overall average T-bill subscription rates obtained in 2018, 2022, 2023, and 2024 Year to Date (YTD):
Additionally, July 2024 bonds were undersubscribed, with the overall undersubscription rate coming in at 17.1%, lower than the oversubscription rate of 46.9% recorded in June 2024. The reopened bonds FXD1/2024/010 and FXD1/2008/020, with fixed coupon rates of 16.0% and 13.8% respectively, received bids worth Kshs 14.7 bn against the offered Kshs 30.0 bn translating to an undersubscription rate of 48.9%, with the government accepting bids worth Kshs 9.8 bn, translating to an acceptance rate of 66.5%, with the average accepted yields coming at 16.6% and 18.3% respectively. Moreover, the tap sale issue for the FXD1/2023/002 received bids worth Kshs 0.5 bn against the offered Kshs 20.0 bn, translating to an undersubscription rate of 2.4%, with the government accepting bids worth Kshs 0.5 bn, translating to an acceptance rate of 99.8%, and a yield of 17.1%. The table below provides more details on the bonds issued in May, June, and July 2024:
|
Cytonn Report: Bond Issuances in May, June and July 2024 |
|||||||||
|
Issue Date |
Bond Auctioned |
Effective Tenor to Maturity (Years) |
Coupon |
Amount offered (Kshs bn) |
Actual Amount Raised (Kshs bn) |
Total bids received |
Average Accepted Yield |
Subscription Rate |
Acceptance Rate |
|
06/05/2024 |
FXD1/2024/010-Re-opened |
9.9 |
16.0% |
25.0 |
11.0 |
15.0 |
16.2% |
59.9% |
73.4% |
|
13/05/2024 |
FXD1/2024/010-Tapsale |
9.9 |
16.0% |
15.0 |
7.0 |
7.1 |
16.2% |
47.4% |
98.8% |
|
10/06/2024
|
FXD1/2023/002 - Re-opened |
1.2 |
17.0% |
30.0 |
7.1 |
8.4 |
17.1% |
28.2% |
83.8% |
|
FXD1/2024/003 – Re-opened |
2.6 |
18.4% |
23.8 |
24.8 |
17.6% |
82.7% |
96.0% |
||
|
17/06/2024
|
FXD1/2023/010 – Re-opened |
8.7 |
14.2% |
30.0 |
7.6 |
9.6 |
16.4% |
32.1% |
78.9% |
|
FXD1/2023/005 – Re-opened |
4.1 |
16.8% |
22.6 |
31.9 |
18.2% |
106.5% |
70.7% |
||
|
24/06/2024
|
FXD1/2023/010 – Tapsale |
8.7 |
14.2% |
20.0 |
7.9 |
8.8 |
16.4% |
44.2% |
89.8% |
|
FXD1/2023/005 – Tapsale |
4.1 |
16.8% |
10.8 |
11.2 |
18.2% |
56.1% |
96.3% |
||
|
FXD1/2024/003 – Tapsale |
2.6 |
18.4% |
3.3 |
3.3 |
17.6% |
16.3% |
101.6% |
||
|
FXD1/2023/002 – Tapsale |
1.2 |
17.0% |
1.8 |
1.8 |
17.1% |
9.0% |
99.8% |
||
|
08/07/2024 |
FXD1/2023/002 -Tapsale |
1.2 |
17.0% |
20.0 |
0.5 |
0.5 |
17.1% |
2.4% |
99.8% |
|
22/07/2024 |
FXD1/2024/010 – Re-opened |
9.7 |
16.0% |
30.0 |
9.8 |
14.7 |
16.6% |
48.9% |
66.5% |
|
FXD1/2008/020 – Re-opened |
3.9 |
13.8% |
18.3% |
||||||
|
July 2024 Average |
4.9 |
15.6% |
25.0 |
5.1 |
7.6 |
17.3% |
25.7% |
83.2% |
|
|
June 2024 Average |
4.2 |
16.6% |
26.7 |
10.6 |
12.5 |
17.3% |
46.9% |
89.6% |
|
|
2023 Average |
6.1 |
14.8% |
740.3 |
735.2 |
872.4 |
15.5% |
117.8% |
82.0% |
|
Source: Central Bank of Kenya (CBK)
In the primary bond market, the government is looking to raise Kshs 50.0 bn through the reopened infrastructure bonds IFB1/2023/6.5 with a tenor to maturity of 5.8 years and IFB1/2023/17 with a tenor to maturity of 15.7 years. The bonds will be offered at fixed coupon rates of 17.9% and 14.4% for the IFB1/2023/6.5 and IFB1/2023/17 respectively. Given the current market conditions and the recent bond issues, we expect the average rate of accepted bids for the two bonds to come in at a range of 17.85%-17.95% for the IFB1/2023/6.5 and 14.45%-14.85% for the IFB1/2023/17.
Secondary Bond Market:
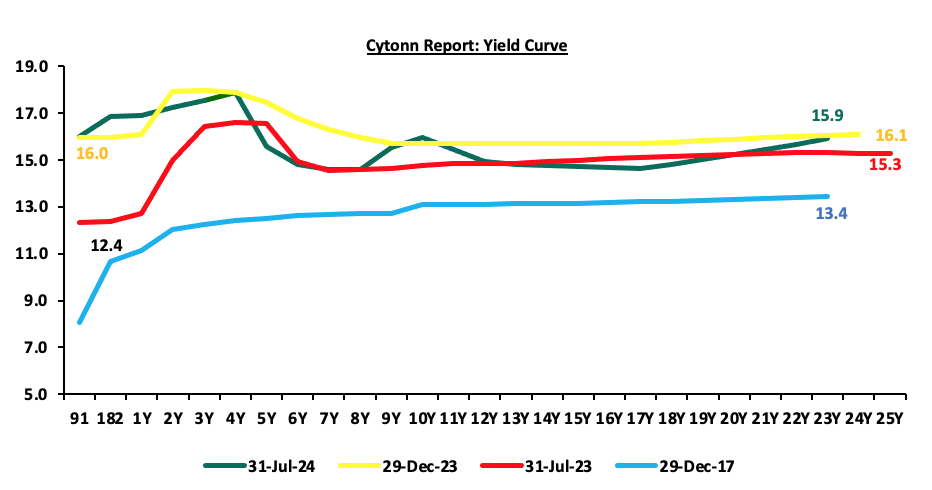
The yields on the government securities were on an upward trajectory during the month compared to the same period in 2023. We observe a humped yield curve for the medium-term bonds in the 2 to 5-year maturity range, an indication of the prevailing uncertainty in the market regarding both medium-term interest rates and inflation. Investors, apprehensive about the economic outlook in the near to medium term, are demanding higher yields for bonds in the 2 to 5-year maturity range to compensate for the perceived risks as they anticipate potential fluctuations in economic conditions in the Kenyan market on the back of the government’s debt sustainability concerns. The chart below shows the yield curve movement during the period:
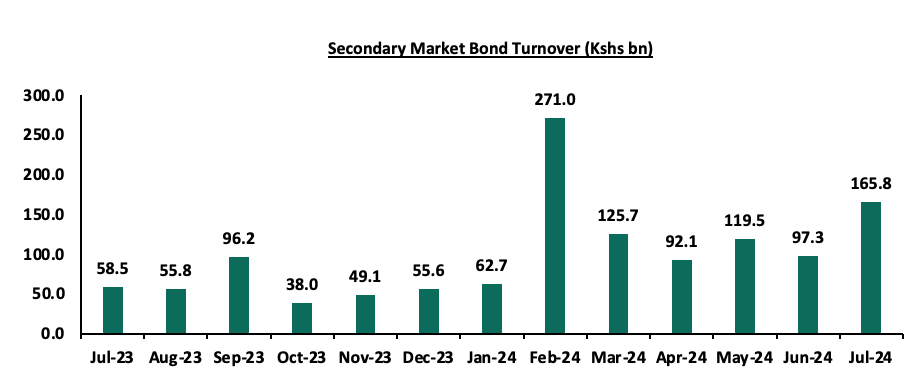
The secondary bond turnover increased by 70.5% to Kshs 165.8 bn, from Kshs 97.3 bn recorded in June 2024, pointing towards increased activities by commercial banks in the secondary bonds market for the month of July. Similarly, on a year-on-year basis, the bond turnover increased significantly by 183.7% from Kshs 58.5 bn worth of treasury bonds transacted over a similar period last year. The chart below shows the bond turnover over the past 12 months;
Money Market Performance:
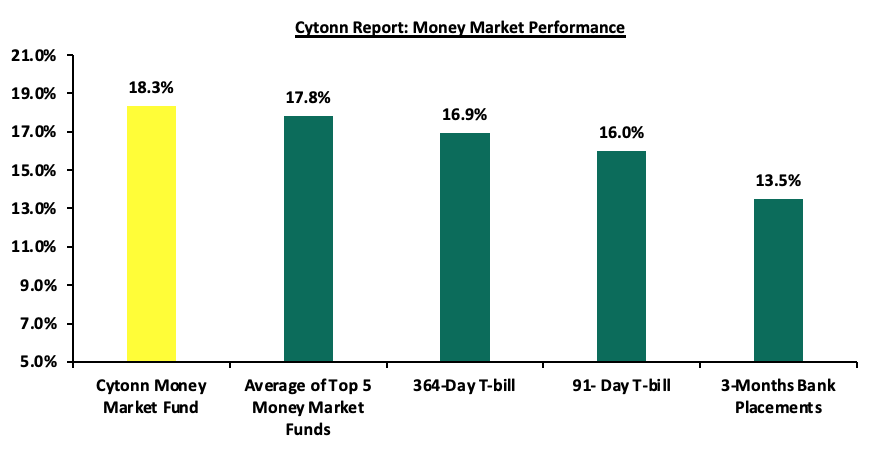
In the money markets, 3-month bank placements ended the week at 13.5% (based on what we have been offered by various banks), while the yield on the 364-day and 91-day papers decreased marginally by 0.1 bps and 1.2 bps to remain relatively unchanged at 16.9% and 16.0% respectively, recorded the previous week. The yield of Cytonn Money Market Fund remained unchanged to close the week at 18.3% recorded the previous week, and the average yields on the Top 5 Money Market Funds decreased by 15.0 bps to 17.8% from 18.0% recorded the previous week.
The table below shows the Money Market Fund Yields for Kenyan Fund Managers as published on 02nd August 2024:
|
Cytonn Report: Money Market Fund Yield for Fund Managers as published on 02nd August 2024 |
||
|
Rank |
Fund Manager |
Effective Annual |
|
1 |
Cytonn Money Market Fund (Dial *809# or download the Cytonn app) |
18.3% |
|
2 |
Lofty-Corban Money Market Fund |
18.3% |
|
3 |
Etica Money Market Fund |
18.3% |
|
4 |
Kuza Money Market fund |
17.2% |
|
5 |
Arvocap Money Market Fund |
17.2% |
|
6 |
GenAfrica Money Market Fund |
16.9% |
|
7 |
Nabo Africa Money Market Fund |
16.6% |
|
8 |
GenCap Hela Imara Money Market Fund |
16.2% |
|
9 |
Jubilee Money Market Fund |
16.1% |
|
10 |
Enwealth Money Market Fund |
16.0% |
|
11 |
Co-op Money Market Fund |
15.7% |
|
12 |
Apollo Money Market Fund |
15.6% |
|
13 |
Absa Shilling Money Market Fund |
15.5% |
|
14 |
Mayfair Money Market Fund |
15.5% |
|
15 |
KCB Money Market Fund |
15.4% |
|
16 |
Sanlam Money Market Fund |
15.3% |
|
17 |
Madison Money Market Fund |
15.3% |
|
18 |
AA Kenya Shillings Fund |
15.3% |
|
19 |
Mali Money Market Fund |
15.1% |
|
20 |
Orient Kasha Money Market Fund |
14.7% |
|
21 |
Dry Associates Money Market Fund |
14.0% |
|
22 |
ICEA Lion Money Market Fund |
13.9% |
|
23 |
CIC Money Market Fund |
13.7% |
|
24 |
Old Mutual Money Market Fund |
13.6% |
|
25 |
Equity Money Market Fund |
13.6% |
Source: Business Daily
Liquidity:
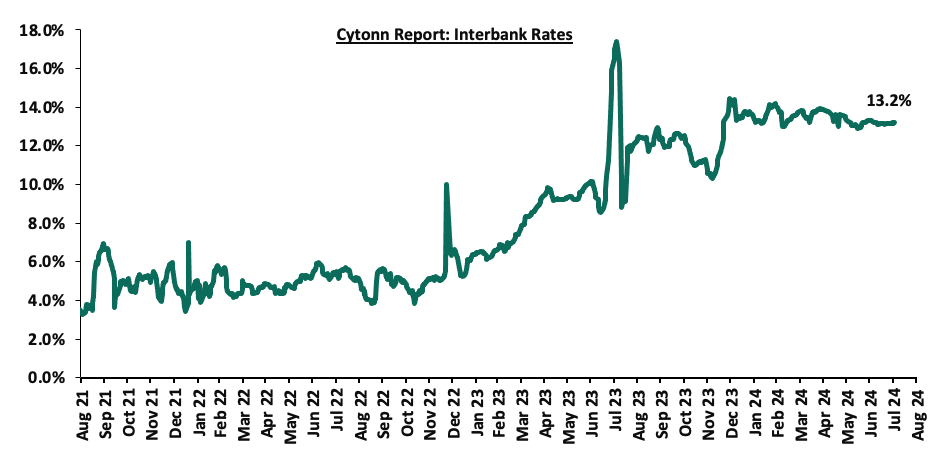
Liquidity in the money markets tightened in the month of July 2024, with the average interbank rate increasing by 4.3 bps to 13.2% from 13.1% recorded the previous month. During the month of July, the average interbank volumes traded increased by 18.7% to Kshs 28.6 bn, from Kshs 24.1 bn recorded in June.
Also, during the week, liquidity in the money markets tightened, with the average interbank rate increasing by 3.5 bps to remain relatively unchanged from 13.2% recorded the previous week, partly attributable to tax remittances that offset government payments. The average interbank volumes traded increased by 40.0% to Kshs 34.0 bn, from Kshs 24.3 bn recorded the previous week. The chart below shows the interbank rates in the market over the years:
Kenya Eurobonds:
During the month, the yields on the Eurobonds were on an upward trajectory, with the yield on the 7-year Eurobond issued in 2019 increasing the most by 46.3 bps to 10.6% from 10.1%, recorded at the end of June 2024. Also, during the week, the yields on Eurobonds were on an upward trajectory, with the yields on the 30-year Eurobond issued in 2018 increasing the most by 26.1 bps to 11.1% from 10.8% recorded the previous week. The table below shows the summary of the performance of the Kenyan Eurobonds as of 01st August 2024;
|
Cytonn Report: Kenya Eurobonds Performance |
||||||
|
2018 |
2019 |
2021 |
2024 |
|||
|
Tenor |
10-year issue |
30-year issue |
7-year issue |
12-year issue |
13-year issue |
7-year issue |
|
Amount Issued (USD) |
1.0 bn |
1.0 bn |
0.9 bn |
1.2 bn |
1.0 bn |
1.5 bn |
|
Years to Maturity |
3.6 |
23.6 |
2.8 |
7.8 |
9.9 |
6.5 |
|
Yields at Issue |
7.3% |
8.3% |
7.0% |
7.9% |
6.2% |
10.4% |
|
01-Jan-24 |
9.8% |
10.2% |
10.1% |
9.9% |
9.5% |
|
|
28-Jun-24 |
10.4% |
11.0% |
10.1% |
10.8% |
10.8% |
10.8% |
|
25-Jul-24 |
10.5% |
10.8% |
10.4% |
10.8% |
10.8% |
10.9% |
|
29-Jul-24 |
10.5% |
11.0% |
10.4% |
10.8% |
10.8% |
10.9% |
|
30-Jul-24 |
10.5% |
11.0% |
10.4% |
10.9% |
10.8% |
10.9% |
|
31-Jul-24 |
10.6% |
11.0% |
10.6% |
10.9% |
10.8% |
11.0% |
|
01-Aug-24 |
10.7% |
11.1% |
10.6% |
11.0% |
10.9% |
11.1% |
|
Weekly Change |
0.2% |
0.3% |
0.2% |
0.2% |
0.1% |
0.2% |
|
MTM Change |
0.2% |
0.0% |
0.5% |
0.1% |
0.0% |
0.1% |
|
YTD Change |
0.9% |
0.9% |
0.5% |
1.1% |
1.4% |
11.1% |
Source: Central Bank of Kenya (CBK) and National Treasury
Kenya Shilling:
During the month, the Kenya Shilling depreciated by 0.3% against the US Dollar, to close the month at Kshs 129.9, from Kshs 129.5 recorded at the end of June 2024. Also, during the week, the Kenya Shilling gained by 2.0% against the US Dollar to close at Kshs 129.9 from the Kshs 132.6 recorded the previous week. On a year-to-date basis, the shilling has appreciated by 17.2% against the US Dollar, a sharp contrast to the 26.8% depreciation recorded in 2023.
We expect the shilling to be supported by:
- Diaspora remittances standing at a cumulative USD 4,535.0 mn in the 12 months to June 2024, 12.9% higher than the USD 4,017.0 mn recorded over the same period in 2023, which has continued to cushion the shilling against further depreciation. In the June 2024 diaspora remittances figures, the US remained the largest source of remittances to Kenya accounting for 54.0% in the period,
- The tourism inflow receipts which came in at USD 352.5 bn in 2023, a 31.5% increase from USD 268.1 bn inflow receipts recorded in 2022, and owing to tourist arrivals that improved by 27.2% to 2.1 mn in the 12 months to March 2024, from 1.6 mn recorded during a similar period in 2023.
The shilling is however expected to remain under pressure in 2024 as a result of:
- An ever-present current account deficit which came at 3.2% of GDP in Q1’2024 from 3.0% recorded in Q1’2023,
- The need for government debt servicing, continues to put pressure on forex reserves given that 67.9% of Kenya’s external debt is US Dollar-denominated as of March 2024, and,
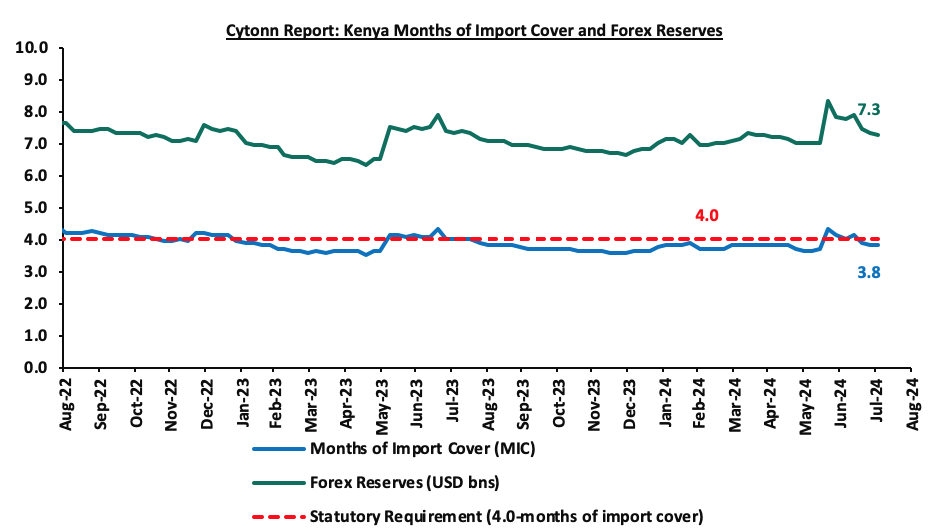
- Dwindling forex reserves currently at USD 7.3 bn (equivalent to 3.8-months of import cover), which is below the statutory requirement of maintaining at least 4.0-months of import cover, and also lower than the EAC region’s convergence criteria of 4.5-months of import cover.
Key to note, during the month of July 2024, Kenya’s forex reserves decreased by 6.3% to USD 7.3 bn, from USD 7.8 bn, while the months of import cover decreased to 3.8 months of import cover, from 4.1 months of import cover, recorded at the end of June 2024. Also, Kenya’s forex reserves decreased marginally by 0.5% during the week to remain relatively unchanged at USD 7.3 bn recorded the previous week, equivalent to 3.8 months of import cover, unchanged from the previous week, and remained below the statutory requirement of maintaining at least 4.0-months of import cover.
The chart below summarizes the evolution of Kenya's months of import cover over the years:
Weekly Highlights:
- July 2024 Inflation Highlight
The y/y inflation in July 2024 decreased by 0.3% points to 4.3%, from the 4.6% recorded in June 2024. This was contrary to our expectation of an increase, as it came below our projected range of 4.7% to 5.0% mainly on the back of the weakening of the Kenya Shilling against the US Dollar having recorded a 2.4% month-to-date decline to Kshs 132.6 as of 26th July 2024 from the Kshs 129.5 recorded at the beginning of the month, a contrast to the 0.5% gain recorded last month and the 15.6% year-to-date gain from the Kshs 157.0 recorded at the beginning of the year. The headline inflation in July 2024 was majorly driven by increase in prices of commodities in the following categories; Food & Non-Alcoholic Beverages, Transport and Housing, Water, Electricity, Gas & other fuels by 5.6%, 4.0% and 3.9% respectively. The table below shows a summary of both the year-on-year and month-on-month commodity indices performance:
|
Cytonn Report: Major Inflation Changes – July 2024 |
|||
|
Broad Commodity Group |
Price change m/m (July-2024/June -2024) |
Price change y/y (July-2024/July-2023) |
Reason |
|
Food and non-alcoholic beverages |
(0.5%) |
5.6% |
The m/m decrease was mainly driven by the decrease in prices of commodities such as tomatoes, wheat flour - brown, and onions by 5.5%, 4.2%, and 4.1%, respectively. However, the decrease was weighed down by an increase in prices of cabbages, carrots, and mangoes by 8.1%, 1.8%, and 1.7%, respectively. |
|
Transport |
(0.1%) |
4.0% |
The m/m decrease recorded in the transport Index was mainly attributable to the decline in the prices of diesel and petrol by 0.9% and 0.5% per litre respectively. |
|
Housing, water, electricity, gas and other fuels |
(0.4%) |
3.9% |
The m/m performance was mainly driven by the decrease in prices of Electricity of 200kWh and 50kWh and kerosene by 9.4%, 4.4%, and 0.8% respectively. However, the price of gas/LPG increased by 0.2%. |
|
Overall Inflation |
(0.2%) |
4.3% |
The m/m decrease was mainly attributable to the 0.5% decrease in Food and non-alcoholic beverages. |
Notably, July’s overall headline inflation was on the decline for the second consecutive month. Furthermore, it has remained within the Central Bank of Kenya (CBK) target range of 2.5% to 7.5% for the thirteenth consecutive month. The decrease in headline inflation in July 2024 comes amid the decline in the prices for Super Petrol, Diesel and Kerosene by Kshs 1.0, Kshs 1.5, and Kshs 1.3 each respectively, and will retail at Kshs 188.9, Kshs 171.6, and Kshs 161.8 per litre respectively from the June 2024 prices of Kshs 189.8, Kshs 173.1, and Kshs 163.1 respectively, for the period between 15th July 2024 to 14th August 2024. The chart below shows the inflation rates for the past 5 years:
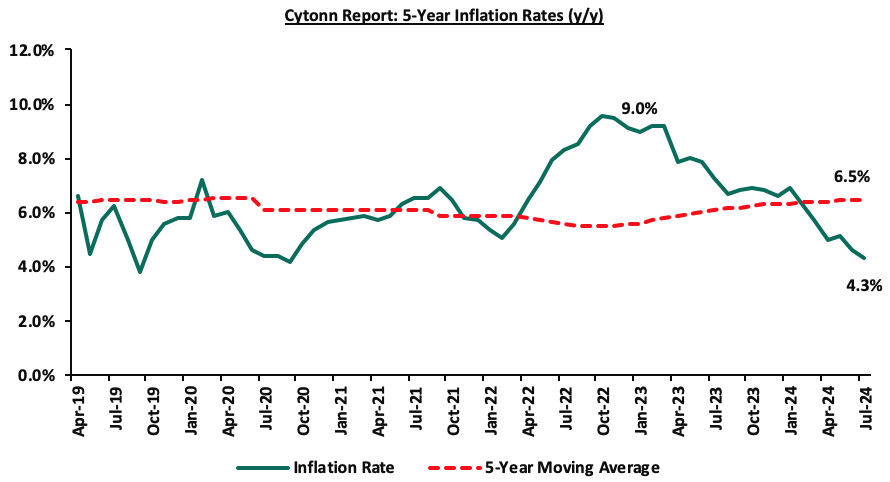
Going forward, we expect inflation to remain within the CBK’s preferred range of 2.5%-7.5%, mainly on the back of a strengthened currency, tight monetary policy, and reducing fuel prices. The risk, however, lies in the fuel prices which despite their decline over the last months, still remain elevated compared to historical levels. Key to note is that the Monetary Policy Committee maintained the Central Bank Rate at 13.0% in its June 2024 meeting, with the aim of anchoring the inflation rates further, and will meet again on 6th August 2024 and we expect the MPC to cut the Central Bank Rate (CBR) to the range of 12.00%-12.50%. In our view, the rate will be pegged on whether the shilling will sustain its appreciation against the dollar, resulting in a decline in the import bill and costs passed to consumers through hiked consumer prices. Additionally, favourable weather conditions may also contribute to stabilizing food prices, further supporting lower inflation rates.
- August 2024 MPC Note Highlight
The Monetary Policy Committee (MPC) is set to meet on Tuesday, 6th August 2024, to review the outcome of its previous policy decisions and recent economic developments, and to decide on the direction of the Central Bank Rate (CBR). We expect the MPC to cut the Central Bank Rate (CBR) to the range of 12.00%-12.50% with their decision mainly being supported by:
- The decrease in y/y inflation in July 2024 to 4.3%, from 4.6% recorded in June 2024, marking the thirteenth consecutive month that inflation has fallen within the CBK target range of 2.5%-7.5%. Despite the risk posed by reduced but still elevated fuel prices, mainly due to high taxes, the overall inflation trend supports a rate cut to stimulate economic growth,
- The recent appreciation of the Shilling and the need to stabilize it from volatility, as other Central Banks maintain high rates. Since the last meeting, the Kenyan Shilling has appreciated by 0.8% against the US Dollar to Kshs 129.9 as of 31st July 2024, from Kshs 130.5 recorded on 5th June 2024. This appreciation is mainly attributable to the eliminated credit risk from the Eurobond buyback and increased dollar supply in the market. A moderate cut in the CBR rate is expected to support this stability without reversing the Shilling’s gains,
- The need to support the economy by adopting an accommodative policy that will ease financing activities. The Purchasing Managers Index (PMI) has come in below the 50.0 threshold, with the June 2024 PMI at 47.2, indicating that the business environment is in the contraction zone. A rate cut would help stimulate economic growth by making borrowing cheaper and encouraging investment and spending,
- The global monetary policy environment. Many central banks worldwide including the Bank of England have either paused or reduced their rates to support their economies. Aligning Kenya's monetary policy with global trends could help maintain the country's competitiveness, attract foreign investment, and ensure that local economic conditions remain favourable in a global context.
For more information, see our Cytonn Note on the 6th August 2024 Monetary Policy Committee (MPC) Meeting here.
- Fitch Ratings Downgrades Kenya’s Credit Rating and Revises Outlook to Stable from Negative
On August 2nd 2024, the global ratings agency, Fitch Ratings announced its revision of Kenya’s credit score, downgrading it to B- from a credit rating of B while also revising the outlook to stable, from a negative outlook affirmed on 16th February 2024. Their decision comes on the back of the government's decision to forgo proposed tax increases through the Finance Bill 2024 and rely on expenditure cuts, significantly impacting Kenya's fiscal trajectory and financing needs. The downgrade reflects heightened risks to Kenya's public finances and external financing.
In response to recent protests, the government withdrew the planned tax increases that were part of the 2024 Finance Bill. These tax measures were originally expected to generate Kshs 346.0 bn, or 1.9% of GDP. Given the current social climate, it is now unlikely that the government can implement these revenue-raising measures. Consequently, the government intends to cut spending by Kshs 177.0 bn, while increasing borrowing and expanding the fiscal deficit to 4.6% of GDP, which is 1.3% points higher than the initially projected 3.3% for fiscal 2025.
The stable outlook reflects Fitch's expectation that continued strong official creditor support will help alleviate near-term external liquidity pressures, although the sovereign's funding needs will remain large and are expected to rise. The tightening of monetary policy will help to keep inflation anchored, providing support for the currency. Additionally, the government’s plan to continue with its fiscal consolidation agenda, although the path to achieving fiscal targets has become increasingly challenging, in Fitch's view.
This move positions Kenya alongside emerging economies like Angola, Nigeria, and Egypt. The downgrade follows Moody’s downgrading Kenya’s IDR to Caa1 from a credit rating of B3 while maintaining a negative outlook on July 8th 2024. Additionally, S&P announced that it would decide, on August 23rd 2024, on whether to cut Kenya’s B credit score by a notch to B- or retain it and keep it on a downgrade warning by maintaining a negative outlook.
To note, Kenya tapped into the international capital markets, having successfully issued a USD 1.5 bn Eurobond with a tenor of 6 years at a coupon rate of 9.75%. This issue follows issues by four other SSA countries earlier in the year. Ivory Coast tapped into the international capital markets on 24th January 2024, successfully issuing two bonds with respective maturities of 8.5 years and 12.5 years and coupon rates of 7.65% and 8.25% respectively, maturing on 30th January 2033 and 30th January 2037 respectively. In addition, Benin issued their debut dollar bond with a tenor of 14 years at a coupon rate of 8.375% on February 6th 2024. On June 6th 2024, Senegal followed suit by issuing a USD 750.0 mn Eurobond with a maturity of 7 years and a coupon rate of 7.75%. Also, on 23rd July 2024, Cameroon announced the issuance of a USD 550.0 mn Eurobond with a tenor of 7 years at a coupon rate of 9.5% and a yield of 10.75%.
Below is a table comparing Kenya, Ivory Coast, Senegal, Cameroon Benin’s Fitch’s credit rating and a summary of the Eurobond issues:
|
Cytonn Report: Moody’s Rating's Long-Term Foreign-Currency Issuer Default Rating (IDR) |
||||||||
|
Fitch’s Rating's Long-Term Foreign-Currency Issuer Default Rating (IDR) |
2024 Eurobond Issues |
|||||||
|
Country |
IDR Credit Rating |
IDR Credit Outlook |
Rating Date |
Value (USD mn) |
Tenor (Years) |
Coupon Rate |
Yield at issuance |
Issuance Date |
|
Ivory Coast |
BB- |
Stable |
Feb-2024 |
1,100.0 |
8.5 |
7.650% |
7.875% |
Jan-24 |
|
1,500.0 |
12.5 |
8.250% |
8.50% |
|||||
|
Benin |
B+ |
Stable |
Mar-2024 |
750.0 |
14.0 |
8.375% |
8.40% |
Feb-24 |
|
Kenya |
B- |
Stable |
Aug-2024 |
1,500.0 |
6.0 |
9.750% |
10.375% |
Feb-24 |
|
Senegal |
B |
Stable |
Feb-2024 |
750.0 |
7.0 |
7.75% |
7.75% |
Jun-24 |
|
Cameroon |
B |
Negative |
May-24 |
550.0 |
7.0 |
9.5% |
10.75 |
Jul-24 |
Below is a summary of the credit rating on Kenya by various rating agencies;
|
Cytonn Report: Kenya’s Credit Ratings |
||||||
|
Rating Agency |
Previous Rating |
Previous Outlook |
Current Rating |
Current Outlook |
Meaning |
Date Released |
|
Moody's Rating |
B3 |
Negative |
Caa1 |
Negative |
Substantial credit risks |
8th July, 2024 |
|
Fitch Ratings |
B |
Negative |
B- |
Stable |
Highly Speculative |
2nd August 2024 |
|
S&P Global |
B |
Negative |
B |
Negative |
Highly Speculative |
9th February 2024 (Expected release on 23rd August 2024)* |
Source: Fitch Ratings, S&P Global
Going forward, Kenya's government faces the challenge of managing a fiscal strategy that relies on expenditure cuts rather than revenue-driven through the planned tax increases. This approach, coupled with ongoing social tensions, is likely to prolong fiscal deficits, weaken debt affordability, and increase liquidity risks. Limited external financing options further complicate the government's ability to meet substantial borrowing needs. Clear fiscal management and policy coherence will be crucial to maintaining investor confidence and achieving sustainable economic growth.
Monthly Highlights:
- During the month, the Kenya National Bureau of Statistics (KNBS) released the Q1’2024 Quarterly Gross Domestic Product Report, highlighting that the Kenyan economy recorded a 5.0% growth in Q1’2024, slower than the 5.5% growth recorded in Q1’2023. The main contributor to Kenyan GDP remains to be the Agriculture, Fishing, and Forestry sector which grew by 6.1% in Q1’2024, lower than the 6.4% expansion recorded in Q1’2023. All sectors in Q1’2024, except Mining and Quarrying, recorded positive growths, with varying magnitudes across activities. Most sectors recorded a decline compared to Q1’2023 with Accommodation and Food Services, Mining & Quarrying, and Construction Sectors recording the highest declines of 19.1%, 3.8%, and 2.9% points, respectively. Other sectors that recorded a contraction in growth rate, from what was recorded in Q1’2023 were the Transport and Storage, Other Services, and Public Administration sectors of 2.8%, 2.1%, and 1.8% points respectively. Please see our Cytonn Weekly 27/2024,
- During the month, the Kenya National Bureau of Statistics released the Q1’2024 Quarterly Balance of Payment & International Trade Report highlighting that Kenya’s balance of payments position improved by by 126.4% in Q1’2024, coming in at a surplus of Kshs 33.8 bn, from a deficit of Kshs 127.8 bn in Q1’2024, and a significant improvement from the Kshs 134.8 bn deficit recorded in FY’2023. Please see our Cytonn Weekly 27/2024,
- During the month, Stanbic Bank released its monthly Purchasing Manager's Index (PMI) highlighting that the index for the month of June 2024 sharply deteriorated, coming in at 47.2, below the 50.0 neutral, down from 51.8 in May 2024, signaling a deterioration in the operating conditions across Kenya. Please see our Cytonn Weekly 27/2024,
- During the month, the global ratings agency, Moody’s announced its revision of Kenya’s credit score, downgrading it by one scale to Caa1 from a credit rating of B3 while maintaining a negative outlook, on the back of the government's decision to forgo proposed tax increases through the Finance Bill 2024 and rely on expenditure cuts, significantly impacting Kenya's fiscal trajectory and financing needs. Please see our Cytonn Weekly 28/2024,
- During the month, the Kenya Revenue Authority (KRA) released the annual revenue performance for FY’2023/24, highlighting that revenue mobilization for the period grew by a notable 11.1% up from 6.4 % growth in the previous financial year, after KRA collected Kshs 2.4 tn compared to Kshs 2.2 tn in the previous financial year. This translates to a performance rate of 95.5% against the target. Please see our Cytonn Weekly 28/2024,
- During the month, the Central Bank of Kenya (CBK) released the annual bank supervision report for FY’2023, highlighting that the banking sector registered a decrease in profitability during the year, with profit before tax decreasing by 8.8% to Kshs 219.2 bn in 2023 from the Kshs 240.4 bn recorded in 2022. The sector’s capital and reserves increased by 6.8% to Kshs 980.2 bn in 2023, from Kshs 917.6 bn in 2022. The report also reviewed the various developments in the banking sector, including regulatory changes in the banking sector, macroeconomic conditions, and sector performance. Please see our Cytonn Weekly 29/2024,
- During the week, Cameroon announced the issuance of a USD 550.0 mn Eurobond with a tenor of 7 years at a coupon rate of 9.5% and a yield of 10.75%, becoming the fifth country in the Sub-Saharan Africa (SSA) region, following Ivory Coast, Benin, Senegal, and Kenya to tap into the international capital markets in 2024. The bond was undersubscribed, with the undersubscription rate coming in at 98.9%, receiving USD 550.0 mn (332.2 bn CFA Francs) of the CFA 336.0 bn offered The issuance was conducted through a private placement, with Citigroup Global Markets Ltd serving as the sole placement agent and arranger alongside Cygnum Capital Middle East. Please see our Cytonn Weekly 30/2024, and,
- During the month, the National Treasury presented the Supplementary Estimates I for the Fiscal Year 2024/25 to the National Assembly. This presentation outlined plans to adjust the FY 2024/25 Budget Estimates to align with the Revised Fiscal Framework and implement expenditure cuts. Please see our Supplementary Budget Estimates I FY’2024/25 Note.
Rates in the Fixed Income market have been on an upward trend given the continued high demand for cash by the government and the occasional liquidity tightness in the money market. The government is 23.2% ahead of its prorated net domestic borrowing target of Kshs 41.2 bn, having a net borrowing position of Kshs 50.8 bn. However, we expect a downward readjustment of the yield curve in the medium and long term, with the government looking to increase its external borrowing to maintain the fiscal surplus, hence alleviating pressure in the domestic market. As such, we expect the yield curve to normalize in the medium to long-term and hence investors are expected to shift towards the long-term papers to lock in the high returns.
Market Performance:
During the month of July 2024, the equities market was on a downward trajectory, with NSE 10 declining the most by 1.7%, while NSE 25, NSE 20, and NASI declined by 1.6%, 1.3%, and 0.8% respectively. The equities market performance was driven by losses recorded by large-cap stocks such as Safaricom, Equity, and Standard Chartered Group of 8.1%, 4.1%, and 3.0% respectively. The losses were, however, mitigated by gains recorded by large-cap stocks such as Bamburi, EABL, and Stanbic of 48.3%, 7.7%, and 1.5% respectively.
During the week, the equities market was on a downward trajectory, with NSE 10 and NSE 25 being the biggest decliners by 1.0% each, while NASI and NSE 20 declined by 0.9% each, taking the YTD performance to gains of 18.2%, 16.0%, 12.3%, and 10.0% for NSE 10, NSE 25, NASI, and NSE 20 respectively. The equities market performance was driven by losses recorded by large-cap stocks such as NCBA, KCB, and BAT of 4.5%, 3.1%, and 2.9% respectively. The performance was, however, supported by gains recorded by large-cap stocks such as Bamburi, EABL, and Stanbic of 2.0%, 1.6%, and 0.9% respectively.
Equities turnover increased by 11.6% in the month of July 2024 to USD 45.0 mn, from USD 40.3 mn recorded in June 2024. Foreign investors became net sellers, with a net selling position of USD 4.8 mn, from a net buying position of USD 3.6 mn recorded in June 2024.
During the week, equities turnover decreased by 23.2% to USD 9.3 mn from USD 12.1 mn recorded the previous week, taking the YTD total turnover to USD 395.7 mn. Foreign investors remained net sellers with a net selling position of USD 2.5 mn, from a net selling position of USD 2.6 mn recorded the previous week, taking the YTD foreign net buying position to USD 1.0 mn.
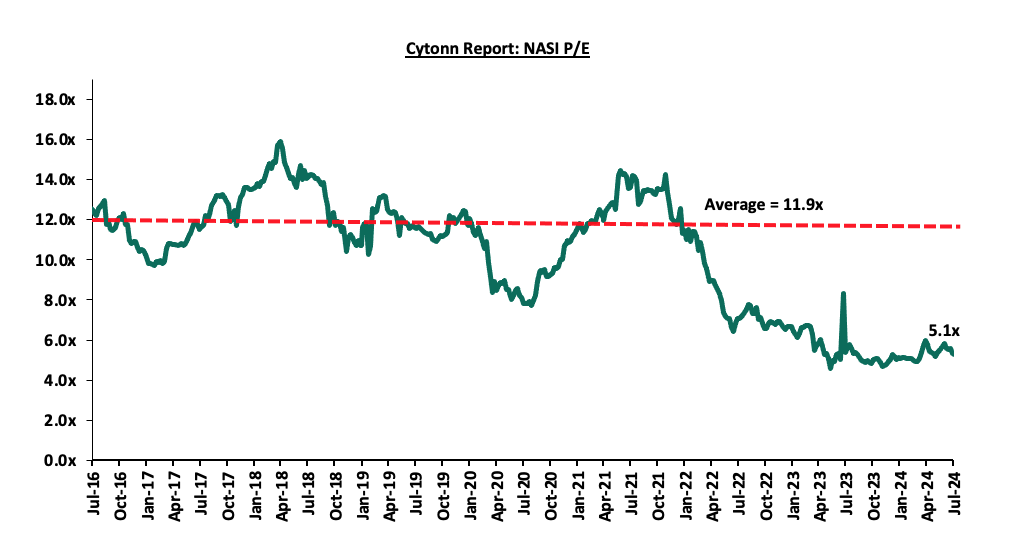
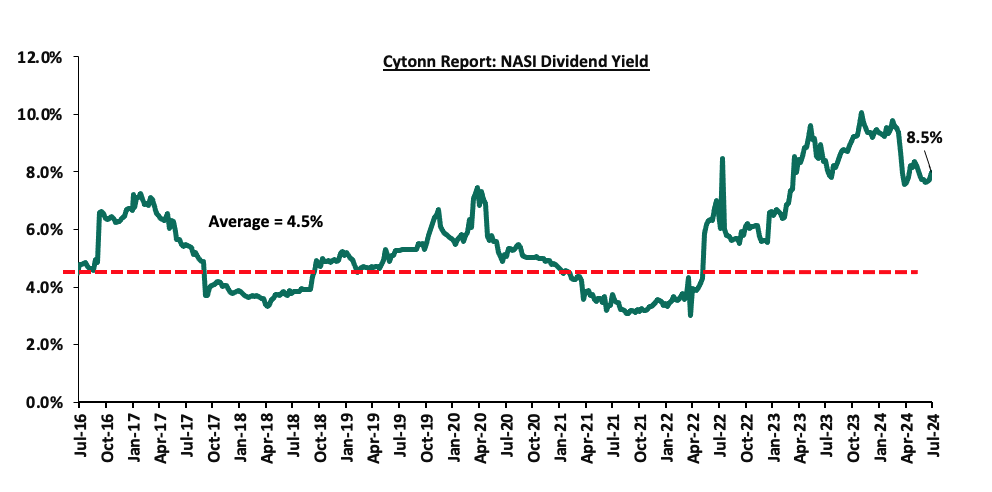
The market is currently trading at a price-to-earnings ratio (P/E) of 5.1x, 57.2% below the historical average of 11.9x. The dividend yield stands at 8.5%, 3.9% points above the historical average of 4.5%. Key to note, NASI’s PEG ratio currently stands at 0.6x, an indication that the market is undervalued relative to its future growth. A PEG ratio greater than 1.0x indicates the market is overvalued while a PEG ratio less than 1.0x indicates that the market is undervalued. The charts below indicate the historical P/E and dividend yields of the market;
Universe of Coverage:
|
Cytonn Report: Equities Universe of Coverage |
||||||||||
|
Company |
Price as at 26/07/2024 |
Price as at 26/07/2024 |
w/w change |
YTD Change |
Year Open 2024 |
Target Price* |
Dividend Yield |
Upside/ Downside** |
P/TBv Multiple |
Recommendation |
|
Jubilee Holdings |
164.0 |
160.0 |
(2.4%) |
(13.5%) |
185.0 |
260.7 |
8.9% |
71.8% |
0.3x |
Buy |
|
Equity Group*** |
41.3 |
40.5 |
(2.1%) |
18.3% |
34.2 |
60.2 |
9.9% |
58.7% |
0.8x |
Buy |
|
NCBA*** |
40.9 |
39.1 |
(4.5%) |
0.5% |
38.9 |
55.2 |
12.2% |
53.5% |
0.8x |
Buy |
|
Diamond Trust Bank*** |
46.5 |
46.0 |
(1.0%) |
2.8% |
44.8 |
65.2 |
10.9% |
52.6% |
0.2x |
Buy |
|
KCB Group*** |
31.8 |
30.8 |
(3.1%) |
40.3% |
22.0 |
46.7 |
0.0% |
51.5% |
0.5x |
Buy |
|
Co-op Bank*** |
12.9 |
12.9 |
(0.4%) |
13.2% |
11.4 |
17.2 |
11.7% |
45.5% |
0.6x |
Buy |
|
Stanbic Holdings |
115.5 |
116.5 |
0.9% |
9.9% |
106.0 |
145.3 |
13.2% |
37.9% |
0.8x |
Buy |
|
CIC Group |
2.1 |
2.1 |
2.4% |
(6.6%) |
2.3 |
2.8 |
6.1% |
36.9% |
0.7x |
Buy |
|
I&M Group*** |
20.7 |
20.7 |
0.0% |
18.3% |
17.5 |
25.5 |
12.3% |
35.8% |
0.4x |
Buy |
|
ABSA Bank*** |
14.1 |
14.0 |
(0.4%) |
21.2% |
11.6 |
17.3 |
11.1% |
34.6% |
1.1x |
Buy |
|
Britam |
5.7 |
5.7 |
(1.0%) |
10.5% |
5.1 |
7.5 |
0.0% |
32.0% |
0.8x |
Buy |
|
Target Price as per Cytonn Analyst estimates **Upside/ (Downside) is adjusted for Dividend Yield ***For Disclosure, these are stocks in which Cytonn and/or its affiliates are invested in |
||||||||||
Monthly Highlights
- During the month, Amsons Industries (K) Limited announced its intention to acquire 100% of the ordinary shares of Bamburi Cement Plc with a par value of Kshs 5.0 each for a cash consideration. The offer placed is of a total value of Kshs 23.6 bn, translating to a purchase price of Kshs 65.0 per share. This offer has been made in accordance to the Capital Markets (Take-overs & Mergers) Regulations, 2002. This acquisition, if successful, will make Amsons Industries (K) Limited the sole owner of Bamburi Cement Plc; For more details please see our Cytonn Weekly #28/2024, and,
- During the month, British American Tobacco Kenya Plc released their H1’2024 financial results, recording a 24.3% decline in Profits after Tax (PAT) to Kshs 2.1 bn, from Kshs 2.8 bn recorded in H1’2023. The decline in PAT was majorly attributed to the 6.5% decrease in Gross Sales to Kshs 19.6 bn in H1’2024 from Kshs 21.0 bn recorded in H1’2023. For more details, please see our Cytonn Weekly #30/2024.
Weekly Highlights
- Centum Investments Company PLC FY’2024 Financial Performance
During the week, Centum Investments Company PLC released their FY’2024 financial results for the period ending 31st March 2024, recording a significant 135.6% increase in the Profits After Tax (PAT) to Kshs 2.6 bn in FY’2024, from a loss of Kshs 7.3 bn in FY’2023. The increase was mainly attributable to a 294.9% increase in profit from the finance and investment operations business to Kshs 2.1 bn in FY’2024, from a loss of Kshs 1.1 bn in FY’2023, coupled with a significant 130.5% increase in profit from their Real Estate business to Kshs 1.5 bn, from a loss of Kshs 5.1 bn in FY’2023. However, the performance was weighed down by a significant 493.1% increase in loss in their trading business to Kshs 0.7 bn in FY'2024 from Kshs 0.1 bn in FY'2023. The tables below show the breakdown of the Group’s financial performance;
|
Cytonn Report: Centum Investments Company PLC Income Statement |
|||
|
Income Statement |
FY'2023 |
FY'2024 |
y/y change |
|
(Kshs. Bn) |
(Kshs. Bn) |
(%) |
|
|
Trading Business |
|||
|
Sales |
2.0 |
2.6 |
32.3% |
|
Cost of sales |
(1.2) |
(2.1) |
68.6% |
|
Gross Profit |
0.7 |
0.5 |
(29.9%) |
|
Operating and Administrative expenses |
(0.7) |
(1.0) |
39.7% |
|
Finance Costs |
(0.1) |
(0.2) |
65.0% |
|
Profit/(loss) from Trading Business |
(0.1) |
(0.7) |
493.1% |
|
Real Estate Business |
|||
|
Sales and other income |
4.5 |
7.9 |
75.7% |
|
Cost of sales |
(1.9) |
(3.5) |
89.5% |
|
Gross profit |
2.6 |
4.3 |
65.8% |
|
Operating expenses |
(0.9) |
(0.8) |
(6.5%) |
|
Finance and other costs |
(6.8) |
(2.0) |
(71.0%) |
|
Profit/(loss) from Real Estate Business |
(5.1) |
1.5 |
130.5% |
|
Finance and Investments services |
|||
|
Income from provision of financial services |
6.4 |
4.0 |
(36.7%) |
|
Investment and other income |
0.2 |
4.1 |
1627.0% |
|
Operating expenses |
(3.0) |
(2.6) |
(15.6%) |
|
Finance costs |
(0.5) |
(0.8) |
64.1% |
|
Other expenses |
(4.2) |
(2.7) |
(34.7%) |
|
Profit/(loss) from finance and investments business |
(1.1) |
2.1 |
294.9% |
|
Profit/(loss) before tax for the year |
(6.3) |
2.9 |
146.5% |
|
Income tax (expense)/credit |
(1.1) |
(0.3) |
(71.4%) |
|
Profit/(loss) after tax for the year |
(7.3) |
2.6 |
135.6% |
|
Earnings Per Share |
(6.3) |
4.3 |
(167.6%) |
|
Dividend per share |
0.6 |
0.3 |
(46.7%) |
|
Dividend yield |
6.7% |
3.6% |
(3.1%) |
|
Dividend payout ratio |
(5.5%) |
8.2% |
13.6% |
Source: Centum Investments Company PLC FY’2024 financial statements
|
Cytonn Report: Centum Investments PLC Balance Sheet |
|||
|
Balance Sheet |
FY'2023 |
FY'2024 |
y/y change |
|
(Kshs. Bn) |
(Kshs. Bn) |
(%) |
|
|
Investment Portfolio |
60.5 |
66.5 |
10.0% |
|
Assets held for sale |
42.7 |
0.0 |
(100.0%) |
|
Other assets |
8.4 |
8.2 |
(2.6%) |
|
Cash and cash equivalents |
1.2 |
1.4 |
21.5% |
|
Total assets |
112.7 |
76.2 |
(32.4%) |
|
Borrowings |
19.7 |
16.6 |
(15.7%) |
|
Other liabilities |
18.6 |
19.8 |
6.3% |
|
Liabilities directly associated with assets classified as held for sale |
37.3 |
0.0 |
(100.0%) |
|
Total liabilities |
75.6 |
36.4 |
(51.9%) |
|
Total Equity |
37.1 |
39.8 |
7.2% |
|
Total Equity and Liabilities |
112.7 |
76.2 |
(32.4%) |
Source: Centum Investments Company PLC FY’2024 financial report
Key take outs from the financial performance include;
- Profits from the Real Estate business increased significantly by 130.5% to Kshs 1.5 bn in FY’2024, from a loss of Kshs 5.1 bn recorded in FY’2023, mainly attributable to a 93.5% increase in residential unit sales to Kshs 3.7 bn in FY’2024 from Kshs 1.9 bn recorded in FY’2023 coupled with a 54.5% decline in finance costs from the Two Rivers investment operations to Kshs 0.9 bn in FY’2024 from Kshs 2.0 bn recorded in FY’2023,
- Losses from the Group’s trading business increased significantly by 493.1% to Kshs 0.7 bn in FY’2024, from a loss of Kshs 0.1 bn recorded in FY’2023, mainly attributable to a 68.6% increase in cost of sales to Kshs 2.1 bn in FY’2024 from Kshs 1.2 bn recorded in FY’2023, in addition to the 65.0% increase in finance costs to Kshs 0.2 bn in FY’2024 from Kshs 0.1 bn recorded in FY’2023,
- The Group witnessed a significant 294.9% profit growth from finance and investments operations business to Kshs 2.1 bn, from Kshs the 1.1 bn loss recorded in FY’2023, mainly attributable to a Kshs 3.4 bn gain in the value of investment properties in the Two Rivers Special Economic Zone, coupled with a significant 1627.0% increase in investment and other income to Kshs 4.1 bn in FY’2024 from the 0.3 bn recorded in FY’2023,
- The Group’s balance sheet recorded a contraction, with the total assets decreasing by 32.4% to Kshs. 76.2 bn in FY’2024 from the Kshs 112.7 bn recorded in FY’2023. This is mainly attributable to a sale of assets worth Kshs 42.7 bn during the period, coupled with a 2.6% decrease in other assets to Kshs 8.2 bn in FY’2024 from Kshs 8.4 bn in FY’2023, and,
- Annualized Earnings per share increased significantly by 167.6% to Kshs 4.3, from the Kshs 6.3 loss per share in FY’2023, largely driven by a 135.6% increase in profit after tax to Kshs 2.6 bn, from Kshs 7.3 bn loss in FY’2023. Additionally, the board of directors has recommended a first and final dividend of Kshs 0.32 per share, a 46.7% decrease from the Kshs 0.6 dividend declared in FY’2023. This translates to a dividend payout ratio of 8.2% and a dividend yield of 3.6%. Key to note, Centum initiated the share buyback program on the 6th of February 2023 at an offer price of Kshs 9.03. As of 26th July 2024, 9.7 million shares had been purchased under the buyback program, comprising 24% of the volume traded. The ongoing share buyback is expected to contribute to an increase in Earnings per share by reducing the number of outstanding shares.
FY’2023/24 marked the close of the Centum 4.0 strategy period. The focus during this period was preservation of shareholder value against the backdrop of a difficult economic environment characterized by the Covid-19 pandemic, global geopolitical conflicts that disrupted supply chains and had a spiral effect in local and regional key economic indicators. Despite these headwinds, Centum managed to preserve shareholder value, achieving an increase in profit after tax for the year of Kshs 2.9 bn. We expect the Group’s profitability to improve in the long-term following the Group’s transition into the new strategy period named Centum 5.0, with a focus on optimizing the value of the current portfolio of investments. The company is working towards scaling up various businesses and monetizing them to realize a minimum of their carrying values. This strategic shift aims to enhance shareholder returns and stabilize financial performance amidst the prevailing economic challenges
- East African Breweries Plc (EABL) FY’2024 Financial Performance
During the week, East African Breweries Plc (EABL) released their FY’2024 financial results for the period ending 30th June 2024, recording an 11.8% decline in the Profits After Tax (PAT) to Kshs 10.9 bn in FY’2024, from Kshs 12.3 bn in FY’2023. The decline was mainly attributable to an 18.4% increase in Operating costs to Kshs 25.0 bn in FY’2024, from Kshs 21.1 bn in FY’2023, coupled with the 84.3% increase in net finance costs to Kshs 8.2 bn, from Kshs 5.5 bn in FY’2023 that offset the 13.5% growth in Gross profit to Kshs 53.8 bn in FY'2024 from Kshs 47.4 bn in FY'2023. The tables below show the breakdown of the Group’s financial performance;
|
Cytonn Report: East African Breweries Plc (EABL) Summarized Income Statement |
|||
|
Income Statement |
FY'2023 |
FY'2024 |
Y/Y Change |
|
Kshs (bn) |
Kshs (bn) |
||
|
Net revenue |
109.6 |
124.1 |
13.2% |
|
Cost of Sales |
(62.2) |
(70.3) |
13.0% |
|
Gross Profit |
47.4 |
53.8 |
13.5% |
|
Operating Costs |
(21.1) |
(25.0) |
18.4% |
|
Operating Profit |
26.3 |
28.8 |
9.6% |
|
Forex losses |
(2.1) |
(3.9) |
84.3% |
|
Net Finance Costs |
(5.5) |
(8.2) |
49.0% |
|
Profit Before Income Tax |
18.7 |
16.8 |
(10.4%) |
|
Income Tax Expenses |
(6.4) |
(5.9) |
(7.6%) |
|
Profit After Tax |
12.3 |
10.9 |
(11.8%) |
|
Earnings Per Share-Annualized |
12.5 |
10.3 |
(17.4%) |
|
Dividend Per Share |
5.5 |
7.0 |
27.3% |
|
Dividend yield |
3.5% |
4.5% |
1.0% |
|
Dividend payout ratio |
35.3% |
50.9% |
15.6% |
Source: East African Breweries Plc (EABL) FY’2024 financial statements
|
Cytonn Report: East African Breweries Plc (EABL) Summarized Balance Sheet |
|||
|
Balance Sheet |
FY'2023 |
FY'2024 |
Y/Y Change |
|
Kshs (bn) |
Kshs (bn) |
||
|
Current Assets |
43.4 |
41.6 |
(4.3%) |
|
Non-Current Assets |
89.2 |
82.7 |
(7.3%) |
|
Total Assets |
132.6 |
124.2 |
(6.3%) |
|
Short-term borrowings |
8.9 |
5.6 |
(36.5%) |
|
Other Current Liabilities |
33.0 |
30.5 |
(7.6%) |
|
Total Current Liabilities |
41.9 |
36.1 |
(13.7%) |
|
Long-term Borrowings |
51.0 |
43.3 |
(15.1%) |
|
Other Non-Current Liabilities |
7.9 |
8.1 |
1.8% |
|
Total Non-Current Liabilities |
59.0 |
51.4 |
(12.9%) |
|
Total Liabilities |
100.8 |
87.5 |
(13.2%) |
|
Total Equity |
31.7 |
36.7 |
15.7% |
Source: East African Breweries Plc (EABL) FY’2024 financial report
Key take outs from the financial performance include;
- Net revenue increased by 13.2% to Kshs 124.1 bn in FY’2024, from Kshs 109.6 bn recorded in FY’2023, mainly attributable to strategic pricing, a strong portfolio, and innovation launches. Further, EABL’s diversified geographical footprint helped mitigate volatility. Notably, Kenya, Uganda, and Tanzania subsidiaries recorded strong growth registering 15.0%, 12.0%, and 9.0% increases in net revenue, respectively,
- Operating costs increased by 18.4% to Kshs 25.0 bn, from Kshs 21.1 bn attributable to significant increases in interest rates and social unrest which disrupted operations in Kenya during the period of review,
- Cost of sales increased by 13.0% to Kshs 70.3 bn, from Kshs 62.2 bn in FY’2023, mainly attributable to increased cost of inputs occasioned by heightened inflationary pressures coupled with the strained business and entrepreneurial environment in the group’s region of operation,
- The Group’s balance sheet recorded a contraction, with the total assets decreasing by 6.3% to Kshs 124.2 bn in FY’2024 from Kshs 132.6 bn recorded in FY’2023 mainly attributable to a 7.3% decrease in non-current assets to Kshs 82.7 bn in FY’2024 from Kshs 89.2 bn in FY’2023. In addition, total liabilities recorded a 13.2% decline to Kshs 87.5 bn in FY’2024 from Kshs 100.8 bn in FY’2023, mainly driven by a 36.5% decrease in short-term borrowings to Kshs 5.6 bn in FY’2024 to Kshs 8.9 bn in FY’2023,
- The Group’s short-term borrowing decreased by 36.5% to Kshs 5.6 bn, from Kshs 8.9 bn recorded in FY’2023, while the long-term borrowings decreased by 15.1% to Kshs 43.3 bn, from the Kshs 51.0 bn in FY’2023 an indication of the group’s strategic shift in its debt financing, and,
- Annualized Earnings per share decreased by 17.4% to Kshs 10.3, from Kshs 12.5 in FY’2023, largely driven by an 11.8% decrease in profit after tax to Kshs 10.9 bn, from Kshs 12.3 bn in FY’2023. Additionally, the board of directors has recommended a final dividend of Kshs 6.0 per share expected to be paid by 28th October 2024. If approved, the total dividend for the year will amount to Kshs 7.0 per share, a 27.3% increase from the Kshs 5.5 dividend per share paid out in FY’2023. This translates to a dividend payout ratio of 50.9% and a dividend yield of 4.5%.
Following the challenging macroeconomic environment arising from significant increases in interest rates, currency devaluation, cost inflation, and the impacts of El Niño rains and social unrest, EABL has experienced a strained financial performance as evidenced by the decline in profitability by 11.8% as well as the 17.4% decline in earnings per share in FY’2024. Key to note, EABL realized a significant 84.3% increase in foreign exchange losses owing to the aggressive depreciation of the local currencies in the Group’s region of operation. For instance, the Tanzania Shilling and the Uganda Shilling depreciated by 9.1% and 1.1% respectively against the US Dollar for the period under review, while the Kenyan Shilling gained by 7.8% during the same period. In our view, the Group’s earnings will be supported by the group’s continued diversification efforts as evidenced by the commissioning of a Kshs 1.2 bn Microbrewery with new production facilities created to explore innovation and experimentation in Kenya. The launch of the Microbrewery has seen the business extend its innovation capability, to meet consumers’ changing tastes and preferences. Additionally, EABL’s outstanding advertising and promotions through various channels are expected to continue supporting revenue growth. Moreover, the Group’s announcement of a final dividend of Kshs 6.0 per share for the period ending 30th June 2024 is expected to boost investors’ confidence in the Group’s stock.
We are “Neutral” on the Equities markets in the short term due to the current tough operating environment and huge foreign investor outflows, and, “Bullish” in the long term due to current cheap valuations and expected global and local economic recovery. With the market currently being undervalued for its future growth (PEG Ratio at 0.8x), we believe that investors should reposition towards value stocks with strong earnings growth and that are trading at discounts to their intrinsic value. We expect the current high foreign investors’ sell-offs to continue weighing down the equities outlook in the short term.
- Industry Report
During the week, Hass Consult, a Kenyan consulting and Real Estate development firm, released its House Price Index Q2’2024 Report, focusing on the residential Real Estate sector's performance in the Nairobi Metropolitan Area (NMA). The following are the key takeouts from the report;
- The average selling prices for all properties posted a 1.0% increase on a quarter-on-quarter (q/q) basis in Q2’2024, an improvement from a 0.5% decrease in Q2’2023. The performance can be linked to a 1.3% increase in detached house prices, coupled with a 0.6% increase in apartment unit prices. Similarly, semi-detached units registered a 0.4% uptick in selling prices, bolstering the overall performance. On a year-on-year (y/y) basis, property prices showed a 6.8% uptick, contrasting from a 1.8% decrease witnessed in Q2’2023. The surge in property prices is attributed to rising interest rates during the period under review, where we witnessed the Monetary Policy Rate (MPR) hit a historic 13.0%, further pushing up the cost of financing house purchases. Additionally, the ripple effects of high inflationary pressure and the depreciation of the Kenyan currency witnessed in FY’2023 continue to prevail, where investors increased the selling prices as they tried to remain afloat. In addition, developers are experiencing an increase in the cost of construction, which compels them to transfer the cost to home buyers,
- The average asking rents of housing units in the NMA during the period under review increased slightly by 0.01% on a q/q basis, slightly lower compared to a 0.1% increase recorded in Q2’2023. On a y/y basis, the average asking rent increased by 3.3% compared to the 2.1% decline recorded in Q2’2023. The increase in performance was attributable to increased rents in apartments and detached houses, registering q/q improvements of 0.5% and 0.03% respectively in Q2’2024, as landlords tried to hedge against a tough operating environment,
- Apartments registered the highest y/y increase in asking rents of 9.2% in Q2’2024, an improvement from 0% increase in Q2’2023. In addition, semi-detached and detached units witnessed 3.2% and 0.2% increases in asking rents respectively, a major turnaround from the 5.4% and 3.2% decline recorded in Q2’2023. The increase can be linked to an expanding middle class, with more individuals entering this income bracket hence driving the rental rates in apartments and semi-detached units which are more affordable. Simultaneously, some individuals are moving up from the middle class to a higher income bracket hence driving the price in detached units,
- Within the Nairobi Suburbs’ detached and semi-detached houses market, Kilimani ranked as the best-performing node, registering a y/y sales price appreciation of 9.3%. This surge can be attributed to factors such as i) close proximity to the Central Business District (CBD) and other residential areas such as Westlands, Lavington, Kileleshwa, and Karen, ii) a good concentration of retail outlets which enhances its convenience, iii) availability of quality houses attracting the middle-class, iv) a rich network work of roads which enhances its connectivity to other areas, and, v) abundance of many amenities such as schools and hospitals. In contrast, Runda posted the highest year-on-year rental price correction of 1.2%, mainly due to reduced demand for houses in the area, prompted by the pursuit of more affordable housing alternatives and stiff competition from neighboring areas such as Nyari and Kitisuru,
- In the Nairobi Suburbs apartments, Kileleshwa was the best-performing region recording a y/y capital appreciation of 7.7%, due to; i) its close proximity to social commercial, social, and recreational amenities such as Fogo Gaucho, and the Lavington Mall among other retail outlets, ii) close proximity to Central Business District and due to good road connectivity reducing commute time, and, iii) an expanding middle-class population in the area is increasing the demand for apartments. On the other hand, Upperhill realized the highest y/y price correction of 8.3% as it experienced reduced demand as residents preferred neighboring areas such as Kilimani and Spring Valley;
- In the satellite towns, properties in Juja posted the highest year-on-year price appreciation, coming in at 13.1%. This surge can be linked to several factors: i) good connectivity by the Thika Super Highway, ii) a growing preference by the middle class to establish families in this area, iii) close proximity to retail centres such as the Unicity Mall and Juja City Mall, iv) close proximity to amenities such as learning institutions such as the Jomo Kenyatta University of Agriculture and Technology (JKUAT) and hospitals. Conversely, Kiambu recorded the lowest year-on-year price increase of 3.7%, due to stiff competition from neighboring areas like Ruiru and Ruaka, which are becoming increasingly preferred by residents seeking a better residential community,
- In satellite towns’ apartments, Thika recorded the highest y/y price appreciation of 11.7% which was supported by good infrastructure such as the Thika Super Highway, a growing middle class population in the area, its increasing reputation hub for investment due to a high population, and proximity to an array of social amenities and retail outlets. Conversely, Ngong registered the lowest y/y price appreciation of 1.3% attributed to stiff competition faced from neighbourhoods such as Langata and Ongata Rongai which enjoy closer proximity to Nairobi CBD and are more affordable.
The findings of the report are in line with our Cytonn Markets Review – Q2’2024, highlighting that selling prices of residential properties in the Nairobi Metropolitan Area (NMA) recorded a 0.6% appreciation in Q2’2024. The performance was supported by 0.6% price appreciation realized by apartments and 0.5% price appreciation by detached and semi-detached units each during the period under review.
Hass Consult also released the Land Price Index Q2’2024 Report which highlighted the performance of the Real Estate land sector in the Nairobi Metropolitan Area (NMA). The following were the key take outs from the report;
- The average q/q selling prices for land in the Nairobi suburbs grew by 1.8%, compared to a 0.06% decline recorded in Q2’2023. On a y/y basis, the performance represented a 6.9% increase, compared to the 1.2% increase recorded in Q2’2023. Consequently, q/q and y/y land prices in satellite towns of Nairobi increased by 2.2% and 12.3% respectively, compared to the 1.2% and 5.1% growth respectively, recorded in Q2’2023. The ongoing market improvement highlights the sector’s resilience, with rising demand driven by emerging opportunities in retail, manufacturing, and logistics to support the rapidly urbanizing towns and the Nairobi CBD,
- Spring Valley was the best-performing node in the Nairobi suburbs with a y/y price appreciation of 11.9%. This was attributed to; i) its close proximity to commercial, social, educational institutions and recreational amenities such as the West Gate and Village Market malls, ii) enhanced accessibility due to good road connectivity, iii) increased preference compared to neighboring areas such as Kitisuru by land buyers. Conversely, land in Kileleshwa recorded the lowest y/y price appreciation of 0.4%. This can be linked to land buyer’s increased preference for adjacent Lavington and Kilimani areas, which provide a broader range of amenities, including superior infrastructure, closer proximity to retail centers, and a more established residential community, and,
- For satellite towns, Juja was the best-performing node with a y/y capital appreciation of 20.1%, followed by Kiserian which recorded a y/y capital appreciation of 15.3%. The improvement in performance in Juja was driven by; i) increased demand for land due to its affordability with the average price per acre coming in at Kshs 25.6 mn, ii) its enhanced access via Thika Super Highway, iii) wide variety of social amenities and school, and, iv) close proximity to other areas such as Ruiru and Thika. On the other hand, land prices in Kiserian were bolstered by its strategic location via the Forestline Road, facilitating easy access to other residential areas such as Ngong. Conversely, Thika was the least performing node with a y/y price appreciation of 5%, attributable to increased competition from the neighboring areas which are closer in proximity to the CBD and other urban areas.
The findings of the report are also in line with our Cytonn Markets Review – H1’2024 which highlighted that the overall average selling prices for land in the NMA appreciated by 3.9% to record an average price per acre of Kshs 132.7 mn per acre in H1’2024. This was mainly attributed to; i) limited supply of land especially in urban areas which has contributed to rising land prices, ii) heightened construction activity, especially in the residential sector, driven by the government’s affordable housing agenda, which in turn boosts demand for land, iii) rising middle-income class population with more disposable income to invest, iv) growth in popularity of satellite towns by investors and buyers which provide affordable land options in comparison to the suburbs and key commercial zones, v) land continues to be highly valued as security by middle-class families, who place significant importance on owning land and are willing to invest large amounts of capital to acquire it, thereby driving the market, and, vi) growing demand for housing which is driven by positive demographics such as high population and urbanization, which currently stands at 1.9% and 3.7%, which is relatively higher than the global averages of 0.9% and 1.6% respectively.
Additionally, during the month, the following industry reports were released and the key take-outs were as follows;
|
Cytonn Report: Notable Industry Reports During the Month of July 2024 |
|||
|
# |
Theme |
Report |
Key Take-outs |
|
1 |
Residential |
Central Bank of Kenya (CBK). The Bank Supervision Annual Report 2023 |
· The Central Bank of Kenya (CBK) released The Bank Supervision Annual Report 2023 which heighted that; in 2023, the number of mortgage accounts increased by 2,229, representing an 8.0 % increase to 30,015 from the 27,786 recorded in 2022. · Additionally, the value of outstanding Non-Performing Mortgage Loans increased by 7.9% to Kshs 40.8 bn in 2023 from Kshs 37.8 bn in 2022, For more information, please see our Cytonn Weekly #29/2024 |
|
2
|
Hospitality Sector, Real Estate, Building and construction Sector |
2024 Economic Survey by Kenya Bureau of Statistics |
· The Kenya National Bureau of Statistics (KNBS) released the Q1’2024 GDP Report which highlighted that the Real Estate sector posted steady growth of 6.6% in Q1’2024, which is 0.7% points slower than the 7.3% growth registered in Q1’2023 · The construction sector grew by 0.1% in Q1’2024, which is 2.9% points slower than the 3.0% growth in Q1 2023. On a quarter-on-quarter basis, this performance represented a 2.1%-points decrease from the 2.2% growth recorded in Q4’2023 · The accommodation and restaurant services grew by 28.0% during Q1’2024, representing a 19.1%-points y/y decline from the 47.1% growth recorded in Q1’2023. · For more information, please see our Cytonn Weekly #27/2024. |
Source: Kenya National Bureau of Statistics (KNBS)
- Residential Sector
There were four notable highlights during the month;
- Faulu Microfinance Bank, a subsidiary of Old Mutual Group, announced a range of innovative financial solutions including unsecured loans, customized financial packages for property improvement, and payment plans aligned with rental income cycles aimed at addressing gaps in service access for landlords, agents, and other stakeholders in Real Estate development and management. For more information, please see our Cytonn weekly #30/2024,
- Megna Homes, a Mombasa-based developer, announced plans for the construction of a modern gated community project in Kisauni. The project, dubbed ‘Santana’, is set to be launched in August 2024 and is expected to be complete by the end of 2 years at Kwa Sonko in Bakarani along the Old Mombasa-Malindi Road. For more information, please see our Cytonn weekly #30/2024,
- Finsco Africa, a Real Estate firm, announced that it recently secured a Kshs 5.0 bn deal with Atlanta-based Go Greenwood Bank LLC for onward long-term funding with a key focus on affordable housing targeting the lower and upper middle class. For more information, please see our Cytonn weekly #28/2024, and,
- Fairdeal Properties, a private construction company, launched a Kshs 2.0 bn affordable housing project in Bamburi, Mombasa County, which will see the construction of over 500 housing units. The project will be developed in three phases, a with completion expected within three and half years. The first phase project will consist of 200 units of one, two, and three-bedroom typology within a gated community, spanning a five-acre parcel of land. For more information, please see our Cytonn Weekly #27/2024.
- Commercial office sector
During the week, Postal Corporation of Kenya, opened 79,626 square feet of office space for lease to draw revenue from idle assets. The state agency has identified space in 13 branch offices across 7 counties. Mokowe post office in Lamu has the largest space available for lease at 35,000 square feet. Other sizeable office spaces include Kwale (24,000 SQFT), Hola (10,000 SQFT), Machakos (2,637 SQFT), Kiambu (782sqft), and Nairobi city square (400sqft). The move is expected to boost the revenue for the corporation amid the rising financial crisis. The leases will be in effect for 63 months, with the possibility of an extension. We expect the Corporation's move to increase the commercial office supply in the country, as well as boosting the corporation's revenue. Additionally, this venture will enhance investment opportunities for businesses that rely on commercial spaces for their operations in these areas. Below is a graph showing the total number of offices Kenya Postal Corporation owns across the country.
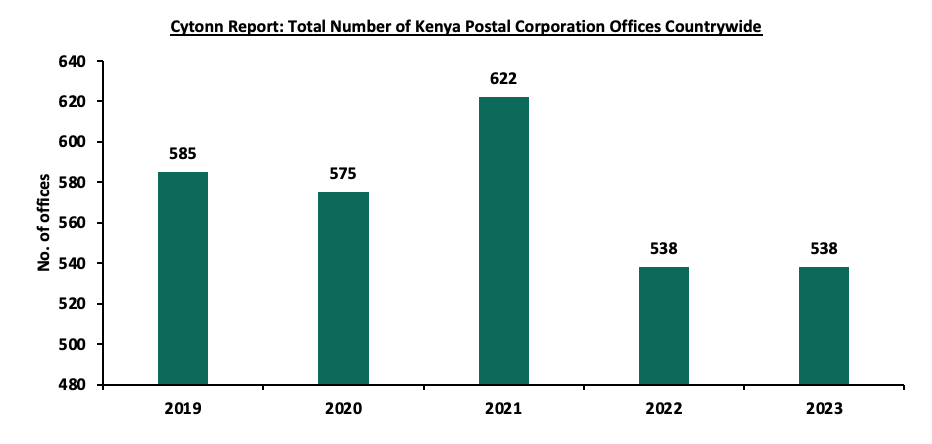
Source: Kenya National Bureau of Statistics (KNBS)
Going forward, we expect improved performance in Kenya’s Real Estate commercial office sector, supported by several factors such as; continued uptake of existing space after developers adopted a "wait and see" approach, particularly in FY’2023 especially in the Nairobi Metropolitan Area (NMA),ii) improved investor confidence, on the back of positive macroeconomic indicators such as improved inflation levels and the appreciation of the Kenyan currency, iii) increased demand for quality office spaces, especially from international corporations, iv) the rise of the co-working concept, with emerging operators like Space, Regus, and Ikigai, and, v) an increase in deal activities within the segment. However, the sector’s growth faces impediments due to the prevailing oversupply of commercial office spaces, especially in the NMA, and the rising cost of construction.
- Hospitality Sector
During the week, Accor, a hospitality group in Kenya, opened Gem Forest Hotel along Nairobi’s Limuru Road, marking the ninth property it manages in Kenya’s market. The property comprises of 105 rooms, conference spaces with an 80-guest capacity, a swimming pool, a gym, four restaurants, and bars. Additionally, the Hotel is expected to open its rooftop bar and lounge in August and later have a grand opening in September where it will unveil its other services. The property built at a cost of Kshs 3.9 bn (USD 30.0 mn) is targeting tourists, business travelers, and the diplomatic community living around Gigiri, Runda, Muthaiga, Rosslyn, and Nyari who are expected to be the biggest clients. The hotel's greatest asset is its strategic location close to Nairobi’s central business district (CBD), the Village Market shopping and recreation complex, and the UN agencies including the United Nations Environment Programme (UNEP). The Gem Hotel boasts a good view of Karura Forest, enhancing the ambiance for its visitors, and is in close vicinity to the Nairobi Gallery, Museum Hill, and the National Museum of Kenya. Other establishments managed by the Accor Group include Movenpick Hotel and Residences Nairobi, Fairmont The Norfolk, Ibis Styles Nairobi Westlands, Mercure Nairobi Upper Hill, Novotel Nairobi Westlands, Fairmont Mount Kenya Safari Club, and Pullman Nairobi Upper Hill.
We expect continued improvement in the hospitality sector, supported by the travel industry, which is recovering from the impact of the COVID-19 pandemic. Hospitality brands are competing for a share of the domestic and foreign client base, coupled with an increase in the number of international arrivals, which grew by 4.6% in January 2024 to 134,665 from 128,772 arrivals in January 2023, signifying potential growth in the tourism and hospitality sector further supported by the visa-free policy that took effect in January 2024. The recent developments in the hospitality industry include JW Marriot Hotel Nairobi with 315 rooms and 51 serviced apartments which opened in June,100-room Dusit Princess Residences Westlands, the 128-room Pan Pacific Serviced Suites Nairobi, and the 20-room JW Marriot Masai Mara Lodge.
The notable highlight during the month was;
- TPS Eastern Africa, the owner of the Serena hospitality brand, announced its plan to build a multi-purpose conference facility next to its Nairobi Serena Hotel. The facility, estimated to cost up to USD 30.0 mn (Kshs 3.9 bn), targets the meetings, conferences, and exhibitions (MICE) market. The project is expected to commence early next year and will take 2 years to complete following the conclusion of feasibility studies in December 2024. For more information, please see our Cytonn weekly #28/2024
- Real Estate Investments Trusts (REITs)
- Mi Vida Home Homes Limited Licensed as a REIT Manager by Capital Markets Authority
During the week, the Capital Markets Authority (CMA) granted a license to Mi Vida Homes Limited to operate as a REIT Manager in efforts to strengthen and develop the country’s capital markets. This brings the total number of REIT managers in Kenya to 11. Below is a list of the licensed REIT Managers in Kenya;
|
# |
Cytonn Report: REIT Managers in Kenya |
|
1 |
Cytonn Asset Managers Limited (CAML) |
|
2 |
Acorn Investment Management |
|
3 |
Stanlib Kenya Limited |
|
4 |
Nabo Capital |
|
5 |
ICEA Lion Asset Managers Limited |
|
6 |
Fusion Investment Management Limited |
|
7 |
H.F Development and Investment Limited |
|
8 |
Sterling REIT Asset Management |
|
9 |
Britam Asset Managers Limited |
|
10 |
CIC Asset Management Limited |
|
11 |
Mi Vida Homes Limited |
Source: Capital Markets Authority
As a REIT Manager, the company will offer Real Estate and fund management services for Real Estate investment trusts (REITs) on behalf of investors within a REIT scheme. We expect this milestone will open exciting new opportunities for investors and further develop our country’s Real Estate market, as the country’s REIT market remains underdeveloped and relies primarily on conventional funding alternatives.
- Acorn Holdings Financial Performance H1’2024
Acorn Holdings released their H1’2024 financial results for the Acorn D-REIT and I-REIT. Key to note, Acorn I-REIT posted a 44.7% increase in profit to Kshs 164.1 mn from Kshs 113.3 mn that was recorded in H1’2023, linked to a 64.5% increase in rental income coming in at Kshs 534.2 mn from 324.8 mn in H1’2023. On the other hand, Acorn D-REIT posted a 67.2% decline in rental income to Kshs 53.1 mn in H1’2024 from Kshs 162.0 mn in H1’2023. The performance is attributed ASA D-REIT closing the period with only 2 operational properties in Karen (Qwetu Karen and Qejani Karen) compared to 4 at the same time in the previous year. This led to a decrease in residential revenue in the half-year following the sale of both Qwetu Hurlingham and Qwetu Aberdare Heights II. Below is a summary of the REIT’s performance in H1’2024;
Figures in Kshs mn Unless Stated Otherwise
|
Cytonn Report: Income Statement |
||||||
|
|
Acorn I-REIT |
Acorn D- REIT |
||||
|
|
H1’2023 |
H1’2024 |
Change |
H1’2023 |
H1’2024 |
Change |
|
Rental Income |
324.8 |
534.2 |
64.5% |
162.0 |
53.1 |
(67.2%) |
|
Income from Other Sources |
10.6 |
7.9 |
(25.2%) |
0.02 |
0.0 |
(100.0%) |
|
Total operating income |
335.4 |
553.2 |
65.0% |
515.6 |
424.8 |
(17.6%) |
|
Operating Expenses |
197.0 |
243.3 |
23.5% |
181.4 |
153.6 |
(15.3%) |
|
Finance costs |
(45.6) |
(194.9) |
327.8% |
(166.1) |
(81.2) |
(51.1%) |
|
Profit Before Tax |
113.3 |
164.1 |
44.7% |
170.2 |
181.4 |
6.6% |
|
Basic EPS (Kshs) |
0.4 |
0.5 |
26.6% |
0.66 |
0.7 |
3.5% |
Figures in Kshs bn Unless Stated Otherwise
|
Cytonn Report: Balance Sheet |
||||||
|
|
Acorn I-REIT |
Acorn D-REIT |
||||
|
|
H1’2023 |
H1’2024 |
Change |
H1’2023 |
H1’2024 |
Change |
|
Total Assets |
7.3 |
10.6 |
44.1% |
11.3 |
12.6 |
11.4% |
|
Total Equity |
6.3 |
7.4 |
17.2% |
6.5 |
6.7 |
3.1% |
|
Total Liabilities |
1.0 |
3.1 |
215.9% |
4.7 |
5.8 |
23.1% |
Ratios summary for the I-REIT and D-REIT
|
Cytonn Report: Ratios Summary |
||||||
|
|
Acorn I-REIT |
Acorn D-REIT |
||||
|
H1’2023 |
H1’2024 |
Change |
H1’2023 |
H1’2024 |
Change |
|
|
ROA |
1.5% |
1.6% |
0.0% |
1.5% |
1.4% |
(0.1%) |
|
ROE |
1.8% |
2.2% |
0.4% |
2.6% |
2.7% |
0.1% |
|
Debt Ratio |
13.5% |
29.6% |
16.1% |
41.9% |
46.2% |
4.4% |
|
PBT Margin |
34.9% |
30.7% |
(4.2%) |
33.0% |
42.7% |
9.7% |
|
Rental Yield |
5.0% |
5.2% |
0.2% |
1.5% |
0.5% |
(1.1%) |
|
Annualized Rental Yield |
10.1% |
10.6% |
0.5% |
3.1% |
1.0% |
(2.1%) |
|
Distribution Per Unit |
0.103 |
0.099 |
(4.2%) |
0.34 |
0.46 |
11.4% |
|
Payout Ratio |
26.3% |
19.9% |
(6.4) |
53.3% |
68.1% |
14.8% |
The key take-outs include;
Acorn I-REIT
- The basic earnings per unit increased by 26.6% to Kshs 0.5 in H1’2024, from Kshs 0.4 recorded in H1’2023. This was mainly driven by a 44.7% increase in profit to Kshs 164.1 mn recorded in H1’2024, from Kshs 113.3 mn that was recorded in H1’2023, linked to a 64.5% increase in rental income coming in at Kshs 534.2 mn from 324.8 mn in H1’2023,
- The current rental yield for the I-REIT increased by 0.2% points to 5.2% in H1’2024, from 5.0% in H1’2023 following an increase in the rental income and stable average occupancy levels of 87.0% for current properties in their portfolios,
- Total assets for the I-REIT increased by 44.1% to Kshs 10.6 bn in H1’2024 from Kshs 7.3 bn in H1’2023. This was mainly on the back of a 57.0% increase in investment property during the period, coming in at Kshs 10.3 bn from Kshs 6.6 bn in H1’2023. This was a result of newer acquisitions during the period including Qwetu Aberdare Heights II at a valuation of Kshs 1.4 bn, and,
- The shareholder’s funds for I-REIT increased by 17.2% to Kshs 7.4 bn in H1’2024, from Kshs 6.3 bn in H1’2023. The I-REIT’s equity increase was a result of; i) an increase in revaluation reserve at the end of the period by 44.4% to Kshs 681.1 mn in H1’2024 from 471.7mn in H1’2023, ii) increase trust capital by 15.4% to Kshs 6.6 bn from 5.7 bn, and iii) a 7.2 mn in assets replacement reserves. On the other hand, there was a slight 1.2 % decrease in retained earnings to Kshs 174.0 mn from Kshs 176.1 mn in H1’2023.
Acorn D-REIT
- The basic earnings per unit for the REIT increased by 3.5% to Kshs 0.7 in H1’2024, from Kshs 0.66 in H1’2023. This was mainly driven by a 6.6% increase in total profit to Kshs 181.4 mn in H1’2024 from Kshs 170.2 mn in H1’2023,
- The total operating expenses for the D-REIT decreased marginally by 15.3% to Kshs 153.6 mn in H1’2024 from Kshs 181.4 mn in H1’2023, mainly driven by a 38.8% decrease in administrative expenses to Kshs 47.2 mn in H1’2024 from Kshs 77.1 mn in H1’2023,
- Total assets for the D-REIT increased by 11.4% to Kshs 12.6 bn in H1’2024, from Kshs 11.3 bn in H1’2023. The increase in assets was mainly backed by increased amounts due from related parties which increased by 1,233.0% to Kshs 400.6 mn in H1’2024 from Kshs 30.0 mn in H1’2023 , and,
- The D-REIT recorded 0.1%-point decrease in ROA to 1.4% in H1’2024 from 1.5% in H1’2023. This is attributable to slightly higher returns on assets in H1’2023 compared to H1’2024. The ROE recorded a 0.1%-point increase to 2.7% in H1’2024 from 2.6% in H1’2023 which was mainly attributable to a 6.6% increase in total profit to Kshs 181.4 mn in H1’2024 from Kshs 170.2 mn in H1’2023.
For a more comprehensive analysis, please see our Acorn I-REIT and D-REIT H1’2024 Earnings Note.
The chart below shows the comparison of Acorn Holdings’ yield performance versus other assets.
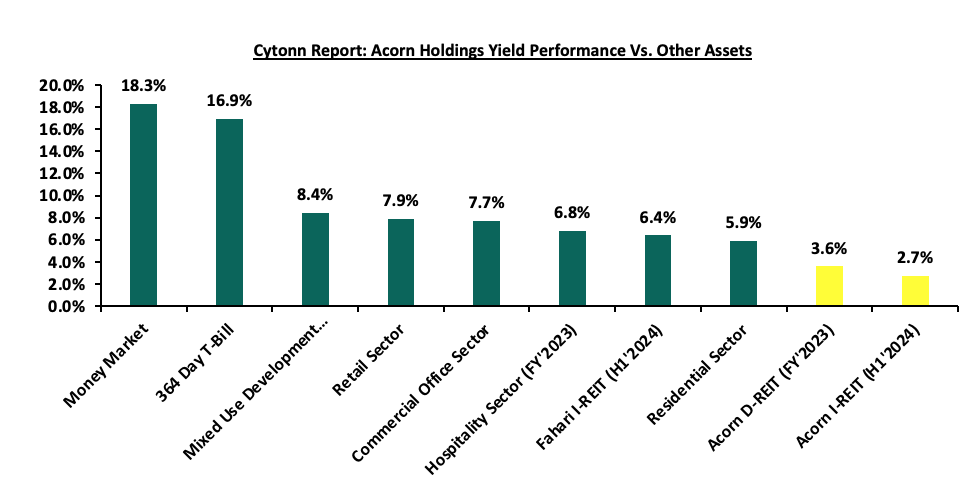
Source: Cytonn Research
On the Unquoted Securities Platform, Acorn D-REIT and I-REIT traded at Kshs 24.5 and Kshs 22.0 per unit, respectively, as per the last updated data on 2nd August 2024. The performance represented a 22.5% and 10.0% gain for the D-REIT and I-REIT, respectively, from the Kshs 20.0 inception price. The volumes traded for the D-REIT and I-REIT came in at 12.3 mn and 31.6 mn shares, respectively, with a turnover of Kshs 257.5 mn and Kshs 633.8 mn, respectively, since inception in February 2021. Additionally, ILAM Fahari I-REIT traded at Kshs 11.0 per share as of 2nd August, 2024, representing a 45.0% loss from the Kshs 20.0 inception price. The volume traded to date came in at 138,600 for the I-REIT, with a turnover of Kshs 1.5 mn since inception in November 2015.
REITs offer various benefits, such as tax exemptions, diversified portfolios, and stable long-term profits. However, the ongoing decline in the performance of Kenyan REITs and the restructuring of their business portfolios are hindering significant previous investments. Additional general challenges include: i) insufficient understanding of the investment instrument among investors, ii) lengthy approval processes for REIT creation, iii) high minimum capital requirements of Kshs 100.0 mn for trustees, and iv) minimum investment amounts set at Kshs 5.0 mn for the Investment REITs, all of which continue to limit the performance of the Kenyan REITs market.
The notable highlights during the month were;
- ILAM Fahari I-REIT released their H1’2024 financial results highlighting that the I-REIT recorded a 37.4% decline in profits earned to Kshs 53.8 mn, from Kshs 86.0 mn in H1’2023. For more information, please see our Cytonn weekly #30/2024, and,
- ICEA Lion Asset Managers (ILAM) Fahari I-REIT was admitted to the Unquoted Securities Platform (USP) of the Nairobi Securities Exchange (NSE), following their delisting from the main investment market in February 2024. ILAM Fahari joined Acorn I-REIT, Acorn D-REIT, and Linzi Sukuk in the USP, marking the first trading day in the segment. The delisting from the Main Investment Market Segment (MIMS) of the NSE will provide greater flexibility in managing the REIT's portfolio without affecting the unitholders’ ability to trade their units. The REIT’s shares (units) were available for trading on the platform at a fixed price of Kshs 11.0, representing the price at which a section of minority investors was bought out last year by ILAM, which is also the manager of the REIT. Cytonn weekly #28/2024
We expect the performance of Kenya’s Real Estate sector to remain resilient supported by several factors: i) heightened activities from both private and government sectors, ii) an expanding population driving the need for housing, iii) government efforts under the Affordable Housing Program and the incentives advanced to developers aligned with the program, iv) an increase in deals in the commercial office sector likely to boost occupancy, v) increased investment by international and local investors in the retail sector, and vi) increased international arrivals in the country boosting the hospitality and tourism sector. On the other hand, we expect the sector’s growth to be limited by: i) slow penetration of mortgages in the country, ii) subdued growth of REITs and the overall capital market in the country, iii) the increasing cost of construction, and iv) reducing purchasing power of consumers.
Disclaimer: The views expressed in this publication are those of the writers where particulars are not warranted. This publication, which is in compliance with Section 2 of the Capital Markets Authority Act Cap 485A, is meant for general information only and is not a warranty, representation, advice, or solicitation of any nature. Readers are advised in all circumstances to seek the advice of a registered investment advisor.

- Talk to us
- Kenya
- P.O Box 20695 - 00200, Nairobi, Kenya
- Cell +254709101200
- Tel +254709101200
- WhatsApp +254741676635
- United States
- +254709101200
- DOWNLOAD OUR APP
-


- Kenya
- 8th Floor, Pinetree Plaza, Kaburu Drive, Ngong Road, Nairobi, Kenya
- USA
- Suite 1150, 1775 Eye Street NW, USA, Washington DC 20006, USA
- Investments
- High Yield
- Private Equity
- Real Estate
- Real Estate
- RiverRun Estates
- Cytonn Towers
- The Ridge
- Taraji Heights
- The Alma