Cytonn Monthly - April 2019
By Cytonn Research, May 5, 2019
Executive Summary
Fixed Income
During the month of April, T-bill auctions recorded an oversubscription, with the overall subscription rate coming in at 157.0%, compared to 131.2% recorded in the month of March 2019. The subscription rates for the 91-day, 182-day and 364-day papers came in at 137.5%, 88.2% and 233.6%, higher than the 58.9%, 77.3% and 214.1% registered in the previous month, respectively. The yields on the 91-day, 182-day and 364-day papers declined by 0.4% points, 0.2% points and 0.1% point to 7.3%, 8.0% and 9.3% from 7.7%, 8.2% and 9.4% recorded in March, respectively;
Equities
During the month of April, the equities market was on a downward trend, with NASI, NSE 20 and NSE 25 declining by 0.2%, 1.7% and 0.7%, respectively, taking their YTD performance to 14.0%, 10.9% and (1.2%), respectively. During the month, KCB Group highlighted its intention to acquire 100.0% of National Bank of Kenya (NBK), while Equity Group entered into an agreement with Atlas Mara to acquire subsidiaries in Rwanda, Tanzania, Zambia and Mozambique;
Private Equity
During the month of April, there was private equity activity in the Financial Services sector, with (i) Sanlam Group selling an undisclosed amount of its stake in Sanlam Investments East Africa (SIEA), and (ii) Britam Holdings Limited announcing its intention to acquire an undisclosed stake in Tiserin Capital. In the FinTech sector, Branch International raised USD 170.0 mn (Kshs 17.2 bn) in a 3rd round fundraising deal, led by Foundation Capital and Visa, and Kudi raised USD 5.0 mn (Kshs 503.6 mn) in Series A funding, which was led by Partech Ventures. In the Education sector, the Competition Authority of Kenya (CAK) has approved the proposed acquisition of a 22.3% stake in Kenya based Riara Group of Schools by Actus Education Holdings AB;
Real Estate
During the month of April, six reports that highlighted the sector’s performance were released namely; (i) ‘Economic Survey 2019’, by Kenya National Bureau of Statistics (KNBS), (ii) ‘Hass Q1’2019 Property Sales and Rental Index’, by HassConsult Limited, (iii) ‘NMA Commercial Office Report 2019’, (iv) ‘Hass Land Price Index Q1'2019’, by HassConsult Limited, (v) ‘Africa Horizons: A Unique Guide To Real Estate Investment Opportunities’, by Knight Frank, and (vi) ‘Kenya Logistics Market Report’, by Broll Property Group. In the residential sector, the World Bank approved a USD 250.0 mn (Kshs 25.0 bn) loan facility to Kenya Mortgage Refinancing Company (KMRC) to enable it provide access to affordable housing finance for home-buyers, and the National Treasury tabled its 2019/2020 Budget Estimates to Parliament, with Kshs 10.5 bn allocated towards the Affordable Housing Initiative as part of the Kenyan Government’s Big 4 Agenda. In the listed real estate sector, the Nairobi Securities Exchange (NSE), on 3rd April 2019, admitted property development company ‘My Space Properties’ under the Ibuka Incubator Programme, following successful vetting of the subject company.
- On 2nd May 2019, Cytonn Asset Managers Limited (CAML), the regulated affiliate of Cytonn Investments Management Plc, held a training for Pension Trustees’ at Windsor Golf Hotel and Country Club. The training focused on the A-Z of investing in Real Estate. Read the Event Note here;
- Maurice Oduor – Principal Officer at Cytonn Asset Managers Limited was on NTV on Tuesday to discuss the state of national borrowing and debt management. Watch Maurice here;
- Natasha Gichuki – Legal Assistant and Victor Odendo - Head of Unit Trust at Cytonn Asset Managers Limited were on KBC to talk about financial investments and the factors to consider when investing. Watch the interview here;
- For an exclusive tour of Cytonn’s real estate developments, visit: Sharp Investor’s Tour and for more information, email us at sales@cytonn.com;
- Following the completion and handover of Amara Ridge in Karen, we have now launched our next Karen project, dubbed Applewood, a Kshs 2.5 bn residential development located in Miotoni, Karen. This signature development shall comprise luxury homes, each sitting on 1/2 acre. We invite you to the exhibition of Applewood which is ongoing at the Amara Ridge Clubhouse (Location pin: https://goo.gl/maps/B3GVnu8pHyn) or at the Applewood Sales Centre on Miotoni Road (Location pin: https://goo.gl/maps/ZfABuGjFo1z) from 9:00 am to 5:00 pm daily. Call 0709 101 000 or email resales@cytonn.com to reserve a villa! See Video here;
- We continue to hold weekly workshops and site visits on how to build wealth through real estate investments. The weekly workshops and site visits target both investors looking to invest in real estate directly and those interested in high yield investment products to familiarize themselves with how we support our high yields. Watch progress videos and pictures of The Alma, Amara Ridge, and The Ridge;
- We continue to see very strong interest in our weekly Private Wealth Management Training (largely covering financial planning and structured products). The training is at no cost and is open only to pre-screened participants. We also continue to see institutions and investment groups interested in the training for their teams. Cytonn Foundation, under its financial literacy pillar, runs the Wealth Management Training. If interested in our Private Wealth Management Training for your employees or investment group, please get in touch with us through wmt@cytonn.com. To view the Wealth Management Training topics, click here;
- For recent news about the company, see our news section here;
- We have 10 investment-ready projects, offering attractive development and buyer targeted returns. See further details here: Summary of Investment-Ready Projects.
T-Bills & T-Bonds Primary Auction:
During the month of April, T-bill auctions recorded an oversubscription, with the overall subscription rate coming in at 157.0%, a rise from 131.2% recorded in the month of March 2019. The subscription rates for the 91-day, 182-day and 364-day papers came in at 137.5%, 88.2% and 233.6%, higher than the 58.9%, 77.3% and 214.1% registered in the previous month, respectively. The yields on the 91-day, 182-day and 364-day papers declined by 0.4% points, 0.2% points and 0.1% point to 7.3%, 8.0% and 9.3% from 7.7%, 8.2% and 9.4% recorded in March, respectively. The T-bills acceptance rate came in at 77.4% during the month, compared to 75.7% recorded in March, with the government accepting a total of Kshs 145.9 bn of the Kshs 188.4 bn worth of bids received. The Central Bank of Kenya (CBK) remained disciplined in rejecting expensive bids in order to ensure stability of interest rates.
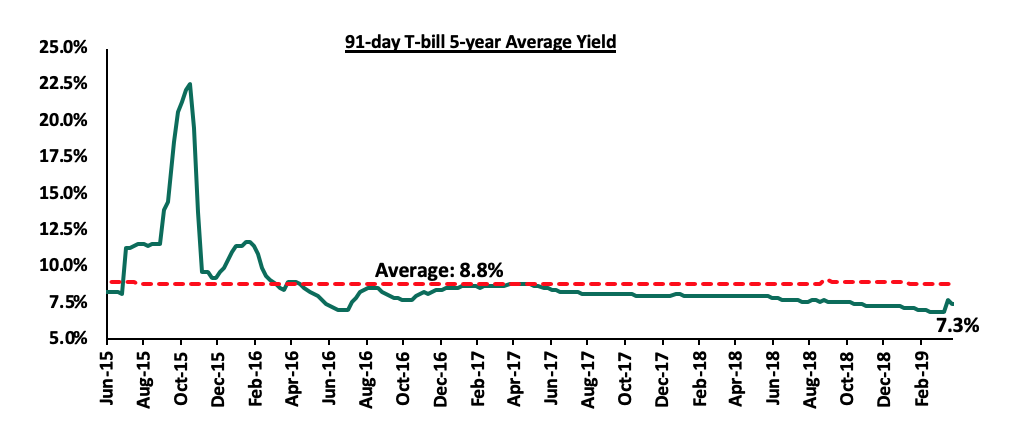
During the week, T-bills recorded an under-subscription, which came in at 49.0%, down from 113.8% the previous week. The decline in subscription rate is partly attributable to the waning liquidity in the money market during the week. The yields on the 91-day 182-day and 364-day papers remained unchanged at 7.3%, 8.0% and 9.3%, respectively. The acceptance rate improved to 100.0% from 95.4%, recorded the previous week, with the government accepting all the bids received.
The 91-day T-bill is currently trading at a yield of 7.3%, which is below its 5-year average of 8.8%. The lower yield on the 91-day paper is mainly attributable to the low interest rate environment that has persisted since the passing of the law capping interest rates. We expect this to continue in the short-term, given:
- The discipline of the CBK in stabilizing interest rates in the auction market by rejecting aggressive bids that are priced above market, for both T-bills and T-bonds, and,
- The maintaining of the Central Bank Rate at 9.0% by the Monetary Policy Committee in their March 2019 meeting.
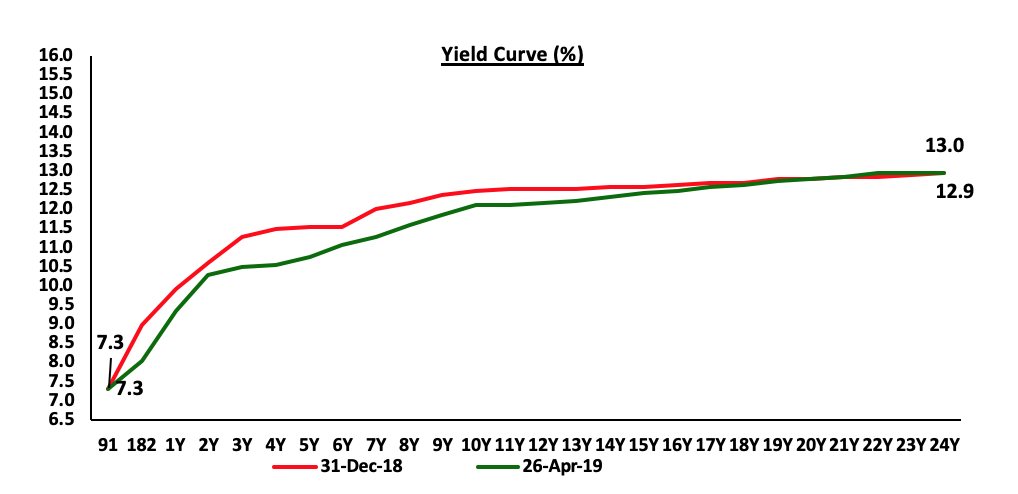
During the month, the government issued two bonds with issue numbers FXD2/2019/10 and FXD 1/2019/20, with tenors of 10.0-years and 20.0-years, respectively both with market determined coupon rates, in a bid to raise Kshs 50.0 bn for budgetary support. The 10-year bond generated more interest, recording total bids of Kshs 70.9 bn out of the Kshs 85.6 bn worth of bids for the entire issue, as investors continued to avoid the longer-tenor bonds due to the relatively flat yield curve on the long-end brought about by the saturation of long-term bonds, coupled with the duration risk associated with long-term papers. The accepted yields for the 10-year and 20-year bonds came in at 12.3% and 12.9%, respectively.
For the month of May, the Treasury is issuing a 5-year (FXD2/2019/5) and a 15-year (FXD2/2019/15) bond for a total of Kshs 50.0 bn for budgetary support. The government has adopted an approach of a blended issue of a short-tenor and a long-tenor bond, in a bid to plug in the budget deficit while at the same time trying to reduce the short-term maturity risk. The market is expected to maintain a bias towards the shorter tenor 5-year paper as per the recent trends mainly driven by the perception that risks may not be adequately priced on the longer end of the yield curve, which is relatively flat due to saturation of long-term bonds. Given that the Treasury bonds with the same tenor as the FXD2/2019/5 and FXD2/2019/15 are currently trading at yields of 10.8% and 12.5%, respectively, we expect bids to come in at 10.8% - 11.0% and 12.5% - 12.7% for the 5-year and 15-year bonds, respectively.
Secondary Bond Market:
The yields on government securities in the secondary market remained relatively stable during the month of April as the Central Bank of Kenya continued to reject expensive bids in the primary market. According to the FTSE NSE Bond Index, Treasury bonds listed at the Nairobi Securities Exchange (NSE) gained by 0.2% during the month, bringing the YTD performance to 0.9%.
Liquidity:
The average interbank rate rose to 5.9% during the month of April from 2.6% in March, pointing to tightening liquidity conditions in the money market. During the week, the average interbank rate rose to 6.1%, from 5.1% the previous week. The rise in the interbank rate points to tightening liquidity conditions in the money market as banks were mobilizing funds to pay for tax remittances.
Kenya Eurobonds:
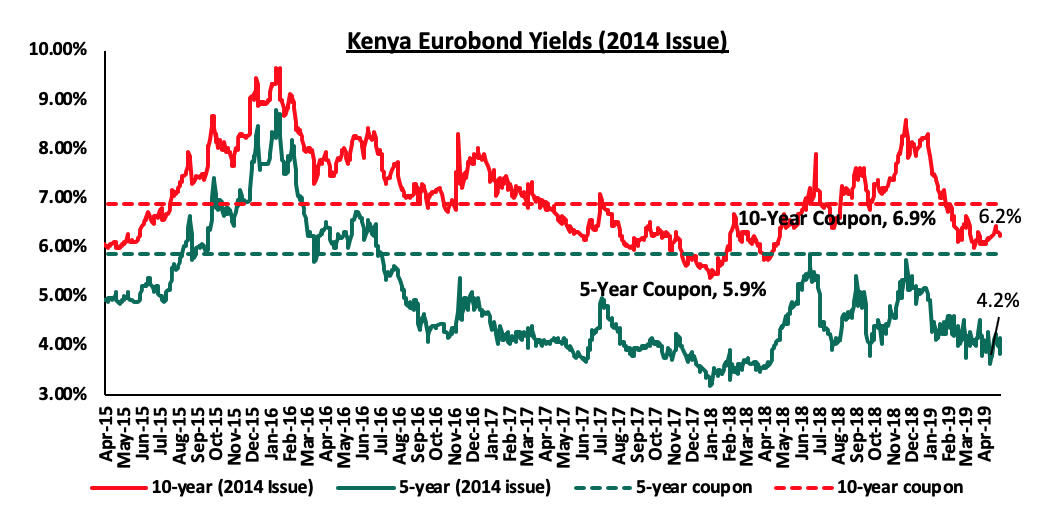
According to Bloomberg, the yield on the 5-year Eurobond issued in June 2014 declined by 0.3% points to 4.0% in April from 4.3% in March 2019, while those of the 10-Year Eurobonds issued in the same year rose by 0.1% points to 6.3% in April from 6.2% in March 2019. During the week, the yields on the 5-year Eurobond issued in 2014 closed at 4.2%, similar to the previous week, while those of the 10-year Eurobond issued in the same year declined by 0.1% points to 6.2%, from 6.3% the previous week. Since the mid-February 2016 peak, yields on the Kenya Eurobonds have declined by 4.6% points and 3.3% points for the 5-year and 10-year Eurobonds, respectively, an indication of the relatively stable macroeconomic conditions in the country.
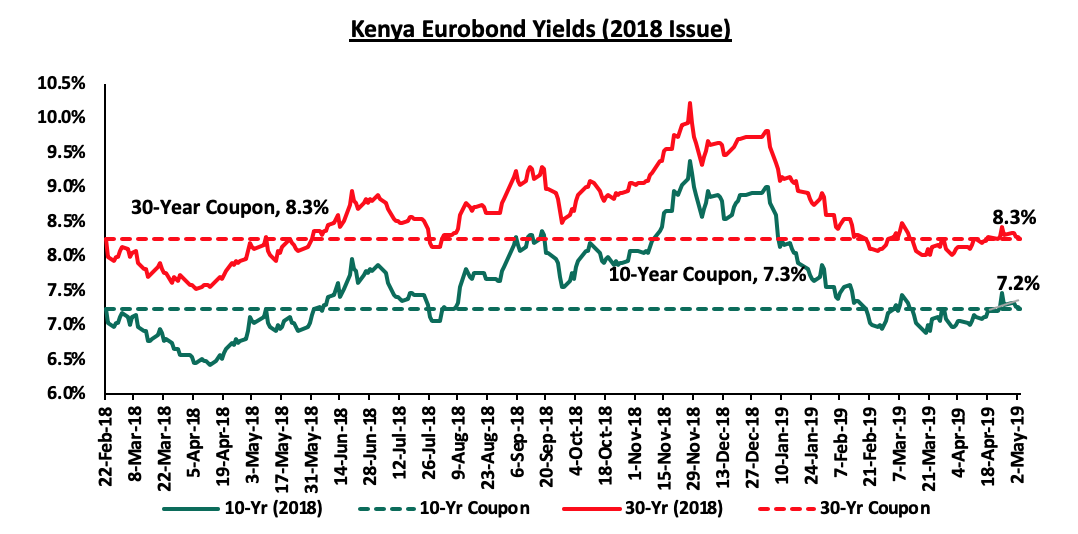
During the month, the yields on the 10-year and 30-year Eurobond issued in February 2018 rose by 0.2% points for both issuances to close at 7.3% and 8.3% from 7.1% and 8.1% in March 2019, respectively. During the week, the yields on the 10-year Eurobond declined by 0.1% points to 7.2% from 7.3% recorded the previous week while those of the 30-year Eurobond remained relatively stable at 8.3%.
The Kenya Shilling:
The Kenya Shilling depreciated by 0.4% against the US Dollar during the month of April to Kshs 101.1, from Kshs 100.8 at the end of March. This was driven by increased dollar-demand from oil and merchandise importers. During the week, the Kenya Shilling appreciated by 0.4% against the US Dollar to close at Kshs 101.1 from Kshs 101.5 in the previous week, driven by inflows from offshore investors buying government bonds. On an YTD basis, the shilling has appreciated by 0.8% against the US Dollar in addition to 1.3% in 2018. In our view, the shilling should remain relatively stable against the dollar in the short term, supported by:
- The narrowing of the current account deficit with preliminary data on balance of payments indicating continued narrowing to 4.7% of GDP in the 12-months to February 2019, from 5.5% recorded in February 2018. The decline has been attributed to improved agriculture exports, increased diaspora remittances, strong receipts from tourism, and lower food and SGR-related equipment relative to 2017,
- Improving diaspora remittances, which increased by 11.1% to USD 221.0 mn in March 2019, from USD 199.0 mn in February 2019, and the 12-months cumulative inflows having increased by 26.3% to USD 2.7 bn in March 2019, from USD 2.2 bn in March 2018. The rise is due to:
- Increased uptake of financial products by the diaspora due to financial services firms, particularly banks, targeting the diaspora, and,
- New partnerships between international money remittance providers and local commercial banks making the process more convenient,
- CBK’s supportive activities in the money market, such as repurchase agreements and selling of dollars, and,
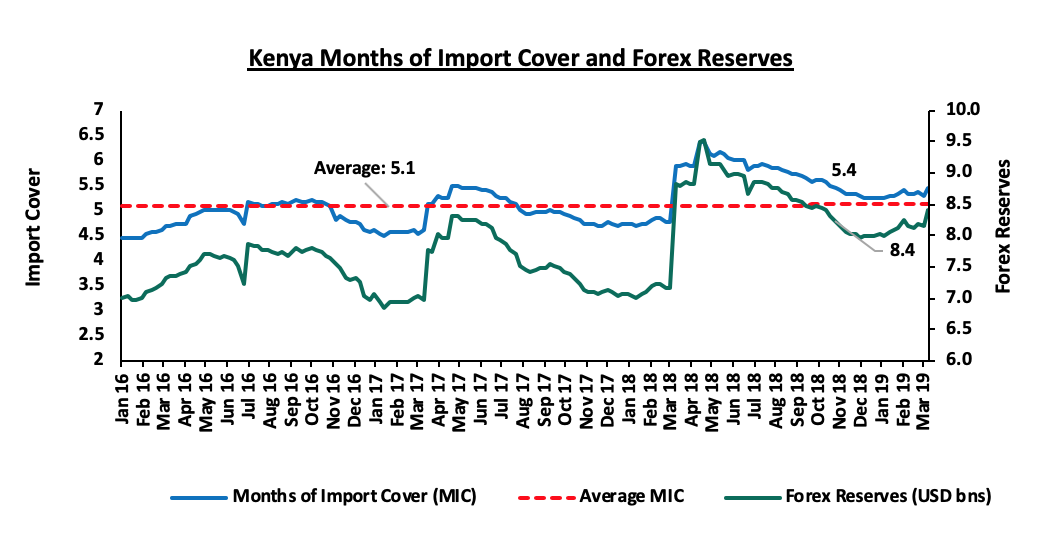
- High levels of forex reserves, currently at USD 8.4 bn, equivalent to 5.4-months of import cover, above the statutory requirement of maintaining at least 4-months of import cover, and the EAC region’s convergence criteria of 4.5-months of import cover.
Inflation:
The Y/Y inflation rate for the month of April rose to a 19-month high of 6.6%, from 4.4% recorded in March, higher than our expectations of a rise to 4.6% - 5.0%, with the variance being as a result of an 8.2% y/y rise in the food and non-alcoholic beverages index against our expectations of a 3.6% rise. Month-on-month inflation came in at 3.5%, with the rise attributed to;
- A 6.9% rise in the food and non-alcoholic drinks’ Index, due to the drought conditions, which caused an upsurge in the cost of food with the highest rise being recorded in the prices of sifted maize flour that increased by 29.8%,
- A 0.9% rise in the Transport Cost index due to a rise in the pump prices of petrol and diesel, and,
- A 0.9% rise in the housing, water, electricity, gas and other fuels’ index due to higher cost of house rents and some cooking fuels. Partly contributing to this, were prices of domestic consumption of electricity that increased by 0.1% for both the 50 KWh and 200 KWh, on account of an increase in fuel cost and inflation adjustment charges. House rents increased by 0.3%.
Below is a summary of key changes in the Consumer Price Index (CPI) in November:
Major Inflation Changes in the Month of April 2019
|
Broad Commodity Group |
Price change m/m (Apr-19/Mar-19) |
Price change y/y (Apr-19/Apr-18) |
Reason |
|
Food & Non-Alcoholic Beverages |
6.9% |
8.2% |
The m/m rise was mainly attributed to drought conditions which caused an upsurge in the cost of food |
|
Transport Cost |
0.9% |
10.8% |
The m/m rise was on account of a rise in pump prices of petrol and diesel |
|
Housing, Water, Electricity, Gas and other Fuels |
0.9% |
5.8% |
The m/m rise was on account of higher cost of house rents and cooking fuels, coupled with increased prices of domestic electricity consumption due to increase in foreign and inflation adjustment charges |
|
Overall Inflation |
3.5% |
6.6% |
The m/m rise was due to a 6.9% and 0.9% increase in the food index and housing, water, electricity and other fuels index, which have a CPI weight of 36.0% and 18.3%, respectively |
Monthly Highlights:
During the week, Fitch Ratings affirmed Kenya’s Long-Term Foreign-Currency Issuer Default Rating (IDR) at 'B+' with a Stable Outlook, stating the Kenya’s rating reflects strong and stable growth. The key ratings drivers included;
- Strong GDP Growth: The 2018 GDP growth came in at 6.3%, an improvement from 4.9% recorded in 2017, which had been depressed in 2017 by lower agricultural output due to drought and a slowdown in economic activity around the elections. Fitch forecasts 2019 growth to slow slightly to 5.8% and to fluctuate around 6.0% in the medium term, as agricultural growth normalizes but the service sector continues to support growth,
- Fiscal Deficit: Fitch predicts that Kenya’s fiscal deficit will narrow to 6.6% in the fiscal year ending June 2019, but still higher compared to the ‘B’ median that is 4.3%. Fitch noted that the persistent fiscal deficit has led to elevated government debt at 58.0% in full year 2018,
- Current Account Deficit: Kenya's current account deficit has narrowed, but remains high. Better export performance, along with lower capital imports and lower global oil prices, reduced Kenya's trade deficit to 11.0% of GDP in 2018, from an average of 16.0% over 2008 to 2017. Fitch estimates the 2018 current account deficit at 5.2% of GDP and forecasts it to remain at around 5.0% in 2019 and 2020, and
- Reserves: Kenya's reserve position eases some of the vulnerability from high external debt. International reserves were USD 8.2 bn as of January 2019 and Fitch forecasts reserves to increase to USD 8.9 bn by end of 2019.
Fitch also noted that the factors that could lead to an improved rating include a decline in the government debt to GDP ratio and a decline in external debts whereas factors that could affect the rating negatively include widening of the current account deficit and increasing net external debt. We are of the view that the stable rating will go a long way in improving investor sentiments and increasing investments from foreign investors. The affirmation of Kenya’s credit rating could also prove pivotal in the pricing of the proposed Eurobond issues this year.
The Kenya National Bureau of Statistics (KNBS) released the Economic Survey 2019 indicating that the economy had expanded by 6.3% in 2018 from 4.9% recorded in 2017. This was the fastest economic growth since the 8.4% recorded in 2010, and above the 5-year average GDP growth rate of 5.6%. The key drivers to this growth included; (i) A rebound recorded in the agriculture sector, which recorded a growth of 6.4% in 2018 from a revised growth of 1.9% in 2017 from the initial reported growth of 1.6%, with growth mainly driven by marked improvement in crops and animal production anchored by favorable weather conditions and, (ii) Growth in the manufacturing sector was robust in 2018 recording a 4.2% growth, up from the 0.5% growth recorded in 2017. Contribution of the sector to total GDP however declined slightly to 9.6% from 9.8% in 2017. For more information, see our Cytonn Weekly #17/2019 and our Kenya 2018 GDP Growth and Outlook Note.
The World Bank released the Kenya Economic Update, April 2019, indicating that Kenya’s economy had expanded by 6.0% in the first 3 quarters of 2018, which was an improvement from the 4.7% recorded for a similar period in 2017. The World Bank is yet to release Kenya’s economy growth numbers for full year 2018, with the statistics from KNBS indicating 6.3% GDP growth for 2018. The growth was mainly boosted by improved output from the agricultural sector following favorable weather conditions, increased private consumption which was also as a result of muted inflation and stronger diaspora remittances inflows. For more information, see our Cytonn Weekly #15/2019.
Stanbic Bank’s released their Monthly Purchasing Manager’s Index (PMI), which indicated that the business environment in the country improved at a slower rate in March 2019. The seasonally adjusted PMI fell slightly coming in at 51.0 in March, a decline from 51.2 in February, and a 16-month low since the 42.8 recorded in November 2017. A PMI reading of above 50 indicates improvements in the business environment, while a reading below 50 indicates a worsening outlook. The slower improvement in business conditions was as a result of a slower rise in new orders, which was linked to cash flow issues. For more information, see our Cytonn Weekly #14/2019.
Rates in the fixed income market have remained relatively stable as the government rejects expensive bids and is currently 14.4% ahead of its domestic borrowing target for the current financial year, having borrowed Kshs 306.9 bn against a pro-rated target of Kshs 268.3 bn. A budget deficit is likely to result from depressed revenue collection, creating uncertainty in the interest rate environment as additional borrowing from the domestic market goes to plug the deficit. Despite this, we do not expect upward pressure on interest rates due to increased demand for government securities, driven by improved liquidity in the market owing to the relatively high debt maturities. Our view is that investors should be biased towards medium-term fixed income instruments to reduce duration risk associated with long-term debt, coupled with the relatively flat yield curve on the long-end due to saturation of long-term bonds.
Market Performance
During the month of April, the equities market was on a downward trend, with NASI, NSE 20 and NSE 25 declining by 0.2%, 1.7% and 0.7%, respectively taking their YTD performance to 14.0%, 10.9% and (1.2%), respectively. The decline recorded in NASI was driven by declines in large cap stocks such as Co-operative Bank, NIC Group, Standard Chartered Bank Kenya (SCBK), and Bamburi, whose declines of 15.7%, 13.3%, 10.3% and 9.0%, respectively outweighed the gains made by EABL, Safaricom, Equity Group Holdings and Barclays Bank of 9.0%, 3.8%, 3.0% and 1.3%, respectively. For this week, markets recorded a mixed performance, with NASI gaining by 1.3% while NSE 20 and NSE 25 declined by 0.6% and 0.1%, respectively. The gain in the NASI was largely due to gains recorded in large cap counters such as NIC Group and Safaricom, which recorded gains of 4.5% and 3.8%, respectively.
Equities turnover declined by 35.6% during the month to USD 97.6 mn, from USD 151.5 mn in March 2019. Foreign investors remained net buyers for the month, with a net buying position of USD 4.1 mn, a 75.8% decline from March’s net buying position of USD 16.8 mn.
For this week, equities turnover increased by 0.1% to USD 22.49 mn, from USD 22.46 mn the previous week, bringing the year to date (YTD) turnover to USD 554.0 mn. Foreign investors remained net buyers for the week, with a net buying position of USD 1.9 mn, a 61.1% decline from last week’s net buying position of USD 5.0 mn.
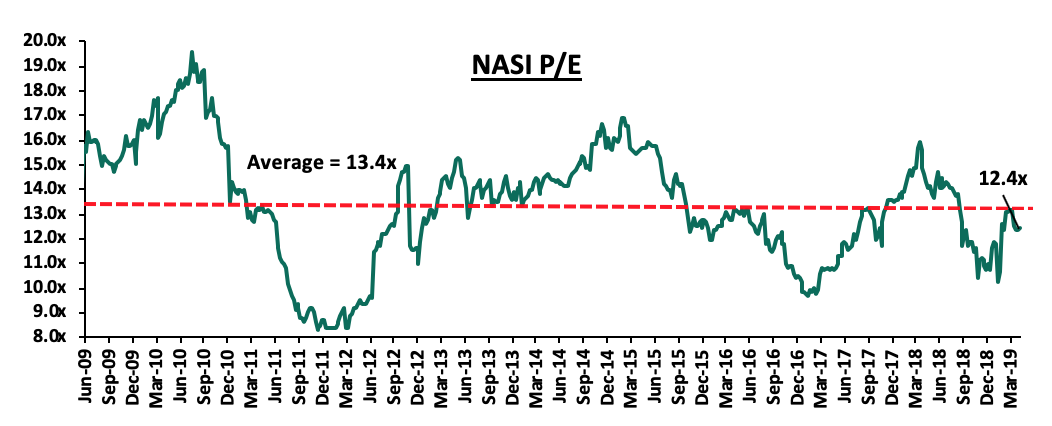
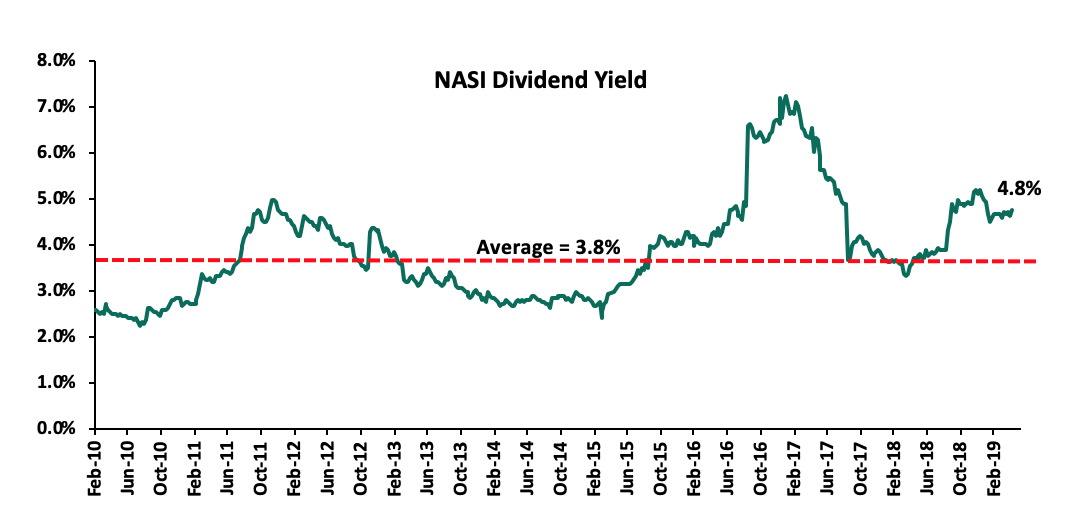
The market is currently trading at a price to earnings ratio (P/E) of 12.4x, 7.4% below the historical average of 13.4x, and a dividend yield of 4.8%, above the historical average of 3.8%. With the market trading at valuations below the historical average, we believe there is value in the market. The current P/E valuation of 12.4x is 26.4% above the most recent trough valuation of 9.8x experienced in the first week of April 2017, and 49.1% above the previous trough valuation of 8.3x experienced in December 2011. The charts below indicate the historical P/E and dividend yields of the market.
Monthly Highlights
During the month, the Financial Access (FinAccess) Household Survey 2019 report was released. The survey, which was jointly conducted by the Kenya National Bureau of Statistics (KNBS), the Central Bank of Kenya (CBK) and Financial Sector Deepening (FSD) Kenya, highlighted the rise in the level of financial inclusion in Kenya with 82.9% of the adult population having access to formal financial services and products, up from 75.3% in 2016. Key take-outs from the report were:
- 89.0% of the population can access both formal and informal financial services and products, an increase from the 82.5% inclusion in 2016. The rise in the level of financial inclusion has largely been attributable to increased innovation, and a proliferation of digital financial access channels such as mobile banking applications developed by various banks, agency banking, and digital lending applications,
- Nairobi region maintained the highest level of formal inclusion, at 96.0%, followed by Mombasa, Central Rift Valley, and Central Kenya, with inclusions of 94.0%, 88.0%, and 85.0%, respectively. The rise in inclusion cements Kenya’s third position, after South Africa and Seychelles, which have 95.0%, and 90.0% inclusion, respectively, and,
- In terms of use of financial services by channel, digital loan apps recorded the fastest growth, accounting for 8.3% of usage, from a paltry 0.6% usage in 2016. Mobile money, mobile banking and insurance recorded improvements to 79.4%, 25.3% and 27.9%, from 71.4%, 17.5% and 23.2%, respectively, in 2016.
For more information, see our Cytonn Weekly #14/2019.
During the month, various banks continued their consolidation drive as highlighted below:
- KCB Group’s bid to acquire Imperial Bank Limited under Receivership (IBLR), reached a significant milestone, with the acceptance of KCB Group’s final offer by both the Central Bank of Kenya and the Kenya Deposit Insurance Corporation (KDIC). The transaction will see an additional 19.7% of deposits availed to depositors, an addition to the 35.0% availed, on the acceptance of the binding offer by KDIC and CBK in December 2018. The remaining deposit balances will be availed to depositors in three tranches, 12.5% after the official signing of the agreement, a further 12.5% one-year after the signing of the agreement, and 25.0% balance on the second, third and fourth anniversaries of the signing of the agreement. For more information, see our Cytonn Weekly #14/2019,
- KCB Group announced its intention to acquire a 100% stake in the National Bank of Kenya (NBK), in line with our expectation of increased consolidation in the Kenya banking sector, as players with depleted capital positions become acquired by their larger counterparts or merge together to form well capitalized entities capable of navigating the relatively tough operating environment induced by price controls on lending rates, and exacerbated by the stiff competition. For a more detailed analysis of the transaction, please see our Kenya Listed Banks FY’2018 Report & Cytonn Weekly #16/2019,
- Shareholders of NIC Group and CBA Group approved the merger of the two banks in their respective Annual General Meetings, which were held during the month. The merger still needs approval from local and regional regulators including Bank of Tanzania, the Central Bank of Kenya, Capital Markets Authority and Competition Authority of Kenya. The banks expect that all the requisite approvals will be obtained by June, allowing shares of the merged entity to commence trading on the Nairobi Securities Exchange (NSE) on 17thJuly 2019. For more information on the merger, see our NIC Group and Commercial Bank of Africa (CBA) Merger Note, and,
- During the week, Equity Group entered into a binding term sheet with Atlas Mara Limited to acquire certain banking assets in 4 countries in exchange for shares in Equity Group. These include:
- 62.0% of the share capital of Banque Populaire du Rwanda (BPR);
- 100.0% of the share capital of Africa Banking Corporation Zambia (ABCZam) Ltd.;
- 100.0% of the share capital of Africa Banking Corporation Tanzania (ABCTz); and,
- 100.0% of the share capital of Africa Banking Corporation Mozambique Ltd (ABCMoz).
Equity Group will also pursue acquiring additional share capital in BPR from some or all of the remaining shareholders. The transaction will be funded by a share swap whereby Atlas Mara will be allotted 252.5 mn new shares of Equity Group, which translates to 6.3% of the proforma expanded issued share capital. This is equivalent to Kshs 10.0 bn using the closing price of Kshs 39.5 on 30th April 2019. Atlas Mara and Equity Group have also highlighted that there may be an additional capital injection by Atlas after the consummation of the transaction. The aggregate consideration to be paid by Equity Group remains subject to the completion of the confirmatory due diligence. The completion of the transaction is subject to the approval of various regulatory bodies such as the Central Bank of Kenya, Competition Authority of Kenya, and the respective central banks and competition authorities of the subsidiaries’ domicile. Atlas has its holdings spread out across Sub Saharan region, with other subsidiaries in Dubai, Germany and Mauritius grouped in its corporate segment. The performance of Atlas as per the various regional subsidiaries that may be acquired by Equity Group as at FY’2018 is highlighted below:
Atlas Mara Financial Results
|
Key line items |
Southern Africa 2018 (USD 000) |
Southern Africa 2017 (USD 000) |
East Africa 2018 (USD 000) |
East Africa 2017 (USD 000) |
West Africa 2018 (USD 000) |
West Africa 2017 (USD 000) |
Corporate 2018(USD 000) |
Corporate 2017(USD 000) |
Total FY'2018 |
Total FY'2017 |
Percentage Change |
|
Interest and similar income |
200,958 |
200,650 |
59,509 |
64,162 |
- |
- |
(12,909) |
1,691 |
247,558 |
266,503 |
(7.1%) |
|
Interest and similar expense |
(77,274) |
(87,726) |
(20,767) |
(26,007) |
- |
- |
(16,958) |
(7,484) |
(114,999) |
(121,217) |
(5.1%) |
|
Net Interest Income |
123,684 |
112,924 |
38,742 |
38,155 |
- |
- |
(29,867) |
(5,793) |
132,559 |
145,286 |
(8.8%) |
|
Loan Impairment Charges |
6,863 |
(12,725) |
(6,628) |
(9,540) |
- |
- |
(445) |
- |
(210) |
(22,265) |
(99.1%) |
|
Income/(Loss) from lending |
130,547 |
100,199 |
32,114 |
28,615 |
- |
- |
(30,312) |
(5,793) |
132,349 |
123,021 |
7.6% |
|
Non-Interest Income |
69,908 |
68,769 |
13,492 |
15,979 |
- |
- |
15,409 |
30,419 |
98,809 |
115,167 |
(14.2%) |
|
Total Operating Income |
200,455 |
168,968 |
45,606 |
44,594 |
- |
- |
(14,903) |
24,626 |
231,158 |
238,188 |
(3.0%) |
|
Operating Expenses |
(165,259) |
(156,750) |
(45,019) |
(41,420) |
- |
(30,248) |
(25,364) |
(240,526) |
(223,534) |
7.6% |
|
|
Net Income from Operations |
35,196 |
12,218 |
587 |
3,174 |
- |
- |
(45,151) |
(738) |
(9,368) |
14,654 |
(163.9%) |
|
Share of profit from Associates |
- |
- |
27,831 |
38,400 |
28,501 |
- |
56,332 |
38,400 |
46.7% |
||
|
Profit/Loss before tax |
35,196 |
12,218 |
587 |
3,174 |
27,831 |
38,400 |
(16,650) |
(738) |
46,964 |
53,054 |
(11.5%) |
|
Income tax expense |
(7,737) |
(3,735) |
(1,944) |
(240) |
- |
- |
4,935 |
(1,293) |
(4,746) |
(5,268) |
(9.9%) |
|
Profit/Loss for after tax |
27,459 |
8,483 |
(1,357) |
2,934 |
27,831 |
38,400 |
(11,715) |
(2,031) |
42,218 |
47,786 |
(11.7%) |
Key take-outs from the table above is that:
- Southern Africa segment, which includes Zambia, Zimbabwe, Botswana and Mozambique recorded an improved performance of a 223.7% net income growth to USD 27.5 mn from USD 8.5 mn in FY’2017, supported by the 18.6% income growth to USD 200.5 mn from USD 169.0 mn in FY’2017. With Equity Group acquiring the Zambian and Mozambique business, we are of the view that this would present Equity with the market to execute its successful retail strategy, as it has done across East and Central Africa, and
- The East Africa segment, which includes Rwanda and Tanzania recorded a negative performance as shown by the decline in the net income to a loss after tax of USD 1.4 mn, from a profit of USD 2.9 mn in FY’2017, as the slow 2.3% growth in income to USD 45.6 mn from USD 44.6 mn in FY’2017 was outpaced by the 8.7% growth in the total operating expenses to USD 45.0 mn from USD 41.4 mn in FY’2017. We view this market as one that Equity Group will likely encounter difficulties in accretion of value, given the relatively undeveloped markets.
Kenyan listed banks continued their revenue diversification drive by growing the Non-Funded Income (NFI) segment, with various banks launching several initiatives as highlighted below:
- Co-operative Bank of Kenya launched the Co-op Bank Property Hub under its mortgage division, which will offer property sales and mortgage origination to its clients. The Property Hub intends to serve the clients who have property to sell and connect them to the Co-operative Bank clients who want to buy property. The bank will also offer mortgages to the buyers of the property as it expects to leverage on its contacts with key institutions and the cooperative movements that largely own the bank to boost the property sales for its clients. For more information, please see our Cytonn Weekly #17/2019,
- Diamond Trust Bank Kenya (DTBK) announced that it has partnered with SWIFT, a leading provider of secure financial messaging services, in order to provide real time cross border payments to its clients. DTBK will be the first East African Bank to go live on the SWIFT global payment innovation service, a service that is carrying out over USD 300 bn worth of transactions a day, in over 148 currencies. For more information, please see our Cytonn Weekly #17/2019, and,
- Standard Chartered Bank Kenya (SCBK) launched an innovation hub lab in Nairobi dubbed Xcelerator in a bid to boost its revenue streams and diversify by riding on financial technology. SCBK plans to allocate Kshs 10.0 bn into supporting Financial Technology (FinTech) startups to scale up and generate innovative solutions to problems in the banking sector. StanChart views FinTech firms as partners amid their growing disruption of the local financial sector, a move likely to aid the bank in generating additional revenue. For additional information, please see our Cytonn Weekly #15/2019.
Universe of Coverage
Below is our universe of coverage table:
|
Banks |
Price as at 26/04/2019 |
Price as at 3/05/2019 |
w/w change |
m/m change |
YTD Change |
Target Price* |
Dividend Yield |
Upside/Downside** |
P/TBv Multiple |
Recommendation |
|
GCB Bank |
4.0 |
4.0 |
0.0% |
14.2% |
(13.0%) |
7.7 |
9.5% |
102.5% |
0.9x |
Buy |
|
Diamond Trust Bank |
122.0 |
121.5 |
(0.4%) |
(17.6%) |
(22.4%) |
241.5 |
2.1% |
100.9% |
0.6x |
Buy |
|
UBA Bank |
6.9 |
6.7 |
(2.2%) |
(10.5%) |
(13.0%) |
10.7 |
12.7% |
72.4% |
0.5x |
Buy |
|
Zenith Bank |
21.4 |
21.0 |
(1.6%) |
(10.9%) |
(8.9%) |
33.3 |
12.9% |
71.5% |
1.0x |
Buy |
|
CRDB |
125.0 |
130.0 |
4.0% |
(3.7%) |
(13.3%) |
207.7 |
0.0% |
59.8% |
0.4x |
Buy |
|
Ecobank |
7.8 |
6.7 |
(13.8%) |
0.6% |
(10.4%) |
10.7 |
0.0% |
59.7% |
1.7x |
Buy |
|
CAL Bank |
1.0 |
0.9 |
(9.3%) |
(8.2%) |
(10.2%) |
1.4 |
0.0% |
59.1% |
0.8x |
Buy |
|
Co-operative Bank |
13.6 |
12.6 |
(7.4%) |
(13.1%) |
(12.2%) |
18.5 |
8.0% |
55.4% |
1.2x |
Buy |
|
KCB Group*** |
45.3 |
41.3 |
(8.8%) |
2.7% |
10.3% |
60.0 |
8.5% |
53.8% |
1.4x |
Buy |
|
NIC Group |
33.0 |
32.7 |
(0.8%) |
(12.5%) |
17.6% |
48.8 |
3.1% |
52.3% |
0.9x |
Buy |
|
Access Bank |
6.6 |
6.9 |
4.5% |
21.9% |
1.5% |
9.5 |
5.8% |
43.5% |
0.4x |
Buy |
|
Equity Group |
41.5 |
42.0 |
1.1% |
0.2% |
20.4% |
58.1 |
4.8% |
43.3% |
2.0x |
Buy |
|
I&M Holdings |
115.0 |
123.3 |
7.2% |
26.4% |
45.0% |
167.7 |
2.8% |
38.9% |
1.2x |
Buy |
|
Barclays Bank |
11.9 |
10.6 |
(11.3%) |
6.7% |
(3.7%) |
13.1 |
10.4% |
34.6% |
1.6x |
Buy |
|
Stanbic Bank Uganda |
29.0 |
29.0 |
0.0% |
0.0% |
(6.5%) |
36.3 |
4.0% |
29.1% |
2.1x |
Buy |
|
Stanbic Holdings |
96.3 |
101.8 |
5.7% |
5.0% |
12.1% |
115.6 |
5.7% |
19.4% |
0.9x |
Accumulate |
|
Guaranty Trust Bank |
34.2 |
33.5 |
(2.2%) |
(7.0%) |
(2.9%) |
37.1 |
7.2% |
18.1% |
2.1x |
Accumulate |
|
SBM Holdings |
5.9 |
5.9 |
0.0% |
(1.7%) |
(1.3%) |
6.6 |
5.1% |
16.7% |
0.8x |
Accumulate |
|
Union Bank Plc |
6.8 |
7.1 |
4.4% |
4.5% |
26.8% |
8.2 |
0.0% |
14.8% |
0.7x |
Accumulate |
|
Bank of Kigali |
274.0 |
274.0 |
0.0% |
(0.4%) |
(8.7%) |
299.9 |
5.1% |
14.5% |
1.5x |
Accumulate |
|
Standard Chartered |
208.0 |
199.0 |
(4.3%) |
0.1% |
2.3% |
203.8 |
6.3% |
8.7% |
1.7x |
Hold |
|
National Bank |
5.0 |
4.8 |
(3.8%) |
(18.7%) |
(9.6%) |
5.2 |
0.0% |
8.1% |
0.4x |
Hold |
|
Bank of Baroda |
129.0 |
129.0 |
0.0% |
(4.4%) |
(7.9%) |
130.6 |
1.9% |
3.2% |
1.1x |
Lighten |
|
Standard Chartered |
19.0 |
19.0 |
0.0% |
(9.5%) |
(9.5%) |
19.5 |
0.0% |
2.4% |
2.4x |
Lighten |
|
FBN Holdings |
7.3 |
7.4 |
2.1% |
(5.8%) |
(6.9%) |
6.6 |
3.4% |
(7.0%) |
0.4x |
Sell |
|
Stanbic IBTC Holdings |
47.0 |
43.5 |
(7.4%) |
(6.7%) |
(9.3%) |
37.0 |
1.4% |
(13.6%) |
2.4x |
Sell |
|
Ecobank Transnational |
10.0 |
10.8 |
8.0% |
(25.4%) |
(36.5%) |
9.3 |
0.0% |
(14.1%) |
0.4x |
Sell |
|
HF Group |
4.3 |
4.0 |
(7.0%) |
(33.2%) |
(27.8%) |
2.9 |
8.8% |
(18.8%) |
0.2x |
Sell |
|
*Target Price as per Cytonn Analyst estimates **Upside/(Downside) is adjusted for Dividend Yield ***Banks in which Cytonn and/or its affiliates are invested in ****Stock prices indicated in respective country currencies We are “Positive” on equities for investors as the sustained price declines has seen the market P/E decline to below its historical average. We expect increased market activity, and possibly increased inflows from foreign investors, as they take advantage of the attractive valuations, to support the positive performance. |
||||||||||
During the month of April, there was private equity activity in Financial Services, FinTech, and the Education Sectors. We also saw fundraising activity and a private equity reports released:
Financial Services Sector
- Sanlam Group, a South African financial services firm, sold an undisclosed amount of its stake in Sanlam Investments East Africa (SIEA), an asset management firm based in Kenya, for ZAR 101.0 mn (Kshs 730.0 mn) to an undisclosed party. This move comes less than two-years after Sanlam bought a 75.0% stake in the former PineBridge Investments East Africa for an undisclosed amount, after which it rebranded to Sanlam Investments East Africa. Sanlam Investments East Africa currently manages an asset portfolio of over Kshs 200.0 bn, with a Money Market Fund size of Kshs 1.7 bn as at 31st December 2018, ranking it as the 5th largest asset manager in Kenya in terms of assets under management for Money Market Funds. For more information, see our Cytonn Weekly #15/2019.
- Britam Holdings Limited, a diversified financial services group with operations in Kenya, Tanzania, South Sudan, Uganda, Rwanda, Malawi, and Mozambique, announced its intention to acquire an undisclosed stake in Tiserin Capital, following approval from its board of directors. Nairobi-based Tiserin Capital is a private equity firm that manages the Tiserin Capital Fund, which invests in companies with enterprise values of less than Kshs 5.1 bn (USD 50.0 mn) in East Africa, Ethiopia, Mozambique, and South Africa taking up a controlling stake or a strong minority position. For more information, see our Cytonn Weekly #14/2019.
FinTech Sector
- Branch International, a San Francisco-based mobile lender, with operations in Nigeria, Kenya, and Tanzania, raised USD 170.0 mn (Kshs 17.2 bn) in a 3rd round fundraising deal, led by Foundation Capital and Visa. The capital comprises USD 100.0 mn (Kshs 10.1 bn) debt financing and USD 70.0 mn (Kshs 7.1 bn) in equity for an undisclosed stake. The funds raised will be used for international expansion to South America and Asia. For more information, see our Cytonn Weekly #15/2019.
- Kudi, a Nigeria based Financial Technology (FinTech) company focused on digital payments and collections raised USD 5.0 mn (Kshs 503.6 mn) in Series A funding. The funding round was led by San Francisco based Partech Ventures, an investment firm that finances and supports technology and digital companies. The funding round was also joined by Michael Seibel, the CEO and a partner at Y Combinator, an American based seed accelerator. Existing investors Khosla Ventures and Y Combinator also participated in the funding round. Kudi has raised a total of USD 6.7 mn, having raised USD 1.7 mn in seed capital. For more information, see our Cytonn Weekly #14/2019.
Education Sector
The Competition Authority of Kenya (CAK) has approved the proposed acquisition of a 22.3% stake in Kenya based Riara Group of Schools by Actus Education Holdings AB, a private school chain based in Sweden, for an undisclosed amount. Riara Group offers education services based on the 8.4.4 and British Curriculum. Riara operates six learning institutions based in Nairobi, five offering the 8.4.4 curriculum and one offering the British Curriculum. Riara seeks to use the partnership to expand across Kenya and East Africa and improve the skills of staff and the quality of service offered in its institutions. The investment is evidence of increasing investor interest in Kenya’s education sector. Other investors who have invested in the education sector include;
- Advtech Group, a private education provider, listed on the Johannesburg stock exchange, which opened a school under its Crawford Schools brand in Tatu City on 4th September 2018, offering pre-primary education focusing on the THRASS (Teaching, Handwriting, Reading and Spelling Skills) curriculum,
- Nova Pioneer, a South African educator, has set up a primary school and a high school in Tatu City offering the 8-4-4 curriculum,
- Centum Limited, an investment firm, in partnership with Sabis Education Network, has set up the Sabis International School in Runda,
- Cytonn Investments, through its education affiliate Cytonn Education Services, will provide education at all levels, from Early Childhood Development Education (ECDE) to tertiary education, beginning with a technical college-branded Cytonn College of Innovation and Entrepreneurship,
- Advtech Group, Schole (Mauritius) Limited, a London based education provider, and Caerus Capital, a leading international education consultancy group jointly acquired Makini Schools at an estimated value of ZAR 184.2 mn (Kshs 1.7 bn), and,
- Dubai based GEMS Education, an international education company, is also set to acquire a 100% stake of Hillcrest International Schools from its current owners, Fanisi Capital and businessman Anthony Wahome, for Kshs 2.6 bn.
The investments are an indication of investors’ interest in the education sector in Sub-Saharan Africa, which is motivated by:
- Increasing demand for quality and affordable education, according to The Business of Education in Africa report by Caerus Capital, the Gross Enrollment Ratio (GER) has doubled over the last ten years, from 4.5% in 2006 to 8.5% in 2016, and
- Support such as ease of approvals, offered to investors in the education sector by governments looking to meet Sustainable Development Goals (SDGs) targets of universal access to education.
Fundraising
- Nimai Capital, a Dubai-based financial institution that supports financial inclusion in South Asia and Africa, announced the launch of a USD 150.0 mn (Kshs 15.2 bn) Nimai Emerging Financial Services Fund (NESF) in partnership with Victoria Commercial Bank (VCB), a mid-sized Kenyan financial institution that serves premier corporate clientele. The fund aims to invest in financial services in African and South Asian countries such as Ghana, Tanzania, Kenya, Bangladesh, Sri Lanka, Nepal and India, and will be regulated by the Cayman Islands Monetary Authority. The partnership will leverage on VCB’s business experience and deep knowledge of the Kenyan financial services market, and Nimai’s deep operational capability in both African and Asian markets, as well as their resources. For more information, see our Cytonn Weekly #17/2019.
- Partech Ventures, a global investment platform for tech and digital firms released a report on capital raising activity for African Tech Start-ups in 2018. According to the report, funding raised by a total of 146 African tech-startups grew by 108.0% to USD 1.2 bn in 2018 from USD 560.0 mn in 2017 driven by an increased number of series A & B startups attracting funding and increased appetite of global private equity investors to invest in African tech start-ups. For more information, see our Cytonn Weekly #17/2019.
- The European Investment Bank announced a EUR 25.0 mn investment in the Amethis Fund II, the second pan-African investment vehicle of Amethis, an investment fund manager dedicated to long-term responsible investments in Africa. Amethis Fund II follows the same investment strategy as Amethis Fund I by providing growth capital to African mid-cap champions, through investments with an average ticket size of EUR 10.0 mn-EUR 30.0 mn or more through co-investment. Other investors in the fund include the International Finance Corporation (IFC) and Proparco, and Bpifrance, the French public investment bank. In February 2019, Amethis announced an intermediary closing of its Fund II at EUR 305.0 mn. The additional funding brings the total raised amount to EUR 330.0 mn. For more information, see our Cytonn Weekly #14/2019.
Reports
AVCA released their Country Snapshot for Kenya, which highlights the various developments in the private equity sector in Kenya between 2013 and 2018. According to AVCA, there were 110 reported deals during this period, translating to 57.8% of the total 190 deals reported in the 7 Eastern African countries. This was way ahead of Uganda, which was the country with the second largest share of PE deals by volume, at 18.9%, and the third, Tanzania, at 8.9% of total deals. In terms of value, Kenya ranked first, with a total deal value of USD 1.3 bn (Kshs 131.7 bn), followed by Ethiopia and Uganda, which both had an estimated share of 11% of total deals by value, translating to roughly USD 242.3 mn (Kshs 24.5 bn) of value of PE deals within the 6-year period. For more information, see our Cytonn Weekly #16/2019.
We maintain a positive outlook on private equity investments in Africa as evidenced by the increasing investor interest, which is attributed to; (i) economic growth, which is projected to improve in Africa’s most developed PE markets, (ii) attractive valuations in Sub Saharan Africa’s private markets compared to its public markets, and (iii) attractive valuations in Sub Saharan Africa’s markets compared to global markets. Going forward, the increasing investor interest, stable macro-economic and political environment will continue to boost deal flow into African markets.
- Industry Reports
Six real estate sector reports were released during the month of April, highlighting the sector’s performance as shown below:
Industry Reports Released in April 2019
|
Coverage |
Report |
Key Take-outs |
|
Real Estate & Infrastructure |
Economic Survey 2019, by Kenya National Bureau of Statistics (KNBS) |
.The real estate sector’s contribution to GDP declined marginally by 0.1% points to 7.0% in 2018, from 7.1% in 2017, and recorded a slowdown in terms of growth rate, having grown by 4.1%, compared to 6.1% in 2017. The slower growth rate was attributed to inaccessibility and unaffordability of off-take financing, with the credit advanced to the sector recording a marginal decline of 0.5% to Kshs 368.7 bn as at end of 2018, from Kshs 370.7 bn as at the end of 2017, ·For more information, see our Cytonn Weekly #17/2019. |
|
Residential Sector |
Hass Q1’2019 Property Sales and Rental Index, by HassConsult Limited |
·The Nairobi Metropolitan Area residential market registered an annual price appreciation of 3.3% as at Q1’2019, compared to a 1.7% decline recorded in Q1’2018; while q/q prices depreciated by 2.6%, compared to an appreciation of 2.4% in Q1’2018, ·Detached units and apartments recorded an average y/y price appreciation of 5.1% and 1.7%, on average, and a q/q depreciation of 1.6% and 0.6%, respectively, ·For more information, see our Cytonn Weekly #16/2019. |
|
Commercial Office Sector |
Nairobi Metropolitan Area Commercial Office Report 2019 by Cytonn Investments Management PLC |
·Rental yields increased marginally to 8.1% in 2018, from 7.9% in 2017, driven by the continued positioning of Nairobi as a regional hub and an improving macroeconomic environment, ·Asking rents in 2018 increased marginally by 1.6% to an average of Kshs 103 per SQFT, from Kshs 101 per SQFT in 2017, while asking prices increased by 0.6% to Kshs 12,719 in 2018, from Kshs 12,649 in 2017, ·The sector has pockets of value in zones with low supply and high returns such as Gigiri, and in differentiated concepts such as serviced offices, which record rental yields of up to 13.5% p.a. ·For more information, see our Cytonn Weekly #14/2019. |
|
Land Sector |
·Land price growth in Nairobi’s suburbs improved marginally, recording an annual growth rate of 1.4% and a q/q growth of 0.5%, whereas Satellite Towns recorded a 1.5% annual growth and 0.2% q/q growth in Q1’2019, 0.3% points lower than land in Nairobi suburbs, ·Well-developed suburbs such as Kilimani and Spring Valley posted land annual price declines of 1.1% and 0.6%, respectively, due to a large inflow of new supply, driving price correction while Mlolongo recorded the highest annual land price appreciation at 9.7%, boosted by a surge in demand by homebuyers owing to their relative affordability and ease of transit due to the Nairobi Railway and Standard Gauge Railway (SGR), and an improving road network, ·For more information, see our Cytonn Weekly #16/2019. |
|
|
Industrial Parks Sector |
‘Africa Horizons: A Unique Guide To Real Estate Investment Opportunities’, by Knight Frank |
·Kenya acts as the logistics hub of East Africa supported by significant new investments into the sector, including the rail link between Nairobi and Mombasa, and the Kenyan Government’s focus on the manufacturing sector under the Big 4 Agenda, ·There is a continued shift of industrial parks developments from the existing industrial area due to challenges such as poor infrastructure and high land costs, to satellite towns such as Ruiru supported by increased demand for centralized warehouses by retailers, ·For more information, see our Cytonn Weekly #15/2019. |
|
Industrial Parks Sector |
·The total industrial space supply increased by 9.1% to 1.2 mn SQM in 2018 from 1.1 mn SQM in 2017 while price per acre for industrial serviced plots located in Nairobi’s periphery, increased by an 11.1%, 3-year CAGR to Kshs 37.7 mn as at 2018 from Kshs 27.5 mn in 2015, ·Occupancy rates increased by 4.0% between 2017 and 2018 attributable to improving business environment and infrastructure, while average rental rates remained flat with the average monthly rent per SQFT for Grade A, B and C spaces at Kshs 65, Kshs 37 and Kshs 21, respectively in line with the general real estate sector performance, ·For more information, see our Cytonn Weekly #16/2019. |
Based on the above real estate research reports, we retain our neutral outlook for the real estate sector mainly constrained by commercial real estate space surplus in the market, inaccessibility and unaffordability of off-take financing and slow credit growth at 3.4% as at February 2019, compared to a 5-year average of 12.0%. The sector, however, exhibits pockets of value in select sectors such as industrial parks, mid-end & lower-end residential sectors, zones with low supply and high returns such as Gigiri, and in differentiated concepts such as serviced offices, which record rental yields of up to 13.5% p.a.
- Residential Sector
During the month, activity in the residential sector was mostly focused on the Affordable Housing Initiative (AHI) as shown below:
- World Bank approved a USD 250.0 mn (Kshs 25.0 bn) loan facility to support the Kenyan Government’s efforts in operationalizing the Kenya Mortgage Refinancing Company (KMRC). The KMRC was incorporated in April 2018 as part of the Affordable Housing Initiative (AHI), aimed at boosting access to affordable housing finance. Its primary function is to provide affordable long-term funding and capital market access to primary mortgage lenders (PMLs) such as banks and financial co-operatives who will then lend to the primary mortgage market at affordable monthly premiums and longer tenure. To facilitate the launch of KMRC, the entity is expected to obtain at least Kshs 1.0 bn as the minimum core capital according to CBK (Mortgage Refinance Companies) Regulations 2019. We see the loan facility as a good step towards the launch and operationalization of the Kenya Mortgage Refinancing Company in June 2019, providing access to affordable housing finance for home-buyers. For more details on KMRC, see our note Kenya Mortgage Refinancing Company (KMRC) Update,
- The National Treasury tabled its Kshs 2.8 tn 2019/2020 Budget Estimates to Parliament. According to the 2019 Budget Policy Statement, Kshs 10.5 bn is to be allocated towards the Affordable Housing Initiative. This is a 61.5% increase from the Kshs 6.5 bn allocated in Kenya National Budget 2018/19, which shows the National Government’s commitment towards delivering affordable housing, and
- The Housing Ministry kick-started the Housing Fund Levy with a directive for employees and employers to remit by 9th May to the National Housing Development Fund (NHDF). The fund is structured similar to a pension scheme, such that employees will contribute a percentage of their income (1.5% of their gross earnings each month), to a maximum of Kshs 5,000, and employers will match the amounts contributed. However, following the directive, the announcement has faced huge opposition attracting a court injunction to halt taking effect until final decisions by the labour court are made. For more information, see our Cytonn Weekly #16/2019.
Also during the month, Hass Consult launched a mixed-use development situated in Riverside, Nairobi. The project dubbed, ‘Riverside Square’, is expected to be completed by 2021 and will comprise of 250 apartment units, Grade A offices and boutique stores with the residential development consisting of 1-bed, 2-bed, 3-bed apartments and 4-bed penthouse with starting prices of Kshs 9.5 mn, Kshs 14.3 mn, Kshs 20.2 mn, and Kshs 71.0 mn, respectively, and corresponding plinth areas of 81 SQM, 95 SQM, 140 SQM and 511 SQM, translating to a Price/SQM of Kshs 117,284, Kshs 150,526, Kshs 144,286 and Kshs 138,943, respectively. The main factors driving investment in Riverside include; (i) proximity of the area to the Nairobi Central Business District and major business nodes, (ii) presence of international organizations such as FSD Kenya and Heinrich Boll Foundation, creating a market for serviced apartments, retail and office spaces, (iii) relatively good infrastructure network and security, and (iv) positioning of the area as an affluent neighborhood hosting middle to high-income earners with relatively high purchasing power.
For investors in mixed-use developments, Riverside, which is covered under the Westlands node, recorded an average rental yield of 7.0%, 1.0% points below the mixed-use development (MUD) market average of 8.0%, according to Cytonn Annual Markets Review – 2018. This is driven by the poor performance of retail sections of the mixed-use developments in the area, which recorded a rental yield of 8.1%, 0.4% points below the market average of 8.5%. The poor performance is mainly attributed to Riverside’s proximity to destination retail developments such as Sarit Centre and Westgate mall that offer a larger store variety, personalized experience and convenient parking.
All values in Kshs unless stated otherwise
|
Nairobi’s Mixed-Use Developments Market Performance by Nodes 2018 |
||||||||||||||||
|
Development Composition % |
Retail Performance |
Office Performance |
Residential Performance |
|||||||||||||
|
Location |
Retail % |
Office % |
Resi. % |
Price Kshs / SQFT |
Rent Kshs /SQFT |
Occup. (%) |
Rental Yield (%) |
Price Kshs / SQFT |
Rent Kshs/SQFT |
Occup. %) |
Rental Yield (%) |
Price Kshs /SQM |
Rent Kshs /SQM |
Annual Uptake % |
Rental Yield % |
Average MUD yield |
|
Limuru Rd |
60.0% |
20.0% |
19.0% |
23,975 |
277 |
80.0% |
11.1% |
13,500 |
103 |
70.0% |
6.4% |
177,935 |
1,259 |
25.0% |
8.5% |
9.6% |
|
Karen |
51.0% |
48.0% |
5.0% |
23,333 |
186 |
99.0% |
9.4% |
13,409 |
120 |
87.0% |
9.3% |
215,983 |
821 |
27.0% |
4.6% |
9.4% |
|
Upper Hill |
10.0% |
90.0% |
15,903 |
147 |
72.0% |
7.7% |
13,095 |
113 |
86.0% |
8.8% |
8.7% |
|||||
|
Kilimani |
25.0% |
75.0% |
19,571 |
168 |
87.0% |
9.1% |
12,875 |
102 |
82.0% |
7.7% |
8.6% |
|||||
|
Thika Rd |
36.0% |
14.0% |
50.0% |
35,000 |
297 |
95.0% |
9.7% |
12,500 |
111 |
90.0% |
9.6% |
161,849 |
756 |
20.0% |
5.6% |
7.6% |
|
Westlands |
27.0% |
58.0% |
59.0% |
16,399 |
179 |
65.0% |
8.1% |
12,845 |
113 |
76.0% |
8.1% |
201,274 |
636 |
31.0% |
3.8% |
7.0% |
|
Msa Rd |
51.0% |
10.0% |
39.0% |
20,000 |
180 |
50.0% |
5.4% |
13,200 |
96 |
75.0% |
6.5% |
171,304 |
843 |
5.9% |
5.7% |
|
|
Eastland’s |
25.0% |
75.0% |
20,000 |
132 |
76.0% |
6.0% |
81,717 |
351 |
20.0% |
5.1% |
5.4% |
|||||
|
Average |
58.1% |
30.9% |
41.3% |
19,664 |
181 |
76.9% |
8.5% |
13,015 |
110 |
81.1% |
8.2% |
168,344 |
778 |
24.5% |
5.6% |
8.0% |
|
*Westlands includes Riverside and Parklands
|
||||||||||||||||
Source: Cytonn Research 2018
We expect continued efforts towards the Affordable Housing Initiative, supported by the National Government’s commitment and international financial institutions support towards delivering the affordable housing to Kenyans. (We shall be doing a research note on affordable housing in Kenya in the month of May.)
- Commercial Office
In the commercial office sector, I&M Bank announced that they will be relocating their head office from the Nairobi CBD to 1 Park Avenue building located in Parklands, come August this year. The new age building will be part of the real estate investment portfolio of the bank’s property arm, I&M Realty. The 12,358 SQM building, whose cost remains undisclosed, will be partially owner-occupied while the rest of the space will be let out. According to the Nairobi Metropolitan Area Commercial Office Report 2019, Parklands area was one of the best performing areas in the commercial sector, recording a rental yield and occupancy rate of 8.4% and 86.0%, respectively, 0.3% points and 2.7% points above the market average of 8.1% and 83.3%, respectively, in FY’2018. This was mainly attributed to increased demand for office space by multinational companies given the limited supply of quality Grade A offices in the submarket, enabling developers to charge a premium on rentals. For more information and analysis, see our Cytonn Weekly #14/2019.
In the commercial sector, we expect local and multinational companies to continue focusing on high return areas such as Parklands, Westlands, Karen and Gigiri, recording a rental yield above 8.0% with the aim of maximizing on returns in addition to leveraging on the high-quality office spaces in the areas.
- Retail Sector
During the month, we saw increased uptake of retail space by both local and international retailers as the sector experienced the following activities:
- American pizza restaurant, Domino’s Pizza, opened their seventh outlet in Kenya at Shell Petrol Station on Argwings Kodhek Road in Kilimani, Nairobi. For more information, see our Cytonn Weekly #15/2019,
- Tumaini Self-service, a local supermarkets store, opened two outlets: (i) Kamakis-Ruiru on the Eastern Bypass, and (ii) Kahawa Station Road in Kahawa West, bringing its total number of stores countrywide to twelve.
We expect the sector to continue attracting local and international retailers supported by; (i) increased disposable income as a result of an expanding middle class, with GDP per Capita growing at a rate of 2.3% p.a. over the last 5-years, from Kshs 89,430 in 2014 to Kshs 100,310 in 2018, (ii) a positive demographic dividend, with a population growth rate of approximately 2.5% p.a. and a high urbanization rate of 4.3%, compared to the global average of 2.1%, hence an increase in demand for restaurants, and, (iii) stable economic growth, with Kenya’s GDP growth averaging at 5.6% over the last five-years and recording 6.3% growth in 2018, according to Kenya National Bureau of Statistics (KNBS) and expected to record 5.8% in 2019, thus, creating an enabling environment for the retailers to make desirable profits.
- Listed Real Estate
- The Nairobi Securities Exchange (NSE) admitted property development company, ‘My Space Properties’, under the Ibuka Incubator Programme, following successful vetting of the subject company. My Space Properties plans to officially list after the incubation, which will make it the second property developer to be listed in Kenya, after Home Afrika Limited, which went public on 15thJuly 2013. For more information and analysis, see our Cytonn Weekly #14/2019.
- Stanlib Fahari I-REIT announced plans to acquire more properties from pension firms and insurers who will be compensated in the form of units in the REIT. The proposed structure eliminates the need for the firm to raise large sums of new capital to buy more buildings, in addition to expanding the pool of income-generating buildings owned by the REIT and raising earnings for the expanded investor base. For more information and analysis, see our Cytonn Weekly #17/2019.
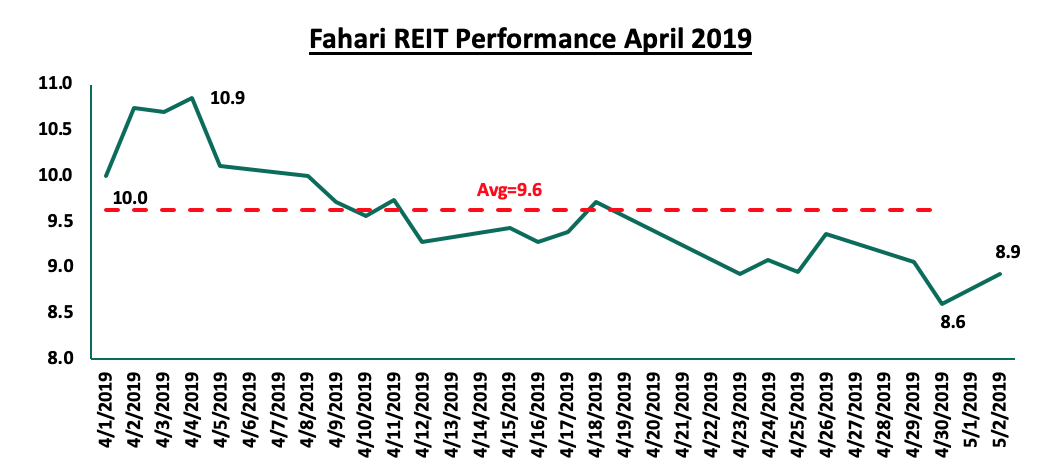
On the bourse, Stanlib Fahari I-REIT share price declined by 14.0% to close at Kshs 8.6 per share at the end of April, from Kshs 10.0 per share at the end of March. On average, the REIT traded at Kshs 9.6 per share, a 3.2% increase from an average of Kshs 9.3 per share in March 2019. The REIT closed the week at Kshs 8.9 per share. The instrument has continued to trade in low prices and volumes, constrained by negative market sentiments around REITs performance, inadequate investor knowledge and lack of institutional support for REITs.
We expect the real estate sector to continue recording increased activities in the residential, retail and listed real estate sectors supported by National and International organizations commitment towards the Affordable Housing Initiative, the continued demand for office and retail space in prime locations and increasing demand for alternative sources of capital in the real estate industry.
Disclaimer: The views expressed in this publication are those of the writers where particulars are not warranted. This publication, which is in compliance with Section 2 of the Capital Markets Authority Act Cap 485A, is meant for general information only and is not a warranty, representation, advice or solicitation of any nature. Readers are advised in all circumstances to seek the advice of a registered investment advisor.

- Talk to us
- Kenya
- P.O Box 20695 - 00200, Nairobi, Kenya
- Cell +254709101200
- Tel +254709101200
- WhatsApp +254741676635
- United States
- +254709101200
- DOWNLOAD OUR APP
-


- Kenya
- 8th Floor, Pinetree Plaza, Kaburu Drive, Ngong Road, Nairobi, Kenya
- USA
- Suite 1150, 1775 Eye Street NW, USA, Washington DC 20006, USA
- Investments
- High Yield
- Private Equity
- Real Estate
- Real Estate
- RiverRun Estates
- Cytonn Towers
- The Ridge
- Taraji Heights
- The Alma