Cytonn Weekly #15/2019
By Cytonn Research, Apr 14, 2019
Executive Summary
Fixed Income
T-bills remained oversubscribed during the week, with the subscription rate declining to 148.1% from 250.2%, recorded the previous week. The decline in subscription rate was attributable to the 10-year and 20-year bond sale in the primary market that closed during the week. The yield on the 182-day paper declined to 8.1% from 8.2%, previously while the 91-day and 364-day papers remained unchanged at 7.4% and 9.4%, respectively. The newly issued bonds for the month of April, issue numbers (FXD 2/2019/10) and (FXD 1/2019/20) with 10-years and 20-years tenors, were oversubscribed, with the performance rate coming in at 171.2%, with the 10 year bond generating more interest as per our expectations, receiving total bids of Kshs 70.9 bn out of the Kshs 85.6 bn bids for the entire issue. The accepted yields for the 10-year and 20-year bonds came in at 12.3% and 12.9% in line with our expectations of 12.1%-12.3% and 12.7%-12.9% for the 10-year and 20-year bonds, respectively. During the week, the World Bank released the Kenya Economic Update, April 2019, which paints a positive outlook for the country with economic growth still expected to remain stable at 5.7%, and above the historical average amid expectations of moderate inflationary pressures, but is still expected to remain within the government set target of 2.5%-7.5%;
Equities
During the week, the equities market was on an upward trend with NSE 20, NASI and NSE 25 gaining by 2.4%, 0.2% and 1.3%, respectively, taking their YTD performance to gains of 2.9%, 12.4% and 11.6%, for NSE 20, NASI and NSE 25, respectively. Standard Chartered (StanChart) Kenya launched an innovation hub lab in Nairobi dubbed eXellerator. Employees of Commercial Bank of Africa Group (CBA) are also set to emerge with a 1.3% stake, worth Kshs 870.0 mn in the merger between CBA group and NIC Group. Equity Bank Group’s share of Diaspora cash grew by 197.2% to Kshs 107.0 bn in 2018 from Kshs 36.0 bn in 2017;
Private Equity
During the week, Sanlam Group, a South African financial services firm, announced that it has sold an undisclosed amount of its stake in Sanlam Investments East Africa (SIEA), an asset management firm based in Kenya, for ZAR 101.0 mn (Kshs 730 mn) to an undisclosed party. In the FinTech sector, Branch International, a San Francisco-based mobile lender, with operations in Nigeria, Kenya and Tanzania, has raised USD 170 mn (Kshs 17.2 bn) in a 3rd round of fundraising deal led by Foundation Capital and Visa. The capital comprises of USD 100.0 mn (Kshs 10.1 bn) debt financing and USD 70.0 mn (Kshs 7.1 bn) in equity for an undisclosed stake;
Real Estate
In the industrial parks sector, Knight Frank released a report titled ‘Africa Horizons: A Unique Guide To Real Estate Investment Opportunities’ highlighting investment opportunities within Africa in trade and investment, residential and food and technology in 2019. As well during the week, Domino’s Pizza opened their latest outlet at Shell Petrol Station on Argwings Kodhek Road in Kilimani;
- Take your power selfie at Ruaka today, get the highest response on social media and win a brand new Samsung Galaxy S8 phone! The second winner shall be awarded on Monday 15th April 2019.*Terms & Conditions Apply! Tag and follow the conversation on Facebook here
- For an exclusive tour of the developments, visit: Sharp Investor’s Tour and for more information, email us at sales@cytonn.com;
- Following the recent approval by Retirement Benefits Authority (RBA), for Cytonn Asset Managers to manage pension funds, we are looking for business development consultants and agents with networks in the pensions industry to build our pensions business at very attractive commissions. If interested in being an agent or know someone who can be an agent, kindly contact us at pensions@cytonn.com;
- Following the completion and handover of Amara Ridge in Karen, we have now launched our next Karen project, dubbed Applewood, a Kshs 2.5 bn residential development located in Miotoni, Karen. This signature development shall comprise luxury homes, each sitting on 1/2 acre. We invite you to the exhibition of Applewood which is ongoing at the Amara Ridge Clubhouse (Location pin: https://goo.gl/maps/B3GVnu8pHyn) or at the Applewood Sales Centre on Miotoni Road (Location pin: https://goo.gl/maps/ZfABuGjFo1z) from 9:00 am to 5:00 pm daily. Call 0709 101 000 or email resales@cytonn.com to reserve a villa! See Video here;
- We continue to hold weekly workshops and site visits on how to build wealth through real estate investments. The weekly workshops and site visits target both investors looking to invest in real estate directly and those interested in high yield investment products to familiarize themselves with how we support our high yields. Watch progress videos and pictures of The Alma, Amara Ridge, and The Ridge. Key to note is that our cost of capital is priced off the loan markets, where all-in pricing ranges from 16.0% to 20.0%, and our returns on real estate developments range from 23.0% to 25.0%, hence our top-line gross spread is about 6.0%. If interested in attending the site visits, kindly register here;
- We continue to see very strong interest in our weekly Private Wealth Management Training (largely covering financial planning and structured products). The training is at no cost and is open only to pre-screened participants. We also continue to see institutions and investment groups interested in the training for their teams. Cytonn Foundation, under its financial literacy pillar, runs the Wealth Management Training. If interested in our Private Wealth Management Training for your employees or investment group, please get in touch with us through wmt@cytonn.com. To view the Wealth Management Training topics, click here;
- For recent news about the company, see our news section here;
- We have 10 investment-ready projects, offering attractive development and buyer targeted returns of around 23.0% to 25.0% p.a. See further details here: Summary of Investment-Ready Projects;
- We continue to beef up the team with ongoing hires for Financial and Real Estate Advisors for our offices in Nairobi, Nakuru, Kisumu, and Nyeri. Visit the Careers Section on our website to apply.
T-Bills & T-Bonds Primary Auction:
T-bills remained oversubscribed during the week, with the subscription rate declining to 148.1% from 250.2%, recorded the previous week. The decline in subscription rate was attributable to the 10-year and 20-year bond sale in the primary market that closed during the week. The yield on the 182-day paper declined to 8.1% from 8.2%, previously while the 91-day and 364-day papers remained unchanged at 7.4% and 9.4%, respectively. The acceptance rate improved to 79.2% from 70.9% recorded the previous week, with the government accepting a total of Kshs 28.1 bn of the Kshs 35.6 bn worth of bids received, higher than its weekly quantum of Kshs 24.0 bn. The subscription rate for the 91-day paper improved to 122.7%, from 107.2%, recorded the previous week, while that of the 182-day and 364-day papers declined to 76.4% and 230.0% from 102.6% and 456.5%, recorded the previous week, respectively. Investors’ participation remained skewed towards the longer dated paper, with the continued demand being attributable to the scarcity of newer short-term bonds in the primary market.
The newly issued bonds for the month of April, issue numbers (FXD 2/2019/10) and (FXD 1/2019/20) with 10-years and 20-years tenors, were oversubscribed, with the performance rate coming in at 171.2%. The 10-year bond generated more interest, which was in line with our expectations, recording total bids of Kshs 70.9 bn out of the Kshs 85.6 bn worth of bids for the entire issue as investors continued to avoid the longer-tenor bonds due to the relatively flat yield curve on the long-end brought about by the saturation of long-term bonds, coupled with the duration risk associated with long-term papers. The accepted yields for the 10-year and 20-year bonds came in at 12.3% and 12.9% in line with our expectations of 12.1% -12.3% and 12.7%-12.9% for the 10-year and 20-year bonds, respectively.
Liquidity:
The market remained relatively liquid with the average interbank declining to 1.7% from 3.2%, recorded the previous week supported by Government payments. The average volumes traded in the interbank market rose by 289.6% to Kshs 3.6 bn, from Kshs 1.6 bn the previous week.
Kenya Eurobonds:
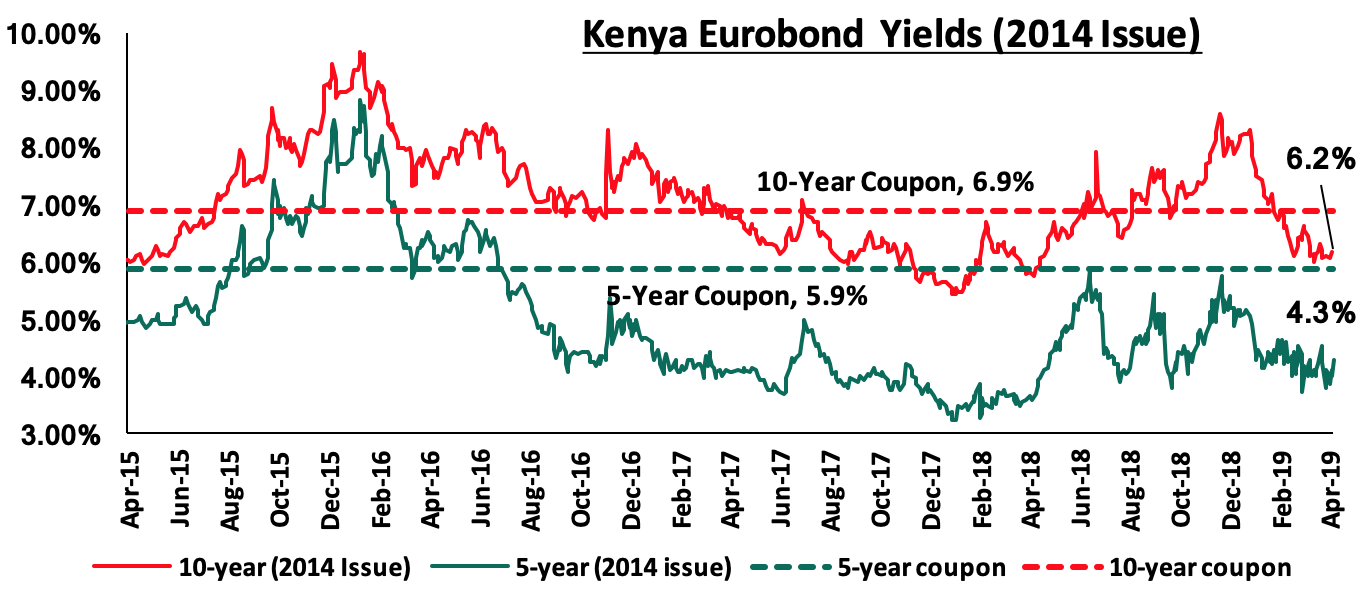
According to Bloomberg, the yield on the 10-year Eurobonds issued in 2014 rose by 0.1% points to 6.2% from 6.1%, while that of the 5-year rose by 0.2% points to 4.3% from 4.1% the previous week. Since the mid-January 2016 peak, yields on the Kenyan Eurobonds have declined by 4.5% points and 3.4% points for the 5-year and 10-year Eurobonds, respectively, an indication of the relatively stable macroeconomic conditions in the country. Key to note is that these bonds have 0.2-years and 5.2-years to maturity for the 5-year and 10-year, respectively.
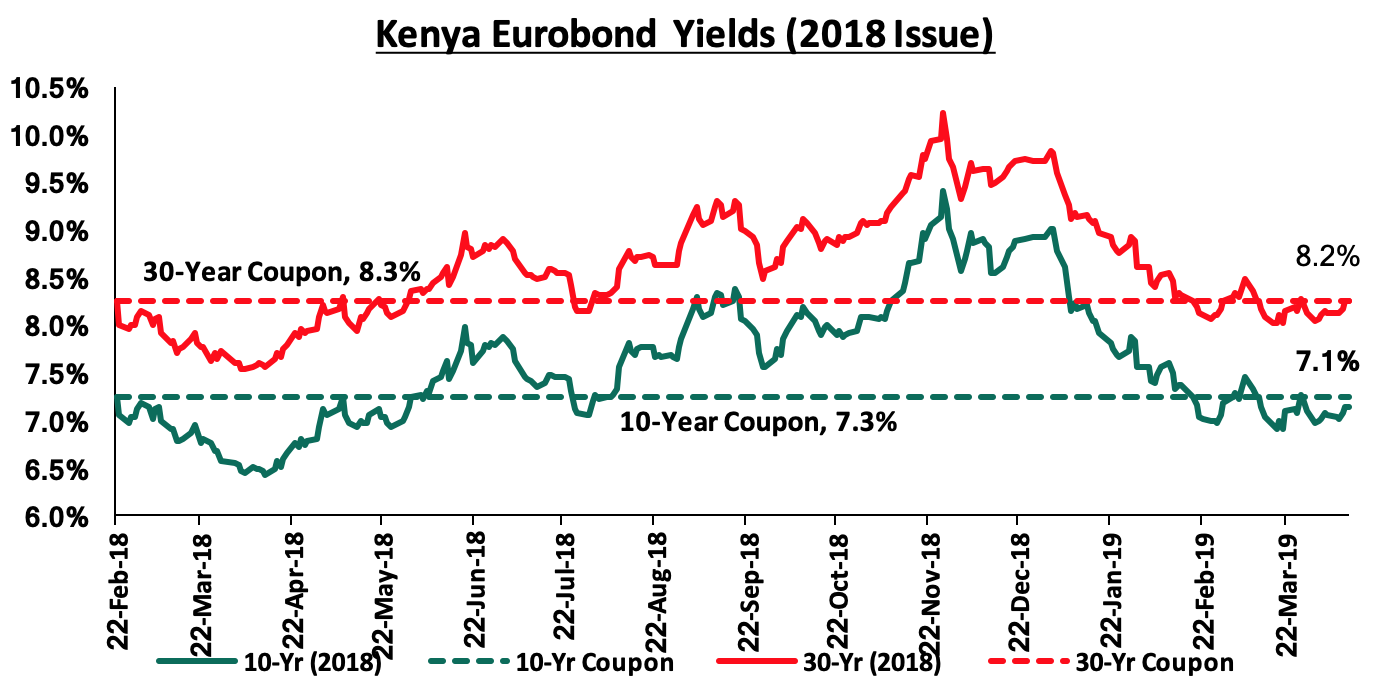
For the February 2018 Eurobond issue, during the week, the yields on 10-year Eurobond remained unchanged at 7.1%, while the yield on the 30-year Eurobond rose by 0.1% points to 8.2% from 8.1% recorded the previous week. Since the issue date, the yields on the 10-year Eurobond has declined by 0.2% points while that of the 30-year Eurobond has increased by 0.1% points.
The Kenya Shilling:
During the week, the Kenya Shilling lost by 0.2% against the US Dollar to close at Kshs 101.0, from Kshs 100.7 the previous week attributable to increased dollar demand from importers amidst excess liquidity in the money markets. The Kenya Shilling has appreciated by 0.9% year to date in addition to 1.3% in 2018, and in our view the shilling should remain relatively stable to the dollar in the short term, supported by:
- The narrowing of the current account deficit with preliminary data on balance of payments indicating continued narrowing to 4.7% of GDP in the 12-months to February 2019, from 5.5% recorded in February 2018. The decline has been attributed to improved agriculture exports, increased diaspora remittances, strong receipts from tourism, and lower food and SGR-related equipment relative to 2017,
- Improving diaspora remittances, which increased by 17.2% m/m in January 2019 to USD 244.8 mn from USD 208.9 mn recorded in a similar period of review in 2018. The rise is due to:
- Increased uptake of financial products by the diaspora due to financial services firms, particularly banks, targeting the diaspora, and,
- New partnerships between international money remittance providers and local commercial banks making the process more convenient,
- CBK’s supportive activities in the money market, such as repurchase agreements and selling of dollars, and,
- High levels of forex reserves, currently at USD 8.1 bn, equivalent to 5.3-months of import cover, above the statutory requirement of maintaining at least 4-months of import cover, and the EAC region’s convergence criteria of 4.5-months of import cover.
The highlight of the Week:
During the week, the World Bank released the Kenya Economic Update, April 2019. Below are the key take-outs from the report:
- Economic Growth: Kenya’s economy expanded by 6.0% in the first 3 quarters of 2018, which was an improvement from 4.7% for a similar period of review in 2017. The growth was mainly boosted by improved output from the agricultural sector following favorable weather conditions, increased private consumption which was also as a result of muted inflation and stronger diaspora remittances inflows. The World Bank however noted that the contribution of public investment to GDP growth had been on a decline mainly due to completion of key flagship projects as well as the fiscal consolidation efforts by the government, which has seen limited funds to new projects with the government mainly focused on the completion of the existing ones and projects aligned to the ’Big 4 agenda’. Due to risks emanating from the delayed start to the March-May 2019 long rains, the World Bank cut the country’s growth forecast to 5.7% from 5.8% as per October 2018 Economic update due to expectations of constrained capital spending following the ongoing emergency intervention to address food shortages in several counties which could impose fiscal pressure.
- Inflation to remain muted and within the government set a target of 2.5%-7.5%: Inflation is expected to remain within the set target of 2.5%-7.5%. The downward risk to this, however, emanates from the recent update to the weather outlook by the Kenya Meteorological Department indicating risk of drought to be high with some counties already experiencing incidents of famine following the delayed start of the March-May 2019 drops of rain that could drive food inflation up.
- Continued narrowing of the current account deficit: The country’s current account deficit narrowed to 4.9% of GDP in 2018 from 6.3% in 2017 anchored by:
- Improved diaspora remittances which grew by 38.6% in 2018 to USD 2.7 bn, from USD 1.9 bn recorded in 2017,
- A rise in the total value of Kenya’s principal exports i.e. tea, coffee, and horticulture, which rose by 0.8% to Kshs 268.0 bn in 2018 from Kshs 265.8 bn in 2017, and,
- A stronger rise in tourism receipts with data from KNBS showing that the number of landings in the 2 major airports increased by 35.1% in the 11 months to November 2018 to 98,045 from 72,573 in a similar period of review in 2017.
The World Bank, however, expects the current account deficit to widen to 5.5% in 2019 from 4.9% in 2018 driven by (i) a higher import bill arising from a pick-up in domestic demand as well as rising global trade tensions that could affect Kenya’s exports and remittance inflows, and (ii) an unanticipated spike in oil prices. The narrowed current account deficit has consequently led to the strengthening of the Kenya Shilling having appreciated by 1.3% in 2018 and already having appreciated by 0.9% in 2019 YTD. A further appreciation, however, raises the risks of reduced competitiveness of the country's main exports.
- Monetary policy: With the expectations of muted inflationary pressure and stable economic growth, the monetary policy stance is expected to remain accommodative. The World Bank has however echoed the concerns of the Central Bank of Kenya (CBK), on the effects of the interest rate cap, which has constrained the monetary policy space, as the interest rate cap severely constrains the formulation, conduct, and effectiveness of monetary policy. CBK’s assessment of the impact of interest rate caps showed that the caps had weakened the effectiveness of monetary policy transmission, with further evidence of perverse outcomes. In particular, the transmission of changes in the Central Bank Rate to growth and inflation takes longer compared to the period before caps.
- The slowdown in the rise of public debt: Public debt remained at about 57.5% of GDP in 2018. The ongoing fiscal consolidation has halted the rapid rise in the stock of public debt that saw Kenya’s debt to GDP ratio stabilizing in FY’2017/2018 to 56.5% from 57.6% in FY’2016/2017, mainly attributed to a decline in the fiscal deficit coupled with faster growth in GDP. On the flip side, however, interest payments’ contribution to debt stock increased from an average of 2.9% of GDP in FY’2015/16 to an average of 3.4% of GDP over the FY’2017/18 period.
In summary, the report paints a positive outlook of the country with economic growth still expected to remain stable and above the 5-year average of 5.5%, expectations of moderate inflationary pressures despite the risk of unanticipated price shocks, but still expected to remain within the government’s set target of 2.5%-7.5%. The fiscal consolidation by the Government is plausible but the quality of the consolidation is still a major issue with the full burden of the adjustment being shouldered by cuts in development spending which decreased to 5.3% of GDP in FY’2017/2018 from 8.4% percent of GDP in FY’206/2017. Underperformance in revenue mobilization also remains a key impediment to fiscal consolidation efforts by the Government, having managed to raise Kshs 794.7 bn in H1’2018/2019 against a target of Kshs. 855.7 bn (92.9% of the target) as we highlighted in Cytonn Weekly #08/2019. The interest rate cap has also continued to constrain the monetary policy space, as well as crowd out the private sector with private sector credit growth, has averaged 3.3% in 2018 below the 5-year historical average of 12.4%. Repeal or modification of the interest rate cap is required in order to provide a conducive environment for lenders to price credit risks, thereby curbing the rationing of credit to SME’s and individuals perceived as riskier by commercial banks and in extension support private sector investment and sustainable economic growth.
Below is a table showing average projected GDP growth for Kenya in 2019 updated with the World Bank's and International Monetary Fund (IMF) downward revision to 5.7% and 5.8% from 5.8% and 6.1%, respectively; noteworthy being that the highest projection is by the Central Bank of Kenya at 6.3%.
|
No. |
Kenya 2019 Annual GDP Growth Outlook |
|
|
1 |
Central Bank of Kenya |
6.3% |
|
2 |
International Monetary Fund (IMF) |
5.8% |
|
3 |
Citigroup Global Markets |
6.1% |
|
4 |
African Development Bank (AfDB) |
6.0% |
|
5 |
PNB Paribas |
6.0% |
|
6 |
UK HSBC |
6.0% |
|
7 |
Euromonitor International |
5.9% |
|
8 |
World Bank |
5.7% |
|
9 |
Cytonn Investments Management Plc |
5.8% |
|
10 |
FocusEconomics |
5.8% |
|
11 |
JPMorgan |
5.7% |
|
12 |
Euler Hermes |
5.7% |
|
13 |
Oxford Economics |
5.6% |
|
14 |
Standard Chartered |
5.6% |
|
15 |
Capital Economics |
5.5% |
|
16 |
Fitch Solutions |
5.2% |
|
|
Average |
5.8% |
Rates in the fixed income market have remained relatively stable as the government rejects expensive bids, being currently 27.0% ahead of its domestic borrowing target for the current financial year, having borrowed Kshs 318.0 bn against a pro-rated target of Kshs 250.5 bn. A budget deficit is likely to result from depressed revenue collection, creating uncertainty in the interest rate environment as additional borrowing from the domestic market goes to plug the deficit. Despite this, we do not expect upward pressure on interest rates due to increased demand for government securities, driven by improved liquidity in the market owing to the relatively high debt maturities. Our view is that investors should be biased towards medium-term fixed income instruments to reduce duration risk associated with long-term debt, coupled with the relatively flat yield curve on the long-end due to saturation of long-term bonds.
Market Performance:
During the week, the equities market was on an upward trend with NSE 20, NASI and NSE 25 gaining by 2.4%, 0.2%, and 1.3%, respectively, taking their YTD performance to gains of 2.9%, 12.4%, and 11.6%, for NSE 20, NASI and NSE 25, respectively. The performance in NASI was driven by gains in large-cap stocks such as EABL, Barclays Bank of Kenya and NIC Bank, which gained by 0.8%, 0.8% and 0.6%, respectively.
Equities turnover declined by 15.7% during the week to USD 23.2 mn, from USD 27.5 mn the previous week, taking the YTD turnover to USD 497.0 mn. Foreign investors were net sellers for the week, with the net selling position coming in at USD 2.5 mn, from last week’s net buying position of USD 0.5 mn.
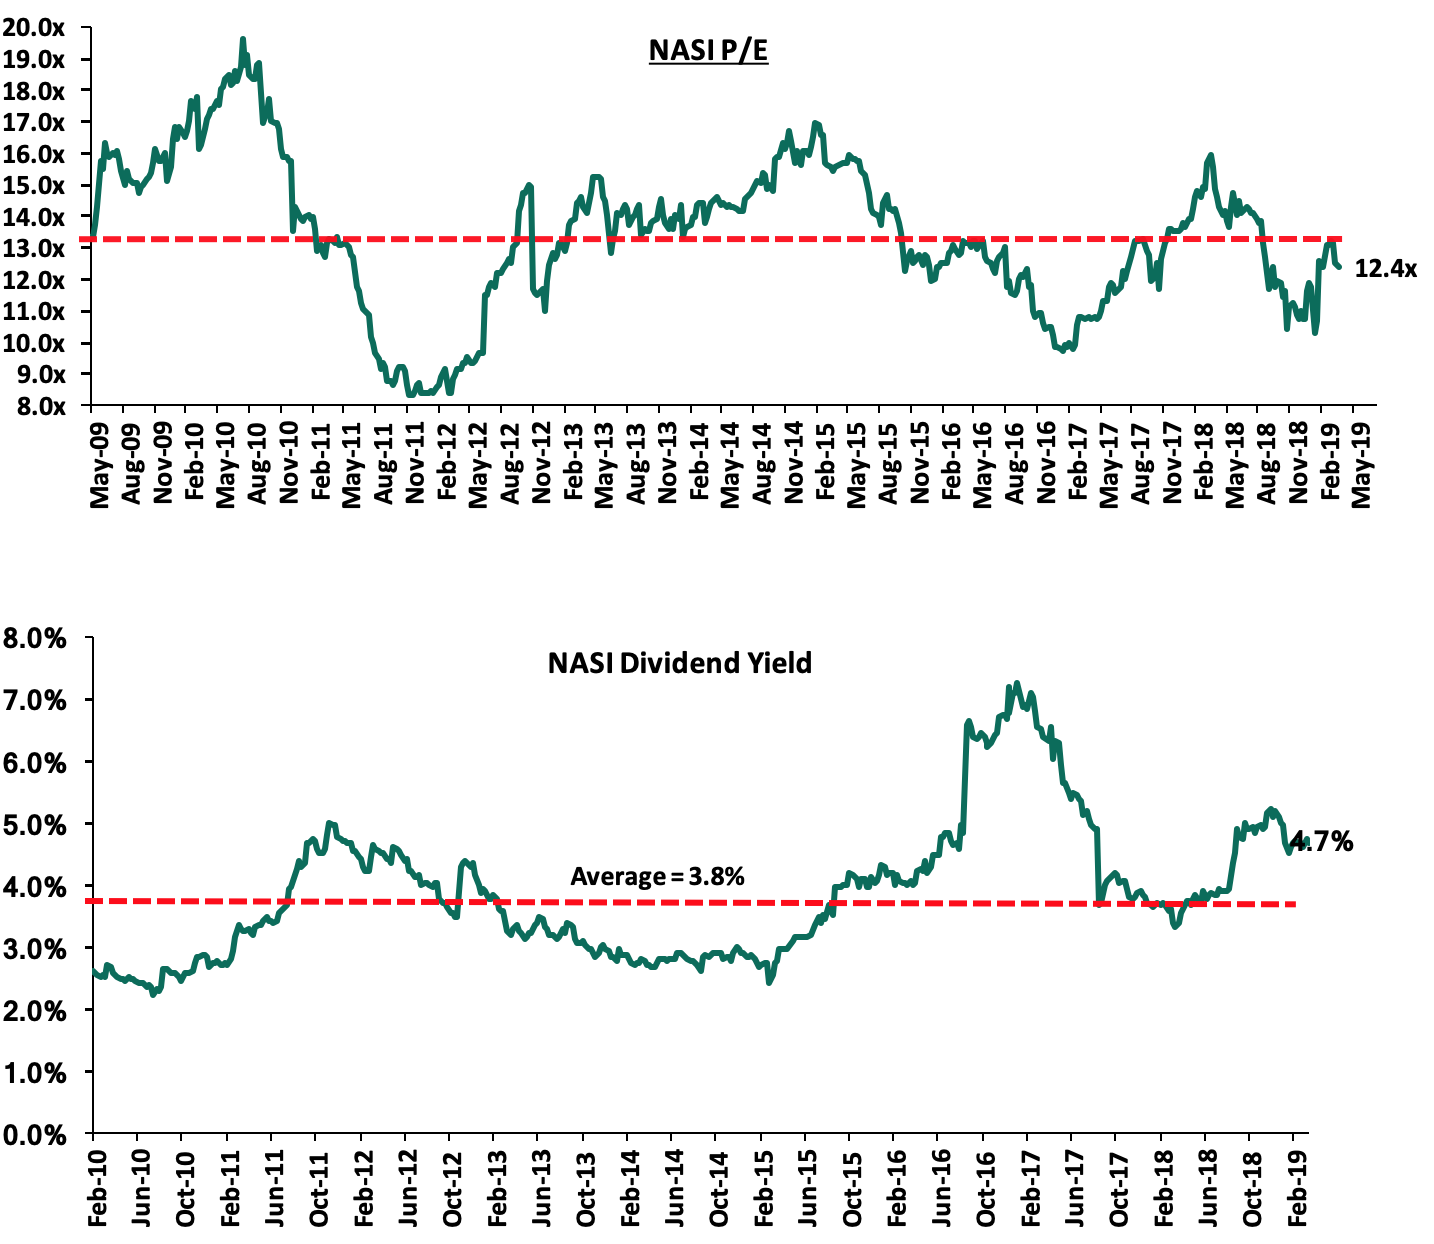
The market is currently trading at a price to earnings ratio (P/E) of 12.4x, 7.4% below the historical average of 13.4x, and a dividend yield of 4.7%, above the historical average of 3.8%. With the market trading at valuations below the historical average, we believe that there is still value in the market. The current P/E valuation of 12.4x is 27.7% above the most recent trough valuation of 9.7x experienced in the first week of February 2017, and 49.3% above the previous trough valuation of 8.3x experienced in December 2011. The charts below indicate the historical P/E and dividend yields of the market.
Weekly Highlights
During the week, Standard Chartered (StanChart) Kenya launched an innovation hub lab in Nairobi dubbed Xcelerator. This is a bid to boost its revenue streams and diversify by riding on financial technology. StanChart plans to allocate Kshs 10.0 bn into supporting Financial Technology (FinTech) startups to scale up and generate innovative solutions to problems in the banking sector. StanChart views FinTech firms as partners amid their growing disruption of the local financial sector. The Nairobi hub will be run by the lender’s business unit, SC Ventures Kenya, and will engage tech innovators with an eye on investing in viable FinTechs for product activation within home markets and across the world. In our view, FinTech companies are an attractive investment due to;
- High Returns - According to data collected by Crunchbase, since 2007, Fintech start-ups have raised an average of Kshs 4.1 bn (USD 41.0 mn) in Venture Capital and exited for an average value of Kshs 24.5 bn (USD 242.9 mn). This gives investors a better opportunity to invest in a sector that attracts a growing pool of new investors and in the end exit at a high price,
- Attractive Realization Periods - Many Fintech companies start showing profits by year three hence giving a chance for investors to realize their gains early, and,
- Cheaper Running Costs - They are cheaper to run since a FinTech company is not weighed down by the same burden of costly regulation that governs traditional businesses
Employees of Commercial Bank of Africa Group (CBA) are set to emerge with a 1.3% stake worth Kshs 870.0 mn in the merger between CBA Group and NIC Group. NIC, which currently has no Employee Share Ownership Plan (ESOP), will create one to accommodate workers of CBA, which has an ESOP for the benefit of its employees that holds 2.5% of the shares of CBA. Besides CBA staff who are already entitled to shares under their current employer, the scheme is expected to admit more members including current NIC employees following the completion of the merger. NIC Group, which will remain listed on the Nairobi Securities Exchange (NSE), will be the vehicle to house the owner of the merged entity in which CBA shareholders will take a 53% stake. For existing employees of the privately-held CBA Group, the new scheme will give them an easier means of selling their shares on the stock market. Some of the benefits of ESOPs include:
- It increases a company's competitiveness and attractiveness to employees, thus enabling them to attract and retain top talent. Especially for professional services firms, talent is the defining factor in competitiveness, hence employers must consider innovative and long-term ways of incentivizing their employees,
- ESOPs are also favored by small and medium-sized enterprises when developing an incentive, and, compensation structure, as they do not involve a direct cash outflow, like a bonus payment would, and,
- Employees are able to sell their shares on the market, usually at again, enabling them to benefit from capital appreciation when the company shares perform well.
Equity Bank Group’s share of Diaspora cash grew by 197.2% to Kshs 107.0 bn in 2018 from Kshs 36.0 bn in 2017. Diaspora banking earned the bank Kshs 751.0 mn in commissions charged for facilitating the cash transfers from abroad, in 2018, a 169.2% increase from Kshs 279.0 mn in 2017. The commission rate however declined by 0.1% points to 0.7% in 2018, from 0.8% in 2017. Diaspora remittances grew by 38.6% in 2018 to Kshs 272.0 bn from Kshs 196.3 bn in 2017, consolidating the position of Kenyans abroad as the country’s top foreign exchange earners ahead of tourism which earned, Kshs 157.4 bn in 2018, horticultural exports which earned Kshs 153.7 bn in 2018 and tea which eared Kshs 140.9 bn in 2018, according to the data from Central Bank of Kenya. The diaspora remittances data implies that Equity Bank handled 39.3% of the Diaspora remittances to Kenya. Despite this Equity Banks Non-Interest Income declined by 6.3% to Kshs 25.9 bn in 2018 from Kshs 27.6 bn in 2017 mainly attributed to a 16.6% decline in fees and commissions on loans to Kshs 4.9 bn in 2018 from Kshs 5.9 bn in 2017 and a 19.5% decline in FX trading income to Kshs 3.3 bn in 2018 from Kshs 4.1 bn in 2017. See the Equity Group FY’2018 Earnings Note.
Universe of Coverage
Below is a summary of our SSA universe of coverage:
Kenyan banks have been excluded, as they are under review following the release of the FY’2018 results.
|
Banks |
Price as at 5/04/2019 |
Price as at 12/04/2019 |
w/w change |
YTD Change |
Year Open |
Target Price* |
Dividend Yield |
Upside/Downside** |
P/TBv Multiple |
Recommendation |
|
GCB Bank |
3.9 |
4.0 |
0.8% |
(13.7%) |
4.6 |
7.7 |
9.6% |
104.0% |
0.9x |
Buy |
|
UBA Bank |
6.2 |
6.5 |
4.8% |
(15.6%) |
7.7 |
10.7 |
13.1% |
77.7% |
0.4x |
Buy |
|
Zenith Bank |
20.4 |
20.5 |
0.5% |
(11.3%) |
23.1 |
33.3 |
13.2% |
76.1% |
0.9x |
Buy |
|
Access Bank |
5.7 |
6.0 |
4.4% |
(12.5%) |
6.8 |
9.5 |
6.7% |
66.4% |
0.4x |
Buy |
|
CRDB |
125.0 |
125.0 |
0.0% |
(16.7%) |
150.0 |
207.7 |
0.0% |
66.2% |
0.4x |
Buy |
|
CAL Bank |
1.1 |
1.0 |
(1.9%) |
5.1% |
1.0 |
1.4 |
0.0% |
35.9% |
0.9x |
Buy |
|
Ecobank |
8.0 |
8.0 |
0.0% |
7.1% |
7.5 |
10.7 |
0.0% |
33.6% |
1.8x |
Buy |
|
Union Bank Plc |
7.0 |
6.5 |
(7.1%) |
16.1% |
5.6 |
8.2 |
0.0% |
25.4% |
0.7x |
Accumulate |
|
SBM Holdings |
6.0 |
5.9 |
(1.0%) |
(1.0%) |
6.0 |
6.6 |
5.1% |
16.3% |
0.9x |
Accumulate |
|
Bank of Kigali |
275.0 |
275.0 |
0.0% |
(8.3%) |
300.0 |
299.9 |
5.0% |
14.1% |
1.5x |
Accumulate |
|
Guaranty Trust Bank |
35.0 |
35.1 |
0.1% |
1.7% |
34.5 |
37.1 |
6.8% |
12.7% |
2.2x |
Accumulate |
|
Bank of Baroda |
130.0 |
129.2 |
(0.6%) |
(7.7%) |
140.0 |
130.6 |
1.9% |
3.0% |
1.1x |
Lighten |
|
Stanbic Holdings |
100.0 |
97.5 |
(2.5%) |
7.4% |
90.8 |
92.6 |
6.0% |
1.0% |
1.0x |
Lighten |
|
Standard Chartered |
215.3 |
207.0 |
(3.8%) |
6.4% |
194.5 |
196.3 |
6.0% |
0.9% |
1.7x |
Lighten |
|
Standard Chartered |
20.0 |
19.5 |
(2.5%) |
(7.1%) |
21.0 |
19.5 |
0.0% |
(0.2%) |
2.5x |
Sell |
|
FBN Holdings |
7.4 |
7.5 |
2.0% |
(5.7%) |
8.0 |
6.6 |
3.3% |
(8.3%) |
0.4x |
Sell |
|
Ecobank Transnational |
11.6 |
10.7 |
(7.8%) |
(37.1%) |
17.0 |
9.3 |
0.0% |
(13.3%) |
0.4x |
Sell |
|
Stanbic IBTC Holdings |
46.3 |
46.0 |
(0.5%) |
(4.1%) |
48.0 |
37.0 |
1.3% |
(18.3%) |
2.4x |
Sell |
|
*Target Price as per Cytonn Analyst estimates **Upside / (Downside) is adjusted for Dividend Yield ***Banks in which Cytonn and/or its affiliates holds a stake. ****Stock prices indicated in respective country currencies Kenyan banks are currently under review following the release of the FY’2018 results |
||||||||||
We are “Positive” on equities since the sustained share price declines have seen the market P/E decline to below its historical average. We expect increased market activity, and possibly increased inflows from foreign investors, as they take advantage of the attractive valuations, to support the positive performance.
Sanlam Group, a South African financial services firm, has sold an undisclosed amount of its stake in Sanlam Investments East Africa (SIEA), an asset management firm based in Kenya, for ZAR 101.0 mn (Kshs 730 mn) to an undisclosed party. This move comes less than two-years after Sanlam bought a 75% stake in the former PineBridge Investments East Africa for an undisclosed amount, after which it rebranded to Sanlam Investments East Africa. Sanlam Investments East Africa currently manages an asset portfolio of over Kshs 200.0 bn, with a Money Market Fund size of Kshs 1.7 bn as at 31st December 2019, ranking it as the 5th largest asset manager in Kenya in terms of assets under management for Money Market Funds. Other similar transactions in the past include the sale of 90.9% stake in GenAfrica Asset Managers by the staff of GenAfrica Asset Managers, who held 17.5% stake, and Centum Investments, who held 73.4% stake, to Kuramo Capital in March 2018 and the acquisition of 100.0% stake of ApexAfrica Capital by Axis a Mauritian private equity fund in 2015 for Kshs 470.0 mn.
This announcement came just as the Liberty Group, a South African insurance firm, put on sale its Kenyan investment advisory business, Stanlib, a move informed by Liberty’s plan to exit its asset management operations in Kenya and Botswana, citing low historical returns, competition and political risks in their respective markets. In spite of this, there has been positive traction in the financial services sector in Kenya, this being the second time we have had an acquisition in the financial services sector in Kenya this year, with AfricInvest and Catalyst Principal Partners acquiring a minority stake in Prime Bank Kenya, in addition to the 10 acquisitions in 2018. For more information, see our Prime Bank Kenya Acquisition Note. We expect to see more activity in the financial services sector this year, given the growth of financial inclusion and regulation that require institutions to increase their capital requirements across the sector consequently providing an opportunity for mergers and acquisitions.
Branch International, a San Francisco-based mobile lender, with operations in Nigeria, Kenya and Tanzania, has raised USD 170.0 mn (Kshs 17.2 bn) in a 3rd round fundraising deal, led by Foundation Capital and Visa. The capital comprises USD 100.0 mn (Kshs 10.1 bn) debt financing and USD 70.0 mn (Kshs 7.1 bn) in equity for an undisclosed stake. The funds raised will be used for international expansion to South America and Asia. The partnership with Visa will allow borrowers to obtain virtual Visa accounts with which they will create accounts on Branch’s mobile app. This will allow access of financial services in countries such as Nigeria, where cards have factored more significantly than mobile money, given that there has not been as wide coverage by mobile money in the rest of Africa as compared to Kenya. This comes barely less than a year since Branch raised Kshs 350.0 mn (USD 3.5 mn) in capital investment based on its second issued commercial paper in the Kenyan market. For more information, see our Cytonn Weekly #27/2018. The lender has issued at least 13 mn digital loans and disbursed Kshs 35.3 bn (USD 350.0 mn) since its inception in 2015.
The funding round emerges as the highest capital raise in the FinTech sector since January 2018 by Africa-focused FinTech startups, with the 2nd being Jumo, who raised a total of USD 64.5 mn (Kshs 6.6 bn) in equity investments from various investors, including Odey Asset Management, Goldman Sachs, Proparco , Finnfund, Vostok Emerging Finance, Gemcorp Capital and LeapFrog Investments. For more information, see our Cytonn Weekly #49/2018. The transaction further cements the position and reputation of FinTech companies as the most investor-attractive sector in Africa, as the space has been taking the lion’s share of investments, with a reported fundraising value of over Kshs 27.0 bn over the year 2018. The growing investor interest in FinTech is driven by;
- Africa’s low penetration rates for traditional banking services at 25 % according to the Global Findex database,
- Higher mobile penetration at 44% according to the GSMA 2017 Report, and,
- Untapped potential in credit related industries in Africa, highlighted by the significant difference in credit extension activity in Africa compared to other world regions.
We maintain a positive outlook on private equity investments in Africa as evidenced by the increasing investor interest, which is attributed to; (i) economic growth, which is projected to improve in Africa’s most developed PE markets, (ii) attractive valuations in Sub Saharan Africa’s private markets compared to its public markets, and (iii) attractive valuations in Sub Saharan Africa’s markets compared to global markets. Going forward, the increasing investor interest, stable macro-economic and political environment will continue to boost deal flow into African markets.
- Industrial Parks Sector
During the week, Knight Frank, a real estate management firm, released a report titled ‘Africa Horizons: A Unique Guide To Real Estate Investment Opportunities’ that highlighted investment opportunities within Africa with key focus in trade and investment, residential, food and technology in 2019. According to the report, the (i) African Continental Free Trade Agreement, (ii) increase in middle-income households, and (iii) competition for multilateral cooperation in Africa are the key factors driving general investment in Africa. The major take outs from the report include:
- Foreign Direct Investment (FDI) - Kenya is among the Top 5 recipients of FDI in Africa thus driving domestic investment projects, according to EY Attractiveness Report 2018,
- Investment in Student Housing - The number of students in Kenya is growing exponentially and current hostels cannot keep up with demand. The latest Kenyan National Bureau of Statistics estimates from 2017 put the number of students at 520,893 and with expected growth of youth between the age bracket of 15 and 24-years by 15% to 1.5 mn by 2023, this is likely to increase and operators in the student accommodation market already run near to full capacity,
- Hospitality – The Kenyan hospitality industry recorded Revenue per available room (RevPAR) and occupancy rates of Kshs 6,462 and 52.0%, respectively, 20.1% and 9.0% points below the market average of Kshs 11,207 and 61%, respectively,
- Kenya is the logistics hub of East Africa supported by the significant new investments into the sector, including the rail link between Nairobi and Mombasa, and the Kenyan Government’s focus on the manufacturing sector under the Big 4 Agenda,
- Increasing demand for storage facilities and sophisticated logistics properties in Nairobi driven by continued expansion of international retailers such as Shoprite and Carrefour,
- The report foresees a continued shift in activities from the existing industrial area due to challenges such as poor infrastructure and high land costs, to satellite towns such as Ruiru supported by increased demand for centralized warehouses by retailers,
- The most significant logistics and light manufacturing development to take advantage of this improved accessibility is Tatu Industrial Park, which has sold off 80% of its first phase. Other notable industrial and warehouse parks include Africa Logistics Properties (APL) North and Tilisi Logistics Park.
This report findings are in line with our Cytonn H1’2018 Markets Review, which indicates that the industrial sector recorded improved performance with rental yields and occupancy rates increasing by 0.7% and 11.8% points, respectively, to 6.1% and 89.1% in H1’2018, from 5.4% and 77.3% in H1’2017, respectively. This was attributed to increased investor confidence as a result of a stable political climate and primary focus on manufacturing by the government as part of the Big 4 Agenda, and increased demand for Grade A warehouses by distribution, fast-moving consumer goods (FMCG) and construction companies.
We have a positive outlook for the industrial sector in Nairobi. We expect continued growth in the industrial sector with development of industrial parks and warehouses in areas with low supply, adequate infrastructure and affordable land prices such as Ruiru and Athi River supported by the government’s goal to increase the manufacturing sector’s contribution to GDP from 9.2% in 2016 to 20.0% by 2022 through establishment of industrial parks, Special Economic Zones, and implementation of policies to boost processing of textiles, leather, oil, gas, construction material, foods, fish, iron and steel
- Retail Sector
Kenya’s retail sector has been vibrant over the past few years, attracting interest from renowned international retailers as well as the robust expansion of local retailers. The trend continues, and during the week, American pizza restaurant, Domino’s Pizza opened their seventh outlet in Kenya at Shell Petrol Station on Argwings Kodhek Road in Kilimani, Nairobi. In our view the international retailer’s expansion into Kenya is supported by;
- Increased disposable income as a result of an expanding middle class thus creating demand for high-end restaurants and casual dining areas, with GDP per Capita growing at a rate of 7.9% p.a over the last 5-years, from Kshs 113,539 in 2013 to Kshs 166,314 in 2017,
- A positive demographic dividend, with a population growth rate of approximately 2.5% p.a. and a high urbanization rate of 4.3%, compared to the global average of 2.1%, hence an increase in demand for restaurants, and,
- Stable economic growth, with Kenya’s GDP growth averaging at 5.4% over the last five-years and set to come in at 5.8% in 2018 and expected GDP growth between 5.7% and 5.9% in 2019, according to Cytonn Research, thus, creating an enabling environment for the retailers to make desirable profits.
In our view, the Kilimani area presents a viable opportunity for the business due to its: (i) good infrastructure network and security, (ii) proximity to other commercial hubs such as Nairobi CBD, Westlands and Upperhill with several firms that regularly seek premises for business meetings, (iii) positioning as an affluent neighbourhood hosting middle to high-income earners with relatively high purchasing power, and (iv) attractiveness to a number of international organizations such as International Committee of the Red Cross (ICRC), Oxfam, among others, hence hosting a large expatriate population, who comprise of the restaurant’s target market. The continued expansion of retailers will lead to increased retail space uptake in the area thus improving the overall performance of the sector. For investors in retail real estate, Kilimani area, which includes Kileleshwa and Lavington, records an average rental yield of 10.4% and occupancy rate 90.8%, compared to the market average rental yield and occupancy rate of 8.4% and 76.8%, respectively according to Cytonn Q1’2019 Markets Review. This therefore portrays Kilimani as a viable investment destination for both retailers and retail real estate developers.
The table below shows the summary of Nairobi Metropolitan Area submarket performance in Q1’2019:
|
Summary of Nairobi’s Retail Market Performance – Q1’2019 |
|||
|
Location |
Rent Kshs/SQFT Q1’ 2019 |
Occupancy Q1’ 2019 |
Rental Yield Q1’ 2019 |
|
Westlands |
218 |
85.0% |
11.5% |
|
Kilimani |
173 |
90.8% |
10.4% |
|
Ngong Road |
173 |
90.0% |
9.8% |
|
Karen |
225 |
73.6% |
9.3% |
|
Eastlands |
154 |
72.7% |
7.7% |
|
Kiambu Road |
169 |
69.8% |
7.5% |
|
Thika road |
168 |
70.8% |
7.3% |
|
Mombasa Road |
153 |
66.0% |
6.8% |
|
Satellite Towns |
135 |
72.2% |
6.3% |
|
Average |
174 |
76.8% |
8.4% |
|
|||
Source: Cytonn Research 2019
We expect the real estate sector to continue recording increased activities supported by the continued entry of international retailers and expansion of local retailers in prime locations in addition to capitalise on favourable returns in other sectors such as industrial parks.
Disclaimer: The views expressed in this publication are those of the writers where particulars are not warranted. This publication, which is in compliance with Section 2 of the Capital Markets Authority Act Cap 485A, is meant for general information only and is not a warranty, representation, advice or solicitation of any nature. Readers are advised in all circumstances to seek the advice of a registered investment advisor.

- Talk to us
- Kenya
- P.O Box 20695 - 00200, Nairobi, Kenya
- Cell +254709101200
- Tel +254709101200
- WhatsApp +254741676635
- United States
- +254709101200
- DOWNLOAD OUR APP
-


- Kenya
- 8th Floor, Pinetree Plaza, Kaburu Drive, Ngong Road, Nairobi, Kenya
- USA
- Suite 1150, 1775 Eye Street NW, USA, Washington DC 20006, USA
- Investments
- High Yield
- Private Equity
- Real Estate
- Real Estate
- RiverRun Estates
- Cytonn Towers
- The Ridge
- Taraji Heights
- The Alma