Cytonn Monthly-August 2023
By Research, Sep 3, 2023
Executive Summary
Fixed Income
During the month of August 2023, T-bills were oversubscribed, with the overall average subscription rate coming in at 132.2%, up from the 103.9% recorded in July 2023. The overall average subscription rate for the 364-day paper declined to 14.9% from 17.3% recorded in July 2023, while the subscription rate for the 182-day and 91-day papers increased to 40.1% and 655.8% from the 29.4% and 506.7% respectively recorded in July 2023. The average yields on the 364-day and 91-day papers increased by 1.1% points each to 13.6% and 13.3% respectively, while the average yield on the 182-day paper increased by 1.0% points to 13.2%. For the month of August, the government accepted a total of Kshs 122.1 bn of the Kshs 126.9 bn worth of bids received, translating to an acceptance rate of 96.2%;
Additionally, August 2023 bonds were oversubscribed, with the overall subscription rate coming in at 125.6%, albeit lower than the oversubscription rate of 160.3% recorded in July 2023. The newly issued bond FXD1/2023/02 and the reopened FXD1/2023/05 received bids worth Kshs 53.0 bn against the offered Kshs 40.0 bn, translating to an oversubscription rate of 132.5%, with the government accepting bids worth Kshs 19.1 bn, translating to an acceptance rate of 36.1%. Their subsequent tap sale received bids worth Kshs 23.6 bn against the offered Kshs 21.0 bn, translating to an oversubscription rate of 112.4%, with the government accepting bids worth Kshs 23.5 bn translating to an acceptance rate of 99.6%;
During the week, T-bills were undersubscribed for a second consecutive week, with the overall subscription rate coming in at 96.6%, up from 95.8% recorded the previous week. Investors’ preference for the shorter 91-day paper persisted, with the paper receiving bids worth Kshs 21.6 bn against the offered Kshs 4.0 bn, translating to an oversubscription rate of 539.8%, higher than the subscription rate of 455.4% recorded the previous week. The subscription rate for the 364-day and 182-day papers decreased to 6.2% and 9.6%, respectively, from 22.0% and 25.8% recorded the previous week. The government accepted a total of Kshs 23.1 bn worth of bids out of Kshs 23.2 bn of bids received, translating to an acceptance rate of 99.7%. The yields on the 182-day and 91-day papers continued to rise, increasing by 44.8 bps and 25.2 bps to 13.9% and 14.0%, respectively. However, the yield on the 364-day paper declined by 24.9 bps to 13.8% from 14.0% recorded the previous week;
In the primary bond market, the government is seeking to raise additional Kshs 35.0 bn for budgetary support by reopening the 2-year bond FXDI/2023/02 and FXD1/2016/10 with a tenor to maturity of 1.9 years and 2.9 years, respectively. The coupon rate for the FXD1/2023/02 and FXD1/2016/10 is set at 17.0% and 15.0% respectively. The interest for the FXDI/2023/02 will be subjected to a withholding tax (WHT) of 15.0%, while that of the FXD1/2016/10 will be subjected to a 10.0% WHT. Bidding closes on 13th September 2023. We anticipate the bonds to be oversubscribed, given their short tenors to maturity however, investors are expected to attach higher yields as they seek to cushion themselves against future losses on the back of the government’s debt sustainability concerns. Our recommended bidding range for the FXDI/2023/02 is 17.1% to 17.6% and for the FXD1/2016/10 is 17.9% to 18.4%, based on bonds of similar tenor and nature trading range;
During the week, the Kenya National Bureau of Statistics (KNBS) released the year-on-year inflation statistics highlighting that the inflation rate in the month of August 2023 eased to 6.7%, from the 7.3% recorded in the month of July 2023, marking the second consecutive month that the inflation has remained within the CBK target range of 2.5%-7.5%. The ease in inflation was in line however, slightly below our expectation of an ease in a range of 6.8%-7.8%;
Equities
During the month of August 2023, the equities market was on a downward trajectory, with NASI, NSE 20 and NSE 25 declining by 5.9%, 2.4% and 5.5% respectively. The equities market performance was driven by losses recorded by large-cap stocks such as KCB, Safaricom, ABSA and Equity group of 17.2%, 8.9%, 5.3% and 5.2% respectively. The losses were, however, mitigated by gains recorded by large cap stocks such as NCBA and Diamond Trust Bank-Kenya of 3.3% and 2.1% respectively.
During the week, the equities market recorded mixed performance, with NASI and NSE 25 declining by 1.2%, 0.1% respectively, while NSE 20 gained by 1.1%, taking the YTD performance to losses of 22.9%, 8.2%, and 18.3% for NASI, NSE 20, and NSE 25, respectively. The equities market performance was mainly driven by losses recorded by large-cap stocks such as Bamburi, Equity Group and Safaricom of 4.5%, 2.7% and 2.6%, respectively. The losses were, however, mitigated by gains recorded by stocks such as ABSA, NCBA and Cooperative Bank of 5.9%, 4.4% and 3.9% respectively;
During the week, 2 listed banks ABSA Bank and HF Group released their H1’2023 financial results, with their Core Earnings per Share EPS increasing by 32.0% and 248.6% respectively;
Real Estate
During the week, President William Ruto oversaw the ground-breaking of 220 housing units each in Nakuru, Kakamega and Vihiga counties at a cost of Kshs 505.0 mn, Kshs 473.0 mn, and Kshs 536.0 mn respectively. All the projects will consist of; i) nine blocks of apartments comprising of studio, one bedroom, two-bedroom, and three-bedroom housing units, ii) amenities such as community spaces, iii) a commercial area, iv) access roads, v) tree nurseries, and, vi) a pitch/play area;
In the infrastructure sector, Superior Homes Kenya, a Cytonn Affiliate, broke ground for the construction of its first modern roadside stopover facility at Sultan Hamud town along the Nairobi – Mombasa highway. The Kshs 350.0 mn complex will include; i) safe parking spaces, ii) driver accommodation features, iii) convenience stores for food and beverage options, iv) health facilities, v) truck maintenance and refueling, and, vi) cargo handling;
In the industrial sector, Kenya Electricity Generating Company (KenGen) and Konza Technopolis Development Authority (KoTDA), broke ground for KenGen’s Green Energy Park in Olkaria, Naivasha. The industrial park project, spanning 342.0 hectares, is estimated to be developed at a cost of USD 884.0 mn (Kshs 128.4 bn) and aims to attract small, medium, and large enterprises, and part of the land be leased for commercial offices, data centers, research and development centers, hospitality spaces, visitor experience centers, and administrative facilities,
In regulated Real Estate Funds sector, under the Real Estate Investment Trusts (REITs) segment, the Capital Markets Authority (CMA) gave its approval for the conversion of ILAM Fahari Income Real Estate Investment Trust (REIT) from the Unrestricted Main Market segment of the Nairobi Securities Exchange (NSE) into the Restricted market segment through a Conversion Offering Memorandum. Under the conversion process, 36,585,134 units from investors holding units worth below Kshs 5.0 mn will redeem their shares at Kshs 11.0 per unit to ICEA Lion Asset Management Limited,
Additionally, Fahari I-REIT closed the week trading at an average price of Kshs 9.0 per share in the Nairobi Securities Exchange, representing a 49.5% gain from the Kshs 6.0 recorded the previous week. On the Unquoted Securities Platform as at 01 September 2023, Acorn D-REIT and I-REIT closed the week trading at Kshs 23.9 and Kshs 21.6 per unit, a 19.5% and 8.0% gain for the D-REIT and I-REIT, respectively, from the Kshs 20.0 inception price. In addition, Cytonn High Yield Fund (CHYF) closed the week with an annualized yield of 13.7%, 0.1% points increase from 13.6% recorded the previous week;
Investment Updates:
- Weekly Rates:
- Cytonn Money Market Fund closed the week at a yield of 13.23% p.a To invest, dial *809# or download the Cytonn App from Google Playstore here or from the Appstore here;
- Cytonn High Yield Fund closed the week at a yield of 13.74% p.a. To invest, email us at sales@cytonn.com and to withdraw the interest, dial *809# or download the Cytonn App from Google Playstore here or from the Appstore here;
- We continue to offer Wealth Management Training every Wednesday, from 9:00 am to 11:00 am. The training aims to grow financial literacy among the general public. To register for any of our Wealth Management Trainings, click here;
- If interested in our Private Wealth Management Training for your employees or investment group, please get in touch with us through wmt@cytonn.com;
- Cytonn Insurance Agency acts as an intermediary for those looking to secure their assets and loved ones’ future through insurance namely; Motor, Medical, Life, Property, WIBA, Credit and Fire and Burglary insurance covers. For assistance, get in touch with us through insuranceagency@cytonn.com;
- Cytonn Asset Managers Limited (CAML) continues to offer pension products to meet the needs of both individual clients who want to save for their retirement during their working years and Institutional clients that want to contribute on behalf of their employees to help them build their retirement pot. To more about our pension schemes, kindly get in touch with us through pensions@cytonn.com;
Real Estate Updates:
- For more information on Cytonn’s real estate developments, email us at sales@cytonn.com;
- Phase 3 of The Alma is now ready for occupation and the show house is open daily. To join the waiting list to rent, please email properties@cytonn.com;
- For Third Party Real Estate Consultancy Services, email us at rdo@cytonn.com;
- For recent news about the group, see our news section here;
Hospitality Updates:
- We currently have promotions for Staycations. Visit cysuites.com/offers for details or email us at sales@cysuites.com;
Money Markets, T-Bills Primary Auction:
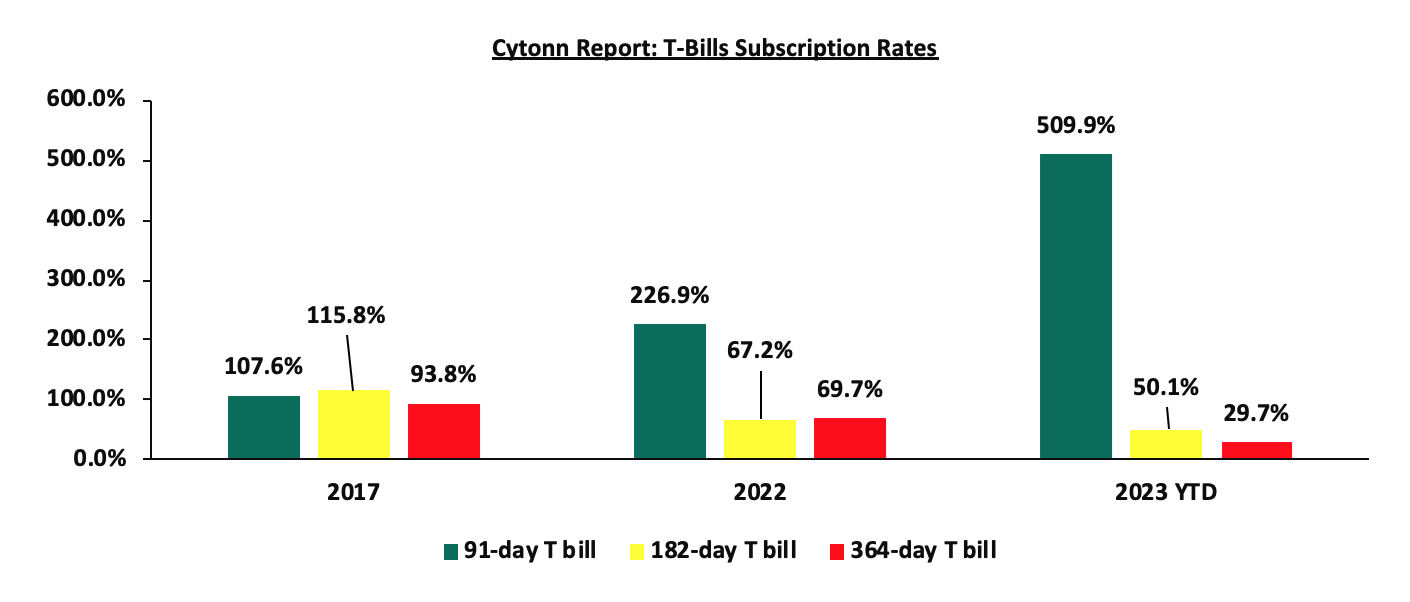
During the month of August 2023, T-bills were oversubscribed, with the overall average subscription rate coming in at 132.2%, up from the 103.9% recorded in July 2023. The overall average subscription rate for the 364-day paper declined to 14.9% from 17.3% recorded in July 2023, while the subscription rate for the 182-day and 91-day papers increased to 40.1% and 655.8% from the 29.4% and 506.7% respectively recorded in July 2023. The average yields on the 364-day and 91-day papers increased by 1.1% points each to 13.6% and 13.3% respectively, while the average yield on the 182-day paper increased by 1.0% points to 13.2%. For the month of August, the government accepted a total of Kshs 122.1 bn of the Kshs 126.9 bn worth of bids received, translating to an acceptance rate of 96.2%.
During the week, T-bills were undersubscribed for a second consecutive week, with the overall subscription rate coming in at 96.6%, up from 95.8% recorded the previous week. Investors’ preference for the shorter 91-day paper persisted, with the paper receiving bids worth Kshs 21.6 bn against the offered Kshs 4.0 bn, translating to an oversubscription rate of 539.8%, higher than the subscription rate of 455.4% recorded the previous week. The subscription rate for the 364-day and 182-day papers decreased to 6.2% and 9.6%, respectively, from 22.0% and 25.8%recorded the previous week. The government accepted a total of Kshs 23.1 bn worth of bids out of Kshs 23.2 bn of bids received, translating to an acceptance rate of 99.7%. The yields on the 182-day and 91-day papers continued to rise, increasing by 44.8 bps and 25.2 bps to 13.9% and 14.0%, respectively. However, the yield on the 364-day paper declined by 24.9 bps to 13.8% from 14.0% recorded the previous week.
So far in the current FY’2023/24, government securities totalling Kshs 361.0 bn have been advertised. The government has accepted bids worth Kshs 387.4 bn, of which 262.7 bn and 124.6 bn were treasury bills and bonds, respectively. Total redemptions so far in FY’2023/24 equal to Kshs 320.4 bn, with treasury bills accounting for all redemptions. As a result, the government has a domestic borrowing surplus of Kshs 67.0 billion in FY’2023/24.
The chart below compares the overall average T- bills subscription rates obtained in 2017, 2022 and 2023 Year to Date (YTD):
The August 2023 bonds were oversubscribed, with the overall subscription rate coming in at 125.6%, albeit lower than the oversubscription rate of 160.3% recorded in July 2023. The newly issued bond FXD1/2023/02 and the reopened FXD1/2023/05 received bids worth Kshs 53.0 bn against the offered Kshs 40.0 bn, translating to an oversubscription rate of 132.5%, with the government accepting bids worth Kshs 19.1 bn, translating to an acceptance rate of 36.1%. Their subsequent tap sale received bids worth Kshs 23.6 bn against the offered Kshs 21.0 bn, translating to an oversubscription rate of 112.4%, with the government accepting bids worth Kshs 23.5 bn translating to an acceptance rate of 99.6%. The table below provides more details on the bonds issued during the month of July 2023:
|
Cytonn Report: Treasury Bonds Issued in August 2023 |
|||||||||
|
Issue Date |
Bond Auctioned |
Effective Tenor to Maturity (Years) |
Coupon |
Amount offered (Kshs bn) |
Actual Amount Raised/Accepted (Kshs bn) |
Total bids received (Subscription) |
Average Accepted Yield |
Subscription Rate |
Acceptance Rate |
|
8/21/2023 |
FXD1/2023/02 |
2.0 |
17.0% |
40.0 |
11.7 |
38.3 |
17.0% |
132.5% |
30.4% |
|
FXD1/2023/05 |
4.9 |
16.8% |
7.5 |
14.7 |
18.0% |
50.7% |
|||
|
8/28/2023 |
FXD1/2023/02- tapsale |
2.0 |
17.0% |
21.0 |
17.4 |
17.4 |
17.0% |
112.4% |
100.0% |
|
FXD1/2023/05- tapsale |
4.9 |
16.8% |
6.1 |
6.2 |
18.0% |
98.4% |
|||
|
Aug 2023 Average |
|
3.5 |
16.9% |
61.0 |
42.6 |
76.6 |
17.5% |
125.6% |
55.6% |
|
July 2023 Average |
|
4.1 |
15.9% |
60.0 |
82.0 |
96.2 |
16.6% |
160.3% |
85.3% |
Source: Central Bank of Kenya (CBK)
In the primary bond market, the government is seeking to raise additional Kshs 35.0 bn for budgetary support by reopening the 2-year bond FXDI/2023/02 and FXD1/2016/10 with a tenor to maturity of 1.9 years and 2.9 years, respectively. The coupon rate for the FXD1/2023/02 and FXD1/2016/10 is set at 17.0% and 15.0% respectively. The interest for the FXDI/2023/02 will be subjected to a withholding tax (WHT) of 15.0%, while that of the FXD1/2016/10 will be subjected to a 10.0% WHT. Bidding closes on 13th September 2023. We anticipate the bonds to be oversubscribed, given their short tenors to maturity, however, investors are expected to attach higher yields as they seek to cushion themselves against future losses on the back of the government’s debt sustainability concerns. Our recommended bidding range for the FXDI/2023/02 is 17.1% to 17.6% and for the FXD1/2016/10 is 17.9% to 18.4%, based on bonds of similar tenor and nature trading range.
Secondary Bond Market:
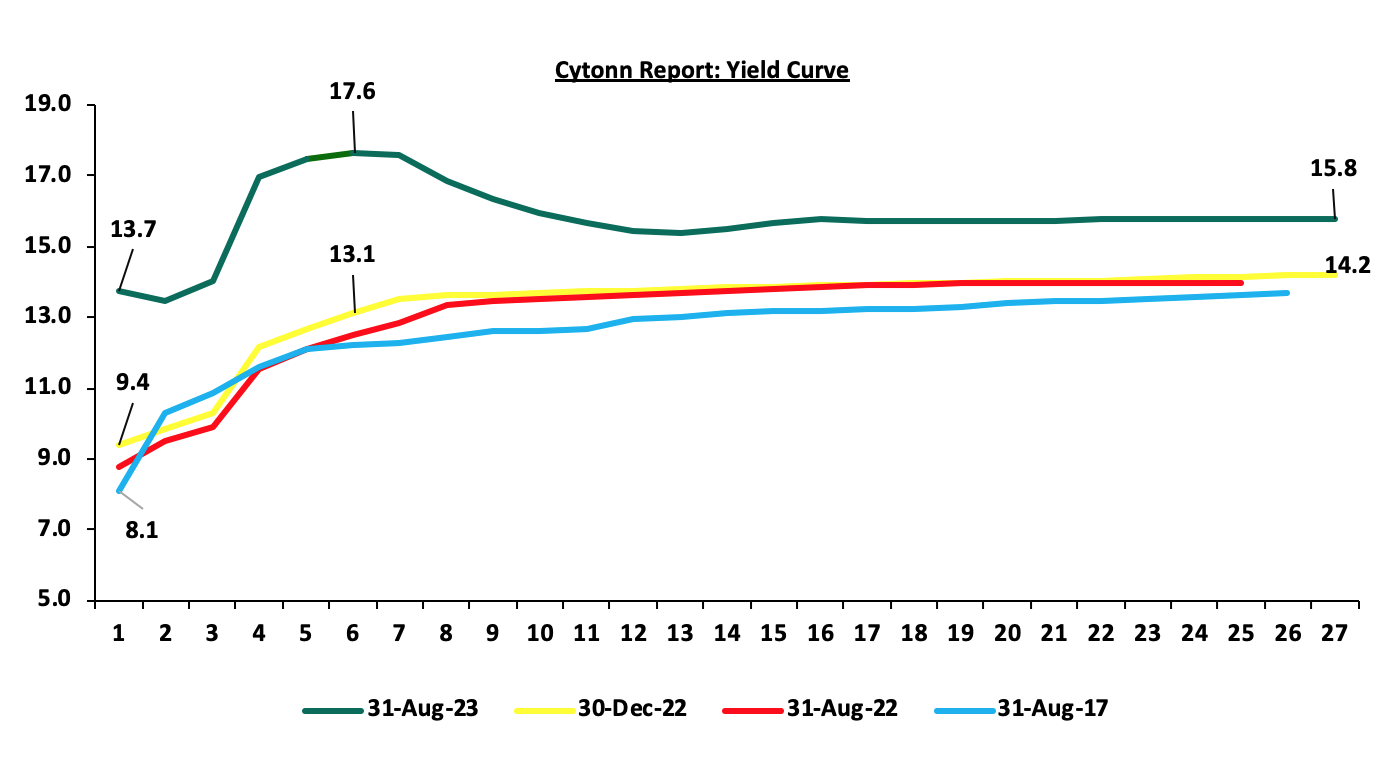
The yields on government securities were on an upward trajectory during the month compared to the same period in 2022. Notably, the yields on short to medium-term government bonds continues to rise faster than the yield on long-term bonds as investors seek higher yields to cushion themselves against potential losses on the back of the government’s debt sustainability concerns, ahead of the maturity of USD 2.0 bn Eurobond in June next year. The chart below shows the yield curve movement during the period:
The secondary bond turnover decreased by 4.5% to Kshs 55.8 bn, from Kshs 58.5 bn recorded in July 2023, pointing towards decreased activities by commercial banks in the secondary bonds market. On a year on year basis, the bonds turnover decreased by 18.3% from Kshs 68.4 bn worth of treasury bonds transacted over a similar period last year.
Money Market Performance:
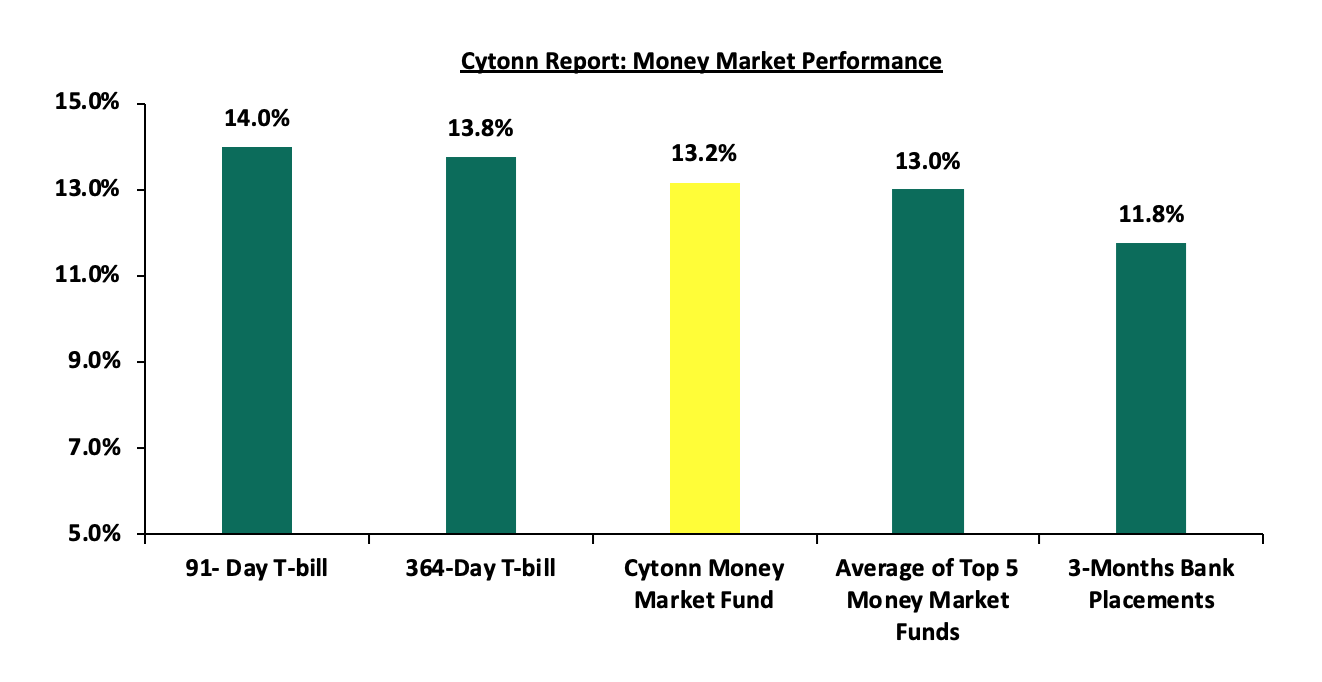
In the money markets, 3-month bank placements ended the week at 11.8% (based on what we have been offered by various banks), The yield on the 364-day paper decreased by 24.9 bps to 13.8%, while that of 91-day paper increased by 25.2 bps to 14.0%. The yield of Cytonn Money Market Fund increased by 64.0 bps to 13.2% from 12.5% recorded the previous week and the average yields on the Top 5 Money Market Funds increased by 46.2 bps to 13.0% from 12.5% recorded the previous week.
The table below shows the Money Market Fund Yields for Kenyan Fund Managers as published on 1st Sep 2023:
|
Cytonn Report: Money Market Fund Yield for Fund Managers as published on 1st September 2023 |
||
|
Rank |
Fund Manager |
Effective Annual |
|
1 |
GenAfrica Money Market Fund |
13.4% |
|
2 |
Cytonn Money Market Fund |
13.2% |
|
3 |
Enwealth Money Market Fund |
13.0% |
|
4 |
Etica Money Market Fund |
13.0% |
|
5 |
Madison Money Market Fund |
12.5% |
|
6 |
Lofty-Corban Money Market Fund |
12.4% |
|
7 |
Jubilee Money Market Fund |
12.4% |
|
8 |
Co-op Money Market Fund |
12.3% |
|
9 |
Kuza Money Market fund |
12.1% |
|
10 |
GenCap Hela Imara Money Market Fund |
11.8% |
|
11 |
Absa Shilling Money Market Fund |
11.8% |
|
12 |
KCB Money Market Fund |
11.7% |
|
13 |
Old Mutual Money Market Fund |
11.7% |
|
14 |
Apollo Money Market Fund |
11.6% |
|
15 |
ICEA Lion Money Market Fund |
11.6% |
|
16 |
AA Kenya Shillings Fund |
11.5% |
|
17 |
Sanlam Money Market Fund |
11.5% |
|
18 |
Dry Associates Money Market Fund |
11.2% |
|
19 |
Nabo Africa Money Market Fund |
11.0% |
|
20 |
Mali Money Market Fund |
11.0% |
|
21 |
CIC Money Market Fund |
10.5% |
|
22 |
Orient Kasha Money Market Fund |
10.3% |
|
23 |
British-American Money Market Fund |
9.6% |
|
24 |
Equity Money Market Fund |
9.0% |
Source: Business Daily
Liquidity:
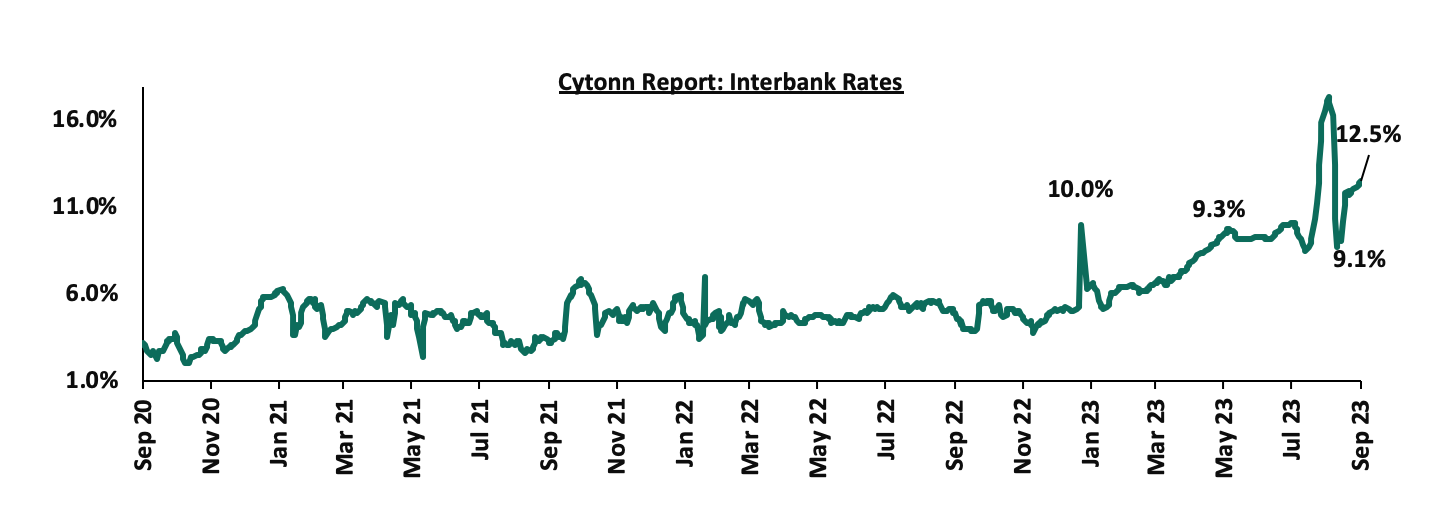
Liquidity in the money markets tightened in the month of August 2023, with the average interbank rate increasing to 12.5%, from 10.7%, recorded in July 2023. Also, during the week, liquidity in the money markets tightened, with the average interbank rate increasing to 12.3%, from 11.9% recorded the previous week, partly attributable to tax remittances that offset government payments. The average interbank volumes traded decreased by 2.5% to Kshs 27.5 bn, from Kshs 28.2 bn recorded the previous week. The chart below shows the interbank rates in the market over the years:
Kenya Eurobonds:
During the month, the yields on the Eurobonds were on an upward trajectory with the yield on the 10-year Eurobond issued in 2014 recording the largest gain of 1.7% points to 14.0% from 12.3% recorded in July 2023.
Also during the week, the yields on Eurobonds were on an upward trajectory with the yield on the 10-year Eurobond issued in 2014 recording the largest increase of 1.0% points to 14.0%, from 13.0%, recorded the previous week. The table below shows the summary of the performance of the Kenyan Eurobonds as of 31st Aug 2023;
|
Cytonn Report: Kenya Eurobonds Performance |
||||||
|
|
2014 |
2018 |
2019 |
2021 |
||
|
Tenor |
10-year issue |
10-year issue |
30-year issue |
7-year issue |
12-year issue |
12-year issue |
|
Amount Issued (USD) |
2.0 bn |
1.0 bn |
1.0 bn |
0.9 bn |
1.2 bn |
1.0 bn |
|
Years to Maturity |
1.1 |
4.8 |
24.8 |
4.0 |
9.0 |
11.1 |
|
Yields at Issue |
6.6% |
7.3% |
8.3% |
7.0% |
7.9% |
6.2% |
|
2-Jan-23 |
12.9% |
10.5% |
10.9% |
10.9% |
10.8% |
9.9% |
|
31-Jul-23 |
12.3% |
10.7% |
10.8% |
11.2% |
10.7% |
10.3% |
|
24-Aug-23 |
13.0% |
11.5% |
11.2% |
11.9% |
11.3% |
10.8% |
|
25-Aug-23 |
13.0% |
11.6% |
11.3% |
11.9% |
11.4% |
10.9% |
|
28-Aug-23 |
13.3% |
11.6% |
11.3% |
11.9% |
11.4% |
11.1% |
|
29-Aug-23 |
12.8% |
11.5% |
11.2% |
11.7% |
11.3% |
10.8% |
|
30-Aug-23 |
13.2% |
11.6% |
11.3% |
12.0% |
11.4% |
10.9% |
|
31-Aug-23 |
14.0% |
11.8% |
11.4% |
12.1% |
11.5% |
11.0% |
|
Weekly Change |
1.0% |
0.3% |
0.2% |
0.2% |
0.2% |
0.2% |
|
MTM Change |
1.7% |
1.1% |
0.6% |
0.9% |
0.8% |
0.7% |
|
YTD Change |
1.1% |
1.3% |
0.5% |
1.2% |
0.7% |
1.1% |
Source: Source: Central Bank of Kenya (CBK) and National Treasury
Kenya Shilling:
During the month, the Kenya Shilling depreciated by 2.2% against the US Dollar, to close the month at Kshs 145.5, from Kshs 142.3 recorded at the end of July 2023, partly attributable to the increased dollar demand from importers, especially oil and energy sectors
Also, during the week, the Kenya Shilling depreciated by 0.4% against the US dollar to close the week at Kshs 145.5, from Kshs 144.9 recorded the previous week. On a year to date basis, the shilling has depreciated by 17.9% against the dollar, adding to the 9.0% depreciation recorded in 2022. We expect the shilling to remain under pressure in 2023 as a result of:
- An ever-present current account deficit, which came at 2.3% of GDP in Q1’2023 from 4.2% recorded in a similar period last year, and,
- The need for government debt servicing, continues to put pressure on forex reserves given that 66.8% of Kenya’s external debt is US Dollar denominated as of April 2023, and,
- Dwindling forex reserves currently at USD 7.1 bn (equivalent to 3.8-months of import cover), which is below the statutory requirement of maintaining at least 4.0-months of import cover.
The shilling is however expected to be supported by:
- Diaspora remittances standing at a cumulative USD 2,411.9 mn in 2023 as of July 2023, 20.26% higher than the USD 2,364.0 mn recorded over the same period in 2022, and,
The chart below summarizes the evolution of Kenya months of import cover over the years:
Weekly Highlights:
- August 2023 Inflation
The year-on-year inflation rate in the month of August 2023 eased to 6.7%, from the 7.3% inflation rate recorded in the month of July 2023, marking the second consecutive month that the inflation has remained within the CBK target range of 2.5%-7.5%. The ease in inflation was slightly below our expectation of an ease in a range of 6.8%-7.8%. The overall easing of the headline inflation in the month of August 2023 came on the back of tight monetary policy following the Monetary Policy Committee (MPC) move to maintain the Central Bank Rate at 10.5% in the August 2023 sitting, a move aimed to anchor inflation. The table below shows a summary of both the year on year and month on month commodity indices performance:
|
Cytonn Report: Major Inflation Changes – 2023 |
|||
|
Broad Commodity Group |
Price change m/m (July-2023/August-2023) |
Price change y/y (August-2022/August-2023) |
Reason |
|
Food and Non-Alcoholic Beverages |
(0.5%) |
7.5% |
The m/m decrease was mainly driven by decrease in prices of commodities such as maize grain-loose, maize flour-loose, fortified maize flour, potatoes and tomatoes of 8.2%, 7.3%, 6.1% and 3.5%, respectively. However, during the same period, the price of mangoes increased by 6.1%. |
|
Housing, Water, Electricity, Gas and Other Fuel |
0.0% |
7.5% |
The m/m performance was mainly driven by decline in prices of 13.0kg gas/LPG by 2.8%. However, there was an increase in prices of Electricity of 200KWH and 50 KWH by 1.5% and 1.8% respectively. |
|
Transport cost |
0.3% |
13.1 |
The m/m increase in transport Index was mainly due to increase in prices of country bus fares for some routes, despite the prices of petrol and diesel remaining unchanged between July 2023 and August 2023, |
|
Overall Inflation |
(0.1%) |
6.7% |
The m/m decline was mainly driven by 0.5% decline in Food and Non-Alcoholic Beverages |
Source: Kenya National Bureau of Statistics (KNBS)
The chart below shows the inflation rates for the past 5 years:
Despite the easing of year-on-year inflation, the risk of an elevation of inflation above the CBK target range remains high following the effectuation of the Finance Act 2023, which provisions a double increase in VAT on petroleum products to 16.0% from 8.0%. With fuel being a major input in most businesses, the cost of production is expected to remain elevated. Additionally, the sustained depreciation of the Kenyan shilling against major currencies is also expected to underpin inflationary pressures in the country as manufacturers pass on the high cost of importation to consumers through hikes in consumer prices in order to maintain their margins
Monthly Highlights:
- The Kenya National Bureau of Statistics (KNBS) released the year-on-year inflation highlighting that the inflation rate in the month of July 2023 easedto 7.3%, from the 7.9% inflation rate recorded in the month of June 2023, marking the first time in 14 months that the inflation has fallen within the CBK target range of 2.5%-7.5%. Please read our Cytonn Monthly – July 2023,
- Stanbic Bank released its monthly Purchasing Manager's Index (PMI),highlighting that the index for the month of July 2023 came in at 45.5, down from 47.8 in June 2023, signalling a stronger downturn of the business environment at the start of Q3’2023. The strong downturn is mainly attributable to the high cost of living amid rising fuel prices and the sustained depreciation of the Kenya shilling. Please read our Cytonn Monthly – July 2023,
- The monetary policy committee met on August 9, 2023 to review the outcome of its previous policy decisions amidst a backdrop of continued global uncertainties, high inflationary pressures, a weak global growth outlook as well as measures taken by other economies around the world in response to these developments. The MPC retained the CBR rate at 10.50%, which was in line with our expectations of the MPC to maintain the CBR rate at the current rate. Please see our Cytonn weekly #32/2023,
- The National Treasury gazetted the revenue and net expenditures for the first month of FY’2022/2023, ending 31st July 2022, indicating that the total revenue collected as at the end of July 2023 amounted to Kshs 159.6 bn, equivalent to 6.2% of the original estimates of Kshs 2,571.2 bn for FY’2023/2024 and is 74.5% of the prorated estimates of Kshs 214.3 bn. Please see our Cytonn weekly #33/2023,
- The Energy and Petroleum Regulatory Authority (EPRA) released their monthly statement on the maximum retail fuel prices in Kenya effective 15 August 2023 to 14 September 2023. Notably, fuel prices remained unchanged at Kshs 194.7 per litre for Super Petrol, Kshs 179.7 per litre for Diesel and Kshs 169.5 per litre for Kerosene respectively. Please see our Cytonn weekly #33/2023,
Rates in the Fixed Income market have been on an upward trend given the continued high demand for cash by the government and the occasional liquidity tightness in the money market. The government is 18.5% behind its prorated net domestic borrowing target of Kshs 82.2 bn, having a net borrowing position of Kshs 67.0 bn of the domestic net borrowing target of Kshs 586.5 bn for the FY’2023/2024. Therefore, we expect a continued upward readjustment of the yield curve in the short and medium term, with the government looking to bridge the fiscal deficit through the domestic market. Owing to this, our view is that investors should be biased towards short-term fixed-income securities to reduce duration risk
Market Performance:
During the month of August 2023, the equities market was on a downward trajectory, with NASI, NSE 20 and NSE 25 declining by 5.9%, 2.4% and 5.5% respectively. The equities market performance was driven by losses recorded by large-cap stocks such as KCB, Safaricom, ABSA and Equity group of 17.2%, 8.9%, 5.3% and 5.2% respectively. The losses were, however, mitigated by gains recorded by large cap stocks such as NCBA and Diamond Trust Bank-Kenya of 3.3% and 2.1% respectively.
During the week, the equities market recorded a mix performance, with NASI and NSE 25 declining by 1.2%, 0.1% respectively, while NSE 20 gained by 1.1%, taking the YTD performance to losses of 22.9%, 8.2%, and 18.3% for NASI, NSE 20, and NSE 25, respectively. The equities market performance was mainly driven by losses recorded by large-cap stocks such as Bamburi, Equity Group and Safaricom of 4.5%, 2.7% and 2.6%, respectively. The losses were, however, mitigated by gains recorded by stocks such as ABSA, NCBA and Cooperative Bank of 5.9%, 4.4% and 3.9% respectively;
Equities turnover decreased by 29.8% in the month of August to USD 37.7 mn, from USD 53.8 mn recorded in July 2023. Foreign investors turned net buyers, with a net buying position of USD 3.9 mn, from a net selling position of 21.2 mn recorded in July.
During the week, equities turnover increased by 269.0% to USD 11.7 mn from USD 3.2 mn recorded the previous week, taking the YTD total turnover to USD 544.9 mn. Foreign investors turned net sellers for the first time in five weeks with a net selling position of USD 2.4 mn, from a net buying position of USD 0.1 mn recorded the previous week, taking the YTD foreign net selling position to USD 274.0 mn.
The market is currently trading at a price to earnings ratio (P/E) of 4.9x, 59.8% below the historical average of 12.3x. The dividend yield stands at 8.8%, 4.5% points above the historical average of 4.3%. Key to note, NASI’s PEG ratio currently stands at 0.6x, an indication that the market is undervalued relative to its future growth. A PEG ratio greater than 1.0x indicates the market is overvalued while a PEG ratio less than 1.0x indicates that the market is undervalued. The charts below indicate the historical P/E and dividend yields of the market;
Weekly Highlight
Earnings Release
- ABSA Bank H1’2023 Financial Performance
During the week, ABSA Bank released their H1’2023 financial results. Below is a summary of the performance.
|
Balance Sheet Items |
H1'2022 |
H1'2023 |
y/y change |
|
Government Securities |
120.8 |
116.0 |
(3.9%) |
|
Net Loans and Advances |
261.5 |
317.9 |
21.6% |
|
Total Assets |
445.3 |
503.7 |
13.1% |
|
Customer Deposits |
281.7 |
332.6 |
18.1% |
|
Deposits per branch |
3.4 |
3.9 |
16.7% |
|
Total Liabilities |
389.0 |
440.0 |
13.1% |
|
Shareholders’ Funds |
56.2 |
63.7 |
13.3% |
|
Balance Sheet Ratios |
H1'2022 |
H1'2023 |
% y/y change |
|
Loan to Deposit Ratio |
92.9% |
95.6% |
2.7% |
|
Govt Securities to Deposit ratio |
42.9% |
34.9% |
(8.0%) |
|
Return on average equity |
21.4% |
27.7% |
6.3% |
|
Return on average assets |
2.7% |
3.5% |
0.7% |
|
Income Statement |
H1'2022 |
H1'2023 |
y/y change |
|
Net Interest Income |
14.4 |
19.2 |
33.2% |
|
Net non-Interest Income |
6.5 |
8.1 |
25.7% |
|
Total Operating income |
20.9 |
27.4 |
30.9% |
|
Loan Loss provision |
(3.0) |
(5.2) |
74.4% |
|
Total Operating expenses |
(11.8) |
(15.3) |
29.7% |
|
Profit before tax |
9.1 |
12.1 |
32.5% |
|
Profit after tax |
6.3 |
8.3 |
32.0% |
|
Core EPS |
1.2 |
1.5 |
32.0% |
|
Income Statement Ratios |
H1'2022 |
H1'2023 |
y/y change |
|
Yield from interest-earning assets |
9.7% |
11.5% |
1.8% |
|
Cost of funding |
2.7% |
3.3% |
0.6% |
|
Net Interest Margin |
7.6% |
9.0% |
1.4% |
|
Net Interest Income as % of operating income |
69.0% |
70.3% |
1.3% |
|
Non-Funded Income as a % of operating income |
31.0% |
29.7% |
(1.3%) |
|
Cost to Income Ratio |
56.4% |
55.9% |
(0.5%) |
|
Cost to Income (Without LLPs) |
42.3% |
37.0% |
(5.3%) |
|
Capital Adequacy Ratios |
H1'2022 |
H1'2023 |
% points change |
|
Core Capital/Total Liabilities |
18.1% |
17.3% |
(0.8%) |
|
Minimum Statutory ratio |
8.0% |
8.0% |
|
|
Excess |
10.1% |
9.3% |
(0.8%) |
|
Core Capital/Total Risk Weighted Assets |
14.0% |
13.5% |
(0.5%) |
|
Minimum Statutory ratio |
10.5% |
10.5% |
|
|
Excess |
3.5% |
3.0% |
(0.5%) |
|
Total Capital/Total Risk Weighted Assets |
16.4% |
17.7% |
1.3% |
|
Minimum Statutory ratio |
14.5% |
14.5% |
|
|
Excess |
1.9% |
3.2% |
1.3% |
|
Liquidity Ratio |
30.3% |
28.7% |
(1.6%) |
|
Minimum Statutory ratio |
20.0% |
20.0% |
|
|
Excess |
10.3% |
8.7% |
(1.6%) |
Key Take-Outs:
- Increased earnings - Core earnings per share (EPS) increased by 32.0% to Kshs 1.5, from Kshs 1.2 in H1’2022, driven by the 30.9% growth in total operating income to Kshs 27.4 bn, from Kshs 20.9 bn in H1’2022, which outpaced the 29.7% growth in total operating expenses to kshs 15.3 bn, from kshs 11.8 bn in H1’2022,
- Increased Provisioning – On the back of high credit risk occasioned by the deteriorated business environment, the bank increased its provisions holdings to cover for the anticipated losses in the future, with its provisions increasing by 34.8% to Kshs 17.7 bn from Kshs 13.1 bn recorded in H1’2022, and,
- Improved Lending – The Group’s loan book increased by 21.6% to kshs 317.9 bn, from kshs 7261.5 bn in H1’2022, which outpaced the 3.9% decline investment in government securities to Kshs 116.0 bn from Kshs 120.8 bn in H1’2022, highlighting the Group’s strategy to increase lending while at the same time managing its non-performing loan book,
For a more detailed analysis, please see the ABSA Bank H1’2023 Earnings Note
- HF Group H1’2023 Financial Performance
During the week, HF Group released their H1’2023 financial results. Below is a summary of the performance.
|
Balance Sheet |
H1'2022 |
H1'2023 |
y/y change |
|
Net Loans and Advances |
34.9 |
38.1 |
9.1% |
|
Government Securities |
9.2 |
9.8 |
6.3% |
|
Total Assets |
55.7 |
60.7 |
8.9% |
|
Customer Deposits |
39.1 |
40.7 |
4.0% |
|
Deposits Per Branch |
1.8 |
1.8 |
4.0% |
|
Total Liabilities |
46.8 |
51.9 |
10.8% |
|
Shareholders' Funds |
8.0 |
8.9 |
11.4% |
|
Key Ratios |
H1'2022 |
H1'2023 |
% point change |
|
Loan to Deposit ratio |
89.2% |
93.5% |
4.3% |
|
Government Securities to Deposit ratio |
23.6% |
24.1% |
0.5% |
|
Return on average equity |
(3.5%) |
4.7% |
8.3% |
|
Return on average assets |
(0.5%) |
0.7% |
1.2% |
|
Income Statement |
H1'2022 |
H1'2023 |
y/y change |
|
Net interest Income |
1.0 |
1.3 |
24.2% |
|
Net non-interest income |
0.50 |
0.55 |
10.1% |
|
Total Operating income |
1.5 |
1.8 |
19.6% |
|
Loan loss provision |
(0.1) |
(0.2) |
55.0% |
|
Total Operating expenses |
(1.5) |
(1.6) |
11.0% |
|
Profit before tax |
0.1 |
0.2 |
240.4% |
|
Profit after tax |
0.1 |
0.2 |
264.8% |
|
Core EPS |
0.1 |
0.5 |
264.8% |
|
Income Statement Ratios |
H1'2022 |
H1'2023 |
% point change |
|
Yield from interest-earning assets |
9.3% |
10.0% |
0.7% |
|
Cost of funding |
4.8% |
4.9% |
0.1% |
|
Net Interest Margin |
4.5% |
5.2% |
0.7% |
|
Net Interest Income as % of operating income |
67.3% |
69.9% |
2.6% |
|
Non-Funded Income as a % of operating income |
32.7% |
30.1% |
(2.6%) |
|
Cost to Income Ratio |
95.9% |
89.0% |
(6.9%) |
|
CIR without LLP |
89.2% |
80.3% |
(8.9%) |
|
Capital Adequacy Ratios |
H1'2022 |
H1'2023 |
% points change |
|
Core Capital/Total Liabilities |
7.8% |
6.0% |
(1.8%) |
|
Minimum Statutory ratio |
8.0% |
8.0% |
|
|
Excess |
(0.2%) |
(2.0%) |
(1.8%) |
|
Core Capital/Total Risk Weighted Assets |
8.1% |
6.4% |
(1.7%) |
|
Minimum Statutory ratio |
10.5% |
10.5% |
|
|
Excess |
(2.4%) |
(4.1%) |
(1.7%) |
|
Total Capital/Total Risk Weighted Assets |
12.0% |
10.2% |
(1.8%) |
|
Minimum Statutory ratio |
14.5% |
14.5% |
|
|
Excess |
(2.5%) |
(4.3%) |
(1.8%) |
|
Liquidity Ratio |
26.0% |
21.0% |
(5.0%) |
|
Minimum Statutory ratio |
20.0% |
20.0% |
|
|
Excess |
6.0% |
1.0% |
(5.0%) |
Key Take-Outs:
- Strong earnings growth - Core earnings per share (EPS) grew by 264.8% to Kshs 0.5, from Kshs 0.1 in H1’2022, driven by the 19.6% growth in total operating income to Kshs 1.8 bn, from Kshs 1.5 bn in H1’2022.
- Asset quality deterioration – The bank’s gross NPL ratio increased to 23.1% in H1’2023 from 20.1% in H1’2022, attributable to the faster growth of 26.6% in Gross non-performing loans to Kshs 10.5 bn, from Kshs 8.3 bn in H1’2022, which outpaced the 10.4% increase in gross loans to Kshs 45.6 bn, from Kshs 41.3 bn recorded in H1’2022,
For a more detailed analysis, please see the HF Group H1’2023 Earnings Note
Asset Quality:
|
Cytonn Report: Listed Bank Asset Quality |
||||||
|
|
H1'2023 NPL Ratio* |
H1'2022 NPL Ratio** |
% point change in NPL Ratio |
H1'2023 NPL Coverage* |
H1'2022 NPL Coverage** |
% point change in NPL Coverage |
|
Stanbic Bank |
8.1% |
9.4% |
(1.3%) |
57.4% |
56.0% |
1.4% |
|
ABSA Bank Kenya |
9.5% |
7.1% |
2.4% |
69.4% |
78.5% |
(9.1%) |
|
Equity Group |
11.2% |
8.8% |
2.4% |
54.5% |
64.1% |
(9.6%) |
|
Diamond Trust Bank |
12.3% |
12.8% |
(0.5%) |
46.4% |
44.2% |
2.2% |
|
I&M Holdings |
12.7% |
9.3% |
3.4% |
49.8% |
77.5% |
(27.7%) |
|
NCBA Group |
13.4% |
13.6% |
(0.2%) |
57.8% |
62.0% |
(4.2%) |
|
Stanchart Kenya |
14.4% |
15.4% |
(1.0%) |
84.8% |
83.9% |
0.9% |
|
Co-operative Bank |
14.6% |
14.1% |
0.5% |
60.7% |
65.8% |
(5.1%) |
|
KCB |
17.2% |
21.4% |
(4.2%) |
51.1% |
45.8% |
5.3% |
|
HF Group |
23.1% |
20.1% |
3.0% |
72.0% |
77.6% |
(5.6%) |
|
Mkt Weighted Average |
12.7% |
13.0% |
(0.3%) |
59.9% |
62.3% |
(2.4%) |
|
*Market cap weighted as at 1/09/2023 |
||||||
|
**Market cap weighted as at 09/09/2022 |
||||||
Key take-outs from the table include:
- Asset quality for the listed banks improved during the H1’2023, with market weighted average NPL decreasing by 0.3% points to 12.7% from a 13.0% in H1’2022. The improvement in asset quality was mainly driven by improvement in KCB bank, Stanbic bank, Stanchart Bank, DTB-K and NCBA Group asset quality with their NPL ratio decreasing by 4.2%, 1.3%, 1.0%, 0.5% and 0.2% respectively,
- I&M Holdings had the highest NPL ratio jump by 3.4% points to 12.7% from 9.3% points in H1’2022, attributable to 57.5% increase in Gross non-performing loans to Kshs 36.6 bn in H1’2023 from Kshs 23.3 bn in H1’2022, which outpaced the 15.6% increase in gross loans to Kshs 288.0 bn from Kshs 249.1 bn recorded in H1’2022,
- Market weighted average NPL Coverage for the listed banks that have released decreased by 2.4% points to 59.9% in H1’2023, from 62.3% recorded in H1’2022, majorly on the back of decreased NPL coverage recorded by I&M Holdings, Equity Group, ABSA Bank, HF Group and Co-operative Bank of Kenya by 27.7%, 9.6%, 9.1%, 5.6% and 5.1% respectively in H1’2022. However, KCB Group, Diamond Trust Bank and Stanbic bank NPL coverage increased by 5.3% points, 2.2% points and 1.4% points to 51.1%, 46.4% and 57.4% respectively in H1’2023.
Summary Performance
The table below shows performance of listed banks using several metrics:
|
Cytonn Report: Listed Banks Performance in H1’2023 |
|||||||||||||
|
Bank |
Core EPS Growth |
Interest Income Growth |
Interest Expense Growth |
Net Interest Income Growth |
Net Interest Margin |
Non-Funded Income Growth |
NFI to Total Operating Income |
Growth in Total Fees & Commissions |
Deposit Growth |
Growth in Government Securities |
Loan to Deposit Ratio |
Loan Growth |
Return on Average Equity |
|
HF |
264.8% |
18.5% |
13.0% |
24.2% |
5.2% |
10.1% |
30.1% |
51.1% |
4.0% |
6.3% |
93.5% |
9.1% |
4.7% |
|
Stanbic |
47.0% |
46.3% |
51.5% |
44.4% |
7.1% |
29.7% |
42.5% |
22.5% |
10.5% |
10.1% |
98.6% |
15.3% |
18.5% |
|
ABSA |
32.0% |
36.9% |
50.3% |
33.2% |
9.0% |
25.7% |
29.7% |
21.1% |
18.1% |
(3.9%) |
95.6% |
21.6% |
27.7% |
|
SCB-K |
27.7% |
33.4% |
0.9% |
38.3% |
8.0% |
26.8% |
33.7% |
11.7% |
(1.1%) |
(31.7%) |
51.3% |
13.2% |
23.9% |
|
NCBA |
20.3% |
21.7% |
29.7% |
16.3% |
6.0% |
(2.6%) |
44.5% |
10.0% |
10.3% |
-0.5% |
56.6% |
16.7% |
18.2% |
|
DTB-K |
10.6% |
32.4% |
53.7% |
17.8% |
5.3% |
42.2% |
29.7% |
36.7% |
20.6% |
4.2% |
67.3% |
20.4% |
10.2% |
|
Equity |
7.8% |
27.0% |
54.3% |
16.5% |
7.2% |
41.2% |
44.0% |
38.3% |
21.0% |
17.6% |
69.5% |
25.6% |
29.1% |
|
Co-op |
5.9% |
12.0% |
38.9% |
2.3% |
8.2% |
4.0% |
39.1% |
8.4% |
22.7% |
2.9% |
78.8% |
10.7% |
22.2% |
|
I&M |
2.2% |
22.1% |
31.2% |
16.1% |
6.2% |
36.7% |
36.1% |
12.1% |
13.9% |
(7.6%) |
75.6% |
16.7% |
15.0% |
|
KCB |
(18.3%) |
28.6% |
76.6% |
12.1% |
6.7% |
43.4% |
37.7% |
56.1% |
61.9% |
30.1% |
65.6% |
32.1% |
19.1% |
|
H1'23 Mkt Weighted Average* |
14.1% |
28.2% |
45.0% |
20.9% |
7.3% |
27.9% |
39.0% |
26.7% |
21.5% |
5.5% |
72.1% |
20.6% |
22.9% |
|
H1'22 Mkt Weighted Average** |
34.0% |
18.0% |
18.6% |
17.7% |
7.3% |
24.4% |
37.1% |
17.9% |
11.3% |
11.6% |
72.7% |
17.7% |
21.9% |
|
*Market cap weighted as at 1/09/2023 |
|||||||||||||
|
**Market cap weighted as at 09/09/2022 |
|||||||||||||
Key take-outs from the table include:
- The listed banks have released there H1’2023 earnings recorded a 14.1% growth in core Earnings per Share (EPS) in H1’2023, compared to the weighted average growth of 34.0% in H1’2022, an indication of sustained performance despite the tough operating environment experienced in H1’2023,
- Non-Funded Income grew by 27.9% compared to market weighted average growth of 24.4% in H1’2022, an indication of increased revenue diversification efforts by the banks, and,
- The Banks recorded a deposit growth of 21.5%, higher than the market weighted average deposit growth of 11.3% in H1’2022,
Universe of coverage:
|
Company |
Price as at 25/08/2023 |
Price as at 01/09/2023 |
w/w change |
m/m change |
YTD Change |
Year Open 2023 |
Target Price* |
Dividend Yield |
Upside/ Downside** |
P/TBv Multiple |
Recommendation |
|
KCB Group*** |
23.8 |
23.5 |
(1.5%) |
(17.2%) |
(38.9%) |
38.4 |
41.3 |
8.5% |
84.5% |
0.4x |
Buy |
|
Liberty Holdings |
3.8 |
3.7 |
(4.5%) |
(4.6%) |
(27.6%) |
5.0 |
5.9 |
0.0% |
62.2% |
0.3x |
Buy |
|
Jubilee Holdings |
172.3 |
176.0 |
2.2% |
(5.3%) |
(11.4%) |
198.8 |
260.7 |
6.8% |
54.9% |
0.3x |
Buy |
|
Kenya Reinsurance |
1.8 |
1.8 |
(1.6%) |
1.1% |
(3.7%) |
1.9 |
2.5 |
11.1% |
50.6% |
0.1x |
Buy |
|
Equity Group*** |
39.5 |
38.5 |
(2.7%) |
(5.2%) |
(14.7%) |
45.1 |
51.2 |
10.4% |
43.5% |
0.9x |
Buy |
|
Co-op Bank*** |
11.4 |
11.9 |
3.9% |
(2.1%) |
(2.1%) |
12.1 |
15.0 |
12.7% |
38.8% |
0.6x |
Buy |
|
ABSA Bank*** |
11.1 |
11.8 |
5.9% |
(5.3%) |
(3.7%) |
12.2 |
14.7 |
11.5% |
36.3% |
0.9x |
Buy |
|
NCBA*** |
38.3 |
40.0 |
4.4% |
3.3% |
2.7% |
39.0 |
48.9 |
10.6% |
32.8% |
0.8x |
Buy |
|
HF Group |
5.0 |
4.5 |
(9.6%) |
3.8% |
42.9% |
3.2 |
5.8 |
0.0% |
29.1% |
0.2x |
Buy |
|
Standard Chartered*** |
159.3 |
160.0 |
0.5% |
(3.5%) |
10.3% |
145.0 |
183.9 |
13.8% |
28.7% |
1.1x |
Buy |
|
Sanlam |
7.8 |
8.0 |
2.6% |
6.4% |
(16.5%) |
9.6 |
10.3 |
0.0% |
28.6% |
2.3x |
Buy |
|
CIC Group |
2.1 |
2.1 |
(0.5%) |
(5.5%) |
7.9% |
1.9 |
2.5 |
6.3% |
27.7% |
0.7x |
Buy |
|
Stanbic Holdings |
114.0 |
111.0 |
(2.6%) |
(5.0%) |
8.8% |
102.0 |
127.9 |
11.4% |
26.5% |
0.8x |
Buy |
|
Diamond Trust Bank*** |
48.2 |
48.5 |
0.6% |
2.1% |
(2.8%) |
49.9 |
54.6 |
10.3% |
23.0% |
0.2x |
Buy |
|
I&M Group*** |
18.2 |
18.1 |
(0.8%) |
(5.3%) |
5.9% |
17.1 |
19.5 |
12.5% |
20.3% |
0.4x |
Buy |
|
Britam |
5.0 |
5.3 |
6.4% |
7.5% |
2.3% |
5.2 |
6.0 |
0.0% |
12.2% |
0.7x |
Accumulate |
|
Target Price as per Cytonn Analyst estimates **Upside/ (Downside) is adjusted for Dividend Yield ***For Disclosure, these are stocks in which Cytonn and/or its affiliates are invested in |
|||||||||||
We are “Neutral” on the Equities markets in the short term due to the current tough operating environment and huge foreign investor outflows, and, “Bullish” in the long term due to current cheap valuations and expected global and local economic recovery.
With the market currently being undervalued to its future growth (PEG Ratio at 0.6x), we believe that investors should reposition towards value stocks with strong earnings growth and that are trading at discounts to their intrinsic value. We expect the current high foreign investors sell-offs to continue weighing down the equities outlook in the short term.
- Industry Reports
During the month, the following industry reports were released and the key take-outs were as follows:
|
Cytonn Report: Notable Industry Reports During the Month of August 2023 |
|||
|
# |
Theme |
Report |
Key Take-outs |
|
1 |
Prime Residential, Commercial office, and Industrial Sectors |
Kenya Market Update H1’2023 Report by Knight Frank |
|
We expect to continue witnessing growth in Kenya's Real Estate sector in terms of activity, propelled by: i) the government's increased focus on affordable housing leading to growth of the construction sector, ii) the accommodation and food sectors' sustained recovery and continued resilience post COVID-19, and, iii) positive demographics above the global averages, thus driving the demand for Real Estate upward. However, we expect hindrances to the sector's optimal performance, primarily due to high construction costs exacerbated by inflationary pressures as a result of both local and global economic shocks. Additionally, the depreciation of the Kenyan shilling against major international trading currencies such as the United States Dollar (USD) could potentially amplify the import bill for crucial construction materials such clinker for manufacture of cement, paint, and steel, thereby further slowing down the growth of the construction sector.
- Residential Sector
During the week, President William Ruto oversaw the ground-breaking of 220 housing units under Affordable Housing Program (AHP) in Bahati Constituency, Nakuru County. The project will be undertaken on a 10-acre parcel of land at an estimated cost of Kshs 505.0 mn. The project will consist of; i) nine blocks of apartments comprising of studio, one bedroom, two-bedroom, and three-bedroom housing units, ii) amenities such as community spaces, iii) a commercial area, iv) access roads, v) tree nursery, and, vi) a pitch/play area. The table below highlights the key project particulars;
|
Cytonn Report: Bahati Affordable Housing Project |
|||
|
Typology |
Total Units |
Blocks |
Plinth Area (SQM) |
|
Studio |
60 |
1 |
20 |
|
One Bedroom |
30 |
1 |
30 |
|
Two Bedroom |
100 |
6 |
40 |
|
Three Bedroom |
30 |
1 |
60 |
|
Grand Total |
220 |
9 |
|
|
|
|
Average |
37.5 |
Source: Cytonn Research
Additionally, President Ruto also broke ground the construction of 220 housing units under the Affordable Housing Programme at Milimani area, Lurambi Constituency in Kakamega County. The project, scheduled for completion by April 2025, will sit on a 4.0-acre piece of land owned by the National Government which is currently hosting civil servant houses. The government has contracted Top Choice Surveillance Limited as the developer of the project at a cost of Kshs 473.0 mn. Moreover, the president also broke ground for the construction of 220 affordable housing units in Vihiga County, sitting on a 2.0-acre land, which is part of government land that also hosts houses for civil servants. The government has contracted Padaa Enterprises as the developer of the project which will be undertaken at a cost of Kshs 536.0 mn. For both projects, the government has set aside Kshs 26.0 mn each in procuring doors and windows from selected registered local Jua-kali fabricators and carpentry associations from the region. Selected local Technical, Vocational Education and Training Institutes (TVETIs) from the region will also participate in the projects through provision of skilled artisans and technical support. Both projects will consist of; i) nine blocks of apartments comprising of studio, one bedroom, two-bedroom, and three-bedroom housing units, ii) amenities such as community spaces, iii) a commercial area, iv) access roads, and, v) a pitch/play area. The table below highlights the key project particulars that will be similar across the two AHP;
|
Cytonn Report: Kakamega & Vihiga Affordable Housing Projects |
|||
|
Typology |
Total Units |
Blocks |
Plinth Area (SQM) |
|
Studio |
60 |
1 |
20 |
|
One Bedroom |
30 |
1 |
30 |
|
Two Bedroom |
100 |
6 |
40 |
|
Three Bedroom |
30 |
1 |
60 |
|
Grand Total |
220 |
9 |
|
|
|
|
Average |
37.5 |
Source: Cytonn Research
The two projects forms part of the first three Affordable Housing Program at constituency level launched by the Government after the Gichugu AHP in Gichugu Constituency, Kirinyaga County. This is on the back of an aggressive push by the current regime to construct 200 units per constituency in the 2023/24 financial year, which is in line with the goal of bridging the existing annual housing deficit of 200,000 units, as only 50,000 units are supplied per year against a target of 250,000 units annually. The table below shows some of the various affordable housing projects by the government in the pipeline;
|
Cytonn Report: Notable Ongoing Affordable Housing Projects by the Government |
||||
|
Name |
Developer |
Location |
Launch Date |
Number of Units |
|
Ziwani Starehe Affordable Housing Project |
National Government and GulfCap Africa Limited |
Ziwani |
March 2023 |
6,704 |
|
Pangani Affordable Housing Program |
National Government and Tecnofin Kenya Limited |
Pangani |
June 2020 |
1,562 |
|
River Estate Affordable Housing Program |
National Government and Erdemann Property Limited |
Ngara |
March 2019 |
2,720 |
|
Park Road Affordable Housing Program |
National Housing Corporation |
Ngara |
February 2019 |
1,370 |
|
Mukuru Affordable Housing Program |
National Housing Corporation |
Mukuru kwa Njenga, Enterprise Road |
December 2021 |
15,000 |
|
Mavoko Affordable Housing Project |
National Government and Epco Builders |
Syokimau, Machakos County |
December 2022 |
5,360 |
|
NHC Stoni Athi View (Economy Block-Rental) |
National Housing Corporation |
Athi River, Machakos County |
December 2021 |
50 |
|
NHC Stoni Athi View |
National Housing Corporation |
Athi River, Machakos County |
December 2021 |
120 |
|
Mariguini Informal Settlement |
National Government |
Starehe, Nairobi County |
March 2021 |
2,600 |
|
Kibera Soweto East Zone B |
National Government |
Kibera, Nairobi County |
October 2022 |
3,000 |
|
Starehe Affordable Housing Project |
National Government and Tecnofin Kenya Limited |
Starehe, Nairobi County |
March 2023 |
3,000 |
|
Shauri Moyo A Affordable Housing Units |
National Government and Epco Builders |
Shauri Moyo, Nairobi County |
February 2020 |
2,731 |
|
Clay City Project |
Housing Finance Development and Investment and Clay Works |
Kasarani, Thika Road |
October 2018 |
1,800 |
|
Bachelors Jevanjee Estate |
County Government of Nairobi and Jabavu Village |
Ngara |
February 2020 |
720 |
|
Kings Boma Estate |
National Government and Kings Developers Limited |
Ruiru, Kiambu County |
January 2020 |
1,050 |
|
Gichugu Affordable Housing project |
Kirinyaga County Government and National Housing Corporation |
Gichugu, Kirinyaga County |
August 2023 |
110 |
|
Bahati Affordable Housing Project |
National Government |
Bahati, Nakuru County |
August 2023 |
220 |
|
Lurambi Affordable Housing Project |
National Government and Top Choice Surveillance Limited |
Lurambi, Kakamega County |
August 2023 |
220 |
|
Vihiga Affordable Housing Project |
National Government and Padaa Enterprise |
Vihiga County |
August 2023 |
220 |
|
Total |
|
|
|
48,557 |
Source: Boma Yangu
Other notable highlights in the sector during the month include;
- President William Ruto oversaw the ground breaking of 110 affordable housing units situated on a 1.5-acre piece of land in Gichugu Constituency, Kirinyaga County. The residential units are part of the first phase of the Gichugu Affordable Housing project which will be a comprehensive development comprising of; i) studio, two- and three-bedroom units, ii) amenities such as a social hall, iii) a commercial area, and, iv) a pitch/play area. For more information, please see our Cytonn Weekly #32/2023.
We expect to continue seeing prioritized efforts by the current administration to address the annual housing deficit in Kenya, which is estimated to be at 80.0%, according to the National Housing Corporation (NHC). The government has aimed to address this deficit by partnering with the private sector and implementing public and legal interventions to provide supporting infrastructure, and streamline transactions in the sector for execution of affordable housing options for its citizens.
However, the exorbitant cost of financing in housing development and increasing construction expenses pose significant challenges in Kenya's housing sector, particularly in urban areas. This results in elevated development costs for builders, making it difficult for people to afford homes. As a consequence, Kenya lags behind other African countries like South Africa, Ghana, Malawi, and Nigeria in terms of urban homeownership rates. These countries boast urban homeownership rates of 69.7%, 52.0%, 30.0%, and 25.5%, respectively. The graph below shows urban homeownership percentage for different countries in comparison to Kenya;
Source: CAHF, United States Census Bureau, United Kingdom Office for National Statistics
However, contrastingly, homeownership statistics at the national level highlight a nuanced divergence in the prevailing circumstances. National homeownership rates in Kenya are comparatively higher than urban homeownership rates. This raises concerns whether it is prudent for the government to increasingly focus its delivery of housing units for homeownership in rural areas of Kenya through the Affordable Housing Program Constituency Level Agenda. The graph below shows national homeownership percentages for different countries in comparison to Kenya;
Source: CAHF, United States Census Bureau, United Kingdom Office for National Statistics
- Retail Sector
Notable highlights during the month include;
- Chain store Naivas Supermarket opened its 98th outlet located at Shell petrol station, along Waiyaki Way, Nairobi. The retailer’s decision to open up the store forms part of its expansion strategy dubbed ‘Road To 100’, and was driven by; i) Naivas’ ambition to enhance shopping accessibility for its shoppers, ii) Naivas’ ongoing aggressive drive to broaden its presence and boost its market share in a bid to stamp market dominance against rival retailers such as Quickmart, and Carrefour, and, iii) The strategic location at Shell petrol station along Waiyaki Way aiming to capitalize on booth foot and vehicular traffic into the petrol station. For more information, please see our Cytonn Weekly #34/2023
We anticipate a sustained upsurge in activities within the Kenyan retail industry, supported by; i) ongoing expansion efforts by local and foreign retailers to capture a larger market share and establish dominance, ii) increased capital investments from foreign entities in the Kenyan retail market amid e-commerce developments, iii) rising demand for goods, services, and retail spaces due to favourable demographics in the country, and, iv) infrastructural developments enhancing accessibility in various regions, thus opening up viable opportunities to previously inaccessible areas for retail investment. However, the sector's optimal performance is expected to be subdued by challenging economic conditions such as inflationary pressures, eroding the purchasing power of consumers, which could have a dampening effect among retailers. Additionally, the oversupply of retail spaces, currently estimated at 3.3 mn SQFT in the Nairobi Metropolitan Area (NMA) and 2.1 mn SQFT in the larger Kenyan retail sector (excluding NMA), will continue to subdue the sector.
- Industrial Sector
During the week, Kenya Electricity Generating Company (KenGen), government energy and electricity generating company, and Konza Technopolis Development Authority (KoTDA), government agency overseer of the Konza Technopolis development and management, broke ground for KenGen’s Green Energy Park in Olkaria, Naivasha. The industrial park project, spanning 342.0 hectares, is estimated to be developed at a cost of USD 884.0 mn (Kshs 128.4 bn). The park aims to attract a diverse range of businesses, including small, medium, and large enterprises involved in the production of fertilizers, iron, steel, plastics, packaging, fabricated metal and wood products, food and beverages, textiles, and apparel. Additionally, part of the land will be leased for commercial offices, data centers, research and development centers, hospitality spaces, visitor experience centers, and administrative facilities. KoTDA has already set a plan to establish a modern data centre within the park dubbed ‘Eco Cloud Datat Center’. The industrial park is set to be developed under four phases for a period of up to 20 years.
The major aim of the government-driven investment is to stimulate industrialization in the region while providing a sustainable, clean, and renewable energy source from Olkaria's steam-intensive geothermal deposits. This investment will substantially reduce electricity costs for the businesses within the park, with KenGen specifically offering an estimated tariff of Kshs 5.0 per kilowatt, in addition to promoting an environmentally friendly atmosphere. The Kengen Green Industrial Park joins other industrial investments across the country such as Tatu City in Kiambu County, Athi River EPZ in Machakos County, and Dongo Kundu Special Economic Zones (SEZs) connecting Mombasa and Kwale Counties. This also follows the gazettement of the Two Rivers Land for establishment of Two Rivers International Finance and Innovation Centre (TRIFIC), a private services-focused SEZ by Centum Investment Company in Kiambu County. This gazettement sets the stage for TRIFIC's future development phases, which are expected to catalyze Foreign Direct Investments (FDIs) in the park following the successful acquisition of 1.2 mn SQM of development rights on the 80-Acre Two Rivers Development Land (TRDL) and interests in utility companies like Two Rivers Power Company, Limited, and Two Rivers Water & Sanitation Company Limited.
We therefore expect crucial investments in the industrial sector to be spearheaded by establishment of more government and private SEZs, Export Processing Zones (EPZs) industrial parks strategically located along major agricultural zones and infrastructural and transportation linkages across the country. The establishment of these investments is part of Kenya’s Industrial Transformation Programme launched in 2015 and the government’s County Aggregation Industrial Parks Agenda which target to; i) increase activities in the manufacturing sector to over 15.0% of the country’s Gross Domestic Product (GDP), ii) create one million job opportunities, in a bid to tackle the current unemployment rate, currently standing at 4.9%, as at December 2022, iii) attract local capital by improving the ease of doing business among local investors, iv) influence a five-fold growth in Foreign Direct Investments (FDIs) by promoting and facilitating export-oriented investments in a bid to boost inflows and attracting more foreign businesses investors in setting up their operations on large scale, and, v) construction of industrial parks across all the 47 counties at a cost of Kshs 500.0 mn in each county. This is on the back of various incentives offered within the zones such as administration and tax exemptions as well as access to cheaper power tariffs which were reviewed to Kshs 10.0 per unit in March 2023 Power Tariff Review.
Furthermore, we anticipate substantial growth and development in the industrial sector in 2023 supported by; i) increased business operations in the post-election and post-COVID-19 period, ii) the government's accelerated focus on exporting agricultural and horticultural products to the international market, with aim to improve the quantity, quality, efficiency, and reliability of Kenya-farmed produce thereby increasing the country’s competitiveness, iii) Kenya being recognized as a regional hub hence attracting investments exhibited by entry, expansions, mergers and acquisitions of more foreign manufacturing entities such as CFAO Motors, Unilever East Africa, Safic-Alcan, Taifa Gas, Globeleq, and many more, iv) increased demand for data centres by both the government and private-sector firms driven by continued increase in demand for data protection services in line with the Data Protection Act 2019 requiring personal data to be stored in servers or data centres located within Kenya’s borders, v) increased demand for cold storage facilities for perishable agricultural produces for export and drugs and vaccines whose demand is supported by the Universal Health Coverage program initiated by the government and private and Non-Governmental health organisations, and, vi) increased demand of e-commerce warehouses in the retail sector driven by the rising demand for space to store goods meant for delivery to clients across the country, as more people shift towards home delivery as a convenient and efficient way to purchase goods. However, the prolonged stalling of development of infrastructure such as roads, water and electricity within industrial parks and in most towns continues to hamper optimum development and investments in the industrial sector.
- Infrastructure Sector
During the week, Superior Homes, a Kenyan- based housing developer and an affiliate of Cytonn Group, broke ground for the construction of its first modern roadside stopover facility at Sultan Hamud town along the busy Nairobi – Mombasa highway. The Kshs 350.0 mn complex, which will also serve as a pilot project, is part of a partnership project between Superior Homes and Northern Corridor Transit and Transport Coordination Authority (NCTTA) in developing 30 service and rest point areas dubbed ‘SupaStop’. The rest points will strategically be located along various busy transit routes frequented by long-distance truckers traversing the country to neighbouring landlocked countries. The complex itself will boast a range of amenities tailored to cater to the needs of long-distance truckers such as; i) safe parking spaces, ii) driver accommodation features, iii) convenience stores for food and beverage options, iv) health facilities, v) truck maintenance and refueling, and, vi) cargo handling. For more information about the project, please see our Cytonn Monthly- February 2023.
Upon completion of the Sultan Hamud roadside stations and the successful establishment of future facilities through this partnership, we expect;
- Enhanced road safety and reduced fatigue-related accidents by ensuring that long-distance drivers get proper rest and rejuvenation before continuing their journey,
- Improved highway infrastructure and experience by both travellers and drivers as these well-equipped rest points will enhance the overall quality of the highway network. Beyond merely offering rest areas, these stations will provide comprehensive services such as maintenance, repair, and driver training. This holistic approach will not only enhance the overall quality of the highway network but also lead to streamlined supply chains, reduced transportation costs, and heightened efficiency within the transportation sector,
- Creation of direct and indirect employment opportunities for local communities thus leading to increased economic activity and further improving livelihoods in the surrounding areas and boosting of property prices within the key locations, and,
- Diversification of business portfolio in the real estate sector. Through addressing the existing gap in proper truck stop facilities, Superior Homes is not only fulfilling an unmet need for formal accommodations for travellers and drivers but also positioning itself for growth in an emerging market segment under the transportation sector.
We therefore expect both the local and national governments to continuously foster strategic partnership with other public transport agencies, and major stakeholders within and beyond the infrastructure sector. These collaborations will extend beyond road construction and encompass the development of supporting facilities with standardized and quality amenities that are poised to serve as hubs for road safety awareness campaigns, promoting a culture of safe driving. Additionally, the government has increased budget allocation to the infrastructure sector by 16.9%, to Kshs 286.6 bn in FY’2023/2024 from Kshs 245.1 bn in FY’2022/2023, with key focus on development and maintenance of major roads railway and air transport networks, and other support facilities that make it easier for delivery of people, goods, and services efficiently, thereby increasing demand for Real Estate properties.
- Regulated Real Estate Funds
- Real Estate Investment Trusts (REITs)
During the week, the Capital Markets Authority (CMA) gave its approval for the conversion of ILAM Fahari Income Real Estate Investment Trust (REIT) from the Unrestricted Main Market segment of the Nairobi Securities Exchange (NSE) into the Restricted Market Segment through a Conversion Offering Memorandum. Under the conversion process, 36,585,134 units held by retail investors also known as non-professional investors, worth below Kshs 5.0 mn will redeem their shares at Kshs 11.0 per unit to ICEA Lion Asset Management Limited. ICEA Lion which manages the REIT will therefore invest a total amount of Kshs 402.4 mn in acquiring the shares, thus lifting its ownership in the REIT to 22.9% from a previous minority stake of 2.7%, after acquiring 5.0 mn shares of the REIT in 2021. The proposed conversion is part of the ongoing strategic restructuring of the property fund. The offer is set to commence on September 6, 2023, and will conclude on October 6, 2023. Non-professional investors listed in the register will have access to a portal where they can submit their acceptance forms to redeem their units. Upon acceptance, the unitholders will not be allowed to sell their units through the secondary market. However, the non-professional investors who will not sell their units will have the option of top-up their units to reach the Professional investor threshold. After the one month offering period, the units will be suspended from trading from 6 October to 25 October after which the suspension will be lifted and the REIT units will resume trading on the Unquoted Securities Exchange (USP).
As a result, there will be no active trading of REITs in the main market segment of NSE. All three REITs, namely Acorn D-REIT, Acorn I-REIT, and ILAM Fahari I-REIT, will be traded over the counter, while LAPTRUST Imara I-REIT still remains restricted from open trading for a three-year period starting from March 2023. Furthermore, the restriction to only high-net-worth individuals and companies with the ability to trade shares worth more than Kshs 5.0 mn continues to limit the participation of small-scale investors in the industry. The purpose of REITs is to securitize large investments into smaller, marketable units that can be accessible to smaller investors seeking reasonable dividends. This challenge, in addition to other persistent issues like inadequate investor understanding, lengthy approval processes for REIT creation, high minimum capital requirements for trustees, and minimum investment amounts set at Kshs 5.0 mn, hampers the performance of the Kenyan REITs market. Despite ICEA Lion’s decision to purchase the units at a premium of 22.2% going with the current REIT share price of 9.0%, those who initially bought their shares at the inception price of Kshs 20.0 will still experience a loss of 45.0% when compelled to sell back to ICEA. However, the loss will be reduced by 10.0% points from the current Inception to Price (ITD) loss of 55.0%. This crucial decision comes a few months after a prior strategic decision made by the property fund which proposed the sale of two properties valued at Kshs 200.4 mn, as part of its strategy to divest non-core assets and reorganize its operations. The sale process is anticipated to conclude by December 2023. Fahari initially acquired these properties in 2016 for a total of Kshs 324.8 mn, resulting in a 33.8% loss on the disposals before accounting for the rental income accumulated over the years. These planned asset sales will leave the I-REIT with only two remaining properties in its portfolio: Greenspan Mall, a retail center in Donholm, and a commercial office building named 67 Gitanga Place in Lavington.
In the short-term period until the opening of the offering period, we anticipate that this decision will lead to a significant increase in the REIT's share price, which has not been observed since its inception price of Kshs 20.0 in 2015. However, for a long-term effect, we expect reduced activities in the industry as all REIT platforms are at a cautionary undertaking of their businesses by not actively engaging in open trading of their shares on the NSE. This may also involve restrictions on offering interim or final dividends to existing investors, as analyzed in our Kenya’s Real Estate Investments Trusts (REITS) H1’2023 Report . Instead, we expect the REITs will focus on long-term capital growth, portfolio development in Real Estate, stabilization of earnings, and acquiring more investments before considering re-entering the main market segment of NSE. Furthermore, the restriction limiting only high-net-worth individuals to buying shares contradicts a proposal made by the CMA to reduce the minimum investment for entering the market from Kshs 5.0 mn to Kshs 10,000, thereby hindering investment decisions for many small-scale retail investors who would otherwise be attracted to invest in Kenyan REITs market.
Additionally, in the Nairobi Securities Exchange, ILAM Fahari I-REIT closed the week trading at an average price of Kshs 9.0 per share. The performance represented a 49.5% increase from Kshs 6.0 per share recorded the previous week, taking it to a 32.7% Year-to-Date (YTD) growth from Kshs 6.8 per share recorded on 3 January 2023. However, the performance represented a 55.0% Inception-to-Date (ITD) decline from the Kshs 20.0 price. The dividend yield currently stands at 7.2%. The graph below shows Fahari I-REIT’s performance from November 2015 to 01 September 2023;
In the Unquoted Securities Platform, Acorn D-REIT and I-REIT traded at Kshs 23.9 and Kshs 21.6 per unit, respectively, as at 01 September 2023. The performance represented a 19.4% and 8.0% gain for the D-REIT and I-REIT, respectively, from the Kshs 20.0 inception price. The volumes traded for the D-REIT and I-REIT came in at 12.3 mn and 30.4 mn shares, respectively, with a turnover of Kshs 257.5 mn and Kshs 624.6 mn, respectively, since inception in February 2021.
REITs provide various benefits like tax exemptions, diversified portfolios, and stable long-term profits. However the continuous deterioration in performance of the Kenyan REITs and restructuring of their business portfolio hampering major investment they had previously made are on top of other general challenges such as; i) inadequate comprehension of the investment instrument among investors, ii) prolonged approval processes for REITs creation, iii) high minimum capital requirements of Kshs 100.0 mn for trustees, and, iv) minimum investment amounts set at Kshs 5.0 mn, continue to limit the performance of the Kenyan REITs market.
- Cytonn High Yield Fund (CHYF)
Cytonn High Yield Fund (CHYF) closed the week with an annualized yield of 13.7%, 0.1% points increase from 13.6% recorded the previous week. However, the performance represented a 0.2% points Year-to-Date (YTD) decline from 13.9% yield recorded on 1 January 2023, and 2.0% points Inception-to-Date (ITD) decline from the 15.7% yield. The graph below shows Cytonn High Yield Fund’s performance from October 2019 to 01 September 2023;
Notably, the CHYF has outperformed other regulated Real Estate funds with an annualized yield of 13.7%, as compared to Fahari I-REIT, and Acorn I-REIT with yields of 7.2% and 2.8% respectively. As such, the higher yields offered by CHYF makes the fund one of the best alternative investment resource in the Real Estate sector. The graph below shows the yield performance of the Regulated Real Estate Funds:
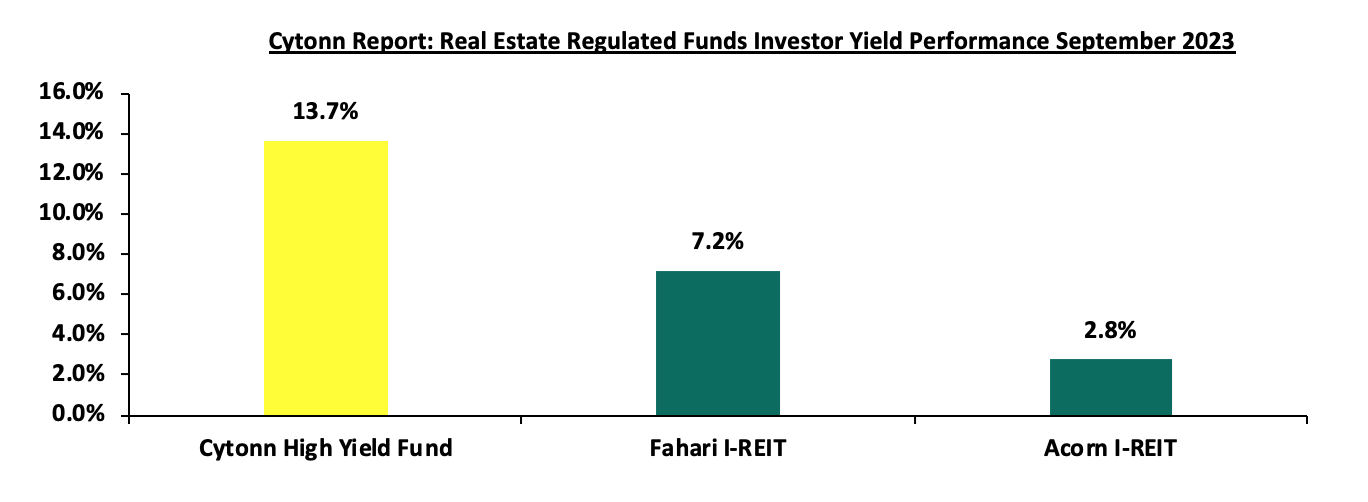
Source: Cytonn Research
We expect the performance of Kenya’s Real Estate sector to remain on an upward trajectory, supported by factors such as; i) growing demand for high quality modern warehousing facilities, SEZs, and EPZs industrial parks ii) positive demographic trends facilitating increased housing demand, iii) continued focus by the government and private sector to provide affordable housing, iv) strategic partnerships by the government and stakeholders in supporting infrastructure developments and opening up areas for investments, iv) rapid expansion of retail investors, and, v) increased foreign capital investments into the Kenyan retail industry. However, the oversupply of physical space in select sectors, including commercial office and retail sectors leading to slower uptake of new spaces, rising construction costs stemming from inflationary pressures, reduced activities and more investment restrictions by Kenya REITs, and limited investor knowledge and interest in REITs industry, which are expected to impede the general sector's optimal performance.

- Talk to us
- Kenya
- P.O Box 20695 - 00200, Nairobi, Kenya
- Cell +254709101200
- Tel +254709101200
- WhatsApp +254741676635
- United States
- +254709101200
- DOWNLOAD OUR APP
-


- Kenya
- 8th Floor, Pinetree Plaza, Kaburu Drive, Ngong Road, Nairobi, Kenya
- USA
- Suite 1150, 1775 Eye Street NW, USA, Washington DC 20006, USA
- Investments
- High Yield
- Private Equity
- Real Estate
- Real Estate
- RiverRun Estates
- Cytonn Towers
- The Ridge
- Taraji Heights
- The Alma