Cytonn Monthly – November 2023
By Cytonn Research, Dec 3, 2023
Executive Summary
Fixed Income
During the month of November 2023, T-bills were oversubscribed, with the overall average subscription rate coming in at 156.4%, higher than the oversubscription rate of 129.3% recorded in October 2023. The overall average subscription rates for the government papers increased with the 364-day, 182-day, and 91-day papers increasing to 26.3%, 68.7%, and 701.2%, from 25.6%, 34.1%, and 626.7% respectively, which were recorded in October 2023. The average yields on the government papers were on an upward trajectory in the month, with the 364-day, 182-day, and 91-day papers yields increasing by 28.8 bps, 36.8 bps, and 36.4 bps to 15.6%, 15.4%, and 15.4% respectively from 15.3%, 15.1% and 15.0 recorded the previous month. For the month of November, the government accepted a total of Kshs 179.7 bn of the Kshs 187.7 bn worth of bids received, translating to an acceptance rate of 95.7%;
For the month of November 2023 bonds were oversubscribed, with the overall subscription rate coming in at 177.8%, higher than the oversubscription rate of 31.5% recorded in October 2023. The newly issued infrastructure bond IFB1/2023/6.5 received bids worth Kshs 88.9 bn against the offered Kshs 50.0 bn, translating to an oversubscription rate of 177.8% with the government accepting bids worth Kshs 67.1 bn, translating to an acceptance rate of 75.4%. This was the only bond issued and closed in the month of November;
During the week, T-bills were oversubscribed for the fifth consecutive week, with the overall subscription rate coming in at 100.3%, lower than the oversubscription rate of 115.1% recorded the previous week. Investors’ preference for the shorter 91-day paper persisted, with the paper receiving bids worth Kshs 19.4 bn against the offered Kshs 4.0 bn, translating to an oversubscription rate of 485.0%, lower than the oversubscription rate of 584.9% recorded the previous week. The subscription rates for the 182-day and 364-day papers increased to 27.0% and 19.7%, from 23.8% and 18.5% respectively, recorded the previous week. The government accepted a total of Kshs 22.8 bn worth of bids out of Kshs 24.1 bn of bids received, translating to an acceptance rate of 94.9%. The yields on the government papers were on an upward trajectory, with the yields on the 364-day,182-day, and 91-day papers increasing by 14.4 bps, 10.6 bps and 8.7 bps to 15.7%, 15.6%, and 15.5% respectively;
In the primary bond market, the government is seeking to raise an additional Kshs 25.0 bn for funding of infrastructure projects in the current financial year by issuing a tap sale of the 6.5-year bond IFB1/2023/6.5 with a tenor to maturity of 6.5 years. The bidding process opened on Tuesday 21st November 2023 and will close on 6th December 2023, with the coupon rate set at 17.9%. The bond's value date will be 11th December 2023, with a maturity date of 6th May 2030. We anticipate the bond to be oversubscribed, given its tax-free nature, and the high yield that it offers;
During the week, the Kenya National Bureau of Statistics (KNBS) released the year-on-year inflation highlighting that the inflation rate in the month of November 2023 decreased to 6.8%, from the 6.9% in October 2023, marking the fifth consecutive month that the inflation has remained within the CBK target range of 2.5%-7.5%;
Equities
During the month of November 2023, the equities market was on an upward trajectory, with NASI gaining the most by 3.8%, while NSE 20, NSE 25 and NSE 10 gained by 2.4%, 0.4% and 0.2% respectively. The equities market performance was driven by gains recorded by large-cap stocks such as Bamburi, Safaricom and KCB of 53.1%, 12.9% and 7.7%respectively. The gains were, however, weighed down by losses recorded by large cap stocks such as EABL, Stanbic and Absa of 10.7%, 5.8% and 3.9% respectively;
During the week, the equities market recorded mixed performance, with NSE 20, NSE 25 and NSE 10 declining by 1.0%, 0.8% and 0.5% respectively, while NASI gained marginally by 0.03%, taking the YTD performance to losses of 27.5%, 10.8%, and 23.6% for NASI, NSE 20, and NSE 25, respectively. The equities market performance was mainly driven by losses recorded by large-cap stocks such as Stanbic, ABSA and KCB of 6.6%, 5.6% and 4.5%, respectively. However, the losses were mitigated by gains in stocks such as Safaricom, NCBA and Bamburi of 2.6%, 2.4% and 0.1% respectively;
During the month, the ten listed banks released their Q3’2023 results. Notably, all the listed banks recorded an increase in their Earnings Per Share (EPS), pointing towards profit growth, with HF Group recording the highest increase of 283.9% to Kshs 0.6 from Kshs 0.2 in Q3’2022. The results are summarized in the table below;
|
Cytonn Report: Summary of Listed Banks Q3’2023 Results |
||||||
|
Bank |
Q3'2023 PAT(Kshs bn) |
Q3'2022 PAT (Kshs bn) |
Change in PAT |
Q3'2023 EPS (Kshs) |
Q3'2022 EPS(Kshs) |
Change in EPS |
|
HF Group |
0.2 |
0.06 |
283.9% |
0.6 |
0.2 |
283.9% |
|
Stanbic Bank |
9.3 |
7 |
32.7% |
23.5 |
17.7 |
32.7% |
|
ABSA Bank Kenya |
12.3 |
10.7 |
14.9% |
2.3 |
2.0 |
14.9% |
|
NCBA Group |
14.6 |
12.8 |
14.4% |
8.9 |
7.8 |
14.4% |
|
I&M Holdings |
8.2 |
7.2 |
14.3% |
5.0 |
4.3 |
14.3% |
|
Standard Chartered Bank Kenya |
9.7 |
8.7 |
11.8% |
25.8 |
23.1 |
11.8% |
|
Co-operative Bank of Kenya |
18.4 |
17.1 |
7.6% |
3.1 |
2.9 |
7.6% |
|
Equity Group |
36.2 |
34.4 |
5.3% |
9.6 |
9.1 |
5.3% |
|
Diamond Trust Bank |
6.6 |
6.3 |
5.2% |
23.6 |
22.5 |
5.2% |
|
KCB |
30.7 |
30.6 |
0.4% |
9.6 |
9.5 |
0.4% |
Real Estate
During the week, the Kenya Mortgage Refinance Company (KMRC), in partnership with the treasury and private lenders, launched the Risk Sharing Facility (RSF) aimed at increasing home ownership amongst workers in the informal settlement;
In the industrial sector, Sameer Africa launched the construction of a new Kshs 260.0 mn industrial warehousing facility, as part of its expansion of its Real Estate business;
In regulated Real Estate Funds, under the Real Estate Investment Trusts (REITs) segment, unitholders of ILAM Fahari I-REIT approved the proposed operational restructuring and delisting of the REIT from the Main Investment Market Segment of the Nairobi Securities Exchange (NSE);
In the Nairobi Securities Exchange, Fahari I-REIT closed the week trading at an average price of Kshs 5.8 per share in the representing a 2.3% decline from the Kshs 6.0 recorded the previous week;
On the Unquoted Securities Platform, as at 1st December 2023, Acorn D-REIT and I-REIT closed the week trading at Kshs 25.3 and Kshs 21.7 per unit, a 26.6% and 8.3% gain for the D-REIT and I-REIT, respectively, from the Kshs 20.0 inception price. In addition, Cytonn High Yield Fund (CHYF) closed the week with an annualized yield of 18.0%, remaining relatively unchanged from the previous week;
Investment Updates:
- Weekly Rates:
- Cytonn Money Market Fund closed the week at a yield of 15.62% p.a. To invest, dial *809# or download the Cytonn App from Google Playstore here or from the Appstore here;
- Cytonn High Yield Fund closed the week at a yield of 17.95% p.a. To invest, email us at sales@cytonn.com and to withdraw the interest, dial *809# or download the Cytonn App from Google Play store here or from the Appstore here;
- We continue to offer Wealth Management Training every Wednesday, from 9:00 am to 11:00 am. The training aims to grow financial literacy among the general public. To register for any of our Wealth Management Trainings, click here;
- If interested in our Private Wealth Management Training for your employees or investment group, please get in touch with us through wmt@cytonn.com;
- Cytonn Insurance Agency acts as an intermediary for those looking to secure their assets and loved ones’ future through insurance namely; Motor, Medical, Life, Property, WIBA, Credit and Fire and Burglary insurance covers. For assistance, get in touch with us through insuranceagency@cytonn.com;
- Cytonn Asset Managers Limited (CAML) continues to offer pension products to meet the needs of both individual clients who want to save for their retirement during their working years and Institutional clients that want to contribute on behalf of their employees to help them build their retirement pot. To more about our pension schemes, kindly get in touch with us through pensions@cytonn.com;
Real Estate Updates:
- For more information on Cytonn’s real estate developments, email us at sales@cytonn.com;
- Phase 3 of The Alma is now ready for occupation and the show house is open daily. To join the waiting list to rent, please email properties@cytonn.com;
- For Third Party Real Estate Consultancy Services, email us at rdo@cytonn.com;
- For recent news about the group, see our news section here;
Hospitality Updates:
- We currently have promotions for Staycations. Visit cysuites.com/offers for details or email us at sales@cysuites.com;
Money Markets, T-Bills Primary Auction:
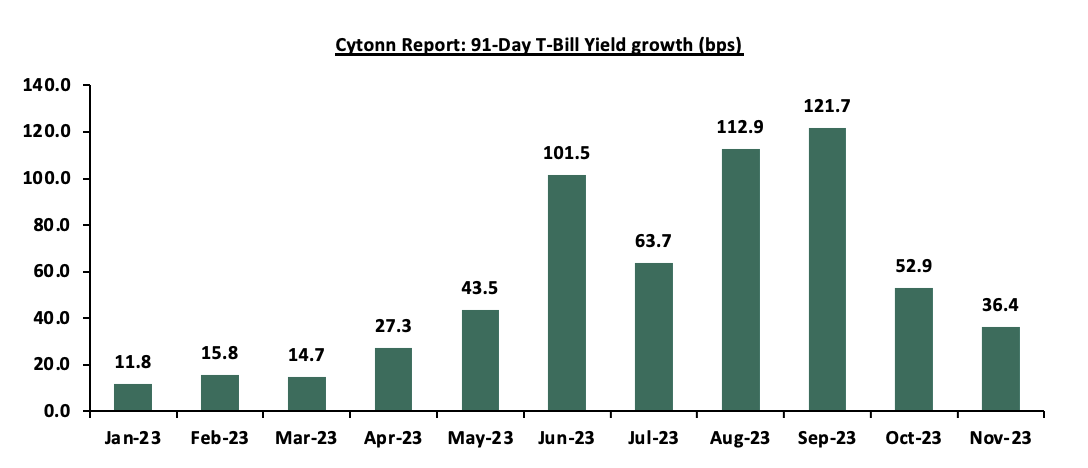
During the month of November 2023, T-bills were oversubscribed, with the overall average subscription rate coming in at 156.4%, higher than the oversubscription rate of 129.3% recorded in October 2023. The overall average subscription rates for the government papers increased with the 364-day, 182-day, and 91-day papers increasing to 26.3%, 68.7%, and 701.2%, from 25.6%, 34.1%, and 626.7% respectively, which were recorded in October 2023. The average yields on the government papers were on an upward trajectory in the month, with the 364-day, 182-day, and 91-day papers yields increasing by 28.8 bps, 36.8 bps, and 36.4 bps to 15.6%, 15.4%, and 15.4% respectively from 15.3%, 15.1% and 15.0 recorded the previous month. For the month of November, the government accepted a total of Kshs 179.7 bn of the Kshs 187.7 bn worth of bids received, translating to an acceptance rate of 95.7%. Notably, the growth in the government papers yields slowed down in November compared to October, with the yields on the 91-day paper growing by 36.4 bps, compared to 52.9 bps growth that was recorded in October, as the government tries to minimize debt cost through avoiding highly priced bids. The chart below shows the yields growth rate for the 91-day paper during the year:
During the week, T-bills were oversubscribed for the fifth consecutive week, with the overall subscription rate coming in at 100.3%, lower than the oversubscription rate of 115.1% recorded the previous week. Investors’ preference for the shorter 91-day paper persisted, with the paper receiving bids worth Kshs 19.4 bn against the offered Kshs 4.0 bn, translating to an oversubscription rate of 485.0%, lower than the oversubscription rate of 584.9% recorded the previous week. The subscription rates for the 182-day and 364-day papers increased to 27.0% and 19.7%, from 23.8% and 18.5% respectively, recorded the previous week. The government accepted a total of Kshs 22.8 bn worth of bids out of Kshs 24.1 bn of bids received, translating to an acceptance rate of 94.9%. The yields on the government papers were on an upward trajectory, with the yields on the 364-day,182-day, and 91-day papers increasing by 14.4 bps, 10.6 bps and 8.7 bps to 15.7%, 15.6%, and 15.5% respectively;
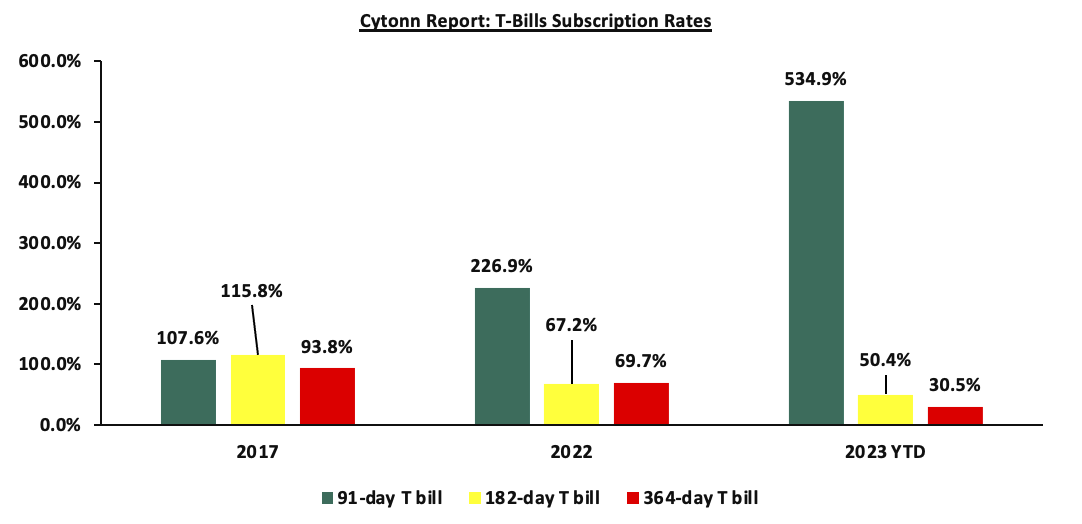
So far in the current FY’2023/24, government securities totaling Kshs 808.0 bn have been advertised. The government has accepted bids worth Kshs 858.3 bn, Kshs 635.3 bn treasury bills and Kshs 223.0 bn Treasury bonds, respectively. Total redemptions so far in FY’2023/24 equal to Kshs 728.5 bn, with treasury bills accounting for all redemptions. As a result, the total new domestic borrowing stands at Kshs 129.8 billion in FY’2023/24
The chart below compares the overall average T- bills subscription rates obtained in 2017, 2022 and 2023 Year to Date (YTD):
Additionally, For the month of November 2023 bonds were oversubscribed, with the overall subscription rate coming in at 177.8%, higher than the oversubscription rate of 31.5% recorded in October 2023. The newly issued infrastructure bond IFB1/2023/6.5 received bids worth Kshs 88.9 bn against the offered Kshs 50.0 bn, translating to an oversubscription rate of 177.8% with the government accepting bids worth Kshs 67.1 bn, translating to an acceptance rate of 75.4%. This was the only bond issued and closed in the month of November; The table below provides more details on the bonds issued from June to November 2023:
|
Cytonn Report: Bonds Issued in June-November 2023 |
||||||||||
|
Issue Date |
Bond Auctioned |
Effective Tenor to Maturity (Years) |
Coupon |
Amount offered (Kshs bn) |
Actual Amount Raised (Kshs bn) |
Total bids received |
Average Accepted Yield |
Subscription Rate |
Acceptance Rate |
|
|
7/17/2023 |
FXD1/2016/10-Re-opened |
3.2 |
15.0% |
40.0 |
38.6 |
51.8 |
16.3% |
129.4% |
74.5% |
|
|
FXD1/2023/05 |
5.0 |
16.8% |
16.8% |
|||||||
|
7/24/2023 |
FXD1/2016/10 - tap sale |
3.2 |
15.0% |
20.0 |
43.4 |
44.4 |
16.3% |
222.1% |
97.8% |
|
|
FXD1/2023/05 - tap sale |
5.0 |
16.8% |
16.8% |
|||||||
|
8/21/2023 |
FXD1/2023/02 |
2.0 |
17.0% |
40.0 |
19.1 |
53.0 |
17.0% |
132.5% |
36.1% |
|
|
FXD1/2023/05-Re-opened |
4.9 |
16.8% |
18.0% |
|||||||
|
8/28/2023 |
FXD1/2023/02- tapsale |
2.0 |
17.0% |
21.0 |
23.5 |
23.6 |
17.0% |
112.4% |
99.6% |
|
|
FXD1/2023/05- tapsale |
4.9 |
16.8% |
18.0% |
|||||||
|
9/18/2023 |
FXD1/2023/02-Reopened |
1.9 |
17.0% |
35.0 |
21.6 |
34.0 |
17.5% |
97.2% |
63.6% |
|
|
FXD1/2016/10- Reopened |
2.9 |
15.0% |
17.9% |
|||||||
|
02/10/2023 |
FXD1/2023/02-tapsale |
1.9 |
17.0% |
15.0 |
3.4 |
3.4 |
17.50% |
23.0% |
97.9% |
|
|
FXD1/2016/10- tapsale |
2.9 |
15.0% |
17.93% |
|||||||
|
16/10/2023 |
FXD1/2023/02-Reopened |
1.9 |
17.0% |
35.0 |
6.3 |
12.3 |
17.7% |
35.1% |
51.3% |
|
|
FXD1/2023/05-Reopened |
4.8 |
16.8% |
18.0% |
|||||||
|
13/11/2023 |
IFB1/2023/6.5 |
6.5 |
17.9% |
50.0 |
67.1 |
88.9 |
17.9% |
177.8% |
75.4% |
|
|
Jun-Nov Sum |
256.0 |
223.0 |
311.5 |
|||||||
|
Jun-Nov Average |
3.5 |
16.5% |
36.4 |
16.8 |
24.8 |
17.4% |
116.2% |
74.5% |
||
Source: Central Bank of Kenya (CBK)
In the primary bond market, the government is seeking to raise an additional Kshs 25.0 bn for funding of infrastructure projects in the current financial year by issuing a tap sale of the 6.5-year bond IFB1/2023/6.5 with a tenor to maturity of 6.5 years. The bidding process opened on Tuesday 21st November 2023 and will close on 6th December 2023, with the coupon rate set at 17.9%. The bond's value date will be 11th December 2023, with a maturity date of 6th May 2030, and will be tax-free as is the case for infrastructure bonds as provided for under the Income Tax Act. We anticipate the bond to be oversubscribed, given its tax-free nature, and the high yield that it offers
Secondary Bond Market:
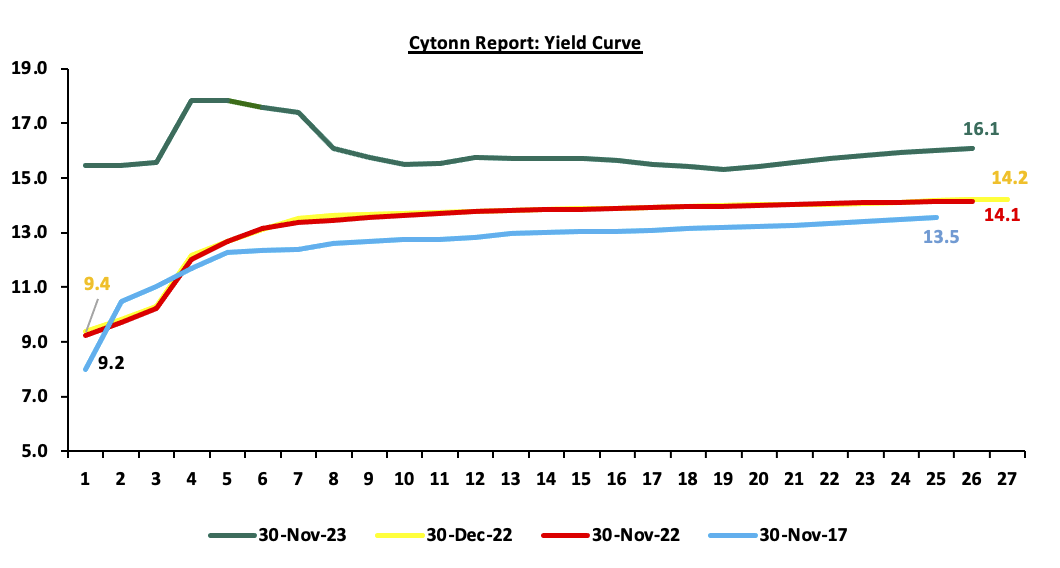
The yields on the government securities were on an upward trajectory during the month compared to the same period in 2022. Notably, the yields on short to medium-term government bonds continues to rise faster than the yield on long-term bonds as investors seek higher yields to cushion themselves against potential losses on the back of the government’s debt sustainability concerns, ahead of the maturity of USD 2.0 bn Eurobond in June next year. The chart below shows the yield curve movement during the period:
The secondary bond turnover increased by 29.3% to Kshs 49.1 bn, from Kshs 38.0 bn recorded in October 2023, pointing towards increased activities by commercial banks in the secondary bonds market. On a year-on-year basis, the bonds turnover decreased by 9.9% from Kshs 54.5 bn worth of treasury bonds transacted over a similar period last year.
Money Market Performance:
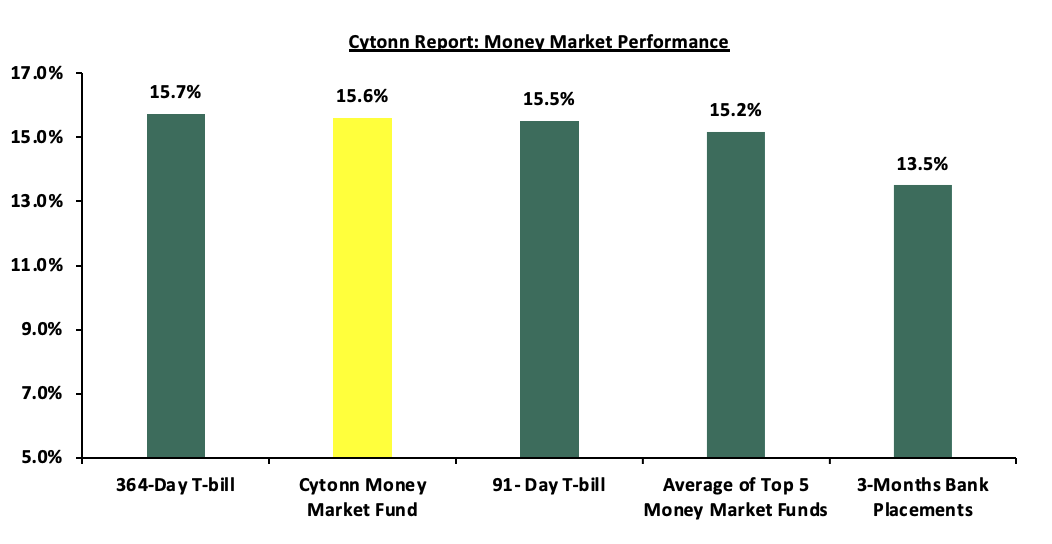
In the money markets, 3-month bank placements ended the week at 13.5% (based on what we have been offered by various banks), The yield on the 364-day paper increased by 14.4 bps to 15.7%, while that of 91-day paper increased by 8.7 bps to 15.5%. The yield of Cytonn Money Market Fund increased by 1.0 bps to stay relatively unchanged at 15.6% and the average yields on the Top 5 Money Market Funds decreased slightly by 2.6 bps, also remaining relatively unchanged at 15.2%.
The table below shows the Money Market Fund Yields for Kenyan Fund Managers as published on 1st December 2023:
|
Cytonn Report: Money Market Fund Yield for Fund Managers as published on 1st December 2023 |
||
|
Rank |
Fund Manager |
Effective Annual |
|
1 |
Cytonn Money Market Fund (Dial *809# or download the cytonn app) |
15.6% |
|
2 |
Etica Money Market Fund |
15.5% |
|
3 |
GenAfrica Money Market Fund |
15.4% |
|
4 |
Lofty-Corban Money Market Fund |
15.1% |
|
5 |
Enwealth Money Market Fund |
14.3% |
|
6 |
Apollo Money Market Fund |
14.3% |
|
7 |
Nabo Africa Money Market Fund |
14.2% |
|
8 |
Madison Money Market Fund |
14.0% |
|
9 |
AA Kenya Shillings Fund |
13.9% |
|
10 |
Co-op Money Market Fund |
13.6% |
|
11 |
Sanlam Money Market Fund |
13.6% |
|
12 |
Jubilee Money Market Fund |
13.5% |
|
13 |
Kuza Money Market fund |
13.5% |
|
14 |
GenCap Hela Imara Money Market Fund |
13.1% |
|
15 |
Old Mutual Money Market Fund |
13.1% |
|
16 |
Absa Shilling Money Market Fund |
12.5% |
|
17 |
KCB Money Market Fund |
12.2% |
|
18 |
Dry Associates Money Market Fund |
11.9% |
|
19 |
CIC Money Market Fund |
11.8% |
|
20 |
ICEA Lion Money Market Fund |
11.6% |
|
21 |
Equity Money Market Fund |
11.5% |
|
22 |
Orient Kasha Money Market Fund |
11.5% |
|
23 |
Mayfair Money Market Fund |
11.4% |
|
24 |
Mali Money Market Fund |
10.1% |
|
25 |
British-American Money Market Fund |
9.5% |
Source: Business Daily
Liquidity:
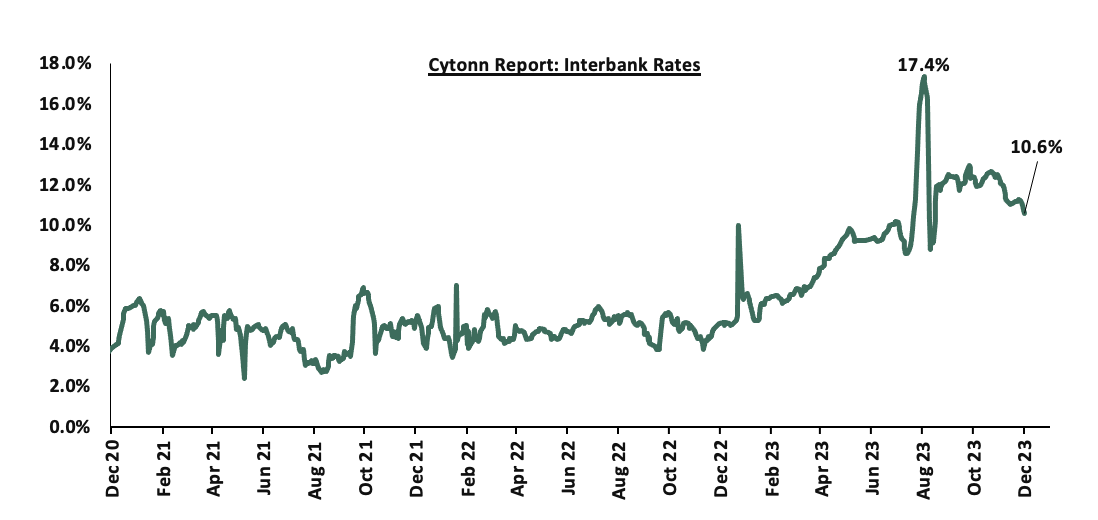
Liquidity in the money markets eased in the month of November 2023, with the average interbank rate decreasing by 0.9% points to 11.4% from 12.3% recorded the previous month. During the month of November, the average interbank volumes traded decreased by 14.3% to Kshs 18.0 bn, from Kshs 21.0 bn recorded in October. Also, during the week, liquidity in the money markets eased, with the average interbank rate decreasing to 10.6%, from 11.3% recorded the previous week, partly attributable to government payments that offset tax remittances. The average interbank volumes traded decreased by 42.3% to Kshs 13.7 bn, from Kshs 23.8 bn recorded the previous week. The chart below shows the interbank rates in the market over the years:
Kenya Eurobonds:
During the month, the yields on the Eurobonds were on a downward trajectory, with the yield on the 10-year Eurobond issued in 2018 decreasing the most by 1.8% points to 11.4% from 13.1% recorded at the end of October .2023. However, during the week, the yields on Eurobonds recorded mixed performances, with the yield on the 10-year Eurobond issued in 2014 recording the largest increase of 1.2% points to 14.1%, from 12.9%, recorded the previous week. The table below shows the summary of the performance of the Kenyan Eurobonds as of 30th November 2023;
|
Cytonn Report: Kenya Eurobonds Performance |
||||||
|
|
2014 |
2018 |
2019 |
2021 |
||
|
Tenor |
10-year issue |
10-year issue |
30-year issue |
7-year issue |
12-year issue |
12-year issue |
|
Amount Issued (USD) |
2.0 bn |
1.0 bn |
1.0 bn |
0.9 bn |
1.2 bn |
1.0 bn |
|
Years to Maturity |
0.6 |
4.3 |
24.3 |
3.6 |
8.6 |
10.6 |
|
Yields at Issue |
6.6% |
7.3% |
8.3% |
7.0% |
7.9% |
6.2% |
|
02-Jan-23 |
12.9% |
10.5% |
10.9% |
10.9% |
10.8% |
9.9% |
|
31-Oct-23 |
14.6% |
13.1% |
12.1% |
13.6% |
12.6% |
12.0% |
|
23-Nov-23 |
12.9% |
11.7% |
11.3% |
12.0% |
11.5% |
10.8% |
|
24-Nov-23 |
13.2% |
11.8% |
11.4% |
12.2% |
11.5% |
10.8% |
|
27-Nov-23 |
13.9% |
11.8% |
11.4% |
12.2% |
11.5% |
10.8% |
|
28-Nov-23 |
14.5% |
11.8% |
11.4% |
12.2% |
11.5% |
10.8% |
|
29-Nov-23 |
14.0% |
11.4% |
11.4% |
11.7% |
11.2% |
10.6% |
|
30-Nov-23 |
14.1% |
11.4% |
11.2% |
11.9% |
11.2% |
10.6% |
|
Weekly Change |
1.2% |
(0.4%) |
(0.1%) |
(0.2%) |
(0.2%) |
(0.1%) |
|
MTD Change |
(0.5%) |
(1.8%) |
(0.9%) |
(1.7%) |
(1.3%) |
(1.3%) |
|
YTD Change |
1.2% |
0.9% |
0.3% |
0.9% |
0.5% |
0.8% |
Source: Central Bank of Kenya (CBK) and National Treasury
Kenya Shilling:
During the month, the Kenya Shilling depreciated by 1.7% against the US Dollar, to close the month at Kshs 153.2, from Kshs 150.6 recorded at the end of October 2023, partly attributable to the increased US Dollar demand from importers, especially in the oil and energy sectors.
Also, during the week, the Kenya Shilling depreciated by 0.3% against the US Dollar to close at Kshs 153.2, from Kshs 152.8 recorded the previous week. On a year-to-date basis, the shilling has depreciated by 24.4% against the US Dollar, adding to the 9.0% depreciation recorded in 2022. We expect the shilling to remain under pressure in 2023 as a result of:
- An ever-present current account deficit, which came at 3.7% of GDP in Q2’2023 from 6.0% recorded in a similar period last year,
- The need for government debt servicing, continues to put pressure on forex reserves given that 67.1% of Kenya’s external debt is US Dollar denominated as of June 2023, and,
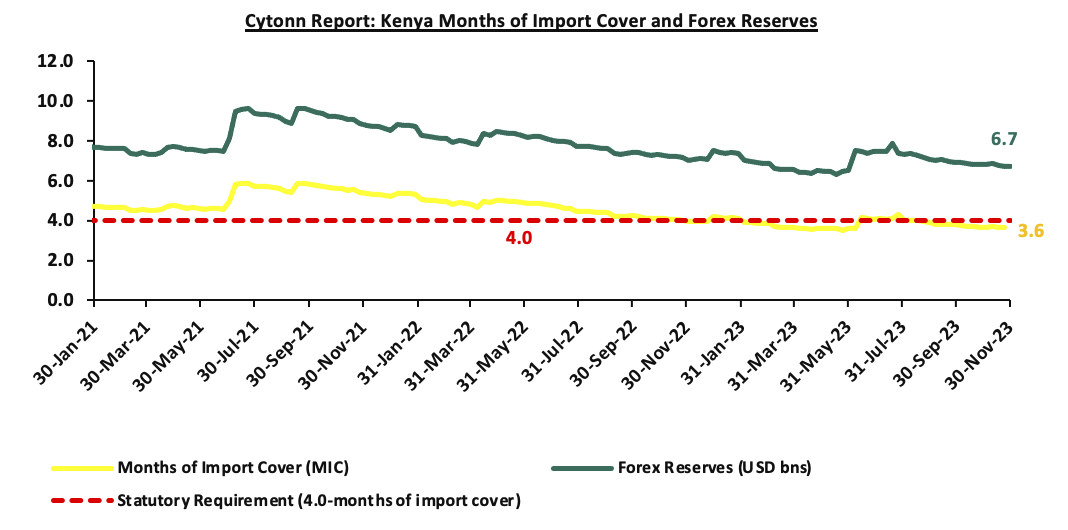
- Dwindling forex reserves are currently at USD 6.7 bn (equivalent to 3.6 months of import cover), which is below the statutory requirement of maintaining at least 4.0 months of import cover.
The shilling is however expected to be supported by:
- Diaspora remittances standing at a cumulative USD 3,462.4 mn as of October 2023, 4.1%% higher than the USD 3,325.1 mn recorded over the same period in 2022, which has continued to cushion the shilling against further depreciation. In the October 2023 diaspora remittances figures, North America remained the largest source of remittances to Kenya accounting for 57.0% in the period, and,
- The tourism inflow receipts which came in at Kshs 268.1 bn in 2022, a significant 82.9% increase from Kshs 146.5 bn inflow receipts recorded in 2021.
The chart below summarizes the evolution of Kenya’s months of import cover over the years:
Weekly Highlights:
- Inflation: The y/y inflation in November 2023 decreased marginally by 0.1% points to 6.8%, from the 6.9% recorded in October 2023. This was in line with our projections to within a range of 6.8% to 7.0%. The headline inflation in November 2023 was majorly driven by increase in prices of commodities in the following categories, transport; housing, water, electricity, gas and other fuels, and food and non-alcoholic beverages by 13.6%, 8.5% and 7.6%, respectively. The table below shows a summary of both the year on year and month on month commodity indices performance:
|
Cytonn Report: Major Inflation Changes – 2023 |
|||
|
Broad Commodity Group |
Price change m/m (November-2023/October-2023) |
Price change y/y (November-2022/November-2023) |
Reason |
|
Food and Non-Alcoholic Beverages |
0.4% |
7.6% |
The m/m increase was mainly driven by the increase in prices of commodities such as tomatoes, oranges and wheat flour-white by 17.7%, 3.8%, and 3.3%, respectively. However, the increase was weighed down by decrease in prices of potatoes, maize flour- sifted and cabbages by 7.1%, 6.5%, and 3.6%, respectively. |
|
Housing, Water, Electricity, Gas and Other Fuel |
0.2% |
8.5% |
The m/m performance was mainly driven by the increase in prices of 13.0kg gas/LPG by 1.1%. However, there was a decrease in prices of Electricity of 200kWh and 50kWh by 1.0% and 1.2% respectively. |
|
Transport cost |
(0.1)% |
13.6% |
The m/m decrease in transport Index was mainly due to decrease in prices of nationwide bus fares on the back of the decline in the prices of diesel by 1.0% with the Petrol prices remaining unchanged. |
|
Overall Inflation |
0.2% |
6.8% |
The m/m decrease was mainly driven by 0.1% decrease in transport costs. |
Notably, the overall headline inflation remained within the Central Bank of Kenya (CBK) target range of 2.5% to 7.5% for the fifth consecutive month. The decrease in headline inflation in November 2023 comes amid the recent decline in the Diesel and Kerosene prices which decreased by 1.9% and 1.0% to Kshs 203.5 and Kshs 203.1 per litre respectively, for the period between 15th November 2023 to 14th December 2023. The chart below shows the inflation rates for the past 5 years:
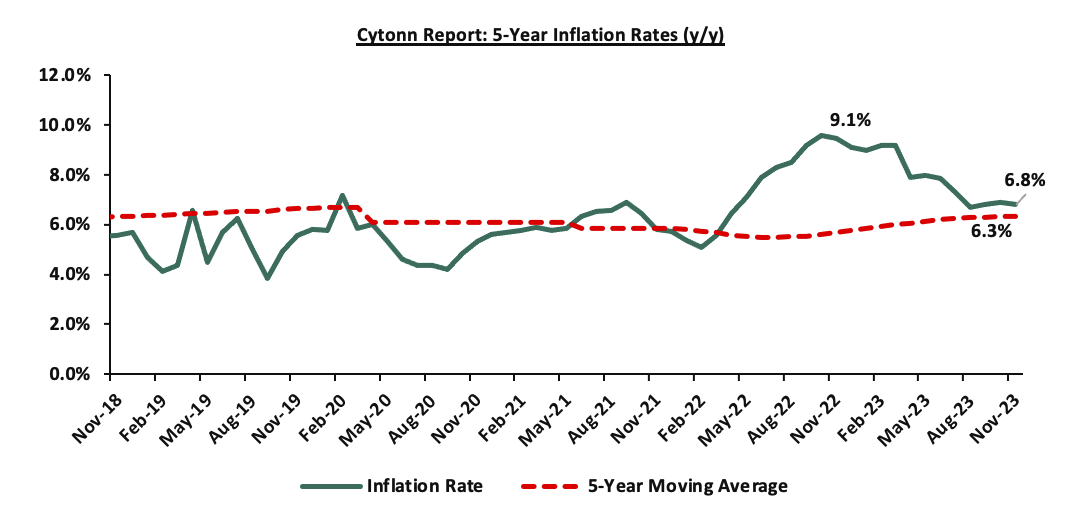
Despite the easing of year-on-year inflation, the risk of an elevation of inflation remains high partly on the back of increased government spending following the provisions in the recently approved supplementary budget which saw the government revise its expenditure upwards by 5.0% to kshs 3.9 tn, from kshs 3.7 tn at the beginning of th FY’2023/2024. Additionally, the sustained depreciation of the Kenyan shilling against major currencies is also expected to underpin inflationary pressures in the country as manufacturers pass on the high cost of importation to consumers through hikes in consumer prices in order to maintain their profit margins. However, we expect the measures taken by the government to stabilize fuel prices as well as subsidize major inputs of agricultural production such as fertilizers to lower the cost of production and support the easing of inflation in the long-term.
Monthly Highlights:
- The Kenya National Bureau of Statistics (KNBS) released the year-on-year inflation highlighting that the inflation rate in the month of October 2023 increased to 6.9%, from the 6.8% inflation rate recorded in the month of September 2023, marking the fourth consecutive month that the inflation has remained within the CBK target range of 2.5%-7.5%. Please read our Cytonn Monthly – October 2023
- Stanbic Bank released its Monthly Purchasing Manager's Index (PMI), highlighting that the index for the month of October 2023 deteriorated further, coming in at 46.2, down from 47.8 in September 2023, signaling a stronger downturn of the business environment during the first month of Q4’2023. This was on the back of persistent inflationary pressure mainly resulting from the aggressive depreciation of the Kenya Shilling, as well as increased fuel and food prices. Please read our Cytonn Monthly – October 2023
- The International Monetary Fund (IMF) reached a staff-level agreement with the Kenyan authorities for the sixth reviews of Kenya’s economic program supported by the IMF’s Extended Fund Facility (EFF) and Extended Credit Facility (ECF), and the first Review under the Resilience Sustainability Facility (RSF). These arrangements were initiated to support Kenya's sustained economic growth, macroeconomic stability, and efforts to address climate change impacts. Notably, the discussions took into account Kenya’s request for an augmentation under the EFF/ECF arrangement and the RSF, leading to a potential total commitment of approximately USD 4.4 bn (Kshs. 670.1 bn) over the program's duration. Following the completion of the review by the IMF Executive Board, Kenya stands to gain immediate access to USD 682.3 mn (Kshs. 103.9 bn), marking significant financial support toward the nation's economic programs. Please see our Cytonn weekly #46/2023, and,
- The Energy and Petroleum Regulatory Authority (EPRA) released their monthly statement on the maximum retail fuel prices in Kenya, effective from 15th November 2023 to 14th December 2023. Notably, the price for super petrol remained unchanged from the October price and will retail at Kshs 217.4 per litre. However, fuel prices for Diesel and Kerosene decreased by 1.9% and 1.0% to Kshs 203.5 and Kshs 203.1 respectively, from Kshs 205.5 and Kshs 205.1 per litre for Diesel and Kerosene respectively. Please see our Cytonn weekly #46/2023.
Rates in the Fixed Income market have been on an upward trend given the continued high demand for cash by the government and the occasional liquidity tightness in the money market. The government is 4.1% behind of its prorated net domestic borrowing target of Kshs 135.4. bn, having a net borrowing position of Kshs 129.8 bn of the domestic net borrowing target of Kshs 316.0 bn for the FY’2023/2024. Therefore, we expect minimal upward readjustment of the yield curve in the short and medium term, with the government looking to maintain the slight fiscal surplus through the domestic market, our view is that investors should be biased towards short-term fixed-income securities to reduce duration risk.
Market Performance:
During the month of November 2023, the equities market was on an upward trajectory, with NASI gaining the most having gained 3.8%, while NSE 20, NSE 25 and NSE 10 gained by 2.4%, 0.4% and 0.2% respectively. The equities market performance was driven by gains recorded by large-cap stocks such as Bamburi, Safaricom and KCB of 53.1%, 12.9% and 7.7%respectively. The gains were, however, weighed down by losses recorded by large cap stocks such as EABL, Stanbic and Absa of 10.7%, 5.8% and 3.9% respectively.
During the week, the equities market recorded mixed performance, with NSE 20, NSE 25 and NSE 10 declining by 1.0%, 0.8% and 0.5% respectively, while NASI gained marginally by 0.03%, taking the YTD performance to losses of 27.5%, 10.8%, and 23.6% for NASI, NSE 20, and NSE 25, respectively. The equities market performance was mainly driven by losses recorded by large-cap stocks such as Stanbic, ABSA and KCB of 6.6%, 5.6% and 4.5%, respectively. However, the losses were mitigated by gains in stocks such as Safaricom, NCBA and Bamburi of 2.6%, 2.4% and 0.1% respectively.
Equities turnover decreased by 4.9% in the month of November to USD 26.9 mn, from USD 28.2 mn recorded in October 2023. Foreign investors remained net sellers, with a net selling position of USD 3.0 mn, from a net selling position of USD 2.9 mn recorded in October.
During the week, equities turnover increased by 25.5% to USD 7.6 mn from USD 6.1 mn recorded the previous week, taking the YTD total turnover to USD 629.5 mn. Foreign investors became net sellers for the first time in two weeks with a net selling position of USD 0.5 mn, from a net buying position of USD 0.3 mn recorded the previous week, taking the YTD foreign net selling position to USD 288.2 mn.
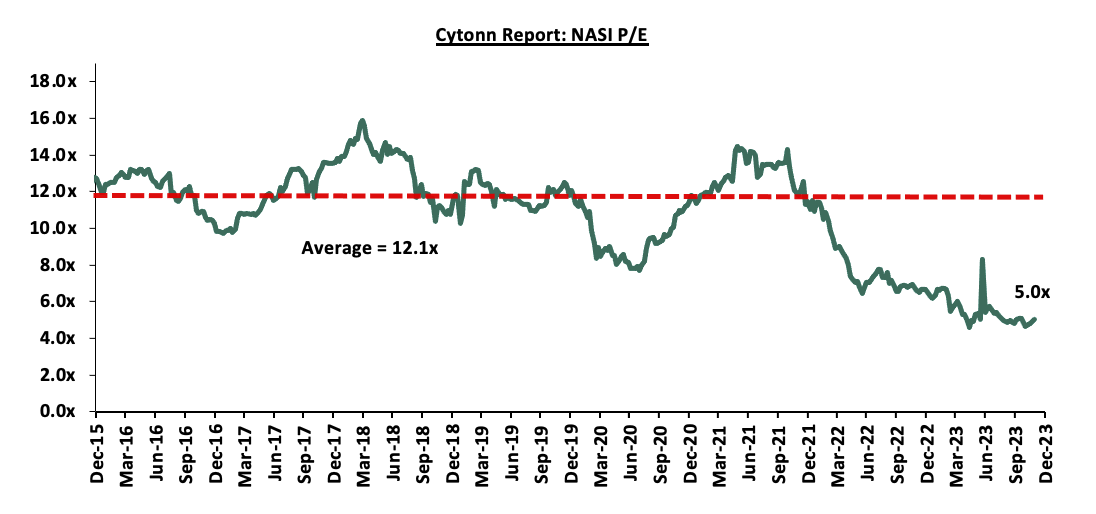
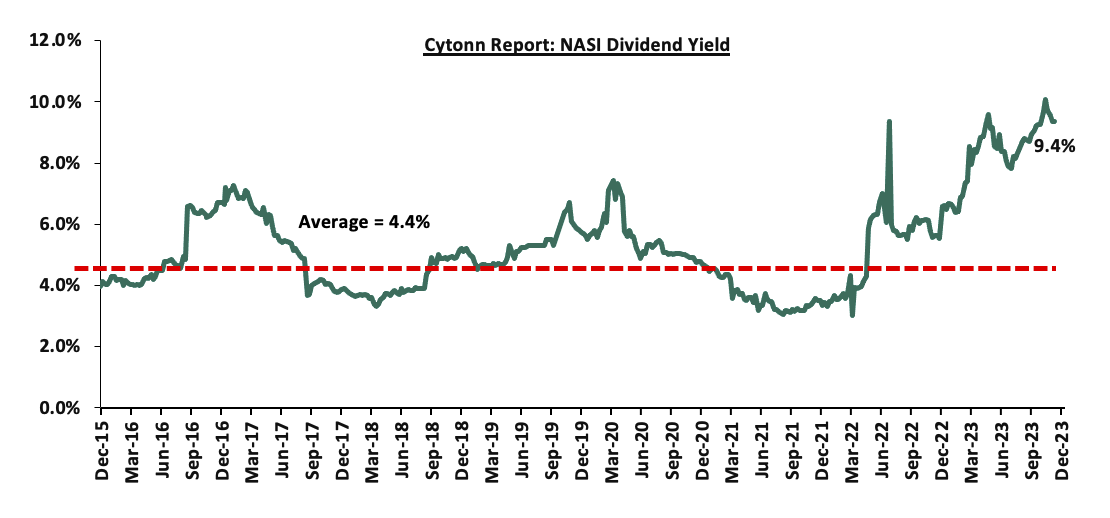
The market is currently trading at a price to earnings ratio (P/E) of 5.0x, 58.5% below the historical average of 12.2x. The dividend yield stands at 9.4%, 5.0% points above the historical average of 4.4%. Key to note, NASI’s PEG ratio currently stands at 0.6x, an indication that the market is undervalued relative to its future growth. A PEG ratio greater than 1.0x indicates the market is overvalued while a PEG ratio less than 1.0x indicates that the market is undervalued. The charts below indicate the historical P/E and dividend yields of the market;
Universe of coverage:
|
Cytonn Report: Equities Universe of Coverage |
|||||||||||
|
Company |
Price as at 24/11/2023 |
Price as at 01/12/2023 |
w/w change |
m/m change |
YTD Change |
Year Open 2023 |
Target Price* |
Dividend Yield |
Upside/ Downside** |
P/TBv Multiple |
Recommendation |
|
KCB Group*** |
19.9 |
19.0 |
(4.5%) |
7.7% |
(50.5%) |
38.4 |
30.7 |
10.5% |
72.1% |
0.3x |
Buy |
|
Liberty Holdings |
3.5 |
3.9 |
11.7% |
(6.3%) |
(22.4%) |
5.0 |
5.9 |
0.0% |
51.4% |
0.3x |
Buy |
|
Jubilee Holdings |
180.0 |
182.0 |
1.1% |
0.0% |
(8.4%) |
1.9 |
2.5 |
6.6% |
49.8% |
0.3x |
Buy |
|
Kenya Reinsurance |
1.7 |
1.8 |
7.1% |
1.1% |
(2.7%) |
198.8 |
260.7 |
11.0% |
48.9% |
0.1x |
Buy |
|
ABSA Bank*** |
11.6 |
11.0 |
(5.6%) |
(3.9%) |
(10.2%) |
9.6 |
10.3 |
12.3% |
47.5% |
0.9x |
Buy |
|
I&M Group*** |
17.5 |
17.4 |
(0.9%) |
2.3% |
1.8% |
12.2 |
14.8 |
13.0% |
38.6% |
0.4x |
Buy |
|
Diamond Trust Bank*** |
46.0 |
45.8 |
(0.4%) |
(2.3%) |
(8.2%) |
49.9 |
58.1 |
10.9% |
37.9% |
0.2x |
Buy |
|
Sanlam |
6.8 |
7.5 |
10.0% |
(2.0%) |
(21.9%) |
17.1 |
21.8 |
0.0% |
37.6% |
2.1x |
Buy |
|
Co-op Bank*** |
11.5 |
11.4 |
(0.9%) |
(2.6%) |
(5.8%) |
12.1 |
13.5 |
13.2% |
31.6% |
0.5x |
Buy |
|
Stanbic Holdings |
109.3 |
102.0 |
(6.6%) |
(5.8%) |
0.0% |
39.0 |
43.2 |
12.4% |
28.2% |
0.7x |
Buy |
|
Equity Group*** |
38.3 |
38.0 |
(0.8%) |
(2.8%) |
(15.6%) |
45.1 |
42.6 |
10.5% |
22.6% |
0.8x |
Buy |
|
Standard Chartered*** |
158.5 |
158.5 |
0.0% |
1.0% |
9.3% |
102.0 |
118.2 |
13.9% |
21.7% |
1.1x |
Buy |
|
NCBA*** |
38.1 |
39.0 |
2.4% |
0.9% |
0.1% |
145.0 |
170.9 |
10.9% |
21.7% |
0.8x |
Buy |
|
Britam |
5.1 |
5.1 |
(0.8%) |
4.1% |
(1.9%) |
5.2 |
6.0 |
0.0% |
17.1% |
0.7x |
Accumulate |
|
CIC Group |
2.2 |
2.4 |
10.0% |
22.5% |
26.7% |
1.9 |
2.5 |
5.4% |
8.7% |
0.8x |
Hold |
|
HF Group |
4.0 |
3.9 |
(0.3%) |
(5.3%) |
25.1% |
3.2 |
3.2 |
0.0% |
(18.8%) |
0.2x |
Sell |
|
Target Price as per Cytonn Analyst estimates **Upside/ (Downside) is adjusted for Dividend Yield ***For Disclosure, these are stocks in which Cytonn and/or its affiliates are invested in |
|||||||||||
Monthly Highlights:
Earnings Releases
- DTB-K Group Q3’2023 Financial Performance
During the week, DTB-K released their Q3’2023 financial results. Below is a summary of the performance;
|
Balance Sheet Items (Kshs bn) |
Q3'2022 |
Q3'2023 |
y/y change |
|
Government Securities |
135.1 |
129.0 |
(4.5%) |
|
Net Loans and Advances |
243.7 |
289.1 |
18.7% |
|
Total Assets |
507.5 |
598.0 |
17.8% |
|
Customer Deposits |
359.7 |
457.7 |
27.3% |
|
Deposit Per Branch |
2.8 |
3.4 |
22.5% |
|
Total Liabilities |
429.5 |
515.5 |
20.0% |
|
Shareholders’ Funds |
70.1 |
71.8 |
2.4% |
|
Balance Sheet Ratios |
Q3'2022 |
Q3'2023 |
y/y change |
|
Loan to Deposit Ratio |
67.7% |
63.2% |
(4.6%) |
|
Government Securities to Deposit ratio |
37.5% |
28.2% |
(9.4%) |
|
Return on average equity |
8.0% |
10.0% |
2.0% |
|
Return on average assets |
1.2% |
1.3% |
0.1% |
|
Income Statement (Kshs bn) |
Q3'2022 |
Q3'2023 |
y/y change |
|
Net Interest Income |
16.8 |
20.1 |
19.6% |
|
Non-Interest Income |
6.9 |
9.2 |
33.9% |
|
Total Operating income |
23.7 |
29.3 |
23.7% |
|
Loan Loss provision |
4.0 |
6.0 |
50.1% |
|
Total Operating expenses |
14.7 |
20.7 |
40.5% |
|
Profit before tax |
8.9 |
8.7 |
(2.1%) |
|
Profit after tax |
6.3 |
6.6 |
5.2% |
|
Core EPS |
22.5 |
23.6 |
5.2% |
|
Income Statement Ratios |
Q3'2022 |
Q3'2023 |
% point change |
|
Yield from interest-earning assets |
9.7% |
10.3% |
0.6% |
|
Cost of funding |
4.1% |
5.1% |
1.0% |
|
Net Interest Spread |
5.6% |
5.2% |
(0.4%) |
|
Net Interest Income as % of operating income |
71.0% |
68.6% |
(2.4%) |
|
Non-Funded Income as a % of operating income |
29.0% |
31.4% |
2.4% |
|
Cost to Income |
62.2% |
70.6% |
8.4% |
|
CIR without provisions |
45.3% |
50.1% |
4.8% |
|
Cost to Assets |
4.8% |
5.1% |
0.3% |
|
Net Interest Margin |
5.7% |
5.4% |
(0.2%) |
|
Capital Adequacy Ratios |
Q3'2022 |
Q3'2023 |
% points change |
|
Core Capital/Total deposit Liabilities |
21.9% |
19.7% |
(2.2%) |
|
Minimum Statutory ratio |
8.0% |
8.0% |
|
|
Excess |
13.9% |
11.7% |
(2.2%) |
|
Core Capital/Total Risk Weighted Assets |
20.0% |
18.6% |
(1.4%) |
|
Minimum Statutory ratio |
10.5% |
10.5% |
|
|
Excess |
9.5% |
8.1% |
(1.4%) |
|
Total Capital/Total Risk Weighted Assets |
21.1% |
19.2% |
(1.9%) |
|
Minimum Statutory ratio |
14.5% |
14.5% |
|
|
Excess |
6.6% |
4.7% |
(1.9%) |
|
Liquidity Ratio |
60.5% |
60.5% |
0.0% |
|
Minimum Statutory ratio |
20.0% |
20.0% |
|
|
Excess |
40.5% |
40.5% |
0.0% |
Key Take-Outs:
- Earnings growth - Core earnings per share (EPS) grew by 5.2% to Kush’s 23.6, from Kshs 22.5 in Q3’2022, driven by the 23.7% growth in total operating income to Kshs 29.3 bn, from Kshs 23.7 bn in Q3’2022, and,
- Asset quality Improvement- The bank’s asset quality improved as evidenced by the NPL ratio decreasing to 12.6% in Q3’2023 from 12.7% in Q3’2022, attributable to 17.4% increase in Gross non-performing loans to Kshs 38.7 bn, from Kshs 33.0 bn in Q3’2022, compared to the higher 19.1% increase in gross loans to Kshs 308.0 bn, from Kshs 258.6 bn recorded in Q3’2022.
For a more detailed analysis, please see the DTB-K Q3’2023 Earnings Note.
- HF Group Q3’2023 Financial Performance
During the week, HF Group released their Q3’2023 financial results. Below is a summary of the performance;
|
Balance Sheet Items (Kshs bn) |
Q3'2022 |
Q3'2023 |
y/y change |
|
Net loans |
35.2 |
38.5 |
9.3% |
|
Government Securities |
8.2 |
9.0 |
10.9% |
|
Total Assets |
55.1 |
60.7 |
10.1% |
|
Customer Deposits |
38.8 |
43.8 |
12.9% |
|
Deposits Per Branch |
1.8 |
1.7 |
(4.5%) |
|
Total Liabilities |
47.2 |
52.0 |
10.2% |
|
Shareholder's Funds |
7.9 |
8.7 |
9.6% |
|
Balance Sheet Ratios |
Q3'2022 |
Q3'2023 |
% y/y change |
|
Loan to deposit ratio |
90.7% |
87.8% |
(2.9%) |
|
Government Securities to deposit ratio |
21.0% |
20.6% |
(0.4%) |
|
Return on Average Equity |
(0.6%) |
5.3% |
5.9% |
|
Return on Average Assets |
(0.1%) |
0.8% |
0.9% |
|
Income Statement (Kshs bn) |
Q3'2022 |
Q3'2023 |
y/y change |
|
Net Interest Income |
1.6 |
1.9 |
21.4% |
|
Net non-Interest Income |
0.75 |
0.91 |
20.6% |
|
Total Operating income |
2.3 |
2.8 |
21.1% |
|
Loan Loss provision |
(0.1) |
(0.2) |
60.2% |
|
Total Operating expenses |
(2.2) |
(2.6) |
13.6% |
|
Profit before tax |
0.1 |
0.3 |
256.2% |
|
Profit after tax |
0.06 |
0.24 |
283.9% |
|
Core EPS |
0.2 |
0.6 |
283.9% |
|
Income Statement Ratios |
Q3'2022 |
Q3'2023 |
y/y change |
|
Yield from interest-earning assets |
9.7% |
10.6% |
0.9% |
|
Cost of funding |
4.9% |
5.3% |
0.4% |
|
Net Interest Spread |
4.8% |
5.3% |
0.6% |
|
Net Interest Margin |
4.7% |
5.4% |
0.7% |
|
Cost of Risk |
6.4% |
8.4% |
2.1% |
|
Net Interest Income as % of operating income |
67.6% |
67.8% |
0.1% |
|
Non-Funded Income as a % of operating income |
32.4% |
32.2% |
(0.1%) |
|
Cost to Income Ratio |
96.7% |
90.7% |
(6.0%) |
|
Capital Adequacy Ratios |
Q3'2022 |
Q3'2023 |
% points change |
|
Core Capital/Total Liabilities |
7.8% |
5.1% |
(2.7%) |
|
Minimum Statutory ratio |
8.0% |
8.0% |
0.0% |
|
Excess |
(0.2%) |
(2.9%) |
(2.7%) |
|
Core Capital/Total Risk Weighted Assets |
8.2% |
5.8% |
(2.4%) |
|
Minimum Statutory ratio |
10.5% |
10.5% |
0.0% |
|
Excess |
(2.4%) |
(4.7%) |
(2.4%) |
|
Total Capital/Total Risk Weighted Assets |
12.2% |
9.6% |
(2.6%) |
|
Minimum Statutory ratio |
14.5% |
14.5% |
0.0% |
|
Excess |
(2.3%) |
(4.9%) |
(2.6%) |
|
Liquidity Ratio |
23.5% |
25.1% |
1.6% |
|
Minimum Statutory ratio |
20.0% |
20.0% |
0.0% |
|
Excess |
3.5% |
5.1% |
1.6% |
Key Take-Outs:
- Strong earnings growth - Core earnings per share (EPS) grew by 283.9% to Kshs 0.6, from Kshs 0.2 in Q3’2022, mainly driven by the 21.1% growth in total operating income to Kshs 2.8 bn, from Kshs 2.3 bn in Q3’2022,
- Asset quality deterioration – The bank’s gross NPL ratio increased to 22.8% in Q3’2023 from 20.3% in Q3’2022, attributable to the faster growth of 24.9% in Gross non-performing loans to Kshs 10.6 bn, from Kshs 8.5 bn in Q3’2022, which outpaced the 10.9% increase in gross loans to Kshs 46.3 bn, from Kshs 41.7 bn recorded in Q3’2022, and,
- Sustained Efficiency – Cost to Income Ratio (CIR) improved by 6.0% points to 90.7%, from 96.7% in Q3’2022, owing to the 21.1% increase in total operating income to Kshs 2.8 bn from Kshs 2.3 bn in Q3’2022, which outpaced the 13.6% increase in total operating expenses to Kshs 2.6 bn, from Kshs 2.2 bn in Q3’2022. Key to note, this is the third consecutive quarter in the current financial year that HF Group’s total operating expenses have been lower than its total operating income, evidenced by a Cost to Income ratio of below 100.0%.
For a more detailed analysis, please see the HF Group Q3’2023 Earnings Note.
- KCB Group Q3’2023 Financial Performance
During the month, KCB Group released their Q3’2023 financial results. Below is a summary of the performance;
|
Balance Sheet Items (Kshs bn) |
Q3'2022 |
Q3'2023 |
y/y change |
|
Government Securities |
236.8 |
325.6 |
37.5% |
|
Net Loans and Advances |
758.8 |
1,047.9 |
38.1% |
|
Total Assets |
1,276.3 |
2,099.5 |
64.5% |
|
Customer Deposits |
922.3 |
1,656.4 |
79.6% |
|
Total Liabilities |
1,086.1 |
1,873.4 |
72.5% |
|
Shareholders’ Funds |
187.8 |
218.8 |
16.5% |
|
Balance Sheet Ratios |
Q3'2022 |
Q3'2023 |
% y/y change |
|
Loan to Deposit Ratio |
82.3% |
63.3% |
(19.0%) |
|
Government Securities to Deposit Ratio |
25.7% |
19.7% |
(6.0%) |
|
Return on average equity |
22.6% |
20.2% |
(2.4%) |
|
Return on average assets |
3.3% |
2.4% |
(0.9%) |
|
Income Statement (Kshs bn) |
Q3'2022 |
Q3'2023 |
y/y change |
|
Net Interest Income |
61.6 |
74.9 |
21.6% |
|
Net non-Interest Income |
30.6 |
42.4 |
38.7% |
|
Total Operating income |
92.1 |
117.3 |
27.3% |
|
Loan Loss provision |
(7.3) |
(15.8) |
118.1% |
|
Total Operating expenses |
(48.8) |
(76.7) |
57.0% |
|
Profit before tax |
43.3 |
40.6 |
(6.3%) |
|
Profit after tax |
30.6 |
30.7 |
0.4% |
|
Core EPS (Kshs) |
9.52 |
9.56 |
0.4% |
|
Income Statement Ratios |
Q3'2022 |
Q3'2023 |
y/y change |
|
Yield from interest-earning assets |
10.9% |
10.1% |
(0.8%) |
|
Cost of funding |
3.0% |
3.5% |
0.4% |
|
Net Interest Spread |
7.9% |
6.6% |
(1.3%) |
|
Net Interest Margin |
8.1% |
6.8% |
(1.3%) |
|
Cost of Risk |
7.9% |
13.5% |
5.6% |
|
Net Interest Income as % of operating income |
66.8% |
63.9% |
(3.0%) |
|
Non-Funded Income as a % of operating income |
33.2% |
36.1% |
3.0% |
|
Cost to Income Ratio |
53.0% |
65.4% |
12.4% |
|
Capital Adequacy Ratios |
Q3'2022 |
Q3'2023 |
% points change |
|
Core Capital/Total Liabilities |
15.6% |
13.0% |
(2.6%) |
|
Minimum Statutory ratio |
8.0% |
8.0% |
0.0% |
|
Excess |
7.6% |
5.0% |
(2.6%) |
|
Core Capital/Total Risk Weighted Assets |
14.5% |
14.5% |
0.0% |
|
Minimum Statutory ratio |
10.5% |
10.5% |
0.0% |
|
Excess |
4.0% |
4.0% |
0.0% |
|
Total Capital/Total Risk Weighted Assets |
18.1% |
17.8% |
(0.3%) |
|
Minimum Statutory ratio |
14.5% |
14.5% |
0.0% |
|
Excess |
3.6% |
3.3% |
(0.3%) |
|
Liquidity Ratio |
38.5% |
50.3% |
11.8% |
|
Minimum Statutory ratio |
20.0% |
20.0% |
0.0% |
|
Excess |
18.5% |
30.3% |
11.8% |
Key Take-Outs:
- Increase in earnings - Core earnings per share (EPS) increased marginally by 0.4% to Kshs 9.6, from Kshs 9.5 in Q3’2022, driven by the 27.3% growth in total operating income to Kshs 117.3 bn, from Kshs 92.1 bn in Q3’2022, which outweighed the 57.0% growth in total operating expenses to Kshs 76.7 bn, from kshs 48.8 bn in Q3’2022,
- Increased Provisioning – On the back of high credit risk occasioned by the deteriorated business environment, the bank increased its provisions holdings to cover for the anticipated losses in the future, with its provisions increasing by 47.9% to Kshs 96.7 bn from Kshs 65.4 bn recorded in Q3’2022,
- Improved Lending – The Group’s loan book increased by 38.1% to Kshs 1,047.9 bn, from Kshs 758.8 bn in Q3’2022, which slightly outpaced the 37.5% growth in government securities to Kshs 325.6 bn, from Kshs 236.8 bn in Q3’2022, highlighting the Group’s strategy to increase lending while at the same time managing its non-performing loan book, and,
- Revenue Diversification – The Group’s Non-Funded income increased by 38.7% to Kshs 42.4bn in Q3’2023, from Kshs 30.6 bn in Q3’2022, which resulted to a shift in revenue mix to 64:36 from 67:33 for the funded to non-funded income in Q3’2022 following the 38.7% growth in NFI which outpaced the 21.6% growth in funded income.
For a more detailed analysis, please see the KCB Group Q3’2023 Earnings Note.
- ABSA Bank Kenya Q3’2023 Financial Performance
During the month, ABSA Bank Kenya released their Q3’2023 financial results. Below is a summary of the performance;
|
Balance Sheet Items (Kshs bn) |
Q3'2022 |
Q3'2023 |
y/y change |
|
Government Securities |
92.2 |
77.7 |
(15.7%) |
|
Net Loans and Advances |
289.4 |
330.9 |
14.3% |
|
Total Assets |
481.3 |
504.9 |
4.9% |
|
Customer Deposits |
281.1 |
354.3 |
26.1% |
|
Deposits per branch |
3.3 |
4.2 |
24.6% |
|
Total Liabilities |
421.1 |
439.6 |
4.4% |
|
Shareholders’ Funds |
60.3 |
65.3 |
8.4% |
|
Balance Sheet Ratios |
Q3'2022 |
Q3'2023 |
% y/y change |
|
Loan to Deposit Ratio |
103.0% |
93.4% |
(9.6%) |
|
Govt Securities to Deposit ratio |
32.8% |
21.9% |
(10.9%) |
|
Return on average equity |
23.2% |
25.8% |
2.5% |
|
Return on average assets |
3.0% |
3.3% |
0.3% |
|
Income Statement (Kshs bn) |
Q3'2022 |
Q3'2023 |
y/y change |
|
Net Interest Income |
23.3 |
29.3 |
26.0% |
|
Net non-Interest Income |
10.2 |
10.8 |
6.4% |
|
Total Operating income |
33.4 |
40.2 |
20.0% |
|
Loan Loss provision |
(5.0) |
(6.8) |
34.3% |
|
Total Operating expenses |
(18.3) |
(22.3) |
21.9% |
|
Profit before tax |
15.1 |
17.8 |
17.8% |
|
Profit after tax |
10.7 |
12.3 |
14.9% |
|
Core EPS (Kshs) |
2.0 |
2.3 |
14.9% |
|
Income Statement Ratios |
Q3'2022 |
Q3'2023 |
% y/y change |
|
Yield from interest-earning assets |
9.6% |
11.7% |
2.1% |
|
Cost of funding |
2.8% |
3.7% |
0.9% |
|
Net Interest Spread |
2.1% |
2.7% |
0.6% |
|
Net Interest Margin |
7.6% |
8.8% |
1.3% |
|
Cost of Risk |
15.0% |
16.8% |
1.8% |
|
Net Interest Income as % of operating income |
69.6% |
73.0% |
3.5% |
|
Non-Funded Income as a % of operating income |
30.4% |
27.0% |
(3.5%) |
|
Cost to Income Ratio |
54.7% |
55.6% |
0.8% |
|
Capital Adequacy Ratios |
Q3'2022 |
Q3'2023 |
% y/y change |
|
Core Capital/Total Liabilities |
18.8% |
16.5% |
(2.3%) |
|
Minimum Statutory ratio |
8.0% |
8.0% |
0.0% |
|
Excess |
10.8% |
8.5% |
(2.3%) |
|
Core Capital/Total Risk Weighted Assets |
13.8% |
13.4% |
(0.4%) |
|
Minimum Statutory ratio |
10.5% |
10.5% |
0.0% |
|
Excess |
3.3% |
2.9% |
(0.4%) |
|
Total Capital/Total Risk Weighted Assets |
16.2% |
17.7% |
1.5% |
|
Minimum Statutory ratio |
14.5% |
14.5% |
0.0% |
|
Excess |
1.7% |
3.2% |
1.5% |
|
Liquidity Ratio |
25.8% |
29.8% |
4.0% |
|
Minimum Statutory ratio |
20.0% |
20.0% |
0.0% |
|
Excess |
5.8% |
9.8% |
4.0% |
Key Take-Outs:
- Increased earnings - Core earnings per share (EPS) increased by 14.9% to Kshs 2.3, from Kshs 2.0 in Q3’2022, driven by the 20.0% growth in total operating income to Kshs 40.2 bn, from Kshs 33.4 bn in Q3’2022, which outweighed the 21.9% growth in total operating expenses to Kshs 22.3 bn, from Kshs 18.3 bn in Q3’2022,
- Increased Provisioning – On the back of high credit risk occasioned by the deteriorated business environment, the bank increased its provisions holdings to cover for the anticipated losses in the future, with its provisions increasing by 34.3% to Kshs 6.8 bn from Kshs 5.0 bn recorded in Q3’2022, and,
- Improved Lending – The Group’s loan book increased by 14.3% to Kshs 330.9 bn, from Kshs 289.4 bn in Q3’2022, which outweighed the 23.8% decline investment in government securities to Kshs 106.6 bn from Kshs 139.8 bn in Q3’2022, highlighting the Group’s strategy to increase lending while shifting in its asset allocation strategy.
For a more detailed analysis, please see the ABSA Bank Q3’2023 Earnings Note.
- I&M Group Q3’2023 Financial Performance
During the month, I&M Group released their Q3’2023 financial results. Below is a summary of the performance;
|
Balance Sheet Items (Kshs bn) |
Q3'2022 |
Q3'2023 |
y/y change |
|
Government Securities |
73.9 |
84.6 |
14.6% |
|
Net Loans and Advances |
231.2 |
287.3 |
24.3% |
|
Total Assets |
428.7 |
544.1 |
26.9% |
|
Customer Deposits |
308.0 |
402.4 |
30.6% |
|
Total Liabilities |
355.2 |
458.8 |
29.2% |
|
Shareholders’ Funds |
68.4 |
79.1 |
15.6% |
|
Balance Sheet Ratios |
Q3'2022 |
Q3'2023 |
% y/y change |
|
Loan to Deposit Ratio |
75.1% |
71.4% |
(3.7%) |
|
Government Securities to Deposit Ratio |
24.0% |
21.0% |
(2.9%) |
|
Return on average equity |
25.9% |
21.0% |
(4.8%) |
|
Return on average assets |
13.9% |
15.9% |
2.0% |
|
Income Statement (Kshs bn) |
Q3'2022 |
Q3'2023 |
y/y change |
|
Net Interest Income |
16.2 |
19.1 |
18.4% |
|
Net non-Interest Income |
8.8 |
10.7 |
21.2% |
|
Total Operating income |
25.0 |
29.9 |
19.4% |
|
Loan Loss provision |
(3.6) |
(4.6) |
28.3% |
|
Total Operating expenses |
(14.9) |
(19.2) |
28.6% |
|
Profit before tax |
10.43 |
11.37 |
9.0% |
|
Profit after tax |
7.18 |
8.20 |
14.3% |
|
Core EPS (Kshs) |
4.3 |
5.0 |
14.3% |
|
Income Statement Ratios |
Q3'2022 |
Q3'2023 |
y/y change |
|
Yield from interest-earning assets |
10.5% |
10.7% |
0.2% |
|
Cost of funding |
4.2% |
4.7% |
0.5% |
|
Net Interest Margin |
6.6% |
6.2% |
(0.4%) |
|
Net Interest Income as % of operating income |
64.6% |
64.1% |
(0.5%) |
|
Non-Funded Income as a % of operating income |
35.4% |
35.9% |
0.5% |
|
Cost to Income Ratio |
59.7% |
64.3% |
4.6% |
|
CIR without LLP |
45.3% |
48.8% |
3.5% |
|
Cost to Assets |
2.6% |
2.7% |
0.04% |
|
Capital Adequacy Ratios |
Q3'2022 |
Q3'2023 |
% points change |
|
Core Capital/Total Liabilities |
20.7% |
16.5% |
(4.2%) |
|
Minimum Statutory ratio |
8.0% |
8.0% |
0.0% |
|
Excess |
12.7% |
8.5% |
(4.2%) |
|
Core Capital/Total Risk Weighted Assets |
15.3% |
13.0% |
(2.3%) |
|
Minimum Statutory ratio |
10.5% |
10.5% |
0.0% |
|
Excess |
4.8% |
2.5% |
(2.3%) |
|
Total Capital/Total Risk Weighted Assets |
20.1% |
17.7% |
(2.4%) |
|
Minimum Statutory ratio |
14.5% |
14.5% |
0.0% |
|
Excess |
5.6% |
3.2% |
(2.4%) |
|
Liquidity Ratio |
46.6% |
48.2% |
1.6% |
|
Minimum Statutory ratio |
20.0% |
20.0% |
0.0% |
|
Excess |
26.6% |
28.2% |
1.6% |
Key Take-Outs:
- Strong earnings growth - Core earnings per share (EPS) increased by 14.3% to Kshs 5.0 from Kshs 4.3 in Q3’2022, mainly driven by 19.4% growth in total operating income to Kshs 29.9 bn in Q3’2023 from Kshs 25.0 bn in Q3’2022. The performance was however weighed down by the 28.6% increase in total operating expenses to Kshs 19.2 bn, from Kshs 14.9 bn in Q3’2022,
- Increased Provisioning – The group’s provisioning increased by 8.1% to Kshs 14.6 bn in Q3’2023, from Kshs 13.6 bn in Q3’2022 aimed at mitigating increased credit risk on the back of the deteriorated business environment. This is evidenced by the 52.5% growth in Gross Non-Performing Loans (NPLs) to Kshs 36.1 bn in Q3’2023, from Kshs 23.7 bn recorded in Q3’2022, and,
- Revenue Diversification – The Group’s Non-Funded income increased by 21.2% to Kshs 10.7 bn in Q3’2023, from Kshs 8.8 bn in Q3’2022, which resulted to a shift in the revenue mix for funded to non-funded income shifted to 64:36 in Q3’2023 from 65:35 in Q3’2022. The increase was mainly attributable to the 21.2% increase in non-funded income which outpaced the 18.4% growth in net interest income.
For a more detailed analysis, please see the I&M Group Q3’2023 Earnings Note.
- NCBA Group Kenya Q3’2023 Financial Performance
During the month, NCBA Group released their Q3’2023 financial results. Below is a summary of the performance;
|
Balance Sheet (Kshs bn) |
Q3'2022 |
Q3'2023 |
y/y change |
|
Net Loans and Advances |
266.1 |
308.7 |
16.0% |
|
Government Securities |
206.8 |
200.8 |
(2.9%) |
|
Total Assets |
595.4 |
678.8 |
14.0% |
|
Customer Deposits |
462.1 |
548.1 |
18.6% |
|
Total Liabilities |
514.5 |
590.3 |
14.7% |
|
Shareholders' Funds |
80.9 |
88.5 |
9.4% |
|
Balance Sheet Ratios |
Q3'2022 |
Q3'2023 |
% points change |
|
Loan to Deposit Ratio |
57.6% |
56.3% |
(1.3%) |
|
Government Securities to Deposit ratio |
44.8% |
36.6% |
(8.1%) |
|
Return on average equity |
21.2% |
18.4% |
(2.8%) |
|
Return on average assets |
2.8% |
2.5% |
(0.4%) |
|
Income Statement (Kshs bn) |
Q3'2022 |
Q3'2023 |
y/y change |
|
Net Interest Income |
23.2 |
26.0 |
11.7% |
|
Net non-Interest Income |
22.5 |
20.7 |
(8.0%) |
|
Total Operating income |
45.8 |
46.7 |
2.0% |
|
Loan Loss provision |
8.3 |
6.1 |
(27.1%) |
|
Total Operating expenses |
26.9 |
28.1 |
4.7% |
|
Profit before tax |
18.2 |
18.6 |
2.1% |
|
Profit after tax |
12.8 |
14.6 |
14.4% |
|
Core EPS (Kshs) |
7.8 |
8.9 |
14.4% |
|
Income Statement Ratios |
Q3'2022 |
Q3'2023 |
% points change |
|
Yield from interest-earning assets |
10.1% |
10.9% |
0.8% |
|
Cost of funding |
4.4% |
5.2% |
0.8% |
|
Net Interest Spread |
5.7% |
5.7% |
0.0% |
|
Net Interest Margin |
6.0% |
6.0% |
0.1% |
|
Capital Adequacy Ratios |
Q3'2022 |
Q3'2023 |
% points change |
|
Core Capital/Total Liabilities |
16.9% |
15.6% |
(1.3%) |
|
Minimum Statutory ratio |
8.0% |
8.0% |
0.0% |
|
Excess |
8.9% |
7.6% |
(1.3%) |
|
Core Capital/Total Risk Weighted Assets |
18.4% |
17.2% |
(1.2%) |
|
Minimum Statutory ratio |
10.5% |
10.5% |
0.0% |
|
Excess |
7.9% |
6.7% |
(1.2%) |
|
Total Capital/Total Risk Weighted Assets |
18.4% |
17.2% |
(1.2%) |
|
Minimum Statutory ratio |
14.5% |
14.5% |
0.0% |
|
Excess |
3.9% |
2.7% |
(1.2%) |
|
Liquidity Ratio |
55.6% |
52.5% |
(3.1%) |
|
Minimum Statutory ratio |
20.0% |
20.0% |
0.0% |
|
Excess |
35.6% |
32.5% |
(3.1%) |
Key Take-Outs:
- Strong earnings growth - Core earnings per share (EPS) increased by 14.4% to Kshs 8.9, from Kshs 7.8 in Q3’2022, driven by the 2.0% growth in total operating income to Kshs 46.7 bn, from Kshs 45.8 bn in Q3’2022,
- Improved asset quality – The Group’s gross NPL ratio decreased to 12.0% in Q3’2023 from 12.6% in Q3’2022, attributable to the 14.3% increase in gross loans to Kshs 331.3 bn, from Kshs 289.9 bn recorded in Q3’2022, which outpaced the 9.2% increase in Gross non-performing loans to Kshs 39.7 bn, from Kshs 36.4 bn in Q3’2022, and,
- Improved Lending – The Group’s loan book increased by 16.0% to Kshs 308.7 bn, from Kshs 266.1 bn in Q3’2022, which outweighed the 2.9% decline in investment in government securities to Kshs 200.8 bn from Kshs 206.8 bn in Q3’2022, highlighting the Group’s strategy to increase lending.
For a more detailed analysis, please see the NCBA Group Q3’2023 Earnings Note.
- Equity Group Q3’2023 Financial Performance
During the month, Equity Group released their Q3’2023 financial results. Below is a summary of the performance;
|
Balance Sheet Items (Kshs bn) |
Q3’2022 |
Q3’2023 |
y/y change |
|
Government Securities |
233.0 |
242.5 |
4.1% |
|
Net Loans and Advances |
673.9 |
845.9 |
25.5% |
|
Total Assets |
1363.7 |
1691.2 |
24.0% |
|
Customer Deposits |
1007.3 |
1207.7 |
19.9% |
|
Deposits per branch |
3.0 |
3.4 |
14.1% |
|
Total Liabilities |
1209.7 |
1497.9 |
23.8% |
|
Shareholders’ Funds |
147.5 |
183.9 |
24.7% |
|
Balance Sheet Ratios |
Q3’2022 |
Q3’2023 |
% y/y change |
|
Loan to Deposit Ratio |
66.9% |
70.0% |
3.1% |
|
Government securities to deposits ratio |
23.1% |
20.1% |
(3.1%) |
|
Return on average equity |
31.3% |
21.8% |
(9.5%) |
|
Return on average assets |
3.7% |
2.4% |
(1.4%) |
|
Income Statement (Kshs bn) |
Q3’2022 |
Q3’2023 |
y/y change |
|
Net Interest Income |
59.8 |
72.6 |
21.3% |
|
Net non-Interest Income |
42.2 |
57.8 |
36.9% |
|
Total Operating income |
102.1 |
130.4 |
27.8% |
|
Loan Loss provision |
(9.7) |
(19.0) |
96.6% |
|
Total Operating expenses |
(57.7) |
(84.5) |
46.3% |
|
Profit before tax |
44.3 |
45.9 |
3.6% |
|
Profit after tax |
34.4 |
36.2 |
5.3% |
|
Core EPS (Kshs) |
9.1 |
9.6 |
5.3% |
|
Income Statement Ratios |
Q3’2022 |
Q3’2023 |
y/y change |
|
Yield from interest-earning assets |
7.3% |
7.7% |
0.4% |
|
Cost of funding |
2.9% |
3.7% |
0.8% |
|
Cost of risk |
9.5% |
14.6% |
5.1% |
|
Net Interest Margin |
7.3% |
5.6% |
(1.7%) |
|
Net Interest Income as % of operating income |
58.6% |
55.7% |
(3.0%) |
|
Non-Funded Income as a % of operating income |
41.4% |
44.3% |
3.0% |
|
Cost to Income Ratio |
56.6% |
64.8% |
8.2% |
|
CIR without LLP |
47.1% |
50.2% |
3.1% |
|
Cost to Assets |
3.8% |
4.3% |
0.5% |
|
Capital Adequacy Ratios |
Q3’2022 |
Q3’2023 |
% points change |
|
Core Capital/Total Liabilities |
16.9% |
17.7% |
0.8% |
|
Minimum Statutory ratio |
8.0% |
8.0% |
0.0% |
|
Excess |
8.9% |
9.7% |
0.8% |
|
Core Capital/Total Risk Weighted Assets |
16.1% |
15.2% |
(0.9%) |
|
Minimum Statutory ratio |
10.5% |
10.5% |
0.0% |
|
Excess |
5.6% |
4.7% |
(0.9%) |
|
Total Capital/Total Risk Weighted Assets |
20.7% |
19.2% |
(1.5%) |
|
Minimum Statutory ratio |
14.5% |
14.5% |
0.0% |
|
Excess |
6.2% |
4.7% |
(1.5%) |
|
Liquidity Ratio |
51.8% |
0.0% |
(51.8%) |
|
Minimum Statutory ratio |
20.0% |
20.0% |
0.0% |
|
Excess |
31.8% |
(20.0%) |
(51.8%) |
Key Take-Outs:
- Strong earnings growth – Core earnings per share (EPS) grew by 5.3% to Kshs 9.6, from Kshs 9.1 in Q3’2022, mainly driven by the 27.8% growth in total operating income to Kshs 130.4 bn, from Kshs 102.1 bn in Q3’2022. However, the performance was weighed down by a 46.3% growth in total operating expenses to Kshs 84.5 bn, from Kshs 57.7 bn in Q3’2022,
- Increased Provisioning – On the back of high credit risk occasioned by the deteriorated business environment, the bank increased its provisions holdings to cover for the anticipated losses in the future, with its provisions increasing by 96.6% to Kshs 19.0 bn from Kshs 9.7 bn recorded in Q3’2022, and,
- Revenue Diversification – The Group’s Non-Funded income increased by 36.9% to Kshs 57.8 bn in Q3’2023, from Kshs 42.2 bn in Q3’2022, which resulted to a shift in revenue mix to 56:44 in Q3’2023 from 59:41 in Q3’2022. The increase was mainly attributable to the faster 36.9% increase in non-funded income compared to the 21.3% increase in Funded income to Kshs 72.6 bn, from Kshs 59.8 bn in Q3’2022.
For a more detailed analysis, please see the Equity Group Q3’2023 Earnings Note.
- Standard Chartered Bank Kenya Q3’2023 Financial Performance
During the month, Standard Chartered Bank Kenya released their Q3’2023 financial results. Below is a summary of the performance;
|
Balance Sheet Items (Kshs bn) |
Q3'2022 |
Q3'2023 |
y/y change |
|
Net loans |
136.1 |
143.6 |
5.5% |
|
Government Securities |
112.0 |
55.6 |
(50.3%) |
|
Total Assets |
366.1 |
369.7 |
1.0% |
|
Customer Deposits |
286.1 |
298.8 |
4.5% |
|
Deposits per Branch |
7.9 |
9.3 |
17.5% |
|
Total Liabilities |
310.6 |
310.0 |
(0.2%) |
|
Shareholder's Funds |
55.5 |
59.7 |
7.6% |
|
Balance Sheet Ratios |
Q3'2022 |
Q3'2023 |
% y/y change |
|
Loan to deposit ratio |
47.6% |
48.0% |
0.5% |
|
Government securities to deposit ratio |
39.1% |
18.6% |
(20.5%) |
|
Return on Average Equity |
21.0% |
22.7% |
1.7% |
|
Return on Average Assets |
3.3% |
3.6% |
0.3% |
|
Income Statement (Kshs bn) |
Q3’2022 |
Q3'2023 |
y/y change |
|
Net Interest Income |
15.8 |
21.2 |
34.5% |
|
Net non-Interest Income |
8.8 |
8.2 |
(6.6%) |
|
Total Operating income |
24.6 |
29.4 |
19.8% |
|
Loan Loss provision |
0.6 |
1.8 |
193.4% |
|
Total Operating expenses |
12.3 |
15.8 |
28.4% |
|
Profit before tax |
12.3 |
13.7 |
11.3% |
|
Profit after tax |
8.7 |
9.7 |
11.8% |
|
Core EPS (Kshs) |
23.1 |
25.8 |
11.8% |
|
Income Statement Ratios |
Q3’2022 |
Q3'2023 |
y/y change |
|
Yield from interest-earning assets |
7.3% |
9.4% |
2.1% |
|
Cost of funding |
1.14% |
1.03% |
(0.1%) |
|
Net Interest Spread |
6.2% |
8.4% |
2.2% |
|
Net Interest Margin |
6.3% |
8.5% |
2.2% |
|
Cost of Risk |
2.5% |
6.2% |
3.7% |
|
Net Interest Income as % of operating income |
64.3% |
72.1% |
7.8% |
|
Non-Funded Income as a % of operating income |
35.7% |
27.9% |
(7.8%) |
|
Cost to Income Ratio |
49.9% |
53.5% |
3.6% |
|
Cost to Income Ratio without LLP |
47.4% |
47.3% |
(0.1%) |
|
Cost to Assets |
3.3% |
3.8% |
0.5% |
|
Capital Adequacy Ratios |
Q3’2022 |
Q3'2023 |
% points change |
|
Core Capital/Total Liabilities |
14.5% |
15.7% |
1.2% |
|
Minimum Statutory ratio |
8.0% |
8.0% |
0.0% |
|
Excess |
6.5% |
7.7% |
1.2% |
|
Core Capital/Total Risk Weighted Assets |
15.4% |
17.1% |
1.7% |
|
Minimum Statutory ratio |
10.5% |
10.5% |
0.0% |
|
Excess |
4.9% |
6.6% |
1.7% |
|
Total Capital/Total Risk Weighted Assets |
17.7% |
17.8% |
0.1% |
|
Minimum Statutory ratio |
14.5% |
14.5% |
0.0% |
|
Excess |
3.2% |
3.3% |
0.1% |
|
Liquidity Ratio |
71.9% |
66.7% |
(5.2%) |
|
Minimum Statutory ratio |
20.0% |
20.0% |
0.0% |
|
Excess |
51.9% |
46.7% |
(5.2%) |
Key Take-Outs:
- Strong earnings growth - Core earnings per share (EPS) grew by 11.8% to Kshs 25.8, from Kshs 23.1 in Q3’2022, driven by the 19.8% growth in total operating income to Kshs 29.4 bn, from Kshs 24.6 bn in Q3’2022. The performance was however weighed down by the 28.4% increase in the total operating expenses to Kshs 15.8 bn in Q3’2023, from Kshs 12.3 bn in Q3’2022,
- Improvement in Asset Quality - The group’s asset quality improved significantly, with the NPL ratio improving to 14.4% in Q3’2023, from 15.4% recorded in Q3’2022. The improvement in asset quality was attributable to the 4.6% growth in gross loans to Kshs 163.1 bn, from Kshs 155.9 bn in Q3’2022, relative to the 2.0% decrease in gross non-performing loans to Kshs 23.6 bn, from Kshs 24.0 bn in Q3’2022, and,
- Increased Provisioning - Q3’2023 was characterized by increased provisioning, attributable to the high credit risks brought about by the deteriorated business environment. As such, Standard Chartered Bank Kenya increased its loan loss provisions by 193.4% to Kshs 1.8 bn in Q3’2023, up from Kshs 0.6 bn provisioning recorded in Q3’2022. Notably, General Provisions (LLP) decreased marginally by 1.0% to Kshs 10.2 bn, from Kshs 10.3 bn recorded in Q3’2022.
For a more detailed analysis, please see the Standard Chartered Bank Q3’2023 Earnings Note.
- Stanbic Holding’s Q3’2023 Financial Performance
During the month, Stanbic Holding’s released their Q3’2023 financial results. Below is a summary of the performance;
|
Balance Sheet (Kshs bn) |
Q3'2022 |
Q3'2023 |
y/y change |
|
Net Loans and Advances |
236.9 |
251.0 |
5.9% |
|
Government Securities |
63.0 |
37.0 |
(41.3%) |
|
Total Assets |
371.4 |
414.3 |
11.5% |
|
Customer Deposits |
267.3 |
305.7 |
14.3% |
|
Deposits Per Branch |
10.3 |
10.2 |
(0.9%) |
|
Total Liabilities |
321.0 |
358.6 |
11.7% |
|
Shareholders' Funds |
50.4 |
55.7 |
10.5% |
|
Key Ratios |
Q3'2022 |
Q3'2023 |
% point change |
|
Loan to Deposit ratio |
88.6% |
82.1% |
(6.5%) |
|
Government securities to deposits ratio |
23.6% |
12.1% |
(11.5%) |
|
Return on average equity |
19.1% |
21.4% |
2.3% |
|
Return on average assets |
2.7% |
2.9% |
0.2% |
|
Income Statement (Kshs bn) |
Q3'2022 |
Q3'2023 |
y/y change |
|
Net interest Income |
12.7 |
18.1 |
42.4% |
|
Net non-interest income |
10.3 |
12.6 |
23.0% |
|
Total Operating income |
23.0 |
30.7 |
33.7% |
|
Loan loss provision |
(2.9) |
(4.5) |
56.8% |
|
Total Operating expenses |
(13.3) |
(17.8) |
33.6% |
|
Profit before tax |
9.7 |
13.0 |
34.0% |
|
Profit after tax |
7.0 |
9.3 |
32.7% |
|
Core EPS (Kshs) |
17.7 |
23.5 |
32.7% |
|
Income Statement Ratios |
Q3'2022 |
Q3'2023 |
y/y change |
|
Yield from interest-earning assets |
6.4% |
8.3% |
1.9% |
|
Cost of funding |
2.5% |
3.3% |
0.8% |
|
Net Interest Margin |
6.2% |
7.8% |
1.6% |
|
Net Interest Income as % of operating income |
55.4% |
59.0% |
3.6% |
|
Non-Funded Income as a % of operating income |
44.6% |
41.0% |
(3.6%) |
|
Cost to Income Ratio |
57.9% |
57.8% |
(0.1%) |
|
CIR without LLP |
45.4% |
43.2% |
(2.2%) |
|
Cost to Assets |
2.8% |
4.3% |
1.5% |
|
Capital Adequacy Ratios |
Q3'2022 |
Q3'2023 |
% points change |
|
Core Capital/Total Liabilities |
17.2% |
15.7% |
(1.5%) |
|
Minimum Statutory ratio |
8.0% |
8.0% |
|
|
Excess |
9.2% |
7.7% |
(1.5%) |
|
Core Capital/Total Risk Weighted Assets |
13.4% |
13.2% |
(0.2%) |
|
Minimum Statutory ratio |
10.5% |
10.5% |
|
|
Excess |
2.9% |
2.7% |
(0.2%) |
|
Total Capital/Total Risk Weighted Assets |
16.2% |
16.9% |
0.7% |
|
Minimum Statutory ratio |
14.5% |
14.5% |
|
|
Excess |
1.7% |
2.4% |
0.7% |
|
Liquidity Ratio |
39.9% |
40.5% |
0.6% |
|
Minimum Statutory ratio |
20.0% |
20.0% |
|
|
Excess |
19.9% |
20.5% |
0.6% |
Key Take-Outs:
- Strong earnings growth - Core earnings per share (EPS) grew by 32.7% to Kshs 23.5, from Kshs 17.7 in Q3’2022, driven by the 33.7% growth in total operating income to Kshs 30.7 bn, from Kshs 23.0 bn in Q3’2022, and,
- Improved asset quality - The bank’s gross NPL ratio decreased to 9.0% in Q3’2023 from 10.1% in Q3’2022, attributable to 6.2% decrease in Gross non-performing loans to Kshs 24.1 bn, from Kshs 25.6 bn in Q3’2022, compared to the 5.4% increase in gross loans to Kshs 266.9 bn, from Kshs 253.2 bn recorded in Q3’2022,
For a more detailed analysis, please see the Stanbic Bank Q3’2023 Earnings Note.
- Co-operative Bank Q3’2023 Financial Performance
During the month, Co-operative Bank released their Q3’2023 financial results. Below is a summary of the performance;
|
Balance Sheet Items (Kshs bn) |
Q3'2022 |
Q3'2023 |
y/y change |
|
Government Securities |
182.4 |
185.1 |
1.5% |
|
Net Loans and Advances |
335.2 |
378.1 |
12.8% |
|
Total Assets |
622.1 |
661.3 |
6.3% |
|
Customer Deposits |
432.0 |
432.8 |
0.2% |
|
Total Liabilities |
520.9 |
553.2 |
6.2% |
|
Shareholders Funds |
100.9 |
108.1 |
7.1% |
|
Balance Sheet Ratios |
Q3'2022 |
Q3'2023 |
y/y change |
|
Loan to Deposit Ratio |
77.6% |
87.3% |
9.7% |
|
Government Securities to deposit ratio |
42.2% |
42.8% |
0.6% |
|
Return on average equity |
22.5% |
22.3% |
(0.2%) |
|
Return on average assets |
3.6% |
3.6% |
0.0% |
|
Income Statement (Kshs bn) |
Q3'2022 |
Q3'2023 |
y/y change |
|
Net Interest Income |
32.0 |
32.8 |
2.5% |
|
Non-Interest Income |
20.2 |
20.6 |
2.1% |
|
Total Operating income |
52.2 |
53.4 |
2.3% |
|
Loan Loss provision |
(5.73) |
(4.21) |
(26.5%) |
|
Total Operating expenses |
(29.6) |
(29.0) |
(2.1%) |
|
Profit before tax |
22.7 |
24.7 |
8.6% |
|
Profit after tax |
17.1 |
18.4 |
7.6% |
|
Earnings per share |
2.9 |
3.1 |
7.6% |
|
Income Statement Ratios |
Q3'2022 |
Q3'2023 |
Y/Y Change |
|
Yield from interest-earning assets |
11.4% |
12.2% |
0.8% |
|
Cost of funding |
3.2% |
4.2% |
1.0% |
|
Net Interest Spread |
8.2% |
8.0% |
(0.2%) |
|
Net Interest Income as % of operating income |
61.4% |
61.5% |
0.1% |
|
Non-Funded Income as a % of operating income |
38.6% |
38.5% |
(0.1%) |
|
Cost to Income |
56.8% |
54.3% |
(2.5%) |
|
CIR without provisions |
45.8% |
46.4% |
0.6% |
|
Cost to Assets |
3.84% |
3.75% |
(0.1%) |
|
Net Interest Margin |
8.5% |
8.4% |
(0.1%) |
|
Capital Adequacy Ratios |
Q3'2022 |
Q3'2023 |
% points change |
|
Core Capital/Total deposit Liabilities |
19.7% |
23.1% |
3.4% |
|
Minimum Statutory ratio |
8.0% |
8.0% |
|
|
Excess |
11.7% |
15.1% |
3.4% |
|
Core Capital/Total Risk Weighted Assets |
15.7% |
17.9% |
2.2% |
|
Minimum Statutory ratio |
10.5% |
10.5% |
|
|
Excess |
5.2% |
7.4% |
2.2% |
|
Total Capital/Total Risk Weighted Assets |
16.8% |
22.1% |
5.3% |
|
Minimum Statutory ratio |
14.5% |
14.5% |
|
|
Excess |
2.3% |
7.6% |
5.3% |
|
Liquidity Ratio |
52.1% |
50.3% |
(1.8%) |
|
Minimum Statutory ratio |
20.0% |
20.0% |
|
|
Excess |
32.1% |
30.3% |
(1.8%) |
Key Take-Outs:
- Earnings growth - Core earnings per share (EPS) grew by 7.6% to Kshs 3.1, from Kshs 2.9 in Q3’2022, driven by the 2.3% growth in total operating income to Kshs 53.4 bn, from Kshs 52.2 bn in Q3’2022,
- Improved efficiency – The bank’s total operating expenses decreased by 2.1% to Kshs 29.0 bn in Q3’2023 from Kshs 29.6 bn in Q3’2022, attributable to a 26.5% decrease in loan loss provisions to Kshs 4.2 bn, from Kshs 5.7 bn recorded in Q3’2022, coupled with a 3.5% decrease in other expenses to Kshs 12.6 bn from Kshs 13.1 bn in Q3’2022, which outpaced the slower 12.4% increase in staff costs to Kshs 12.2 bn, from Kshs 10.8 bn in Q3’2022, and,
- Asset quality Deterioration- The bank’s asset quality deteriorated as evidenced by the NPL ratio increasing to 14.9% in Q3’2023 from 14.0% in Q3’2022, attributable to 19.5% increase in Gross non-performing loans to Kshs 61.9 bn, from Kshs 51.8 bn in Q3’2022, compared to the slower 12.3% increase in gross loans to Kshs 416.6 bn, from Kshs 371.1 bn recorded in Q3’2022.
For a more detailed analysis, please see Co-operative Bank Q3’2023 Earnings Note.
Asset Quality:
|
Cytonn Report: Listed Bank Asset Quality |
||||||
|
|
Q3'2023 NPL Ratio* |
Q3'2022 NPL Ratio** |
% Point Change in NPL Ratio |
Q3'2023 NPL Coverage* |
Q3'2022 NPL Coverage** |
% Point Change in NPL Coverage |
|
Equity Group |
13.6% |
9.5% |
4.2% |
53.4% |
63.0% |
(9.6%) |
|
NCBA Group |
12.0% |
15.4% |
(3.4%) |
83.0% |
82.4% |
0.5% |
|
KCB |
17.2% |
21.4% |
(4.2%) |
51.1% |
45.8% |
5.3% |
|
Standard Chartered Bank Kenya |
14.4% |
15.4% |
(1.0%) |
84.8% |
83.9% |
0.9% |
|
ABSA Bank Kenya |
16.1% |
17.8% |
(1.8%) |
62.1% |
52.8% |
9.3% |
|
Co-operative Bank of Kenya |
14.9% |
14.0% |
0.9% |
62.1% |
69.3% |
(7.2%) |
|
Stanbic Bank |
9.0% |
10.1% |
(1.1%) |
66.3% |
63.4% |
3.0% |
|
I&M Holdings |
11.8% |
9.5% |
2.3% |
51.8% |
75.4% |
(23.6%) |
|
Diamond Trust Bank |
12.6% |
12.7% |
(0.1%) |
48.7% |
45.2% |
3.4% |
|
HF Group |
22.8% |
20.3% |
2.5% |
74.0% |
77.2% |
(3.2%) |
|
Mkt Weighted Average* |
13.9% |
13.9% |
0.01% |
62.5% |
65.9% |
(3.4%) |
|
*Market cap weighted as at 02/12/2023 |
||||||
|
**Market cap weighted as at 02/12/2022 |
||||||
Key take-outs from the table include:
- Asset quality for the listed banks deteriorated slightly in Q3’2023, with market weighted average NPL increasing marginally by 0.01% points to 13.88% from a 13.87% in Q3’2022. The performance in asset quality was mainly driven by deterioration in Equity Group, HF Group and I&M Holdings asset quality with their NPL ratios increasing by 4.2%, 2.5% and 2.3% points respectively. The performance was however supported by KCB Group, NCBA Group and ABSA Bank Kenya asset quality with their NPL ratios decreasing by 4.2%, 3.4% and 1.8% points respectively,
- Equity Group had the highest NPL ratio jump by 4.2% points to 13.6% from 9.5% points in Q3’2022, attributable to 83.5% increase in Gross non-performing loans Kshs 124.5 bn in Q3’2023 from Kshs 67.9 bn in Q3’2022, which outpaced the 27.3% increase in gross loans to Kshs 912.4 bn from Kshs 716.6 bn recorded in Q3’2022, and,
- Market weighted average NPL Coverage for the listed banks decreased by 3.4% points to 62.5% in Q3’2023, from 65.9% recorded in Q3’2022, majorly on the back of decreased NPL coverage recorded by I&M Holdings, Equity Group and Coop Bank by 23.6%, 9.6%, 9.1% and 7.2% respectively in Q3’2022. However, ABSA Bank Kenya, KCB Group and Diamond Trust Bank coverage increased by 9.3% points, 5.3% points and 3.4% points to 62.1%, 51.1% and 48.7% respectively in Q3’2023.
Summary Performance
The table below shows performance of listed banks using several metrics:
|
Cytonn Report: Listed Banks Performance in Q3’2023 |
|||||||||||||||
|
Bank |
Core EPS Growth |
Interest Income Growth |
Interest Expense Growth |
Net Interest Income Growth |
Net Interest Margin |
Non-Funded Income Growth |
NFI to Total Operating Income |
Growth in Total Fees & Commissions |
Deposit Growth |
Growth in Government Securities |
Loan to Deposit Ratio |
Loan Growth |
Return on Average Equity |
||
|
Equity Group |
5.3% |
32.0% |
58.4% |
21.3% |
5.6% |
36.9% |
44.3% |
36.6% |
19.9% |
4.1% |
70.0% |
25.5% |
21.8% |
||
|
NCBA Group |
14.4% |
21.1% |
35.3% |
11.7% |
6.0% |
(8.0%) |
44.4% |
11.9% |
18.6% |
(2.9%) |
56.3% |
16.0% |
18.4% |
||
|
KCB |
0.4% |
36.4% |
77.9% |
21.6% |
6.8% |
38.7% |
36.1% |
65.7% |
79.6% |
37.5% |
63.3% |
38.1% |
20.2% |
||
|
Standard Chartered Bank Kenya |
11.8% |
28.5% |
(10.0%) |
34.5% |
8.5% |
(6.6%) |
27.9% |
19.0% |
4.5% |
(50.3%) |
48.0% |
5.5% |
22.7% |
||
|
ABSA Bank Kenya |
14.9% |
33.5% |
62.2% |
26.0% |
8.8% |
6.4% |
27.0% |
21.2% |
26.1% |
(15.7%) |
93.4% |
14.3% |
25.8% |
||
|
Co-operative Bank of Kenya |
7.6% |
12.9% |
41.3% |
2.5% |
8.4% |
2.1% |
38.5% |
7.8% |
0.2% |
1.5% |
87.3% |
12.8% |
22.3% |
||
|
Stanbic Holdings |
32.7% |
48.2% |
63.2% |
42.4% |
7.8% |
23.0% |
41.0% |
22.7% |
14.3% |
(41.3%) |
82.1% |
5.9% |
21.4% |
||
|
I&M Holdings |
14.3% |
27.5% |
41.5% |
18.4% |
6.2% |
21.2% |
35.9% |
16.9% |
30.6% |
14.6% |
71.4% |
24.3% |
15.9% |
||
|
Diamond Trust Bank |
5.2% |
33.0% |
51.5% |
19.6% |
5.4% |
33.9% |
31.4% |
25.2% |
27.3% |
(4.5%) |
63.2% |
18.7% |
10.0% |
||
|
HF Group |
283.9% |
20.3% |
19.1% |
21.4% |
5.4% |
20.6% |
32.2% |
38.5% |
12.9% |
10.9% |
87.8% |
9.3% |
5.3% |
||
|
Q3'23 Mkt Weighted Average* |
11.0% |
30.0% |
48.4% |
21.6% |
6.9% |
18.5% |
38.2% |
28.2% |
23.6% |
(4.2%) |
70.4% |
19.5% |
21.2% |
||
|
Q3'22 Mkt Weighted Average** |
36.3% |
16.4% |
19.7% |
17.6% |
7.3% |
30.1% |
38.1% |
16.3% |
9.8% |
6.5% |
73.7% |
17.1% |
24.2% |
||
|
*Market cap weighted as at 02/12/2023 |
|||||||||||||||
|
**Market cap weighted as at 02/12/2022 |
|||||||||||||||
Key take-outs from the table include:
- The listed banks recorded an average growth of 11.0% in core Earnings per Share (EPS) in Q3’2023, compared to the weighted average growth of 36.3% in Q3’2022, an indication of suppressed performance due to the tough operating environment experienced in Q3’2023,
- Non-Funded Income grew by an average of 18.5% compared to weighted average growth of 30.1% in Q3’2022, despite the increased revenue diversification efforts by the banks, and,
- The Banks recorded a deposit growth of 23.6%, higher than the market weighted average deposit growth of 9.8% in Q3’2022.
We are “Neutral” on the Equities markets in the short term due to the current tough operating environment and huge foreign investor outflows, and, “Bullish” in the long term due to current cheap valuations and expected global and local economic recovery.
With the market currently being undervalued to its future growth (PEG Ratio at 0.6x), we believe that investors should reposition towards value stocks with strong earnings growth and that are trading at discounts to their intrinsic value. We expect the current high foreign investors sell-offs to continue weighing down the equities outlook in the short term.
- Industry Reports
During the month, the following industry reports were released and the key take-outs were as follows;
|
Cytonn Report: Notable Industry Reports During the Month of November 2023 |
|||
|
# |
Theme |
Report |
Key Take-outs |
1 |
Residential and Land Sectors |
House Price and Land Price Index Q3’2023 Reports by Hass Consult |
|
|
2 |
Hospitality and Construction Sectors |
The Leading Economic Indicators (LEI) September 2023 Report by National Bureau of Statistics (KNBS) |
|
Going forward, we expect Kenya’s Real Estate sector to register positive growth and improved performance mainly driven by increasing number of visitor arrivals into the country which will enhance the performance of the hospitality industry by boosting room and bed occupancies and sustained demand for Real Estate development. However, we expect increased construction costs on the back of rising inflation and stringent lending requirements to developers, with financial institutions such as banks demanding more collateral due to perceived increases in credit risks in the Real Estate sector will hamper optimum performance of the sector. This is evidenced by a 20.9% spike in gross Non-Performing Loans (NPLs) to the Real Estate sector by banks to Kshs 96.0 bn in Q2’2023, from Kshs 79.4 bn in Q2’2022.
- Residential Sector
During the week, the Kenya Mortgage Refinance Company (KMRC), in partnership with the treasury and private lenders, launched the Risk Sharing Facility (RSF) aimed at increasing home ownership amongst workers in the informal settlement. According to the Kenya National Bureau of Statistics (KNBS), the informal sector in Kenya accounts for over 80.0% of the labor workforce, and constitutes approximately 16.0 mn Kenyans. Under the RSF, KMRC will guarantee a portion of the loans provided to homeowners in the informal sector. This arrangement aims to reduce the risk for end users, making them more appealing to financial institutions for lending. By sharing the risk burden, KMRC enhances the creditworthiness of borrowers with non-formal income, making them more attractive prospects for loans from financial institutions.
In response to the current state of Kenya's mortgage market, which is relatively underdeveloped with only 27,786 home loans valued at Kshs 261.8 bn in 2022, KMRC's initiative is set to broaden access to housing finance. According to the Central Bank of Kenya Annual Banking Supervision Report 2022, the market saw an average loan size increase to Kshs 9.4 mn in 2022, up from Ksh 9.2 mn in 2021 highlighting an affordability gap for lower-income groups. KMRC's strategy to develop the RSF facility, coupled with its fixed rate interest rate capped at 5.0% to Primary Mortgage Lenders including banks and SACCOs is meant to avail affordable housing finance by cushioning customers against rising interest rates thereby closing the gap in housing affordability within the low-income segment.
The RSF facility aligns with the government's affordable housing agenda and President William Ruto's ambitious plan to construct 250,000 affordable housing units annually, in concerted efforts to curb the exiting 80.0% housing deficit. Additionally, KMRC's revised lending limits, allowing homeowners earning up to Kshs 150,000 per month to borrow up to Kshs 8.0 mn in Nairobi Metropolitan Area and Kshs 6.0 mn outside the NMA, is poised to significantly enhance homeownership among middle and lower-income earners. We expect the RSF will; i) promote the uptake of mortgage in Kenya particularly in the lower income segment of the market, ii) contribute towards government’s efforts to provide affordable housing finance to its citizens, iii) promote homeownership rates in the country especially in the informal sector, and, iv) extend KMRC’s offering to lower income customers thus enhancing financial inclusion in the mortgage sector.
Notable highlights in the sector during the month include;
- Property developer Mi Vida Homes broke ground for the construction of two projects namely, Amaiya, 237 Garden City (237 GC) and KEZA located within Garden City along Thika Road, and Riruta areas respectively. This comes more than a year after the developer announced plans to begin construction in April 2022. For more information, please see our Cytonn Weekly #47/2023.
We expect to continue witnessing increased completions and launch of more affordable housing projects in concerted efforts by the government to address the 80.0% annual housing deficit. Moving forward, we expect we will witness an increase in the number of institutional investors venturing in affordable housing segment which has traditionally been overshadowed by mid to high-end developments. Additionally, we anticipate to continue witnessing an increase in the development of Mixed-Use Developments (MUDs), as these schemes continue to grow in popularity both in Kenya and globally attributable to the diversity in amenities and social offerings they provide to clients. This inclination towards mixed-use, community-centric developments is indicative of a shift in modern homebuyers' preferences, who are increasingly seeking value beyond the residential unit. However, the exorbitant cost of financing in housing development and increasing construction expenses pose significant challenges in Kenya’s housing sector. This results in elevated development costs for builders, making it difficult for people to afford homes.
- Commercial Office Sector
Notable highlight during the month include;
- International Workplace Group (IWG) plc, a global provider of co-working, office and meeting spaces based in Switzerland announced it has, invested USD 850,000.0 (Kshs 127.5 mn) to set up a workplace facility at Global Trade Centre (GTC) Tower, located in Westlands, Nairobi. The facility which occupies 1,761 SQM will mainly target employees hired by different firms and independent contractors, and will comprise co-working spaces, private offices, and state-of-the art meeting facilities. For more information, please see our Cytonn Weekly #46/2023.
We expect the performance of the sector to be supported by;
- the entry of multinationals and foreign entities into Kenya looking to use Nairobi as a base for their expansion operations into Africa,
- the growing popularity of co-working spaces evidenced by facilities such as Kofisi centers, Nairobi Garage, IWG Workplace at GTC, and
- iii) the continued recognition and positioning of Nairobi as a business hub in the region.
In support of this, Nairobi was recently voted as Africa’s leading business travel destination in the 30th World Travel Awards. However, we expect existing oversupply of commercial spaces in the Nairobi Metropolitan Area estimated at 5.8 mn SQFT will hinder optimum performance of the sector by stifling absorption rates.
- Hospitality Sector
Notable highlight during the month include;
- Swiss-Belhotel International, a global hotel management chain based in Hong-Kong took over management of Nairobi Safari Club, Kenya's first all-suite luxury accommodation. The hotel, which is situated within the 16-storey Lilian Towers, located along Koinange street, Nairobi Central Business District (CBD) is set to undergo a rebranding, and will be renamed to Safari Club by Swiss-Belhotel. Nairobi Safari Club boasts of a selection of 146 suites, ranging from studio to expansive presidential suites, and caters to a clientele seeking upscale living spaces and amenities. For more information, please see our Cytonn Weekly #45/2023.
We expect that going forward, the sector’s performance will be supported by factors such as;
- continued recognition of Kenya’s hospitality sector through positive awards and accolades,
- aggressive marketing campaigns by the Kenya Tourism Board on the Magical Kenya platforms,
- concerted efforts to promote local and regional tourism,
- development of niche products such as cruise tourism, adventure tourism, culture and sports tourism,
- continuous opening and expansions by local and international hotel brands such as JW Marriott of the Bonvoy Global and Pan Pacific Hotels Group in the country, and,
- counties’ efforts to boost tourism in efforts aimed at enhancing County revenue collections
However, the sector's optimal performance is expected to be subdued by challenging economic conditions such as rising operational costs attributed to the rising inflation, and, recently issued travel advisories by multiple governments, including those of China and the United States amidst concerns of possible security breaches and threats.
- Industrial Sector
During the week, Sameer Africa launched the construction of a new Kshs 260.0 mn industrial warehousing facility, as part of its expansion in the Real Estate business. The facility, situated along Mombasa Road, is slated to start operations mid next year, and will include amenities such as high-speed fibre internet connectivity, ample utility water and a dedicated in-house property management team.
The company’s decision to venture into industrial warehousing is due to the rising demand for storage facilities in the country, attributed to the rise of e-commerce since the onset of the COVID-19 pandemic. The groundbreaking is the second phase of Sameer’s strategy to reshape the company’s property business into a major source of income and growth. Other notable properties within the company’s portfolio include; Sameer Business Park, a modern transformative experience of corporate offices cum showrooms complex set on 8.8 acres along Mombasa Road, Nairobi, Sameer EPZ Limited and Sameer Industrial Park Limited.
We expect the performance of the industrial sector in Kenya will continue to be supported by; i) establishment of more government and private Special Economic Zones (SEZs), Export Processing Zones (EPZs), industrial parks strategically located along major agricultural zones and infrastructural and transportation linkages across the country, ii) government’s focus to stimulate industrialization through focused investments under the Kenya Industrial Transformation Programme, iii) government's accelerated focus on exporting agricultural and horticultural products to the international market, iv) recognition of Kenya as a regional hub attracting increased investments by foreign manufacturing entities, and, v) increased demand of e-commerce warehouses in the retail sector. However, the prolonged stalling of development of supporting infrastructure such as roads, water and electricity within industrial parks will continue to hamper optimum development and investments in the industrial sector.
- Regulated Real Estate Funds
- Real Estate Investments Trusts (REITs)
During the week, unitholders of ILAM Fahari I-REIT approved the proposed operational restructuring and delisting of the REIT from the Main Investment Market Segment of the Nairobi Securities Exchange (NSE). The decision follows an Extraordinary General Meeting (EGM) held last week on Friday 24th that resulted in the approval of all the resolutions endorsed by the REIT manager and agreed by the Trustee. The resolutions consisted;
- The proposed conversion of ILAM Fahari I-REIT from an unrestricted I-REIT to a restricted I-REIT which was voted for by 93.1% of unitholders,
- The delisting of the REIT from the Main Investment Market of the NSE which was passed by 93.0% of unitholders,
- The subsequent quotation of the REIT on the Unquoted Securities Platform (USP), and,
- The authorization of ICEA Lion Asset Management (ILAM) and the Co-operative Bank of Kenya as the Fund Manager and Trustee of ILAM Fahari I-REIT to take all requisite actions for the conversion and delisting.
Following this approval, the REIT will make an application to the Capital Markets Authority (CMA) and NSE for purposes of obtaining approval for delisting, after which a delisting date will be announced through a public notice. The Conversion Offering Memorandum has set the date for delisting of the REIT on Monday 4th December 2023 and subsequent quoting of the I-REIT on the USP on Monday 22nd January 2024. However, it is worth noting that the above dates are provisional and are subject to amendment and notification to the general public with the approval of the CMA where appropriate. ILAM Fahari I-REIT will join Acorn D-REIT and I-REIT on the USP for a period of three years, after which, should the strategic objectives of the operational restructuring be met, the REIT will reconsider the possibility of re-listing on the NSE For more information regarding the operational restructuring of ILAM Fahari, please read our Cytonn Weekly #47/2023, Cytonn Monthly October 2023 and Cytonn Monthly August 2023.
In the Nairobi Securities Exchange, ILAM Fahari I-REIT closed the week trading at an average price of Kshs 5.8 per share. The performance represents a 2.3% decline from Kshs 6.0 per share recorded last week, taking it to a 13.9% Year-to-Date (YTD) loss from Kshs 6.8 per share recorded on 3 January 2023. Additionally, the performance represents a 70.8% Inception-to-Date (ITD) loss from the Kshs 20.0 price. The dividend yield currently stands at 11.1%. The graph below shows Fahari I-REIT’s performance from November 2015 to 1st December 2023;
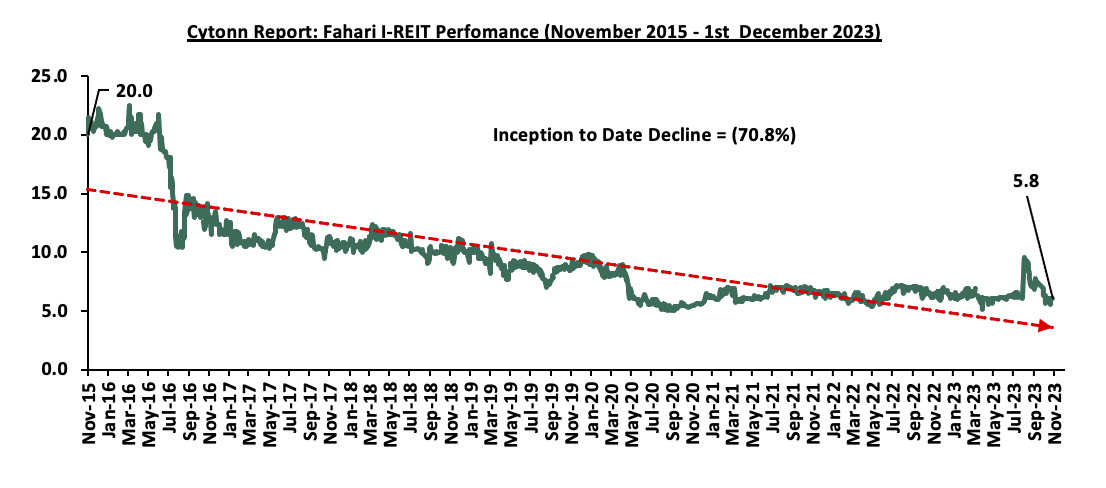
In the Unquoted Securities Platform, Acorn D-REIT and I-REIT traded at Kshs 25.3 and Kshs 21.7 per unit, respectively, as of 1st December 2023. The performance represented a 26.6% and 8.3% gain for the D-REIT and I-REIT, respectively, from the Kshs 20.0 inception price. The volumes traded for the D-REIT and I-REIT came in at 12.3 mn and 30.7 mn shares, respectively, with a turnover of Kshs 257.5 mn and Kshs 633.8 mn, respectively, since inception in February 2021.
REITs provide various benefits like tax exemptions, diversified portfolios, and stable long-term profits. However, the continuous deterioration in performance of the Kenyan REITs and restructuring of their business portfolio is on top of other general challenges such as; i) inadequate comprehension of the investment instrument among investors, ii) prolonged approval processes for REITs creation, iii) high minimum capital requirements of Kshs 100.0 mn for trustees, and, iv) minimum investment amounts set at Kshs 5.0 mn, continue to limit the performance of the Kenyan REITs market.
- Cytonn High Yield Fund (CHYF)
Cytonn High Yield Fund (CHYF) closed the week with an annualized yield of 18.0%, remaining relatively unchanged the previous week. The performance represented a 4.1%-points Year-to-Date (YTD) increase from 13.9% yield recorded on 1st January 2023, and 2.3%-points Inception-to-Date (ITD) increase from the 15.7% yield. The graph below shows Cytonn High Yield Fund’s performance from November 2019 to 1st December 2023;
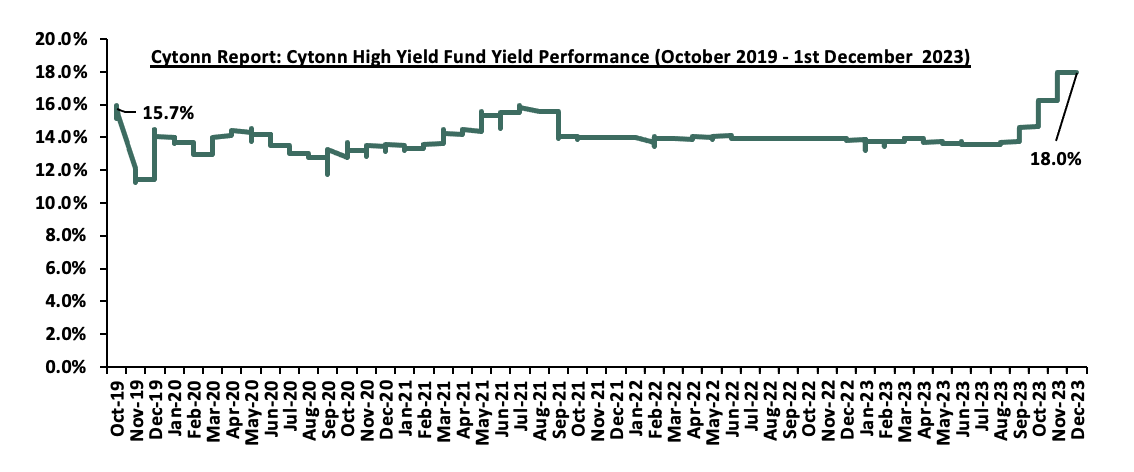
Notably, the CHYF has outperformed other regulated Real Estate funds with an annualized yield of 18.0%, as compared to Fahari I-REIT and Acorn I-REIT with yields of 11.1%, and 2.8% respectively. As such, the higher yields offered by CHYF makes the fund one of the best alternative investment resource in the Real Estate sector. The graph below shows the yield performance of the Regulated Real Estate Funds;
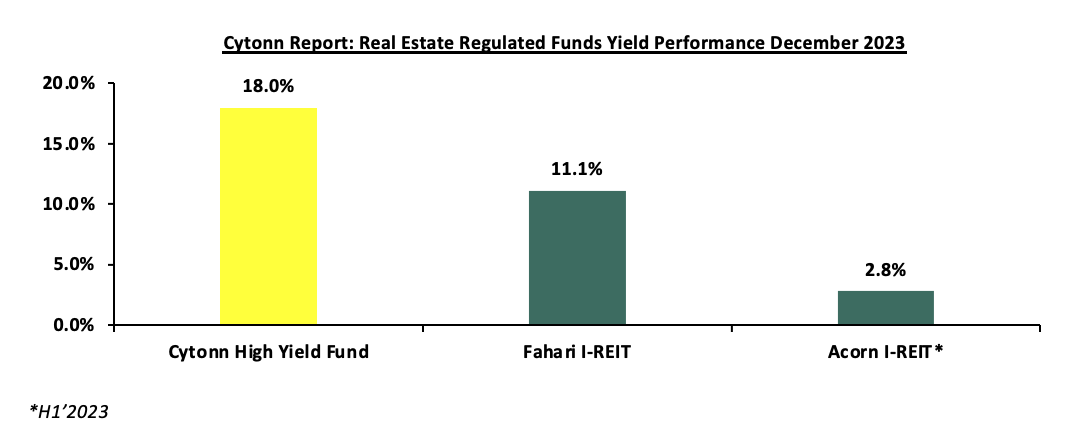
Source: Cytonn Research
We expect the performance of Kenya’s Real Estate sector to remain resilient, supported by factors such as; i) initiation and development of housing projects expected to boost the residential sector, ii) government’s efforts to avail affordable housing finance through the Kenya Mortgage Refinance Company (KMRC), iii) relatively positive demographics in the country increasing demand for housing and Real Estate, iv) the increasing number of visitor arrivals into the country expected to continue boosting performance of serviced apartments and hotels in the country, v) continued recognition of Kenya’s hospitality industry, and, vi) increased foreign investments into the country positioning Kenya as a regional hub. However, factors such as; i) rising costs of construction, ii) existing oversupply in select Real Estate sectors, and, iii) limited investor knowledge in REITs will continue to hinder optimal performance of the sector by limiting developments and investments.
Disclaimer: The views expressed in this publication are those of the writers where particulars are not warranted. This publication is meant for general information only and is not a warranty, representation, advice or solicitation of any nature. Readers are advised in all circumstances to seek the advice of a registered investment advisor.

- Talk to us
- Kenya
- P.O Box 20695 - 00200, Nairobi, Kenya
- Cell +254709101200
- Tel +254709101200
- WhatsApp +254741676635
- United States
- +254709101200
- DOWNLOAD OUR APP
-


- Kenya
- 8th Floor, Pinetree Plaza, Kaburu Drive, Ngong Road, Nairobi, Kenya
- USA
- Suite 1150, 1775 Eye Street NW, USA, Washington DC 20006, USA
- Investments
- High Yield
- Private Equity
- Real Estate
- Real Estate
- RiverRun Estates
- Cytonn Towers
- The Ridge
- Taraji Heights
- The Alma