Kenya FY’2021 Listed Insurance Report, & Cytonn Monthly – May 2022
By Research Team, Jun 5, 2022
Executive Summary
Fixed Income
During the month of May, T-bills remained undersubscribed, with the overall subscription rate coming in at 92.2%, up from the 59.4% recorded in April 2022. The increase in the subscription rate was partly attributable to the increasing yields and the eased liquidity in the money market with the average interbank rate declining to 4.6%, from 4.7% recorded in April 2022. The overall subscription rates for the 91-day, 182-day and 364-day papers increased to 133.4%, 66.9% and 101.0%, from 105.5%, 46.7% and 53.6%, respectively, recorded in April 2022. The average yields on the 364-day, 182-day and 91-day papers increased by 10.3 bps, 42.3 bps and 26.5 bps to 9.9%, 8.7% and 7.7%, respectively. For the month of June, the government issued a new 18-year infrastructure bond, IFB1/2022/18 with a tenor of 18 years in a bid to raise Kshs 75.0 bn for funding Infrastructure projects. The period of sale runs from 23rd May 2022 to 7th June 2022;
Also during the week, the Monetary Policy Committee (MPC) met to review the outcome of its previous policy decisions and for the first time since April 2020, increased the Central Bank Rate by 50.0 bps to 7.5% from 7.0% against our expectations. Additionally, the Kenya National Bureau of Statistics (KNBS) released the y/y inflation for the month of May 2022 highlighting that the inflation rate increased to 7.1%, from the 6.5% recorded in April 2022, in line with our expectations;
Equities
During the month of May, the equities market was on a downward trajectory, with NASI, NSE 20 and NSE 25 declining by 14.3%, 6.6% and 9.7%, respectively. The equities market performance was driven by losses recorded by large cap stocks such as Safaricom, Co-operative and Bamburi of 22.3%, 13.8% and 12.8%, respectively. The losses were however mitigated by gains recorded by stocks such as ABSA, KCB Group and NCBA of 5.2%, 3.3% and 1.7%, respectively;
Also during the week, Standard Africa Holdings Limited, (SAHL), the majority shareholder in Stanbic Holdings announced that it had completed the acquisition of the additional shares in Stanbic Holdings bringing its overall shareholding to 296,188,531 shares amounting to 74.9%;
Real Estate
During the month, the Central Bank of Kenya (CBK) released the Monetary Policy Committee Hotels Survey-May 2022, highlighting that all the sampled hotels indicated that they were in operation, representing a 6.0% points increase to 100.0% in May 2022, from the 94.0% operation rate in May 2021. In the mixed-use developments sector, Safaricom Pension Scheme announced plans to officially open its Kshs 4.3 bn Crystal Rivers mixed-use development located in Athi River, Machakos county in June 2022. In the infrastructure sector, the government announced that the dualling of the Kshs 16.7bn, 84.0 km Kenol- Marua road is set for completion by December 2022. Additionally, the 27.1 km Nairobi Expressway was launched on a trial basis in mid May 2022. In Listed Real Estate, the ILAM Fahari I-REIT closed the month of May trading at an average price of Kshs 5.6 per share. This represented a 5.1% and 12.5% Month-to-Date (MTD) and Year-to-Date (YTD) decline respectively, from Kshs 5.9 per share and Kshs 6.4 per share, respectively;
Focus of the Week
Following the release of FY’2021 results by insurance companies, this week we analyze the performance of the 5 listed insurance companies in Kenya, identify the key factors that influenced their performance, and give our outlook for the insurance sector going forward.
Investment Updates:
- Weekly Rates:
- Cytonn Money Market Fund closed the week at a yield of 10.53%. To invest, dial *809# or download the Cytonn App from the Google Play Store or Apple App Store;
- Cytonn High Yield Fund closed the week at a yield of 14.10% p.a. To invest, email us at sales@cytonn.com and to withdraw the interest, dial *809# or download the Cytonn App from Google Play Store or Apple App Store;
- On our weekly Twitter Spaces session, we had a discussion on the Real Estate Performance in an Election Year. The panel included Tony Oyenekan, Head of Research – Diya Fatimilehin & Co, Effie Awuor- Real Estate Research Coordinator at Cytonn, and was moderated by Fidelis Wanalwenge – Real Estate Research Analyst at Cytonn Investments. Listen to the conversation here,
- We continue to offer Wealth Management Training every Thursday and every third Saturday of the month, from 9:00 am to 11:00 am, through our Cytonn Foundation. The training aims to grow financial literacy among the general public. To register for any of our Wealth Management Trainings, click here;
- If interested in our Private Wealth Management Training for your employees or investment group, please get in touch with us through wmt@cytonn.com;
- Any CHYS and CPN investors still looking to convert through assignment of debt are welcome to consider one of the five projects currently available for assignment, click here for the latest term sheet;
- Cytonn Insurance Agency acts as an intermediary for those looking to secure their assets and loved ones’ future through insurance namely; Motor, Medical, Life, Property, WIBA, Credit and Fire and Burglary insurance covers. For assistance, get in touch with us through insuranceagency@cytonn.com;
- Cytonnaire Savings and Credit Co-operative Society Limited (SACCO) provides a savings and investments avenue to help you in your financial planning journey. To enjoy competitive investment returns, kindly get in touch with us through clientservices@cytonn.com;
Real Estate Updates:
- For an exclusive tour of Cytonn’s Real Estate developments, visit: Sharp Investor's Tour, and for more information, email us at sales@cytonn.com;
- Phase 3 of The Alma is now ready for occupation. To rent please email properties@cytonn.com;
- We expect to go back to site in June to complete Phase 4 of the Alma
- We have 8 investment-ready projects, offering attractive development and buyer targeted returns; See further details here: Summary of Investment-ready Projects;
- For recent news about the group, see our news section here;
Hospitality Updates:
We currently have promotions for Staycations. Visit cysuites.com/offers for details or email us at sales@cysuites.com;
Money Markets, T-Bills & T-Bonds Primary Auction:
During the month of May, T-bills remained undersubscribed, with the overall subscription rate coming in at 92.2%, up from the 59.4% recorded in April 2022. The increase in the subscription rate was partly attributable to the increasing yields and partly due to the eased liquidity in the money market with the average interbank rate declining to 4.6%, from 4.7% recorded in April 2022. The overall subscription rates for the 91-day, 182-day and 364-day papers increased to 133.4%, 66.9% and 101.0%, from 105.5%, 46.7% and 53.6%, respectively, recorded in April 2022. The average yields on the 364-day, 182-day and 91-day papers increased by 10.3 bps, 42.3 bps and 26.5 bps to 9.9%, 8.7% and 7.7%, respectively. For the month of May, the government accepted a total of Kshs 103.5 bn out of the Kshs 110.6 bn worth of bids received, translating to a 93.5% acceptance rate.
During the week, T-bills remained undersubscribed with the overall subscription rate coming in at 86.3%, up from the 54.4% recorded the previous week. The undersubscription was partly attributable to the tightened liquidity in the money market with the average interbank rates increasing to 4.8%, from the 4.6% recorded the previous week. The highest subscription rate was in the 91-day paper which came in at 210.1%, up from the 12.4% recorded the previous week, partly attributable to the high returns on a risk adjusted basis. The subscription rate for the 182-day paper also increased to 72.7%, from 28.5%, while that of the 364-day paper declined to 50.3% from 97.2% recorded the previous week. The yields on the government papers were on an upward trajectory with the yields on the 364-day, 182-day and 91-day papers increasing by 5.4 bps, 7.3 bps and 6.7 bps to 9.9%, 9.0% and 7.8%, respectively.
In the primary bond market, the government released the auction results for the two bonds, FXD1/2022/10 and FXD1/2021/25, that were issued for the month of May highlighting that the bonds recorded an undersubscription of 71.9%. As such, the government issued the bonds on tap - sale seeking to raise Kshs 10.0 bn. The bonds were oversubscribed, receiving bids worth Kshs 17.0 bn against the offered Kshs 10.0 bn, translating to a subscription rate of 170.1%. The average tenor for the May bonds came in at 14.7 years while that of April, stood at 9.0 years. The weighted average rate of accepted bids for the May bonds was 13.7%, 0.8% points higher than the 12.9% average rate for the April bonds. The table below provides more details on the bonds issued during the month:
|
Issue Date |
Bond Auctioned |
Tenor to Maturity (Years) |
Coupon |
Amount offered (Kshs bn) |
Actual Amount Raised (Kshs bn) |
Total bids received (Kshs bn) |
Average Accepted Yield |
Subscription Rate |
Acceptance Rate |
|
16-May-22 |
FXD1/2022/10 |
10.0 |
13.5% |
60.0 |
31.7 |
43.1 |
13.5% |
71.9% |
73.6% |
|
FXD1/2021/25 |
24.1 |
13.9% |
14.0% |
||||||
|
23-May-22 |
FXD1/2022/10 – Tap-sale |
10.0 |
13.5% |
10.0 |
17.0 |
17.0 |
13.5% |
170.0% |
100.1% |
|
FXD1/2021/25 –Tap-sale |
24.1 |
13.9% |
13.9% |
||||||
|
May 2022 Average |
14.7 |
13.6% |
35.0 |
24.4 |
30.1 |
13.7% |
120.9% |
86.8% |
|
|
April 2022 Average |
9.0 |
12.9% |
35.0 |
30.4 |
33.3 |
12.9% |
96.8% |
91.1% |
|
For the month of June 2022, the government issued a new 18-year infrastructure bond, IFB1/2022/18 with a tenor of 18 years in a bid to raise Kshs 75.0 bn for funding Infrastructure projects. The period of sale runs from 23rd May 2022 to 7th June 2022. Key to note, the bond’s coupon rate will be market-determined. We anticipate an oversubscription and a higher acceptance rate given the relatively ample liquidity in the money market coupled with the attractive tax-free nature of the bond and expected high coupon rate. Our recommended bidding range for the bond is 12.9%-13.3% within which bonds of a similar tenor are trading.
Secondary Bond Market:
In the month of May 2022, the yields on government securities in the secondary market remained relatively stable, with the FTSE NSE bond index remaining relatively unchanged at Kshs 94.8, as recorded in April 2022, bringing the YTD performance to a decline of 1.3%. The chart below shows the yield curve movement during the period:
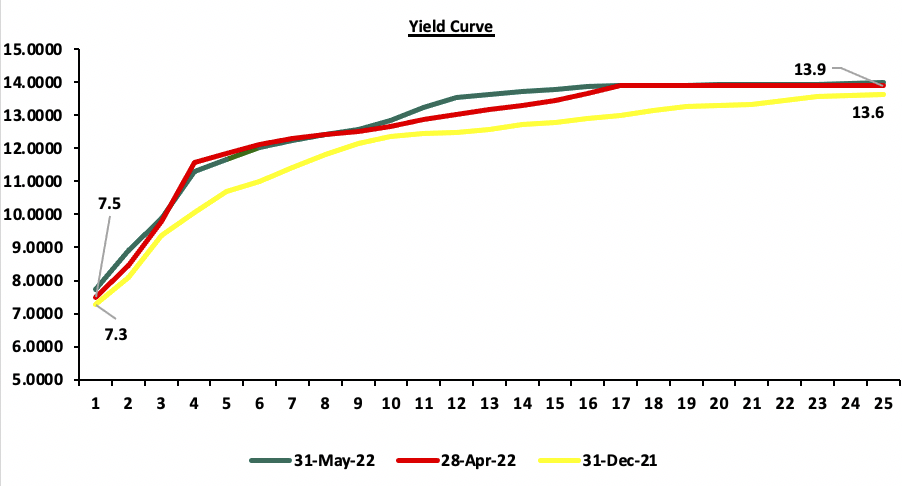
The secondary bond turnover declined by 17.4% to Kshs 58.6 bn, from Kshs 70.9 bn recorded in April 2022, pointing towards decreased activity by commercial banks in the secondary bonds market. On a year on year basis, the bonds turnover increased by 18.4% to Kshs 876.5 bn, from Kshs 740.1 bn worth of treasury bonds transacted over a similar period last year.
Money Market Performance
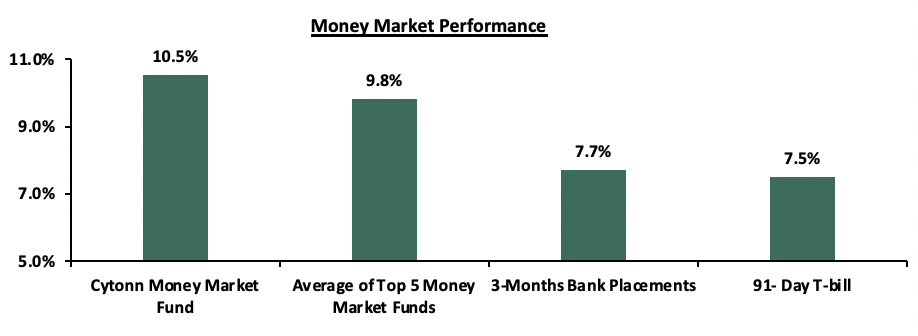
In the money markets, 3-month bank placements ended the week at 7.7% (based on what we have been offered by various banks), while the yield on the 91-day T-bill increased by 10.3 bps to 7.8%. The average yield of the Top 5 Money Market Funds and the yield on the Cytonn Money Market Fund remained relatively unchanged at 9.8% and 10.5%, respectively as recorded the previous week.
The table below shows the Money Market Fund Yields for Kenyan Fund Managers as published on 03rd June 2022:
|
Money Market Fund Yield for Fund Managers as published on 3rd June 2022 |
||
|
Rank |
Fund Manager |
Effective Annual Rate |
|
1 |
Cytonn Money Market Fund |
10.5% |
|
2 |
Zimele Money Market Fund |
9.9% |
|
3 |
Nabo Africa Money Market Fund |
9.8% |
|
4 |
Madison Money Market Fund |
9.4% |
|
5 |
Apollo Money Market Fund |
9.4% |
|
6 |
Sanlam Money Market Fund |
9.4% |
|
7 |
CIC Money Market Fund |
9.0% |
|
8 |
Dry Associates Money Market Fund |
8.9% |
|
9 |
Co-op Money Market Fund |
8.9% |
|
10 |
ICEA Lion Money Market Fund |
8.8% |
|
11 |
GenCap Hela Imara Money Market Fund |
8.6% |
|
12 |
Orient Kasha Money Market Fund |
8.6% |
|
13 |
NCBA Money Market Fund |
8.4% |
|
14 |
AA Kenya Shillings Fund |
7.9% |
|
15 |
British-American Money Market Fund |
7.4% |
|
16 |
Old Mutual Money Market Fund |
7.0% |
Source: Business Daily
Liquidity:
Liquidity in the money markets eased in the month of May 2022, with the average interbank rate declining to 4.6%, from 4.7%, recorded in April 2022. However, during the week, liquidity in the money markets tightened, with the average interbank rate increasing to 4.8%, from 4.6%, as recorded the previous week, partly attributable to tax remittances, which offset government payments. The average interbank volumes traded increased by 40.5% to Kshs 20.2 bn from Kshs 14.4 bn recorded the previous week.
Kenya Eurobonds:
During the month, the yields on the Eurobonds were on an upward trajectory partly attributable to investors attaching higher risk premium on the country due to perceived higher risks arising from increasing inflationary pressures and local currency depreciation. The yield on the 10-year Eurobond issued in 2014 was the largest gainer increasing by 1.7% points to 10.4% from 8.7%, recorded in April 2022 while the yield on the 30-year Eurobond issued in 2018 was the largest decliner decreasing by 0.3% points to 10.7%, from 11.0%, recorded in April 2022.
During the week, the yields on Eurobonds were on an upward trajectory with the yield on the 10-year Eurobond issued in 2014 increasing the most by 0.7% points to 11.0%, from10.3%, recorded the previous week. The table below shows the summary of the performance of the Kenyan Eurobonds as of 2nd May 2022;
|
Kenya Eurobond Performance |
||||||
|
|
2014 |
2018 |
2019 |
2021 |
||
|
Date |
10-year issue |
10-year issue |
30-year issue |
7-year issue |
12-year issue |
12-year issue |
|
03-Jan-22 |
4.4% |
8.1% |
8.1% |
5.6% |
6.7% |
6.6% |
|
29-Apr-22 |
8.7% |
10.0% |
11.0% |
10.5% |
10.4% |
10.0% |
|
27-May-22 |
10.3% |
10.0% |
10.8% |
10.4% |
10.0% |
9.6% |
|
30-May-22 |
10.3% |
10.0% |
10.8% |
10.4% |
10.0% |
9.6% |
|
31-May-22 |
10.4% |
10.1% |
10.7% |
10.6% |
10.3% |
9.8% |
|
01-Jun-22 |
10.8% |
10.3% |
10.9% |
10.6% |
10.4% |
9.8% |
|
02-Jun-22 |
11.0% |
10.3% |
11.0% |
10.8% |
10.5% |
9.9% |
|
Weekly Change |
0.7% |
0.3% |
0.2% |
0.4% |
0.5% |
0.3% |
|
m/m |
1.7% |
0.1% |
(0.3%) |
0.1% |
(0.2%) |
(0.2%) |
|
YTD Change |
6.6% |
2.2% |
2.9% |
5.2% |
3.8% |
3.3% |
Source: Central Bank of Kenya (CBK)
Kenya Shilling:
During the month, the Kenya Shilling depreciated by 0.8% against the US Dollar, to close the month at Kshs 116.7, from Kshs 115.8 recorded at the end of April 2022, driven by the increased dollar demand from oil and merchandise importers on the back of increased global oil prices against slower recovery in exports and in the tourism sector.
During the week, the Kenyan shilling depreciated marginally by 0.1% against the US dollar to close the week at Kshs 116.8, from Kshs 116.7 recorded the previous week, partly attributable to increased dollar demand from the oil and energy sectors as well as the manufacturing sectors. Key to note, this is the lowest the Kenyan shilling has ever depreciated against the dollar. On a year to date basis, the shilling has depreciated by 3.3% against the dollar, in comparison to the 3.6% depreciation recorded in 2021. We expect the shilling to remain under pressure in 2022 as a result of:
- Rising global crude oil prices on the back of supply constraints and geopolitical pressures at a time when demand is picking up with the easing of COVID-19 restrictions and as economies reopen. Key to note, risks abound the recovery following the emergence of the new COVID-19 variants,
- Increased demand from merchandise traders as they beef up their hard currency positions in anticipation for more trading partners reopening their economies globally,
- An ever-present current account deficit due to an imbalance between imports and exports, with Kenya’s current account deficit estimated to come in at 5.1% of GDP in the 12 months to April 2022 compared to the 4.8% for a similar period in 2021. The wider deficit reflects a higher import bill, particularly for oil, which more than offset increased receipts from agricultural and services exports, and remittances, and,
- The aggressively growing government debt, with Kenya’s public debt having increased at a 10-year CAGR of 18.6% to Kshs 8.2 tn in December 2021, from Kshs 1.5 tn in December 2011 thus putting pressure on forex reserves to service some of the public debt. It is worth noting that the average GDP growth over the same period has been 3.9%, an indicator that the increase in debt is not translating into GDP growth.
The shilling is however expected to be supported by:
- High Forex reserves currently at USD 8.2 bn (equivalent to 4.9-months of import cover), which is above the statutory requirement of maintaining at least 4.0-months of import cover, and the EAC region’s convergence criteria of 4.5-months of import cover. In addition, the reserves were boosted by the USD 750.0 mn World Bank loan facility received in March 2022 and are expected to be boosted further by the expected USD 244.0 mn from the International Monetary Fund (IMF), and,
- Improving diaspora remittances evidenced by an 18.6% y/y increase to USD 355.0 mn as of April 2022, from USD 299.3 mn recorded over the same period in 2021which has continued to cushion the shilling against further depreciation. In the recently released April 2022 diaspora remittances figures, North America remained the largest source of remittances to Kenya accounting for 61.7% in the period, followed by Europe at 17.2% while the rest of the world accounted for 21.1% of the total.
Weekly Highlights:
I. May 2022 MPC Meeting
The Monetary Policy Committee (MPC) met on May 30th, 2022 to review the outcome of its previous policy decisions and recent economic developments, and to decide on the direction of the Central Bank Rate (CBR). For the first time since April 2020, the MPC increased the Central Bank Rate by 50.0 bps to 7.5% from 7.0% against our expectations. We expected the MPC to maintain a cautious wait-and-see approach during the May sitting as it continues to monitor the country's economic recovery, with a focus on the need to stimulate economic growth rather than curtail post-pandemic recovery, given that Kenya’s economy recorded an impressive growth of 7.5% in 2021. Below are some of the key highlights from the meeting:
- Risks lie on the downside on the inflation outlook mainly due to increased global commodity prices and supply chain disruptions. The overall inflation increased to 6.5% in April 2022, from 5.6% in March 2022, mainly attributable to the increase in the food and fuel prices which increased by 12.1% and 8.5%, respectively,
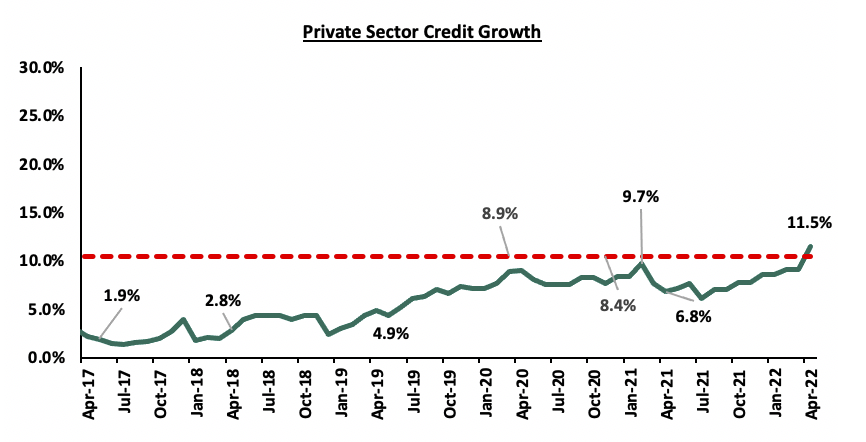
- Private sector credit growth continues to recover, having grown by 11.5% in April 2022 as compared to 6.8% over the same period in 2021. The key sectors that have experienced increased lending include transport and communication, 28.9%, manufacturing, 12.0% and trade, 10.7%. the chart below shows the movement of the private sector credit growth over the last five years:
- The recently released GDP data by Kenya National Bureau of Statistics (KNBS) on the Economic Survey 2022, indicate that the Kenyan economy recorded a 7.5% growth in FY’2021, up from the 0.3% contraction recorded in FY’2020. The growth was mainly driven by the resumption of most economic activities following the lifting of COVID-19 containment measures put in place in 2020 to curb the spread of the virus, which led to the recovery of most sectors of the economy,
- The current account deficit to GDP is estimated at 5.1% in the 12 months to April 2022, a 1.0% point lower than the 5.2% that was recorded in a similar period in 2020. Exports of goods remained strong, growing by 11.1% in the 12 months to April 2022 but was slower than the 12.1% growth recorded in the twelve months to February 2022. Receipts from exports of manufactured and tea goods increased by 25.2% and 1.3%, respectively, while horticulture exports declined by 2.2% in the period of review, and,
- The Committee noted the steady implementation of the FY2021/22 Government Budget, particularly the strong revenue performance in April 2022 with the total revenues collected amounting to Kshs 1.5 tn, having out-performed the target by 2.0%, reflect enhanced tax collection efforts and increased economic activity. The Economic Stimulus Programme in the FY2022/23 Government Budget is expected to continue to enhance revenue collection and hence reduce the over-reliance on debt.
The MPC concluded that there was a scope for tightening of the monetary policy given the high rate of inflation which is expected to continue increasing on the back of rising global fuel and commodity prices. The MPC therefore decided to increase the Central Bank Rate (CBR) by 50.0 bps to 7.5%, from the previous 7.0%. In our view, the move by the MPC to increase the Central Bank Rate will not only anchor inflation expectations, but will also help prop the shilling given the current depreciation. The Committee will meet again in July 2022, but remains ready to re-convene earlier if necessary.
II. May 2022 inflation
The y/y inflation for the month of May 2022 increased to 7.1%, from the 6.5% recorded in April 2022, in line with our expectations. The increase was mainly attributable to the increase in the y/y Food and non-alcoholic beverages, household equipment, transport as well as housing, water, electricity, gas and other fuels, which increased by 12.4%, 7.9%, 6.4% and 6.0%, respectively. Food and non-alcoholic beverages index has had the greatest increase month on month increasing by 1.3%, mainly due to the supply constraints of production materials. The table below shows a summary of both the year on year and month on month commodity groups’ performance:
|
Major Inflation Changes – May 2022 |
|||
|
Broad Commodity Group |
Price change m/m (May-22/April -22) |
Price change y/y (May-22/ May-21) |
Reason |
|
Food & Non-Alcoholic Beverages |
1.3% |
12.4% |
The m/m increase was mainly contributed by increase in prices of fortified maize flour, cooking fat, cooking oil (salad) and fresh packeted cow milk. The increase was however mitigated by a decline in prices of kales, spinach and cabbages |
|
Housing, Water, Electricity, Gas and other Fuel |
0.6% |
6.0% |
The m/m increase was as a result of increase in prices of laundry/ bar soap and detergents, among other items |
|
Transport Cost |
0.8% |
6.4% |
The m/m increase was as a result of increase in prices of petrol and diesel by 3.8% and 4.4% to Kshs 150.1 per litre and Kshs 131.0 per litre, from Kshs 144.6 per litre and Kshs 125.5 per litre, respectively |
|
Overall Inflation |
0.8% |
7.1% |
The m/m increase was driven by a 1.3% increase in food & non-alcoholic beverages coupled with a 0.8% increase in transport costs |
Source: KNBS
Going forward, we expect the inflation pressures to remain elevated but within the government’s set range of 2.5% - 7.5% supported by the current fiscal stance by the Monetary Policy Committee, having increased the Central Bank Rate to 7.5% from 7.0%. However, concerns remain high on the rising food and fuel prices which are expected to put pressure on inflation, given that these are a major contributor to the inflation basket. Additionally, we believe that the fuel subsidy program by the National Treasury stands at risk of being depleted and is unsustainable, as evidenced by the increased compensation amounts which further increase the possibility of depletion. As such, fuel prices are likely to keep rising in tandem with the global fuel prices. Key to note, the cost of fuel has risen by 15.7%, 18.4% and 14.6% this year to Kshs 150.1 per litre, Kshs 131.1 per litre and Kshs 118.6 per litre in May 2022, from Kshs 129.7 per litre, Kshs 110.6 per litre and Kshs 103.5 per litre, in December 2021 for Super petrol, diesel and kerosene, respectively.
Monthly Highlights:
- Stanbic Bank released its monthly Purchasing Manager’s Index (PMI) highlighting that the index for the month of April 2022 declined to 49.5 from 50.5 recorded in March 2022 pointing towards a deterioration of the business environment in the Kenyan private sector. The decline was largely on the back of the high cost of living occasioned by the rising fuel prices and production costs. For more information, see our Cytonn Weekly #18/2022,
- The Kenya National Bureau of Statistics (KNBS) released the Economic Survey 2022, highlighting that the economy expanded by 7.5% in 2021 from the 0.3% contraction recorded in 2020. The growth was mainly driven by the resumption of most economic activities following the lifting of COVID-19 containment measures put in place in 2020 to curb the spread of the virus, which led to the recovery of most sectors of the economy. For more information, see our Cytonn Weekly #18/2022,
- The National Treasury gazetted the revenue and net expenditures for the first ten months of FY’2021/2022, ending 28th April 2022. Total revenue collected as at the end of April 2022 amounted to Kshs 1,536.8 bn, equivalent to 85.0% of the revised estimates of Kshs 1,808.3 bn and is 102.0% of the prorated estimates of Kshs 1,506.9 bn. For more information, see our Cytonn Weekly #19/2022, and,
- The Energy and Petroleum Regulatory Authority (EPRA) released their monthly statement on the maximum fuel price in Kenya effective 15th May 2022 to 14th June 2022. Notably, super petrol, diesel and kerosene prices increased by 3.8%, 4.4% and 4.9% to Kshs 150.1 per litre, Kshs 131.0 per litre and Kshs 118.9 per litre, from Kshs 144.6 per litre, Kshs 125.5 per litre and Kshs 113.4, respectively. For more information, see our Cytonn Weekly #19/2022.
Rates in the Fixed Income market have remained stable due to the relatively ample liquidity in the money market. The government is 3.5% behind its prorated borrowing target of Kshs 625.7 bn having borrowed Kshs 603.7 bn of the Kshs 664.0 bn borrowing target for the FY’2021/2022. We expect a gradual economic recovery as evidenced by the revenue collections of Kshs 1.5 tn during the first ten months of the current fiscal year, which was equivalent to 102.0% of the prorated revenue collection target. However, despite the projected high budget deficit of 8.1% and the affirmation of the `B+’ rating with negative outlook by Fitch Ratings, we believe that the support from the IMF and World Bank will mean that the interest rate environment will remain stable since the government is not desperate for cash. Owing to this, our view is that investors should be biased towards short-term fixed-income securities to reduce duration risk.
Markets Performance
During the month of May, the equities market was on a downward trajectory, with NASI, NSE 20 and NSE 25 declining by 14.3%, 6.6% and 9.7%, respectively. The equities market performance was driven by losses recorded by large cap stocks such as Safaricom, Co-operative and Bamburi of 22.3%, 13.8% and 12.8%, respectively. The losses were however mitigated by gains recorded by stocks such as ABSA, KCB and NCBA of 5.2%, 3.3% and 1.7%, respectively.
During the week, the equities market recorded mixed performance, with NASI declining by 0.3%, NSE 20 increasing by 0.7% while NSE 25 remained unchanged taking the YTD performance to losses of 22.6%, 11.2% and 18.4% for NASI, NSE 20 and NSE 25 respectively. The performance was driven by losses recorded by large cap stocks such as Co-operative, Bamburi and NCBA which declined by 8.4%, 8.1%, 1.5%, respectively, while EABL and Safaricom both declined by 0.9%. The losses were however mitigated by gains recorded by banking stocks such as Diamond Trust Bank Kenya (DTB-K), ABSA, Equity Group and KCB Group of 10.0%, 4.5%, 3.4% and 1.8%, respectively.
Equities turnover increased by 83.0% during the month to USD 92.6 mn, from USD 50.6 mn recorded in April 2022. Foreign investors remained net sellers during the month, with a net selling position of USD 36.2 mn, compared to April’s net selling position of USD 14.3 mn.
During the week, equities turnover decreased by 51.5% to USD 17.6 mn, from USD 36.3 mn recorded the previous week, taking the YTD turnover to USD 395.9 mn. Foreign investors remained net sellers, with a net selling position of USD 5.4 mn, from a net selling position of USD 14.2 mn recorded the previous week, taking the YTD net selling position to USD 68.9 mn.
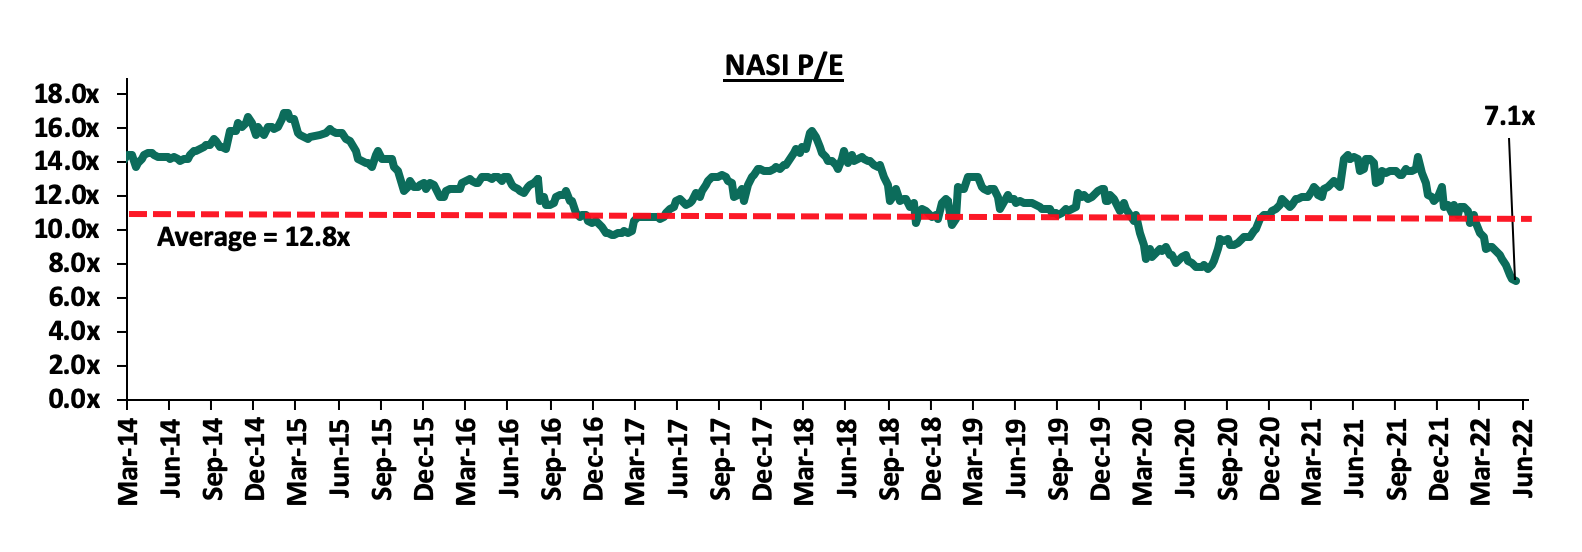
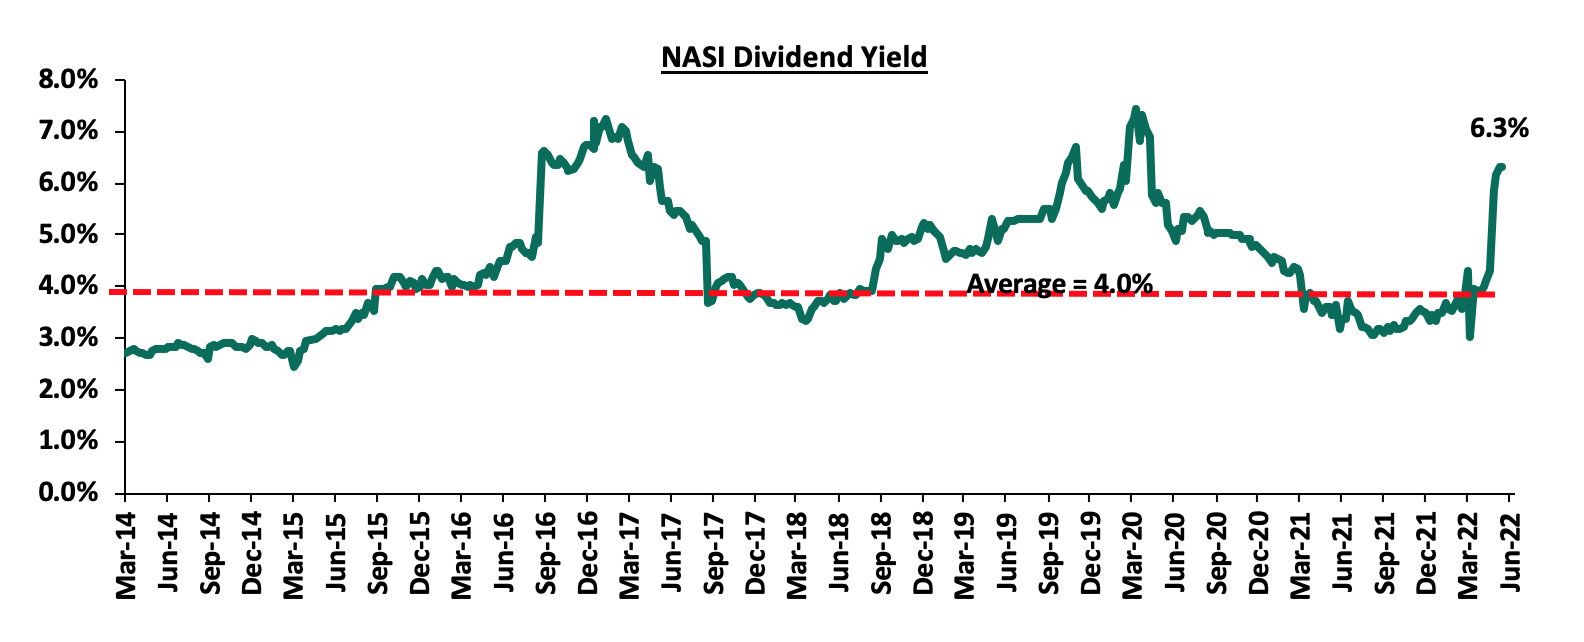
The market is currently trading at a price to earnings ratio (P/E) of 7.1x, 44.9% below the historical average of 12.8x, and a dividend yield of 6.3%, 2.3% points above the historical average of 4.0%. Key to note, NASI’s PEG ratio currently stands at 0.9x, an indication that the market is undervalued relative to its future growth. A PEG ratio greater than 1.0x indicates the market may be overvalued while a PEG ratio less than 1.0x indicates that the market is undervalued. The charts below indicate the historical P/E and dividend yields of the market:
Monthly highlights:
- The Capital Markets Authority (CMA) announced that it had made public the Draft Capital Markets Public Offers Listing and Disclosures Regulations 2022, which are meant to replace the Public Offers Listing and Disclosures Regulations 2002, which have been in place since 2002, with the only amendments done in 2016. The main aim of the Draft Regulations is to provide a more enabling environment in Kenya’s Capital Markets in order to spur more listings in the Nairobi Securities Exchange. For more information, please see our Cytonn Weekly #18/2022,
- Sanlam Limited, a South African financial services group listed on the Johannesburg Stock Exchange, announced that it had entered into a definitive Joint Venture agreement for a term of 10 years with Allianz SE, a global integrated financial services firm listed on the Frankfurt Stock Exchange with the aim to leverage on the two entities footprints in Africa and create a leading Pan-African financial services group, with an estimated equity value of Kshs 243.7 bn. For more information, please see our Cytonn Weekly #18/2022,
- Equity Group and the International Finance Corporation (IFC) signed a partnership agreement in support of the sustainable development of Africa strategic plan by the Group which saw IFC and its partners commit USD 165.0 mn (Kshs 19.2 bn) towards Equity’s `Africa Recovery and Resilience Plan’. Also during the week, Safaricom Limited released their results for the year ended 31st March 2022, highlighting a core earnings per share increase of 1.8% to Kshs 1.74, from Kshs 1.71 in FY’2021 partly attributable to the 30.3% increase in M-PESA revenue to Kshs 107.7 bn, from Kshs 82.6 bn in FY’2021. Lastly, Equity Group, Stanbic Group, and HF Group released their Q1’2022 financial results, indicating an increase in Earnings per Share of 36.0%, 12.0% and 117.8%, respectively. For more information, please see our Cytonn Weekly #19/2022, and,
- According to Equity Group Holdings (EGH) annual report FY’2021, as at the end of FY’2021, EGH made an initial Investment of Kshs 400.0 mn in Equity Group Insurance Holdings Limited, a non-operating insurance holding company incorporated in January 2022. Also during the week, Standard Chartered Bank of Kenya Plc released their Q1’2022 financial results, indicating an increase in Earnings per share of 15.6% to Kshs 7.3, from Kshs 6.3 recorded in Q1’2021. For more information, please see our Cytonn Weekly #20/2022.
Weekly Highlight
Standard Africa Holdings Limited completes acquisition of additional stake in Stanbic Holdings
During the week, Standard Africa Holdings Limited, (SAHL), the majority shareholder in Stanbic Holdings announced that it had completed the acquisition of additional shares in the company, raising its total shareholding to 296,188,531 shares equivalent to 74.9% of the company’s ownership. This comes three months after SAHL received regulatory approval from the Capital Markets Authority, for further extension of the exemption from making a full take-over under the Capital Markets (Take over and Mergers) Regulations, 2002. SAHL had targeted to acquire a maximum of 10.6 mn ordinary shares in Stanbic to bring its total shareholding up to 75.0% of Stanbic Holdings’ ordinary shares, and has since sought extensions to enable them meet their target. For more information, see our Cytonn Weekly #07/2022. After acquiring 74.9% of Stanbic Holdings, SAHL has ceased acquiring any additional shares in the entity. The table below highlights the performance of the share purchase as at 31st May 2022:
|
Period |
Shares acquired |
% acquired |
|
December 2017 |
177,713,118.6 |
60.0% |
|
March 2018 – July 2018 |
31,656,612.0 |
8.0% |
|
July 2018 - November 2019 |
4,309,756.0 |
1.1% |
|
November 2019 - December 2020 |
8,146,241.0 |
2.1% |
|
January 2021 - December 2021 |
4,289,769.0 |
1.1% |
|
January 2022 – May 2022 |
70073034.4 |
2.6% |
|
Total |
296,188,531.0 |
74.9% |
Source: Stanbic Holdings Annual Reports
SAHL's completion of Stanbic Holdings acquisition, is expected to boost the positive sentiments about the Kenyan Banking industry and in turn increase investor confidence, especially at a period that has seen dwindling share prices as a result of increased sell-offs by foreign investors. Key to note, Stanbic Bank has continued to recover from the effects of the harsh business environment brought about by the COVID-19 pandemic and proves to be a profitable business with the Profits After Tax for Q1'2022 having increased by 12.0% to Kshs 2.1 bn, from Kshs 1.9 bn in Q1'2021. Further, Kenya being one of SAHL’s strategic growth markets, we expect to see a number of innovative moves aimed at increasing the company’s revenues and supporting its growth strategies. We also expect increased activity in share repurchase and buyback activity in the bourse from companies whose prices and valuations are currently low. The move by the CMA to allow for exemptions from making full take overs is also commendable as it allows for investors to increase their shareholding by carrying out on-market trading to acquire a higher stake, as compared to having to acquire the entire entities.
Universe of coverage:
|
Company |
Price as at 27/05/2023 |
Price as at 31/05/2022 |
Price as at 03/06/2022 |
w/w change |
m/m change |
YTD Change |
Year Open 2022 |
Target Price* |
Dividend Yield |
TBV/Share |
P/TBv Multiple |
Recommendation |
|
I&M Group*** |
17.1 |
17.1 |
17.0 |
(0.3%) |
(6.3%) |
(20.3%) |
21.4 |
25.4 |
8.8% |
36.3 |
0.5x |
Buy |
|
Kenya Reinsurance |
2.1 |
2.1 |
2.1 |
2.9% |
(4.7%) |
(10.5%) |
2.3 |
3.2 |
4.9% |
12.4 |
0.2x |
Buy |
|
Jubilee Holdings |
267.0 |
269.0 |
266.0 |
(0.4%) |
1.1% |
(15.7%) |
316.8 |
379.4 |
5.2% |
548.8 |
0.5x |
Buy |
|
Liberty Holdings |
5.5 |
5.5 |
5.5 |
0.4% |
(2.5%) |
(22.4%) |
7.1 |
7.8 |
0.0% |
13.5 |
0.4x |
Buy |
|
Co-op Bank*** |
12.0 |
11.3 |
11.0 |
(8.4%) |
(5.9%) |
(8.1%) |
13.0 |
14.6 |
8.4% |
13.3 |
0.8x |
Buy |
|
ABSA Bank*** |
10.1 |
10.3 |
10.5 |
4.5% |
0.7% |
(14.5%) |
11.8 |
13.4 |
10.9% |
10.0 |
1.1x |
Buy |
|
KCB Group*** |
38.0 |
38.1 |
38.7 |
1.8% |
1.5% |
(16.6%) |
45.6 |
50.5 |
7.9% |
49.1 |
0.8x |
Buy |
|
Equity Group*** |
44.0 |
45.5 |
45.5 |
3.4% |
(8.1%) |
(16.6%) |
52.8 |
56.2 |
6.8% |
38.8 |
1.2x |
Buy |
|
Standard Chartered*** |
124.0 |
123.8 |
123.8 |
(0.2%) |
(3.5%) |
(4.6%) |
130.0 |
147.1 |
11.3% |
127.0 |
1.0x |
Buy |
|
Diamond Trust Bank*** |
50.0 |
54.8 |
55.0 |
10.0% |
(9.1%) |
(16.0%) |
59.5 |
65.6 |
6.0% |
231.5 |
0.2x |
Buy |
|
Britam |
6.4 |
6.4 |
6.3 |
(2.5%) |
(4.7%) |
(14.8%) |
7.6 |
7.7 |
0.0% |
6.0 |
1.0x |
Buy |
|
NCBA*** |
26.9 |
25.6 |
26.5 |
(1.5%) |
3.3% |
5.5% |
25.5 |
28.2 |
11.2% |
41.7 |
0.6x |
Accumulate |
|
Sanlam |
14.0 |
14.0 |
13.9 |
(0.7%) |
37.9% |
21.2% |
11.6 |
15.9 |
0.0% |
9.5 |
1.5x |
Accumulate |
|
Stanbic Holdings |
108.0 |
104.8 |
104.0 |
(3.7%) |
2.6% |
24.1% |
87.0 |
107.2 |
8.3% |
111.7 |
0.9x |
Accumulate |
|
CIC Group |
2.0 |
2.0 |
2.0 |
0.5% |
(5.2%) |
(8.3%) |
2.2 |
2.1 |
0.0% |
2.9 |
0.7x |
Hold |
|
HF Group |
3.0 |
3.1 |
3.1 |
3.7% |
(0.3%) |
(21.3%) |
3.8 |
2.5 |
0.0% |
19.2 |
0.2x |
Sell |
|
Target Price as per Cytonn Analyst estimates **Upside/ (Downside) is adjusted for Dividend Yield ***For Disclosure, these are stocks in which Cytonn and/or its affiliates are invested in |
||||||||||||
We are “Neutral” on the Equities markets in the short term. With the market currently trading at a discount to its future growth (PEG Ratio at 0.9x), we believe that investors should reposition towards value stocks with strong earnings growth and that are trading at discounts to their intrinsic value. We expect the discovery of new COVID-19 variants, the upcoming Kenyan general elections and the slow vaccine rollout to continue weighing down the economic outlook. On the upside, we believe that the relaxation of COVID-19 containment measures in the country will lead to improved investor sentiments.
- Industry Reports
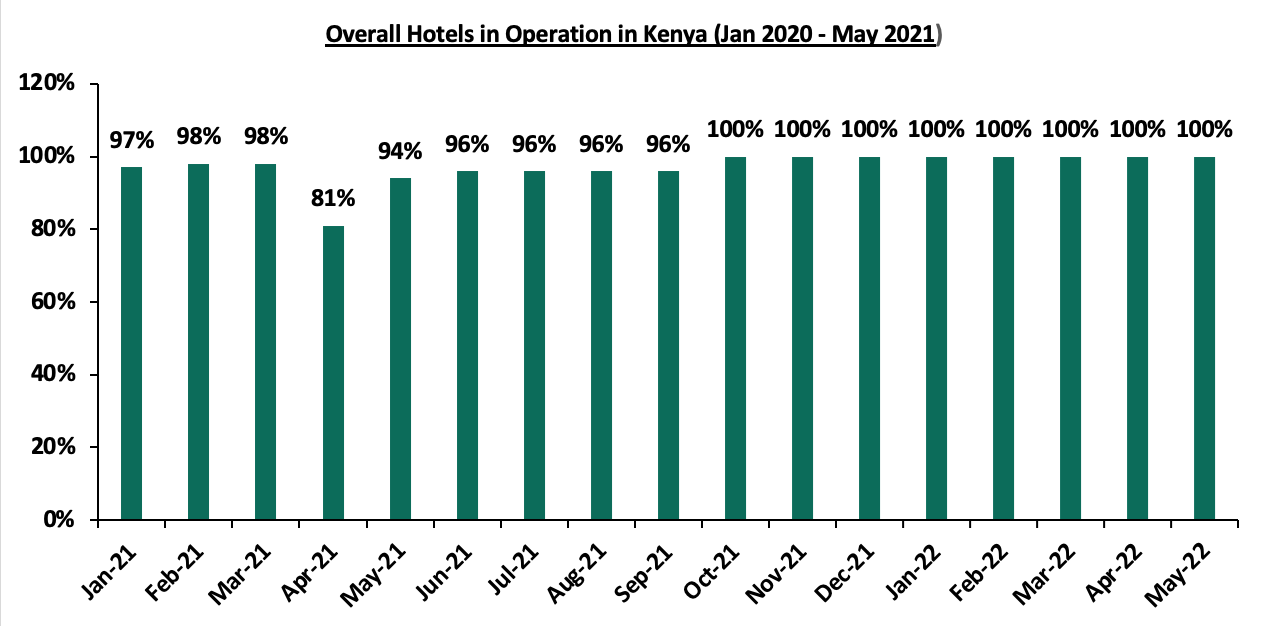
During the month, the Central Bank of Kenya (CBK) released the Monetary Policy Committee Hotels Survey-May 2022, a report which highlights the performance of hotels. The key take outs from the survey were;
- Overall, all the sampled hotels indicated that they were in operation, representing a 6.0% points increase to 100.0% in May 2022, from the 94.0% operation rate in May 2021. This was attributable to the improved business environment following mass vaccinations that encouraged relaxation of COVID-19 regulations, thus boosting meetings, Incentives, conferences, and, exhibitions. Additionally, two key hotels reopened in April and May 2022.The graph below shows the overall percentage of the number of operating hotels in Kenya between January 2021 to May 2021;
Source: Central Bank of Kenya (CBK)
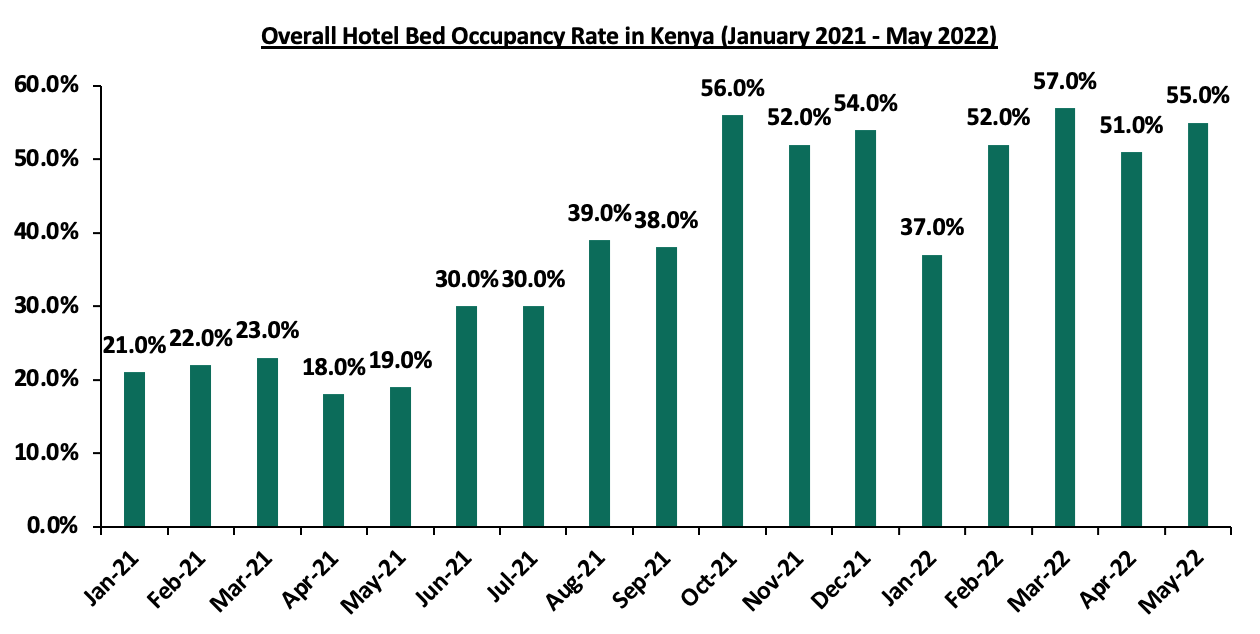
- The average bed occupancy in the month of May averaged at 55.0%, 4.0% points higher than 51.0% recorded in the month of April 2022. This was attributable to increased demand for hotels during the school holidays in March and April, particularly in Mombasa and Nairobi. The graph below highlights the hotel bed occupancy rates in Kenya between January 2021 to May 2022;
Source: Central Bank of Kenya (CBK)
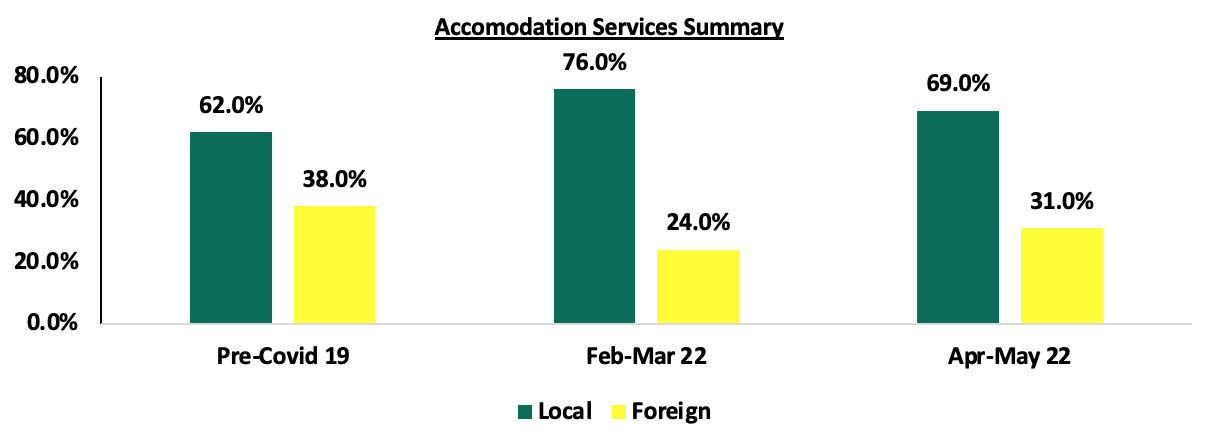
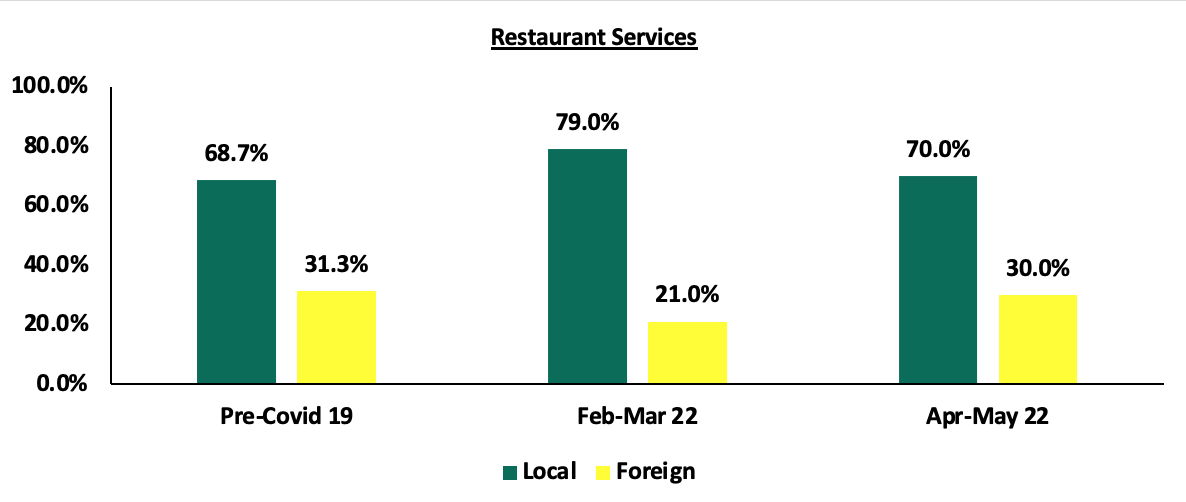
- Overall, local guests continued to account for majority of clientele population at 69.0% of accommodation and 70.0% restaurant services between April and May 2022, compared to 62.0% and 68.7%, respectively, during the period before the COVID-19 pandemic. The share of foreign clientele in accommodation increased by 7.0% points to 31.0% between April 2022 and May 2022 from 24.0% between February 2022 and March 2022. Foreign clients in the restaurant services also increased in the same period by 9.0% points to 30.0%, from 21.0%, following the increased tourist arrivals with the improving tourism activities. The graphs below indicate the summaries of accommodation and restaurant clients served by hotels in Kenya;
Source: Central Bank of Kenya (CBK)
Source: Central Bank of Kenya (CBK)
For the tourism industry, the sector has been on a recovery path, however data from Kenya National Bureau of Statistics(KNBS), so far indicates that the number of international visitors in Q1’2022 declined coming in at 225,321 from 240,019 in Q4’2021 attributed to continued Travel Advisories that might have a damping effect on this improvement.
Additionally, six other industry reports related to the Real Estate sector were released and the key take-outs were as follows;
|
# |
Theme |
Report |
Key Take-outs |
|
1 |
General Real Estate |
The Bank Supervision Annual Report 2021 by the Central Bank of Kenya |
· The residential mortgage market recorded a 0.9% decline in the number of mortgage loans accounts in the market, to 26,723 in December 2021 from 26,971 in December 2020. The decline was mainly attributed to a higher number of existing mortgage loan repayments outpacing the number of new loans issued. For more information, see Cytonn Weekly #21/2022. |
|
2 |
General Real Estate |
The Prime Global Cities Index - Q1’2022, by Knight Frank |
· The average selling prices for houses in the sampled prime cities globally recorded a capital appreciation of 2.2% q/q and 9.4% y/y. This was attributed to a high demand for decent houses across the globe, resulting from increasing population and urbanization growth rates, infrastructure developments which are mostly concentrated in the urban areas, and, adequate amenities enhancing investments. For more information, see Cytonn Weekly #20/2022. |
|
3 |
General Real Estate |
The Leading Economic Indicators March 2022, by Kenya National Bureau of Statistics |
· The overall number of tourist arrivals into Kenya via the Jomo Kenyatta International Airport (JKIA) and Moi International Airport (MIA) came in at 225,321 in Q1’2022. This is a 6.1% decline in the arrivals from the 240,019 visitors recorded in Q4’2021. The decline in the number of arrivals is due to the reduced tourism and leisure activities in the hospitality sector, as visitors embarked to their work and studies after the festive season. For more information, see Cytonn Weekly #20/2022. |
|
4 |
Residential Sector |
House Price Index Q1’2022, by Hass Consult |
· The average q/q selling prices for houses increased by 2.8% in Q1’2022 compared to a 3.0% increase in FY’2021, while on a y/y basis, the average selling prices appreciated by 6.8% compared to a (0.7%) price correction that was recorded in Q1’2021. For more information, see Cytonn Weekly #19/2022. |
|
5 |
Land Sector |
Land Price Index Q1’2022, by Hass Consult |
· The average q/q and y/y selling prices for land in the Nairobi suburbs appreciated by 0.1% and 1.1%, respectively, whereas the average q/q and y/y selling prices for land in the satellite towns of Nairobi increased by 2.2% and 7.4%, respectively. For more information, see Cytonn Weekly #19/2022. |
|
6 |
General Real Estate |
The Economic Survey 2022, by Kenya National Bureau of Statistics |
· The Real Estate Sector contribution to GDP came in at 8.9% in 2021, representing a 0.4% points decline from 9.3% recorded in 2020, attributed to the recovery of the sector following a tough economic environment caused by the pandemic. For more information, please see Cytonn Weekly #18/2022. |
The performance of the Real Estate sector is expected to be supported by an improvement in property prices and improved performance of the hospitality sector. The sector will be weighed down by the negative performance of the mortgage market and uncertainty brought about by the upcoming general elections that is expected to lead to reduced property transactions.
- Commercial Office Sector
During the month, the key highlight was that Housing Finance Group (HFG), a Kenyan financial institution, announced plans to sell its head office, Rehani House, located in Nairobi’s Central Business District by the end of 2022. The 13-storey building will be sold at an undisclosed amount, following the financier’s need to acquire additional capital to repay its loan obligations. For more information, please see Cytonn Weekly #20/2022.
- Retail Sector
During the month, the following activities took place in the retail sector;
- Naivas Supermarket opened a new outlet in Naivasha’s Safari Centre, along the Nairobi – Nakuru Highway. This brought the retailer’s operating outlets to 84, and the fifth to be opened so far in 2022. For more information, please see Cytonn Weekly #20/2022,
- Optica Limited, a local eye-wear retailer, opened two new outlets at Rubis Business Block in Kitengela, and in Argwing’s Arcade in Kilimani. This brought the retailer’s total number of operating outlets countrywide to 62. For more information, please see Cytonn Weekly #20/2022, and,
- ChicKing, an international fast food chain, in partnership with M/s Crispy Limited, a local franchise, announced plans to open 30 new outlets in Kenya, over the next five years. The Dubai-based restaurant chain that specializes in fried chicken, is expected to begin its expansion plans by opening two new outlets in Mombasa County, in June 2022. For more information, see Cytonn Weekly #19/2022.
Despite the entry and expansion by local and international retailers taking up space left by troubled retailers, the current oversupply of retail space at 3.0 mn SQFT in the Nairobi Metropolitan Area, and, 1.7 mn SQFT in the Kenyan retail market, may weigh down the optimum performance of the sector whose average rental yield stood at 7.9% as of Q1’2022.
- Mixed-Use Developments (MUDs)
During the week, Safaricom Staff Pension Scheme announced plans to officially open its Kshs 4.3 bn Crystal Rivers mixed-use development located in Athi River, Machakos county in June 2022. The project, which began construction in 2015, comprises of a mall sitting on 5.7 acres with 20,000 SQFT of letting floor space, and, 260 apartments and 138 townhouses sitting on 17.0 acres, which are open for sale to Safaricom pension scheme members and the general public. The following is a breakdown of units at the development;
|
Crystal Rivers Residential Development |
||||
|
Typology |
Units per Typology |
Unit Size (SQM) |
Unit Price (Kshs) |
Price per SQM (Kshs) |
|
3 bdr Apartment |
260 |
100 |
7.0 mn |
70,000 |
|
3 bdr Townhouse |
56 |
145 |
11.0 mn |
75,862 |
|
4 bdr Townhouse |
82 |
160 |
12.0 mn |
75,000 |
|
Average |
|
|
|
73,621 |
Source: Online Research
Demand for the housing units is expected to be driven by;
- The development offering relative affordability evidenced by an average price per SQM of Kshs 73,621 compared to the residential market average of 156,079 in Mombasa road where Athi River is categorized, according to our Nairobi Metropolitan Area (NMA) Mixed-Use Developments Report 2021,
- Proximity to the Nairobi Expressway, Standard Gauge Railway(SGR), and, the Jomo Kenyatta International Airport providing convenience to residents, and,
- The mall shopping experience that the MUD concept at the mall will provide to the residents of the gated community.
The decision by the firm to make investments along Mombasa Road is driven by;
- Improved infrastructure enhancing accessibility, due to rehabilitation of Mombasa road and construction of Nairobi Expressway,
- Relatively good average rental yield for commercial and retail spaces at 5.5% and 8.4% respectively, and,
- The growing number of Small and Medium-sized Enterprises (SMEs) attracting a working population hence ready market.
In terms of performance, Mombasa Road recorded high average rental yield of 7.4%, 0.2% points higher than the market average of 7.2%, hence the developer is leveraging on the remarkable performance as its basis of investments in the area. The table below shows the market performance by nodes of mixed-use developments in Nairobi Metropolitan Area;
(All Values in Kshs Unless Stated Otherwise)
|
Nairobi’s Mixed-Use Developments Market Performance by Nodes 2021 |
|||||||||||||
|
|
Retail Performance |
Commercial Office Performance |
Residential Performance |
||||||||||
|
Location |
Price/SQFT |
Rent/SQFT |
Occup. (%) |
Rental Yield (%) |
Price/ SQFT |
Rent/SQFT |
Occup. %) |
Rental Yield (%) |
Price/ SQM |
Rent/ SQM |
Annual Uptake % |
Rental Yield % |
Average MUD yield |
|
Karen |
23,333 |
196 |
86.7% |
8.8% |
13,233 |
117 |
85.0% |
9.0% |
8.7% |
||||
|
Westlands |
15,833 |
173 |
70.8% |
9.5% |
12,892 |
110 |
71.7% |
7.3% |
211,525 |
1,226 |
15.6% |
7.0% |
7.8% |
|
Kilimani |
18,500 |
162 |
79.0% |
8.3% |
13,713 |
106 |
79.0% |
6.7% |
7.4% |
||||
|
Mombasa Rd |
20,000 |
185 |
70.0% |
8.4% |
13,000 |
100 |
60.0% |
5.5% |
156,079 |
853 |
13.3% |
6.6% |
7.4% |
|
Thika Rd |
23,750 |
215 |
82.5% |
9.2% |
13,250 |
105 |
72.5% |
6.9% |
128,545 |
612 |
17.9% |
6.1% |
7.0% |
|
Upper Hill |
15,485 |
130 |
62.5% |
6.4% |
12,000 |
102 |
70.0% |
7.0% |
6.8% |
||||
|
Eastlands |
20,000 |
124 |
75.0% |
5.5% |
12,000 |
80 |
62.5% |
5.0% |
72,072 |
360 |
10.0% |
4.2% |
5.1% |
|
Average |
18,759 |
170 |
75.9% |
8.4% |
12,924 |
106 |
73.6% |
7.1% |
142,055 |
763 |
15.0% |
6.0% |
7.2% |
|
*The average MUDs performance is based on areas where sampled projects exist |
|||||||||||||
Source: Cytonn Research
Other highlights during the month include;
- Heri Homes, a property developer in Kenya, in partnership with Finsco Africa, a Real Estate consultancy firm, announced plans to construct 384 affordable apartments in Ruiru Town, as part of its 200- acre mixed-use development project dubbed Legacy Ridges. For more information, see Cytonn Weekly #21/2022, and,
- Purple Dot International Limited, launched the construction of a Kshs 2.5 bn mixed-use commercial project along Mombasa Road dubbed Purple Tower. The 14-floor project which will sit on a 1.15-acre piece of land along Mombasa Road, will comprise of office and retail spaces. For more information, see Cytonn Weekly #21/2022.
We expect the mixed-use developments sector to register increased activities supported by the theme gaining investor appetite attributed to offering relatively higher returns compared to their single-use counterparts, catering to the growing idle class by offering a live, work and play environment and offering operational synergies.
- Hospitality Sector
During the month the following activities took place in the hospitality sector;
- PrideInn Hotels and Resorts, a local hospitality Group, opened a new hotel at the Maasai Mara dubbed PrideInn Mara Camp, in Narok County. The luxury Camp which sits on a 25-acre piece of land along River Talek banks consists of 31 cottages worth 1,000 SQFT each, a 70-seater deck restaurant, a 700-hotel room capacity, and, 15 safari tents. For more information, please see Cytonn Weekly #20/2022,
- Hilton Hotel, an international hotel chain, announced plans to open a new branch in Westlands dubbed KwetuNairobi, at the junction of Peponi and Kitisuru Roads. The 100-room hotel capacity will therefore bring Hilton’s operating branches in Kenya to three, with the other two being Hilton Nairobi Hurling ham, and, Hilton Garden Inn Nairobi. For more information, please see Cytonn Weekly #20/2022, and,
- Radisson Blu, an international hotel chain, resumed its operations in Nairobi’s Upperhill, after having been shut down for 16 months since December 2020. This therefore makes Radisson Blu the second five-star hotel to resume operations in the country, after Norfolk hotel which reopened in April 2022. For more information, see Cytonn Weekly #19/2022.
We expect the hospitality sector’s performance to continue being resilient, fuelled by factors such as aggressive marketing of the tourism sector, conferences and events boosting hotel and serviced apartments’ occupancies, and, the safari rally expected to be hosted in Kenya annually until 2026. However, the uncertainty brought about by an election year leading to reduced international arrivals in expected to weigh down the recovery path of the sector.
- Infrastructure Sector
During the week, the government announced that the dualling of the Kshs 16.7bn, 84.0 km Kenol-Marua road is set for completion by December 2022. The road, which is part of the Great North Road connecting Cairo in Egypt and Cape Town in South Africa, runs from Namanga to Moyale through Nairobi. With the construction having begun in October 2020, the first 48km section covering Kenol-Sagana is 70.0% complete while the remaining 36 km between Sagana and Marua is 63.0% complete. One complete the road will;
- Deepen mutual trade between Kenya and Ethiopia as Ethiopia will be able to import good through Mombasa, and,
- Decongest the Kenol-Marua road due to reduced traffic snarl-ups, and,
- Enhance accessibility in the area hence support improved property prices.
Kenya’s infrastructure sector continues to witness rapid developments aimed at improving the economy’s performance. This is evidenced by the numerous ongoing and completed projects in the country resulting from government’s continued focus on the same. We expect a similar trend in the sector with other projects in pipeline being: i) Nairobi Commuter Rail project, ii) the Nairobi Western Bypass, Athi River-Mlolongo-Mombasa exit, and, the Eastern Bypass project, among many others. Additionally, the government plans to increase budgetary allocation to the infrastructure sector by 16.4% to 212.5 bn in FY’2022/23 from Kshs 182.5 bn in FY’2021/2022 according to the proposed FY’2022/23 Budget Estimates, highlighting that infrastructure remains a priority area for the current government. The graph below shows the budget allocation to the transport sector over last ten financial years;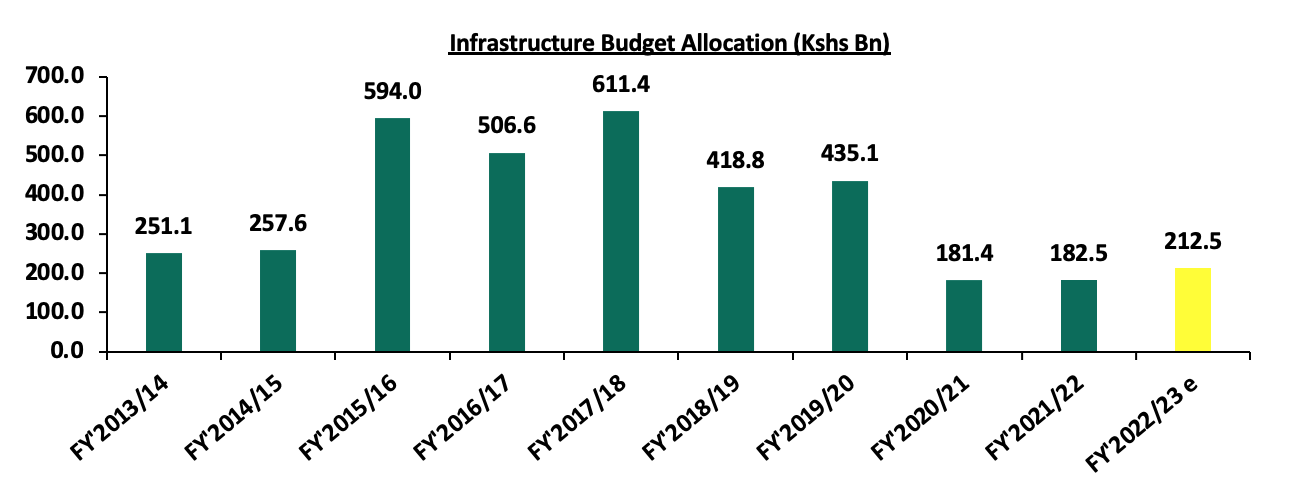
Source: National Treasury of Kenya
Other highlights during the month include;
- In the cabinet meeting that was held on 12 May 2022, President Uhuru Kenyatta approved Laikipia County Government’s request to float a 7 – year Infrastructure Bondworth Kshs 1.2 bn, at the Nairobi Stock Exchange. For more information, please see Cytonn Weekly #20/2022,
- China Road and Bridge Corporation (CRBC) was awarded a Kshs 9.0 bn tender to rehabilitate the lower section of the 27.1 Km Nairobi Expressway. For more information, see Cytonn Weekly #19/2022, and,
- The government launched the 27.1-km Nairobi Expressway on a trial basis in mid-May. For more information, see Cytonn Weekly #18/2022.
- Industrial Sector
During the month;
- Botswana’s listed Real Estate firm Letlole La Rona Limited (LLR) signed a deal with Mauritius-based Grit Real Estate Income Group, to buy a 30.0% stake, in Orbit Products Africa’s manufacturing facilities in Mlolongo, at an initial cost of Kshs 842.0 mn. This comes after Grit had invested Kshs 6.2 bn to acquire Orbit’s warehousing complex in March 2022 and announced plans for its redevelopment and expansion by the end of 2023. For more information, see Cytonn Weekly #21/2022, and,
- Purple Dot International Limited, a Real Estate development firm, announced plans to develop a warehousing hub worth Kshs 600.0 mn at the Harvest Industrial Park in Athi River, Machakos County. The warehouse facility, which will total 7,425 SQFT, will consist of 24 units with three level spaces. For more information, please see Cytonn Weekly #20/2022.
We expect the sector to continue recording a boom in activities and performance mainly as a result of the rapid infrastructural developments such as the Standard Gauge Railway and the Nairobi Mombasa Highway, that enhance transport of goods and cargo, coupled with increased demand for warehouse and storage facilities resulting from the rise in e-commerce.
- Listed Real Estate
In the Nairobi Stock Exchange, the ILAM Fahari I-REIT closed the month of May trading at an average price of Kshs 5.6 per share. This represented a 5.1% and 12.5% Month-to-Date (MTD) and Year-to-Date (YTD) decline respectively, from Kshs 5.9 per share and Kshs 6.4 per share, respectively. Also, on Inception-to-Date (ITD) basis, the REIT’s performance continues to be weighed down having realized a 72.0% decline from Kshs 20.0. The graph below shows Fahari I-REIT’s performance from November 2015 to May 2022;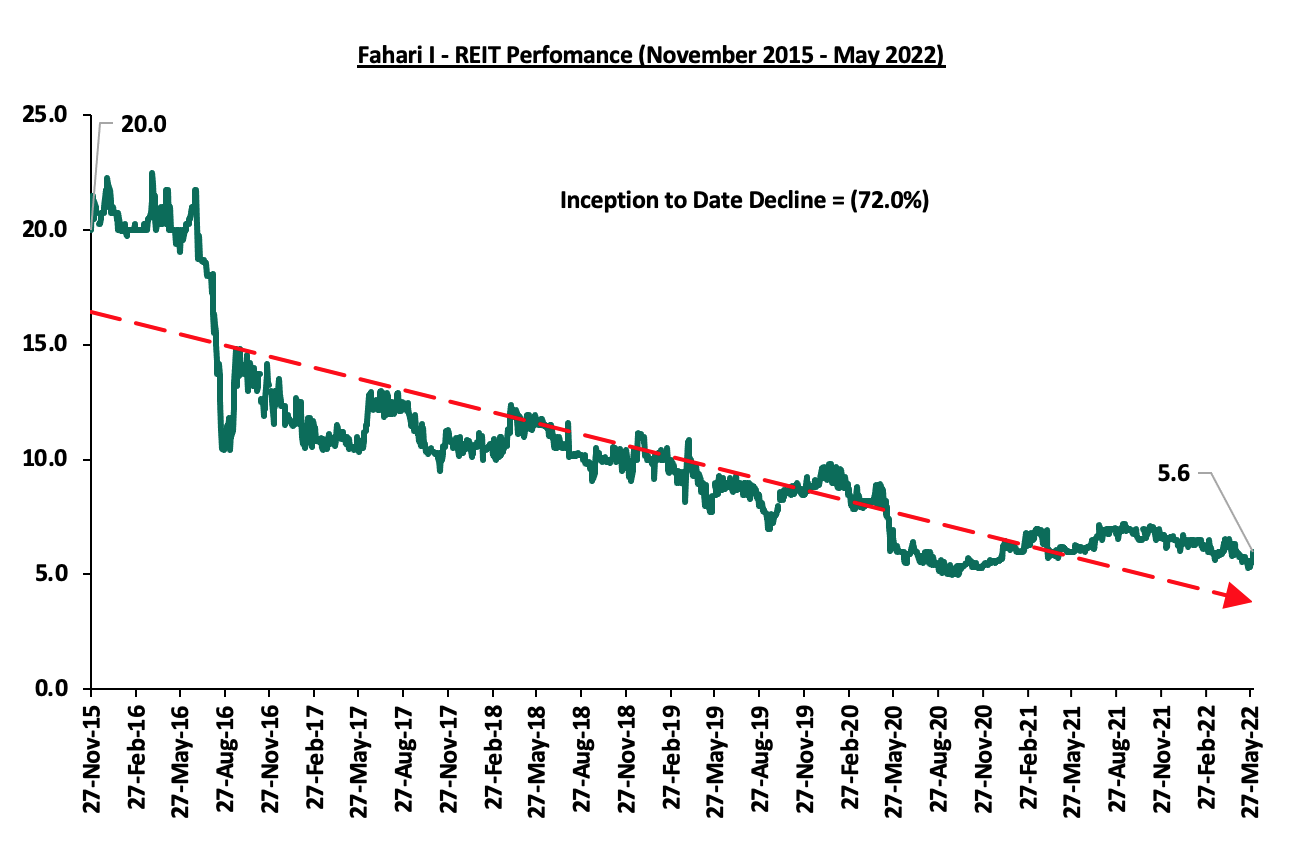
The Real Estate sector performance is expected to continue recording increased activities supported by; i) improved property prices in the residential and land sectors, ii) entry and expansion of local and international retailers, iii) increased development in the mixed-use development sector, iv) focus on infrastructural development, and, v) investor interest in the industrial sector. The performance is however expected to be weighed down by the decline in performance of the mortgage market, reduced number of international arrivals and negative performance of the REIT market.
Following the release of the FY’2021 results by Kenyan insurance firms, the Cytonn Financial Services Research Team undertook an analysis on the financial performance of the listed insurance companies and the key factors that drove the performance of the sector. In this report, we assess the main trends in the sector, and areas that will be crucial for growth and stability going forward, seeking to give a view on which insurance firms are the most attractive and stable for investment. As a result, we shall address the following:
- Insurance Penetration in Kenya
- Key Themes that Shaped the Insurance Sector in FY’2021,
- Industry Highlights and Challenges,
- Performance of The Listed Insurance Sector in FY’2021, and,
- Conclusion & Outlook of the Insurance Sector.
Section I: Insurance Penetration in Kenya
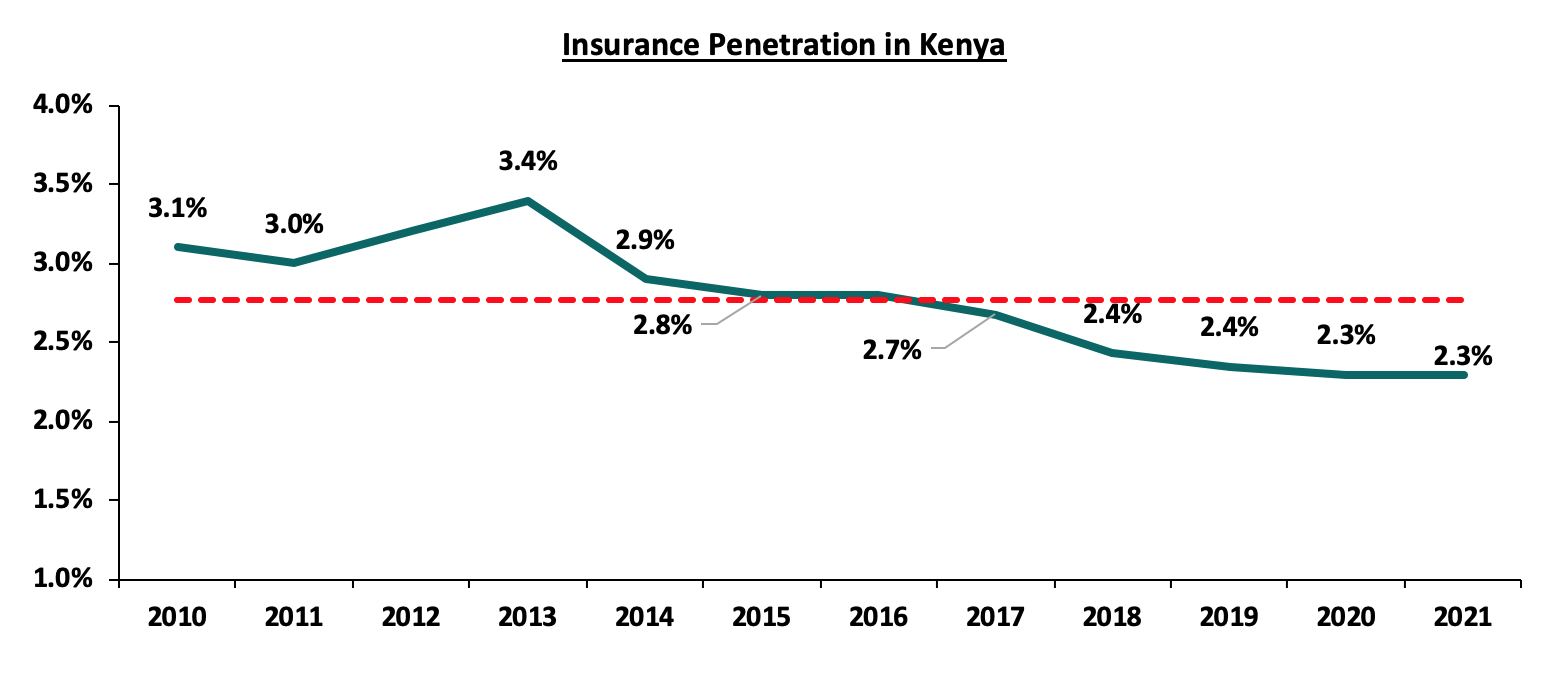
Insurance uptake in Kenya remains low compared to other key economies with the insurance penetration coming in at 2.3% as at FY’2021, according to the Q4’2021 Insurance Regulatory Authority (IRA) and the Kenya National Bureau of Statistics (KNBS) 2022 Economic Survey. The low penetration rate, which is below the global average of 7.4%, is attributable to the fact that insurance uptake is still seen as a luxury and mostly taken when it is necessary or a regulatory requirement. Notably, Insurance penetration remained unchanged at 2.3% in 2021, same as what was recorded in 2020, despite the economic recovery that saw an improved business environment. This further highlights the low insurance uptake in the country, considering that despite the improved business environment yet insurance penetration did not increase.
Source: CBK Financial Stability Reports
The chart below shows the insurance penetration in other economies across Africa:
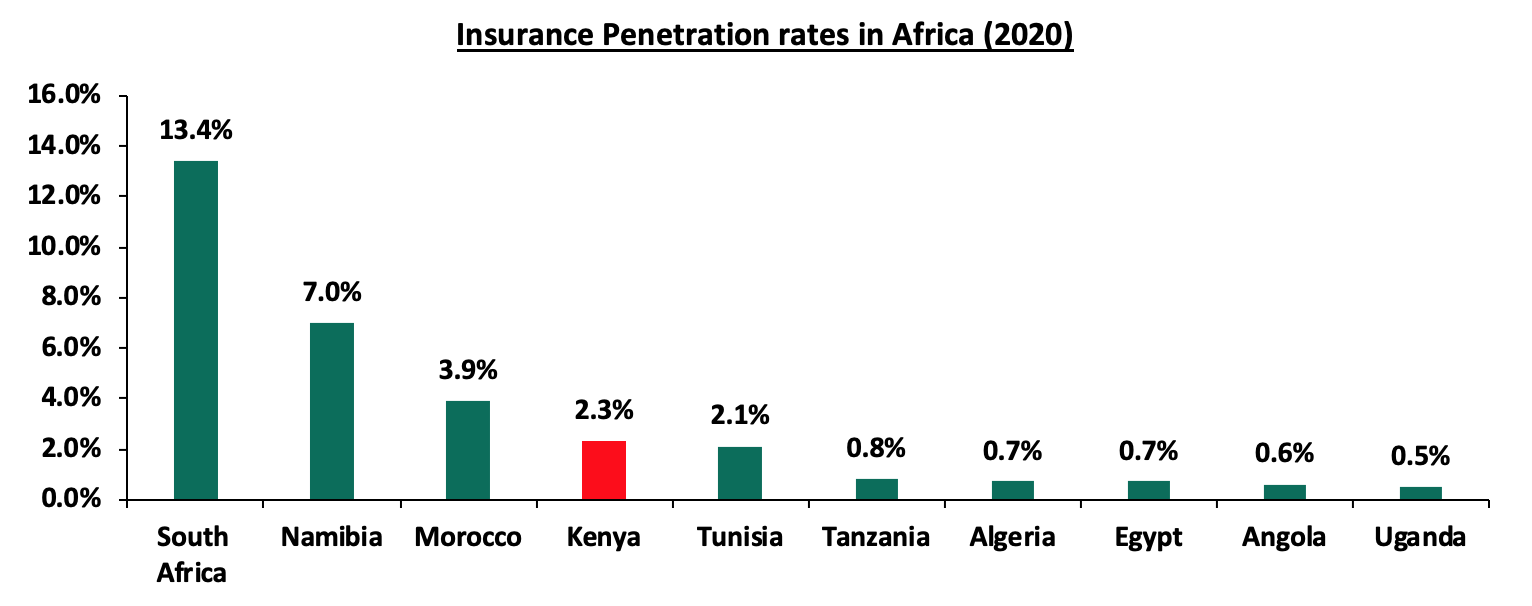
*Kenya data as of 2021
Source: Swiss Re, GCR Research, KNBS
Insurance penetration in Africa has remained relatively low, averaging 2.8% in 2020, mainly attributable to lower disposable income in the continent and slow growth of alternative distribution channels such as mobile phones to ensure wider reach of insurance products to the masses. South Africa remains to be a leader in insurance penetration in the continent, owing to a mature and highly competitive market, coupled with strong institutions and a sound regulatory environment.
Section II: Key Themes that Shaped the Insurance Sector in FY’2021
In FY’2021, the country saw an improvement in the business environment, following the increased vaccine inoculation, coupled with the lifting and easing of COVID-19 measures that had been put in place in 2020. The improved operating environment led to the sector recording an 18.5% growth in gross premiums to Kshs 276.0 bn in FY’2021, from Kshs 233.0 bn in FY’2020. Insurance claims also increased by 20.7% to Kshs 151.2 bn in FY’2021, from Kshs 125.2 bn in FY’2020. During the period under review, the NASI index gained by 9.5% compared to a decline of 8.6% in FY’2020. This in turn helped to grow the insurance sector’s bottom line as a result of fair value gains in the equities investments. However, it is key to note, Year to Date (YTD), NASI has declined by 22.6% which will have a direct impact on the sector’s bottom-line, due to the expected fair value losses on the quoted securities.
Key highlights from the industry performance:
- Convenience and efficiency through adoption of alternative channels for both distribution and premium collection such as Bancassurance and improved agency networks,
- Advancement in technology and innovation making it possible to make premium payments and through mobile phones,
- Continued recovery from the economic shocks that shrouded 2020 that saw both individuals and businesses seek insurance uptake to cover for their activities, leading to growth in gross premiums which increased by 18.5% to Kshs 276.0 bn, from Kshs 233.0 bn in FY’2020 and,
- Increased investments income, which significantly increased by 38.1% to Kshs 63.3 bn in FY’2021 from Kshs 45.9 bn in FY’2020, mainly attributable to the fair value gains on investments on equities in the capital markets.
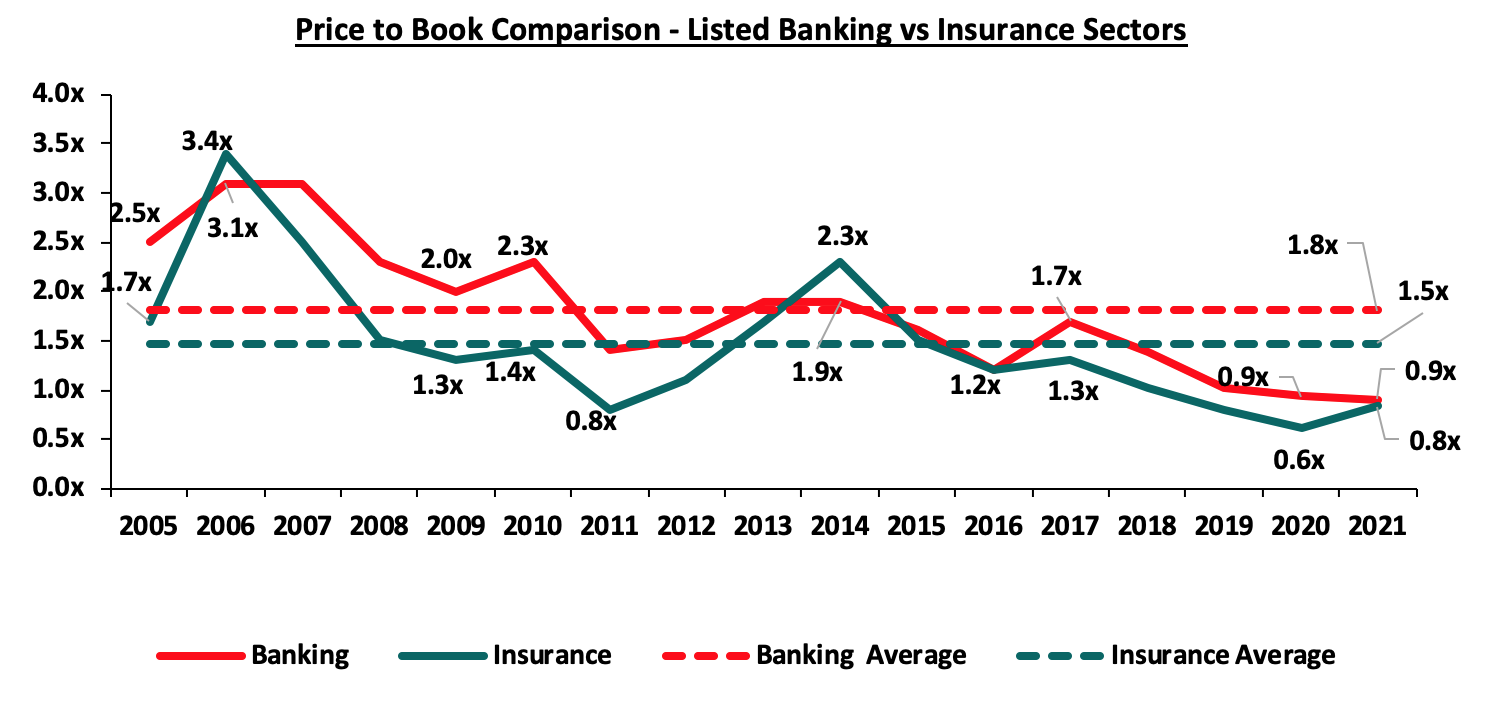
On valuations, listed insurance companies are trading at a price to book (P/Bv) of 0.8x, lower than listed banks at 0.9x, but both are lower than their 16-year historical averages of 1.5x and 1.8x, for the insurance and banking sectors respectively. These two sectors are attractive for long-term investors supported by the strong economic fundamentals.
The key themes that have continued to drive the insurance sector include:
- Technology and Innovation
Although the industry has been slow in adopting digital trends, the onset of the COVID-19 pandemic in FY’2020 saw the adoption of digital distribution of insurance products as a matter of necessity. Consequently, majority of insurance companies continue to take advantage of the available digital channels to drive growth and increase insurance penetration in the country. Mobile subscribers as at December 2021 stand at 65.1 mn against a population of 48.7 mn, translating to a mobile penetration of 133.6%, according to the Q4’2021 Communications Authority of Kenya industry release. The high mobile penetration implies that mobile phones provide a headroom and increases opportunities to distribute insurance products to the younger generation of consumers and those consumers that have not been served through traditional distribution methods. Given that the process of handling and inspecting claims manually is cumbersome and imperfect, the use of Artificial Intelligence (AI) assists in investigating the legitimacy of claims and identifying those that are fraudulent. An example is Jubilee Holdings which has rolled out a digital virtual assistant, through which clients can receive real-time services that include the end to end purchase of insurance products and access to services free of human intervention.
- Regulation
To ensure that the sector benefits from a globally competitive financial services sector, the regulator has been working through regulation implementations to address some of the perennial, as well as emerging problems in the sector. The COVID-19 environment proved challenging especially on the regulatory front, as it was a balance between remaining prudent as an underwriter and adhering to the set regulations given the negative effect the pandemic. Regulations used for the insurance sector in Kenya include the Insurance Act Cap 487 and its accompanying schedule and regulations, Retirement Benefits Act Cap 197 and The Companies Act. In FY’2021, regulation remained a key aspect affecting the insurance sector and the key themes in the regulatory environment include;
- IFRS 9 - IAS 39, Financial Instruments Recognition and Measurement was replaced with IFRS 9, Financial Instruments to address the classification and measurement of financial instruments, impairment, and hedge accounting. The guidelines introduce new classification and measurement especially for financial assets, necessitating insurers to make judgements to determine whether financial investments are measured at amortised cost or fair value and whether gains and losses are included in the profit or loss or other comprehensive income. The new impairment model under IFRS 9 is based on expected credit losses and subsequently, all financial assets will carry a loss allowance, meaning that insurers will have to provision higher for impairment losses. Many insurance companies have opted to use the temporary exemption from implementation of IFRS 9, by continuing to apply IAS 39, but the temporary exemption expires January 2023. IFRS 9 will enable insurance companies to develop appropriate models for their customer debtors and develop plans that will help them lower their credit risk in the future,
- IFRS 17- The standard establishes the principle for recognition, measurement, presentation and disclosure of insurance contracts with the objective of ensuring insurance companies provide relevant information that faithfully represents the contracts. However, as a way to protect the insurance industry from the negative effects of the pandemic the International Accounting Standards Board (IASB), the international body responsible for setting up financial reporting standards deferred its implementation to be effective from January 2023 or earlier. The standard, having replaced IFRS 4, is expected to give better information on profitability by providing more insights about current and future profitability of insurance contracts. Separation of financial and insurance results in the income statement will allow for better analysis of core performance for the entities and allow for better comparability of insurance companies, and,
- Risk Based Supervision - IRA has been implementing risk-based supervision through guidelines that require insurers to maintain a capital adequacy ratio of at least 200.0% of the minimum capital by 2020. The regulation requires insurers to monitor the capital adequacy and solvency margins on a quarterly basis, with the main objective being to safeguard the insurer’s ability to continue as a going concern and provide shareholders with adequate returns. We expect more mergers within the industry as smaller companies struggle to meet the minimum capital adequacy ratios. We also expect insurance companies to adopt prudential practices in managing and taking on risk and reduction of premium undercutting in the industry as insurers will now have to price risk appropriately.
- Capital Raising and share purchase
The move to a risk based capital adequacy framework presented opportunities for capital raising initiatives mostly by the small players in the sector to shore up their capital and meet compliance measures. With the new capital adequacy assessment framework, capital is likely to be critical to ensuring stability and solvency of the sector to ensure the businesses are a going concern. In May 2021, Allianz and Jubilee Holdings announced the completion of acquisition of 66.0% stake in Jubilee General Insurance Company (property and casualty) with the exception of medical in Kenya, Uganda, Tanzania, Burundi and Mauritius, for a total consideration of Kshs 10.8 bn. We expect that this amount will be ploughed back in to the company as part of the capital boost to grow other business lines.
In capital raising activities year to date, we have seen market activity between Sanlam Limited, a South African financial services group listed on the Johannesburg Stock Exchange, announce that it had entered into a definitive Joint Venture agreement for a term of 10 years with Allianz SE, a global integrated financial services firm listed on the Frankfurt Stock Exchange with the aim to leverage on the two entities footprints in Africa and create a leading Pan-African financial services group, with an estimated equity value of Kshs 243.7 bn. Sanlam South Africa indirectly owns 100.0% in Hubris Holdings Limited, which is the majority shareholder in Sanlam Kenya Plc, a listed insurance and financial services entity on the Nairobi Stock Exchange. We expect that the Joint Venture will provide for Sanlam Kenya Plc, Allianz General Insurance Kenya and Jubilee General Insurance (which Allianz owns the majority stake in – 66.0%), to combine operations to grow their market share, asset base and bottom lines. According to the Insurance Regulatory Authority’s Q4’2021 industry release, were the entities to combine operations, they would amass a total asset base of Kshs 37.6 bn as of Q4’2021. We expect such consolidations to continue as the market players in the insurance sector seek growth, stability and seek to meet capital adequacy requirements.
Section III: Industry Highlights and Challenges
Following the stable growth achieved by the insurance sector over the last decade, we expect the sector to experience sustained gradual growth on the back of an improving economy and subsequent growth in insurance premiums, which will enhance the capacity of the sector to sustain profitability. The following activities were undertaken by the Insurance Regulatory Authority (IRA), in line with their mandate of regulating and promoting development of the insurance sector;
- Industry Circulars
In FY’2021, IRA issued 12 circulars to the industry ranging from the Private Security Regulations Act No. 13 of 2016, Anti-Money Laundering Guidelines, Registration renewal requirements for service providers to the enhanced medical insurance policy wordings. The circular on enhancing medical insurance policy wordings, was as a result of heightened complaints and enquiries from policyholders and beneficiaries of medical insurance covers where their claims were declined by insurers. The contentious issues were centered on; i) chronic and pre-existing conditions, (ii) waiting period of the medical insurance covers, and, iii) authorization for admission to hospital. IRA addressed the complaints by redefining the terms for the above issues and directed all medical underwriters to review their medical insurance contracts and harmonize as provided for in the circular. Additionally, as a risk mitigation measure, insurers were advised to provide for payment of COVID-19 vaccination for their medical insurance clients.
- Recently Developed or Repackaged Insurance Products
In FY’2021, 23 new or repackaged insurance products were filed by various insurance companies and approved by IRA. The onset of COVID-19 and uncertainty that came along with the pandemic accelerated the repackaging of insurance products where 7 or 30.4% of the 23 products were medical plans, while life products accounted for 14 or 60.9% of the total new/repackaged products.
Industry Challenges:
- Fraud: Insurance fraud is an intentional deception committed by an applicant or policy holder for financial gain. Recent years have seen an increase in fraudulent claims especially in medical and motor insurance, with estimates indicating that one in every five medical claims are fraudulent mainly through inflated medical bills and hospitals making patients take unnecessary tests. In FY’2021, 120 fraud cases were reported, with fraudulent motor accident injury claims accounting for 17.5%, followed by theft by agents at 12.5%. The sector has been adopting the use of block chain and artificial intelligence to curb fraud within the sector, as well as most companies setting up their own assessment centres across the country so as to better determine the actual compensation,
- Increased loss ratios: Core insurance business performance has been dwindling, mainly attributable to the high loss ratios, which have deteriorated further, following the increase in claims outpacing increase in premiums. In FY’2021, general insurance claims increasing by 22.3% to Kshs 70.1 bn in FY’2021, from Kshs 57.4 bn in FY’2020. On the other hand, premiums for general insurance business grew by a slower 16.7% to Kshs 106.4 bn in FY’2021, from Kshs 91.2 bn in FY’2020. As a result, loss ratio for general insurers increased by 5.2% points to 68.8% in FY’2021, from 63.6% in FY’2020. The increase was attributable to increase in motor classes’ claims by 20.2% in FY’2021, which can be partly tied to easing of travel restrictions around the country which allowed for unabated movement. As a result of this, accidents increased and claims increased too. The loss ratios under the long term business eased slightly, to 70.4% from 70.8% in FY’2020, attributable to the 20.1% increase in premiums to Kshs 115.1 bn from Kshs 95.8 bn in FY’2020 that outpaced the 19.5% growth in net claims and policyholder’s benefits to Kshs 81.0 bn from Kshs 67.8 bn from FY’2020,
- Cut throat competition: The local insurance sector is served by 56 insurance companies offering the same products, despite the low insurance penetration in the country. The battle for market share has seen some insurers resort to underhand methods of gaining competitive advantage, such as premium undercutting which refers to the practice where an insurance company secretly offers clients unrealistically low premiums in order to gain competitive advantage and to protect their market share. This is a major driver of underwriting losses suffered by the industry. The regulator retaliated plans to engage a consultant to relook at the industry pricing in March 2021, and the plans are still underway. This however comes on the back drop of muted insurance penetration that could be worsened by increased premiums pricing. Some industry players have argued price fixing will kill innovation and that the industry players should be left free to set their own prices,
- Dwindling trust from insurance consumers: During FY’2021, IRA received 1,668 complaints, lodged against insurers by policyholders and beneficiaries, with general insurance accounting for a lion’s share of the complaints at 1,265 complaints (75.8%), while long term insurers recorded 403 (24.2%) complaints against them. The complaints range from insurance companies failing to settle claims and constant haggling over terms of insurance contracts, fuelling the public mistrust against insurers and increasing insurance apathy in the country,
- Regional regulators: Subsidiaries of Kenyan insurance companies are facing challenges in the areas of operation. For instance, in Tanzania, insurance brokers are required to be at least two-thirds (67.0%) owned and controlled by citizens of Tanzania. In Kenya, regulation on capital has made it difficult for smaller insurance companies to continue operating without increasing their capital or merging in order to raise their capital base.
Section IV: Performance of the Listed Insurance Sector in FY’2021
The table below highlights the performance of the listed insurance sector, showing the performance using several metrics, and the key take-outs of the performance.
|
Listed Insurance Companies FY’2021 Earnings and Growth Metrics |
||||||||
|
Insurance |
Core EPS Growth |
Net Premium growth |
Claims growth |
Loss Ratio |
Expense Ratio |
Combined Ratio |
ROaE |
ROaA |
|
CIC |
301.3% |
5.5% |
5.8% |
71.6% |
52.2% |
123.8% |
3.4% |
1.6% |
|
Britam |
100.8% |
8.1% |
(4.3%) |
69.4% |
82.1% |
151.5% |
0.4% |
0.05% |
|
Jubilee Insurance |
57.0% |
9.0% |
18.2% |
108.4% |
41.3% |
149.7% |
17.6% |
4.5% |
|
Sanlam |
13.7% |
34.8% |
50.3% |
93.3% |
45.7% |
139.0% |
(46.0%) |
(1.7%) |
|
Liberty |
(87.9%) |
0.6% |
42.8% |
78.3% |
79.3% |
157.6% |
0.9% |
0.2% |
|
*FY’2021 Weighted Average |
89.2% |
8.9% |
11.9% |
87.9% |
59.5% |
147.4% |
6.6% |
2.1% |
|
**FY’2020 Weighted Average |
(157.9%) |
1.6% |
9.5% |
88.1% |
62.9% |
151.1% |
(9.4%) |
(1.3%) |
|
*Market cap weighted as at 03/06/2022 |
||||||||
|
**Market cap weighted as at 21/05/2021 |
||||||||
The key take-outs from the above table include;
- Core EPS growth recorded a weighted growth of 89.2%, compared to a weighted decline of 157.9% in FY’2020. The increase in earnings was attributable to increased premiums during the period following robust recovery by the sector from the COVID-19 pandemic, coupled with gains recorded in the equities markets and higher yields from government papers,
- The premiums grew at a faster pace of 8.9% in FY’2021, compared to a growth of 1.6% in FY’2020, while claims grew at an aggressive faster rate of 11.9% in FY’2021, from the 9.5% recorded in FY’2020 on a weighted average basis,
- The loss ratio across the sector eased slightly to 87.9% in FY’2021, from 88.1% in FY’2020,
- The expense ratio eased to 59.5% in FY’2021, from 62.9% in FY’2020, owing to a decline in operating expenses, a sign of increased efficiency,
- The insurance core business still remains unprofitable, with a combined ratio of 147.4% as at FY’2021, compared to 151.1% in FY’2020, and,
- On average, the insurance sector delivered a Return on Average Equity (ROaE) of 6.6%, an increase from a weighted Return on Average Equity of (9.4%) in FY’2020.
Based on the Cytonn FY’2021 Insurance Report, we ranked insurance firms from a franchise value and from a future growth opportunity perspective with the former getting a weight of 40.0% and the latter a weight of 60.0%.
For the franchise value ranking, we included the earnings and growth metrics as well as the operating metrics shown in the table below in order to carry out a comprehensive review:
|
Listed Insurance Companies FY’2021 Franchise Value Score |
|||||||
|
Insurance Company |
Loss Ratio |
Expense Ratio |
Combined Ratio |
Return on Average Capital Employed |
Tangible Common Ratio |
Franchise Value Score |
Ranking |
|
Jubilee |
108.4% |
41.3% |
149.7% |
21.7% |
27.2% |
14 |
1 |
|
CIC Group |
71.6% |
52.2% |
123.8% |
12.3% |
18.6% |
19 |
2 |
|
Sanlam |
93.3% |
45.7% |
139.0% |
(35.1%) |
1.9% |
22 |
3 |
|
Britam |
69.4% |
82.1% |
151.5% |
7.2% |
10.9% |
24 |
4 |
|
Liberty |
78.3% |
79.3% |
157.6% |
3.6% |
18.9% |
26 |
5 |
|
Weighted Average FY'2021 |
87.9% |
59.5% |
147.4% |
11.8% |
18.9% |
|
|
The Intrinsic Valuation is computed through a combination of valuation techniques, with a weighting of 40.0% on Discounted Cash-flow Methods, 35.0% on Residual Income and 25.0% on Relative Valuation. The overall FY’2020 ranking is as shown in the table below:
|
Listed Insurance Companies FY’2021 Comprehensive Ranking |
|||||
|
Bank |
Franchise Value Score |
Intrinsic Value Score |
Weighted Score |
FY’2021 Ranking |
FY'2020 Ranking |
|
Jubilee Holdings |
1 |
1 |
1 |
1 |
2 |
|
Liberty Holdings |
5 |
2 |
3.2 |
2 |
1 |
|
Britam |
4 |
3 |
3.4 |
3 |
5 |
|
Sanlam Kenya |
3 |
4 |
3.6 |
4 |
3 |
|
CIC Group |
2 |
5 |
3.8 |
5 |
4 |
Major Changes from the FY’2020 Ranking are;
- Jubilee Holdings improved to position 1 in FY’2021 from position 2 mainly due to the improvement in the franchise score in FY’2021, driven by reduction in expense ratio to 41.3% in FY’2021, from 56.3% in FY’2020. As a result, the combined ratio also declined to 149.7% in FY’2021, from 157.6% in FY’2020,
- Liberty declined to position 2 in FY’2021 from position 1 in FY’2020 mainly due to declines in both the franchise score in FY’2021, driven by the deterioration in the loss ratio to 78.3%, from 55.2% in FY’2020 while the expense ratio increased to 79.3%, from 45.9% in FY’2020,
- Britam Holdings improved to position 3 in FY’2021 from position 5 in FY’2020 driven by an improvement in the franchise score attributable to the improvement in the loss ratio to 69.4%, from 85.7%, taking the combined ratio to 151.5%, an improvement from the 164.2% in FY’2020,
- Sanlam declined to position 4 in FY’2020 from position 3 in FY’2020 mainly due to deterioration in the franchise score, driven by deterioration in loss and combined ratios to 93.3% and 139.0%, from 83.7% and 137.9%, respectively,
- CIC Group declined to position 5 in FY’2021, from position 4 in FY’2020, on the back of weaker franchise and intrinsic scores driven by deterioration of its loss ratio to 71.6% in FY’2021, from 71.4% in FY’2020, and combined ratio to 123.8% in FY’2021, from 121.5% in FY’2020.
Section V: Conclusion & Outlook of the Insurance Sector
The sector has continued to suffer from low penetration rates which has been worsened by the pandemic and its effects on the economy and Kenyans’ disposable incomes. However, the sector continues to undergo transition where traditional models have been disrupted, mainly on the digital transformation, innovation and regulation front, which have positively impacted the outlook. We expect a steady growth in premiums as underwriters come up with products suited to the planning for unforeseen events like COVID-19, mainly in the medical and life businesses. With the full resumption of economic activities that were slowed down in 2020, we expect the claims to continue to grow as well. As such, we are of the opinion that the insurance sector will have to perform delicate balancing acts to ensure that they remain profitable. We are of the view that insurance companies have a lot they can do in order to register considerable growth and improve the level of penetration in the country to the 2020 world average of 7.4%, some of this include:
- We are of the opinion that insurers have to aggressively look into portfolio optimization by re-evaluating their products and services in-order to sustain post-pandemic growth and remain profitable. Insurers will have to focus on their core and profitable offerings and disposing non-core offerings. This could manifest through sale of business units considered unprofitable. One such example is Jubilee Holdings sale of its general insurance units within Kenya and its regional subsidiaries with the exclusion of its medical unit to Allianz. We expect this portfolio optimization to extend into offloading or reducing stake in non-profitable subsidiaries and associates. Products are also set to be affected as the underwriters extend focus to profitable products,
- We expect most underwriters to renew their efforts towards increasing investment income through diversifying their investments through avenues such as pension schemes, unit trusts, fund management and investment advisories. This shift from the brick and mortar underwriting business is necessitated by the increasing combined ratios that have seen insurers’ suffer losses in their core business, with increase in underwriting expenses and claims outpacing the increase in premiums. On the investment front, we also expect insurers to continue to look into non-traditional asset classes such as infrastructure. An example is Jubilee Holdings investment in associates such as Bujagali hydropower plant in Uganda, PDM Holdings Ltd and IPS Cable Systems Ltd whose share of profits has been boosting its bottom-line. In FY’2021, Jubilee Holdings profits from associates increased by 41.2% to Kshs 1.9 bn in FY’2021, from Kshs 0.9 bn from Kshs 1.3 bn in FY’2020,
- We expect robust insurance awareness campaigns by the insurers in order to increase knowledge of insurance products, among the masses, as there still remains a gap on insurance understanding. According to a survey commissioned by the Association of Kenya insurers (AKI), the 2nd largest contributor to low insurance uptake at 27.0%, is lack of knowledge of the various insurance products and their benefits. This gives a lot of headroom for insurers, to educate, repackage, and tailor their products to different institutions and individuals,
- We expect continued partnerships and alternative distribution channels, by linking with other financial services players including Fund managers who have ventured into offering insurance linked products as well as the current bancassurance relationship with Banks. Insurance companies will still want to leverage on the penetration of bank products to also push insurance products. Integration of mobile money payments to allow for policy payments is also expected to continue because of convenience which it provides and also mobile phone penetration in the country is high therefore insurance companies will want to leverage this to improve penetration,
- We expect increased use of technological tools and innovations such as Artificial Intelligence and real time data in hyper personalization of insurance marketing so as to use customer information to customize content, products and services according to the customer wishes and preferences. This will also assist insurers in responding to changes in buying behaviours and tailoring products and services to the needs of the customers to ensure high customer retention in an era where new client acquisition remains difficult. We also expect to see increased inclusion of advancements like smart contracts through block chain that would help eliminate processing costs, reduce insurance fraud and fictitious claims and improve customer satisfaction through immediate claims payment, and,
- We also expect that there will be increased regulation in the sector from the regulatory body and other international players to ensure its solvency and sustainability. Insurers have to adjust their insurance contract recognition methods in preparation to the coming into effect of IFRS 9 and IFRS 17 in January of 2023 or earlier. The concerted push by the regulator to have the desired capital adequacy levels will likely see increased consolidations as insurers struggle to reinstate their capital buffers following the effects of the pandemic.
For the FY’2021 Insurance Report, please download it here
Disclaimer: The views expressed in this publication are those of the writers where particulars are not warranted. This publication is meant for general information only and is not a warranty, representation, advice or solicitation of any nature. Readers are advised in all circumstances to seek the advice of a registered investment advisor.

- Talk to us
- Kenya
- P.O Box 20695 - 00200, Nairobi, Kenya
- Cell +254709101200
- Tel +254709101200
- WhatsApp +254741676635
- United States
- +254709101200
- DOWNLOAD OUR APP
-


- Kenya
- 8th Floor, Pinetree Plaza, Kaburu Drive, Ngong Road, Nairobi, Kenya
- USA
- Suite 1150, 1775 Eye Street NW, USA, Washington DC 20006, USA
- Investments
- High Yield
- Private Equity
- Real Estate
- Real Estate
- RiverRun Estates
- Cytonn Towers
- The Ridge
- Taraji Heights
- The Alma