Public-Private Partnerships (PPPs) in Kenya, & Cytonn Weekly #20/2022
By Research Team, May 22, 2022
Executive Summary
Fixed Income
During the week, T-bills remained oversubscribed, with the overall subscription rate coming in at 116.3%, up from 102.3% recorded the previous week, on the back of increasing yields and eased liquidity in the money market with the average interbank rates declining to 4.4%, from the 4.6% recorded the previous week. The 91-day paper recorded the highest subscription rate, receiving bids worth Kshs 5.3 bn against the offered Kshs 4.0 bn, translating to a subscription rate of 136.9%, a marginal increase from the 132.0% recorded the previous week. The continued investor preference for the 91-day paper is partly attributable to the higher return on a risk-adjusted basis. The subscription rate for the 364-day and 182-day papers increased to 121.8% and 102.5%, from 113.4% and 79.3%, respectively, recorded the previous week. The yields on the government papers were on an upward trajectory, with the yields on the 364-day, 182-day and the 91-day papers increasing by 1.9 bps, 11.0 bps and 7.5 bps to 9.9%, 8.8% and 7.8%, respectively. The government released the auction results for the tap-sale of two bonds, namely FXD1/2022/10 and FXD1/2021/25, seeking to raise Kshs 10.0 bn. The bonds were oversubscribed, receiving bids worth Kshs 17.0 bn against the offered Kshs 10.0 bn, translating to a subscription rate of 170.1%. The oversubscription can be attributed to the eased liquidity in the money market during the period of issue and the relatively high coupon rates;
Equities
During the week, the equities market was on a downward trajectory, with NASI, NSE 20 and NSE 25 declining by 5.1%, 3.8% and 3.5%, respectively, taking their YTD performance to losses of 20.7%, 12.2% and 17.8% for NASI, NSE 20 and NSE 25, respectively. The equities market performance was driven by losses recorded by large cap stocks such as Safaricom, Diamond Trust Bank Kenya (DTB-K), Cooperative Bank, Bamburi, Equity Group and KCB Group of 7.9%, 7.1%, 5.3%, 2.3%, 1.8% and 1.3%, respectively. The losses were however mitigated by gains recorded by other stocks such as EABL and ABSA of 0.9% and 0.6% respectively;
According to Equity Group Holdings (EGH) annual report FY’2021, as at the end of FY’2021, EGH made an initial Investment of Kshs 400.0 mn in Equity Group Insurance Holdings Limited, a non-operating insurance holding company incorporated in January 2022. Also during the week, Standard Chartered Bank of Kenya Plc released their Q1’2022 financial results, indicating an increase in Earnings per share of 15.6% to Kshs 7.3, from Kshs 6.3 recorded in Q1’2021;
Real Estate
During the week, Knight Frank, an international property consulting and management company, released the Prime Global Cities Index - Q1 2022 report, highlighting that the average selling prices for houses in prime cities in the world recorded a capital appreciation of 2.2% q/q and 9.4% y/y. In Africa, Nairobi city ranked position 32 out of the sampled 45 cities globally, in addition to being the only ranked African city, with a capital appreciation of 1.3% q/q and 3.5% y/y. Additionally, the Kenya National Bureau of Statistics (KNBS), released the Leading Economic Indicators (LEI) March 2022, highlighting that the overall number of tourist arrivals into Kenya via the Jomo Kenyatta International Airport (JKIA) and Moi International Airport (MIA) declined by 6.1% to 225,321 in Q1’2022, from the 240,019 visitors that were recorded in Q4’2021. On the other hand, cement consumption increased by 34.8% to 0.9 mn metric tonnes in February 2022, from the 0.6 mn recorded in February 2021.
In the commercial office sector, Housing Finance Group, a Kenyan Financial Institution, announced plans to sell its head office, Rehani House, located in Nairobi’s Central Business District (CBD) by the end of 2022. In the retail sector, Naivas Supermarket opened its fifth outlet in Naivasha’s Safari Centre, along the Nairobi – Nakuru Highway. Additionally, Optica Limited, a local eyewear retailer, opened two new outlets at Rubis Business Block in Kitengela, and in Argwing’s Arcade in Kilimani. In the hospitality sector, PrideInn Hotels and Resorts, a local hospitality Group, opened a new hotel at Maasai Mara dubbed PrideInn Mara Camp, in Narok County. Additionally, Hilton Hotel, an international hotel chain, announced plans to open a new branch in Westlands dubbed Kwetu Nairobi, at the junction of Peponi and Kitisuru Roads.
In the infrastructure sector, President Uhuru Kenyatta approved Laikipia County Government’s request to float a seven – year Infrastructure Bond worth Kshs 1.2 bn, at the Nairobi Stock Exchange, in order to raise funds for various infrastructure developments in the county. Also, Transport Principal Secretary Joseph Njoroge announced that the construction of the Nairobi City Railway Project worth Kshs 27.9 bn would commence by August 2022. In the industrial sector, Purple Dot International Limited, a Real Estate development firm, announced plans to develop a warehousing hub worth Kshs 600.0 mn at the Harvest Industrial Park in Athi River, Machakos County. For the listed Real Estate, ILAM Fahari I-REIT closed the week trading at an average price of Kshs 5.5 per share;
Focus of the Week
The trend towards Public-Private Partnerships (PPPs) has continued to take shape with numerous developing nations across the world acknowledging that economic development should not be limited to the mindset of either public or private sector, that they two can collaborate to accelerate economic development. Kenya has one of the most comprehensive PPP legislative frameworks in Africa. Recently in December 2021, the Public Private Partnerships (PPP) Bill 2021 was signed into law, to address the shortcomings of the Public Private Partnerships (PPP) Act 2013 by including a framework for streamlined project processes with clear timelines, expanded procurement options and robust processes for Privately Initiated Investment Proposals (PIIP). This week, we provided an update on the progress of PPPs in Kenya and offered recommendations on other strategies that can be adopted to ensure effectiveness of PPPs.
Investment Updates:
- Weekly Rates:
- Cytonn Money Market Fund closed the week at a yield of 10.52%. To invest, dial *809#;
- Cytonn High Yield Fund closed the week at a yield of 14.13% p.a. To invest, email us at sales@cytonn.com and to withdraw the interest, dial *809#;
- On our weekly Twitter Spaces session, we had a discussion on “Investing in an election year; what you need to know” which was moderated by Stellah Swakei, an Investment Analyst at Cytonn. The panel included Carol Miheso, Founder - Zuka Zama Investments and, Juster Kendi, an Investment Analyst. Listen to the conversation here,
- We continue to offer Wealth Management Training every Thursday and every third Saturday of the month, from 9:00 am to 11:00 am, through our Cytonn Foundation. The training aims to grow financial literacy among the general public. To register for any of our Wealth Management Trainings, click here;
- If interested in our Private Wealth Management Training for your employees or investment group, please get in touch with us through wmt@cytonn.com;
- Any CHYS and CPN investors still looking to convert through assignment of debt are welcome to consider one of the five projects currently available for assignment, click here for the latest term sheet;
- Cytonn Insurance Agency acts as an intermediary for those looking to secure their assets and loved ones’ future through insurance namely; Motor, Medical, Life, Property, WIBA, Credit and Fire and Burglary insurance covers. For assistance, get in touch with us through insuranceagency@cytonn.com;
- Cytonnaire Savings and Credit Co-operative Society Limited (SACCO) provides a savings and investments avenue to help you in your financial planning journey. To enjoy competitive investment returns, kindly get in touch with us through clientservices@cytonn.com;
Real Estate Updates:
- For an exclusive tour of Cytonn’s Real Estate developments, visit: Sharp Investor's Tour, and for more information, email us at sales@cytonn.com;
- Phase 3 of The Alma is now ready for occupation. To rent please email properties@cytonn.com;
- We expect to go back to site in June to complete Phase 4 of the Alma
- We have 8 investment-ready projects, offering attractive development and buyer targeted returns; See further details here: Summary of Investment-ready Projects;
- For recent news about the group, see our news section here;
Hospitality Updates:
We currently have promotions for Staycations. Visit cysuites.com/offers for details or email us at sales@cysuites.com;
Money Markets, T-Bills & T-Bonds Primary Auction:
During the week, T-bills remained oversubscribed, with the overall subscription rate coming in at 116.3%, up from 102.3% recorded the previous week, on the back of increasing yields and eased liquidity in the money market with the average interbank rates declining to 4.4%, from the 4.6% recorded the previous week. The 91-day paper recorded the highest subscription rate, receiving bids worth Kshs 5.3 bn against the offered Kshs 4.0 bn, translating to a subscription rate of 136.9%, a marginal increase from the 132.0% recorded the previous week. The continued investor preference for the 91-day paper is partly attributable to the higher return on a risk-adjusted basis. The subscription rate for the 364-day and 182-day papers increased to 121.8% and 102.5%, from 113.4% and 79.3%, respectively, recorded the previous week. The yields on the government papers were on an upward trajectory, with the yields on the 364-day, 182-day and the 91-day papers increasing by 1.9 bps, 11.0 bps and 7.5 bps to 9.9%, 8.8% and 7.8%, respectively. The government rejected expensive bids accepting only Kshs 22.9 bn worth of bids out of Kshs 27.9 bn received, translating to an acceptance rate of 81.9%.
The government released the auction results for the tap-sale of the two bonds, FXD1/2022/10 and FXD1/2021/25, seeking to raise Kshs 10.0 bn. The bonds were oversubscribed, receiving bids worth Kshs 17.0 bn against the offered Kshs 10.0 bn, translating to a subscription rate of 170.1%. The oversubscription can be attributed to the eased liquidity in the money market during the period of issue and the relatively high coupon rates of 13.5% and 13.9%, for FXD1/2022/10 and FXD1/2021/25, respectively. The government accepted all Kshs 17.0 bn of the Kshs 17.0 bn worth of bids received, translating to an acceptance rate of 100.0%. The weighted average rate of accepted bids for FXD1/2022/10 and FXD1/2021/25 was 13.5% and 14.0%, respectively.
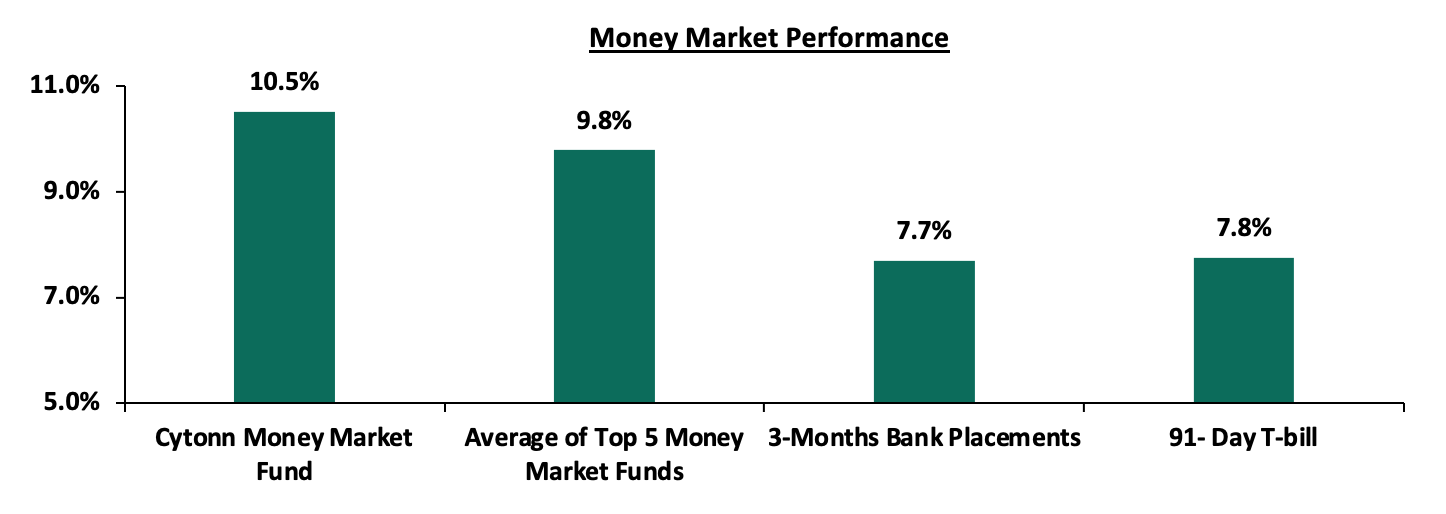
In the money markets, 3-month bank placements ended the week at 7.7% (based on what we have been offered by various banks), while the yield on the 91-day T-bill increased by 7.5 bps to 7.8%. The average yield of the Top 5 Money Market Funds and the yield on the Cytonn Money Market Fund remained relatively unchanged at 9.8% and 10.5%, respectively as recorded the previous week.
The table below shows the Money Market Fund Yields for Kenyan Fund Managers as published on 20th May 2022:
|
Money Market Fund Yield for Fund Managers as published on 20th May 2022 |
||
|
Rank |
Fund Manager |
Effective Annual Rate |
|
1 |
Cytonn Money Market Fund |
10.5% |
|
2 |
Zimele Money Market Fund |
9.9% |
|
3 |
Nabo Africa Money Market Fund |
9.8% |
|
4 |
Apollo Money Market Fund |
9.5% |
|
5 |
Sanlam Money Market Fund |
9.3% |
|
6 |
CIC Money Market Fund |
9.1% |
|
7 |
Dry Associates Money Market Fund |
9.0% |
|
8 |
Co-op Money Market Fund |
8.8% |
|
9 |
Madison Money Market Fund |
8.8% |
|
10 |
GenCap Hela Imara Money Market Fund |
8.7% |
|
11 |
ICEA Lion Money Market Fund |
8.7% |
|
12 |
Orient Kasha Money Market Fund |
8.5% |
|
13 |
NCBA Money Market Fund |
8.4% |
|
14 |
Old Mutual Money Market Fund |
7.9% |
|
15 |
AA Kenya Shillings Fund |
7.8% |
|
16 |
British-American Money Market Fund |
7.1% |
Source: Business Daily
Liquidity:
During the week, liquidity in the money markets eased, with the average interbank rate declining to 4.4% from 4.6% recorded the previous week, partly attributable to government payments which offset tax remittances. The average interbank volumes traded increased by 45.9% to Kshs 18.2 bn from Kshs 12.5 bn recorded the previous week.
Kenya Eurobonds:
During the week, the yields on Eurobonds recorded mixed performance, with the yields on the 10-year Eurobonds issued in 2014 and 2018 increasing by 0.6% and 0.2% points to 12.3% and 11.6%, from 11.7% and 11.4%, respectively, recorded the previous week. Similarly, the 7-year and 12-year Eurobonds issued in 2019 increased by 0.4% points and 0.1% points to 12.4% and 11.7%, from 12.0% and 11.6%, respectively. The 30-year Eurobond issued in 2018, and the 12-year Eurobond issued in 2021 both remained unchanged at 12.0% and 11.1%, respectively.
|
Kenya Eurobond Performance |
||||||
|
|
2014 |
2018 |
2019 |
2021 |
||
|
Date |
10-year issue |
10-year issue |
30-year issue |
7-year issue |
12-year issue |
12-year issue |
|
3-Jan-22 |
4.4% |
8.1% |
8.1% |
5.6% |
6.7% |
6.6% |
|
2-May-22 |
8.8% |
10.0% |
11.1% |
10.5% |
10.8% |
10.3% |
|
13-May-22 |
11.7% |
11.4% |
12.0% |
12.0% |
11.6% |
11.1% |
|
16-May-22 |
11.7% |
11.3% |
12.0% |
12.1% |
11.5% |
10.8% |
|
17-May-22 |
11.7% |
11.2% |
11.9% |
12.2% |
11.5% |
10.8% |
|
18-May-22 |
11.7% |
11.3% |
11.9% |
12.2% |
11.5% |
10.8% |
|
19-May-22 |
12.3% |
11.6% |
12.0% |
12.4% |
11.7% |
11.1% |
|
Weekly Change |
0.6% |
0.2% |
0.0% |
0.4% |
0.1% |
0.0% |
|
MTD Change |
3.5% |
1.5% |
0.9% |
1.9% |
0.9% |
0.8% |
|
YTD Change |
7.9% |
3.5% |
3.9% |
6.8% |
5.0% |
4.5% |
Source: CBK
Kenya Shilling:
During the week, the Kenyan shilling depreciated by 0.2% against the US dollar to close the week at Kshs 116.4, from Kshs 116.1 recorded the previous week, partly attributable to increased dollar demand from the oil and energy sectors. Key to note, this is the lowest the Kenyan shilling has ever depreciated against the dollar. On a year to date basis, the shilling has depreciated by 2.9% against the dollar, in comparison to the 3.6% depreciation recorded in 2021. We expect the shilling to remain under pressure in 2022 as a result of:
- Rising global crude oil prices on the back of supply constraints and geopolitical pressures at a time when demand is picking up with the easing of COVID-19 restrictions and as economies reopen. Key to note, risks abound the recovery following the emergence of the new COVID-19 variants,
- Increased demand from merchandise traders as they beef up their hard currency positions in anticipation for more trading partners reopening their economies globally,
- An ever-present current account deficit due to an imbalance between imports and exports, with Kenya’s current account deficit estimated to come in at 5.3% of GDP in the 12 months to March 2022 compared to the 4.7% for a similar period in 2021. The wider deficit reflects a higher import bill, particularly for oil, which more than offset increased receipts from agricultural and services exports, and remittances, and,
- The aggressively growing government debt, with Kenya’s public debt having increased at a 10-year CAGR of 18.6% to Kshs 8.2 tn in December 2021, from Kshs 1.5 tn in December 2011 thus putting pressure on forex reserves to service some of the public debt. It is worth noting that the average GDP growth over the same period has been 3.9%, an indicator that the increase in debt is not translating into GDP growth.
The shilling is however expected to be supported by:
- High Forex reserves currently at USD 8.3 bn (equivalent to 4.9-months of import cover), which is above the statutory requirement of maintaining at least 4.0-months of import cover, and the EAC region’s convergence criteria of 4.5-months of import cover. In addition, the reserves were boosted by the USD 750.0 mn World Bank loan facility received in March 2022 and are expected to be boosted further by the expected USD 244.0 mn from the International Monetary Fund (IMF), and,
- Improving diaspora remittances evidenced by a 18.6% y/y increase to USD 355.0 mn as of April 2022, from USD 299.3 mn recorded over the same period in 2021, the highest figure ever which has continued to cushion the shilling against further depreciation.
Rates in the Fixed Income market have remained stable due to the relatively ample liquidity in the money market. The government is 4.6% ahead of its prorated borrowing target of Kshs 600.2 bn having borrowed Kshs 627.9 bn of the Kshs 664.0 bn borrowing target for the FY’2021/2022. We expect a gradual economic recovery as evidenced by the revenue collections of Kshs 1.5 tn during the first ten months of the current fiscal year, which was equivalent to 102.0% of the prorated revenue collection target. However, despite the projected high budget deficit of 8.1% and the affirmation of the `B+’ rating with negative outlook by Fitch Ratings, we believe that the support from the IMF and World Bank will mean that the interest rate environment will remain stable since the government is not desperate for cash. Owing to this, our view is that investors should be biased towards short-term fixed-income securities to reduce duration risk.
Markets Performance
During the week, the equities market was on a downward trajectory, with NASI, NSE 20 and NSE 25 declining by 5.1%, 3.8% and 3.5%, respectively, taking their YTD performance to losses of 20.7%, 12.2% and 17.8% for NASI, NSE 20 and NSE 25, respectively. The equities market performance was partly attributable to foreign investor sell-offs and driven by losses recorded by large cap stocks such as Safaricom, Diamond Trust Bank Kenya (DTB-K), Cooperative Bank, Bamburi, Equity Group and KCB Group of 7.9%, 7.1%, 5.3%, 2.3%, 1.8% and 1.3%, respectively. The losses were however mitigated by gains recorded by other stocks such as EABL and ABSA of 0.9% and 0.6% respectively.
During the week, equities turnover declined by 33.9% to USD 14.1 mn, from USD 21.3 mn recorded the previous week, taking the YTD turnover to USD 342.0 mn. Foreign investors remained net sellers, with a net selling position of USD 5.0 mn, from a net selling position of USD 10.4 mn recorded the previous week, taking the YTD net selling position to USD 49.3 mn.
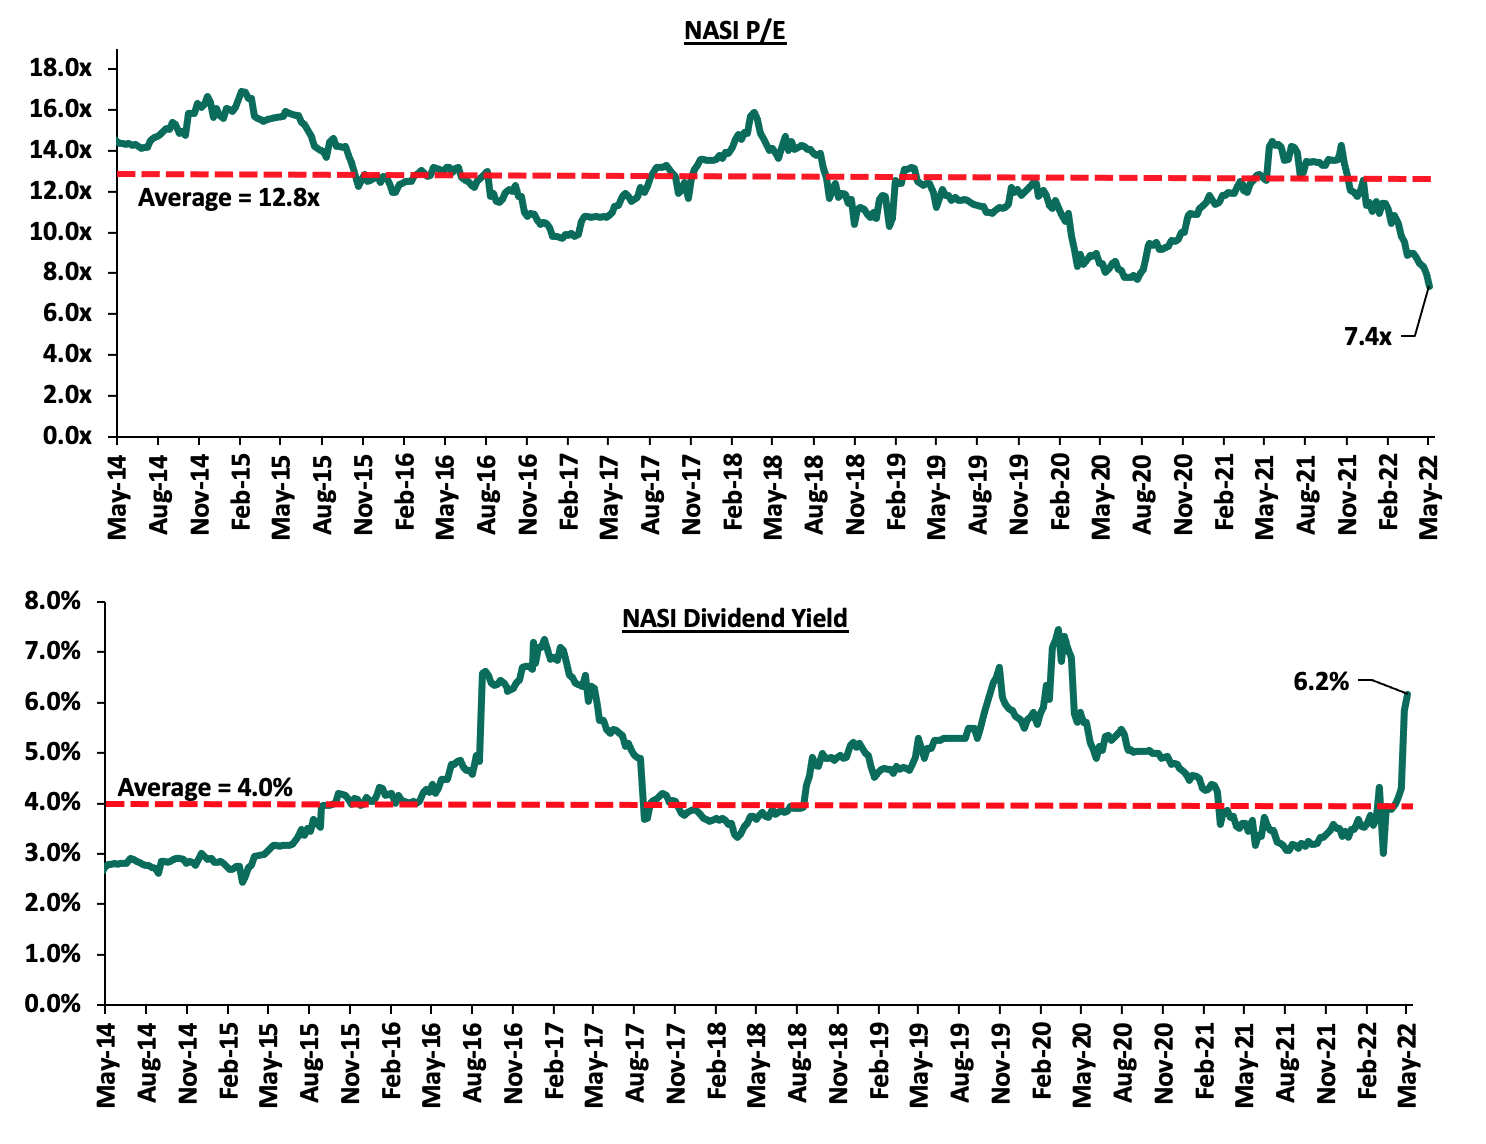
The market is currently trading at a price to earnings ratio (P/E) of 7.4x, 42.7% below the historical average of 12.8x, and a dividend yield of 6.2%, 2.2% points above the historical average of 4.0%. The rise in dividend yield is attributable to price declines recorded by most stocks due to increased foreign investor sell-offs as they exit perceived higher risk markets. Safaricom, which currently accounts for 54.9% of the total NASI market capitalization, is trading at its lowest level (Kshs 27.8) since August 2020 and has recorded a 27.1% share price decline, year to date. Additionally, the current P/E valuation of 7.4x is the lowest on record in the last thirteen years, and, is 4.4% below the most recent trough valuation of 7.7x experienced in the first week of August 2020. Key to note, NASI’s PEG ratio currently stands at 0.9x, an indication that the market is undervalued relative to its future growth. A PEG ratio greater than 1.0x indicates the market may be overvalued while a PEG ratio less than 1.0x indicates that the market is undervalued. The charts below indicate the historical P/E and dividend yields of the market:
Weekly Highlights:
- Equity Group Holdings invests Kshs 400.0 mn in Equity Group Insurance Holdings Limited
According to Equity Group Holdings (EGH) annual report FY’2021, as at the end of FY’2021, EGH made an initial investment of Kshs 400.0 mn in Equity Group Insurance Holdings Limited, a non-operating insurance holding company incorporated in January 2022. Equity Group Insurance Holdings Limited was incorporated to enable EGH group to undertake non-banking services, and fully owns Equity Life Assurance Kenya Limited (ELAK), a subsidiary formed to conduct and undertake long-term insurance business in Kenya. This came after EGH obtained the prerequisite approvals from its shareholders and the Central Bank of Kenya (CBK), before subsequent registration and licensing from the Insurance Regulatory Authority (IRA) on 10th January 2022.
EGH’s venturing into the insurance business is one of EGH’s diversification strategies aimed at increasing its Non-Funded Income (NFI), which has continued to bear fruit, with the NFI growing by 9.7% to Kshs 11.9 bn in Q1’2022, from Kshs 10.9 bn in Q1’2021. ELAK will also have an opportunity to tap into Kenya’s insurance sector which offers a lot of headroom for growth, with the insurance penetration rate coming at a paltry 2.2% in FY’2021 according to the Economic Survey 2022. For more information please read our Cytonn Weekly #02/2022.
- Earnings Release
During the week, Standard Chartered Bank of Kenya Plc released their Q1’2022 financial results. Below is a summary of their performance;
- Standard Chartered Bank of Kenya Plc
|
Standard Chartered Bank of Kenya Plc Q1’2022 Key Highlights |
|||
|
Balance Sheet |
|||
|
Balance Sheet Items |
Q1'2021 (Kshs bn) |
Q1'2022 (Kshs bn) |
y/y change |
|
Net Loans and Advances |
117.9 |
128.1 |
8.7% |
|
Government Securities |
102.4 |
101.4 |
(1.0%) |
|
Total Assets |
339.3 |
340.9 |
0.5% |
|
Customer Deposits |
265.2 |
265.4 |
0.0% |
|
Deposits Per Branch |
7.4 |
12.1 |
63.7% |
|
Total Liabilities |
286.4 |
285.3 |
(0.4%) |
|
Shareholders’ Funds |
52.9 |
55.6 |
5.2% |
|
Income Statement |
|||
|
Income Statement Items |
Q1'2021 (Kshs bn) |
Q1'2022 (Kshs bn) |
y/y change |
|
Net Interest Income |
4.6 |
4.9 |
7.2% |
|
Net non-Interest Income |
2.5 |
2.5 |
0.1% |
|
Total Operating income |
7.1 |
7.4 |
4.7% |
|
Loan Loss provision |
(0.4) |
0.1 |
(120.8%) |
|
Total Operating expenses |
(3.7) |
(3.5) |
(5.4%) |
|
Profit before tax |
3.4 |
3.9 |
15.7% |
|
Profit after tax |
2.4 |
2.8 |
15.6% |
|
Core EPS |
6.3 |
7.3 |
15.6% |
|
Key Ratios |
|||
|
Income Statement Ratios |
Q1’2021 |
Q1’2022 |
% points y/y change |
|
Yield from interest-earning assets |
8.1% |
7.4% |
(0.7%) |
|
Cost of funding |
1.6% |
1.2% |
(0.4%) |
|
Cost of risk |
5.8% |
(1.2%) |
(7.0%) |
|
Net Interest Margin |
6.7% |
6.3% |
(0.4%) |
|
Net Interest Income as % of operating income |
64.9% |
66.4% |
1.5% |
|
Non-Funded Income as a % of operating income |
35.1% |
33.6% |
(1.5%) |
|
Cost to Income Ratio |
52.0% |
47.0% |
(5.0%) |
|
Cost to Income Ratio without LLP |
46.2% |
48.1% |
2.0% |
|
Cost to Assets |
1.0% |
1.0% |
- |
|
Capital Adequacy Ratios |
|||
|
Ratios |
Q1'2021 |
Q1'2022 |
% Points Change |
|
Core Capital/Total Liabilities |
15.1% |
15.6% |
0.5% |
|
Minimum Statutory ratio |
8.0% |
8.0% |
0.0% |
|
Excess |
7.1% |
7.6% |
0.5% |
|
Core Capital/Total Risk Weighted Assets |
15.9% |
15.4% |
(0.5%) |
|
Minimum Statutory ratio |
10.5% |
10.5% |
0.0% |
|
Excess |
5.4% |
4.9% |
(0.5%) |
|
Total Capital/Total Risk Weighted Assets |
18.3% |
17.6% |
(0.7%) |
|
Minimum Statutory ratio |
14.5% |
14.5% |
0.0% |
|
Excess |
3.8% |
3.1% |
(0.7%) |
Key take-outs from the earnings release include;
- Core earnings per share increased by 15.6% to Kshs 7.3, from Kshs 6.3 recorded in Q1’2021, higher than our projections of a 6.0% increase to Kshs 6.7. The performance was driven by a 4.7% increase in total operating income to Kshs 7.4 bn, from Kshs 7.1 bn recorded in Q1’2021, coupled with a 5.4% decline in total operating expenses to Kshs 3.5 bn, from Kshs 3.7 bn recorded in Q1’2021, compared to our 0.1% projected increase,
- Interest income increased by 1.8% to Kshs 5.7 bn, from Kshs 5.6 bn in Q1’2021, driven by a 5.1% increase in interest income from Loans & Advances to Kshs 3.0 bn, from Kshs 2.9 bn in Q1’2021, coupled with a 2% increase in interest income from Government Securities to Kshs 2.32 bn in Q1’2022, from Kshs 2.30 bn in Q1’2021,
- The Yield on Interest-Earning Assets, however, declined by 0.7% points to 7.4%, from 8.1% in Q1’2021, attributable to a 3.4% decline in the trailing interest income, coupled with a 6.5% increase in the average interest earning assets,
- Interest expense declined by 23.6% to Kshs 0.7 bn, from Kshs 1.0 bn in Q1’2021, following a 24.9% decline in interest expense on customer deposits to Kshs 0.7 bn, from Kshs 0.9 bn in Q1’2021 coupled with a 16.2% decline in other interest expenses to Kshs 63.7 mn from Kshs 76.0 mn in Q1’2021. Cost of funds declined by 0.4% points to 1.2%, from 1.6% in Q1’2021, owing to the 22.7% decline in trailing interest expense and the 4.2% increase in the average interest-bearing liabilities,
- Net Interest Margin (NIM) declined to 6.3%, from 6.7% in Q1’2021 attributable to a slower 0.8% gain in the trailing Net Interest Income (NII) compared to the 6.5% growth in average interest-earning assets,
- Total operating expenses declined by 5.4% to Kshs 3.5 bn in Q1’2022, from Kshs 3.7 bn in Q1’2021, mainly attributable to a 120.8% decline in Loan Loss Provisions (LLPs) to a negative provision of Kshs (0.1 bn) in Q1’2022, from Kshs 0.4 bn in Q1’2021 as a result of a reduction in management provisions primarily related to COVID-19, given the reduced uncertainty in the business environment. However, Staff Costs increased by 1.4% to Kshs 1.7 bn, from Kshs 1.6 bn recorded in Q1’2021,
- The balance sheet recorded a marginal expansion as total assets grew by 0.5% to Kshs 340.9 bn in Q1’2022, from Kshs 339.3 bn in Q1’2021. This growth was largely driven by an 8.7% increase in net loans to Kshs 128.1 bn, from Kshs 117.9 bn in Q1’2021. However, the increase was weighed down by a 1.0% decline in investments government and other securities to Kshs 101.4 bn, from Kshs 102.4 bn recorded in Q1’2021. The increase in the loan book marks the largest y/y growth since Q3’2020 and is partly indicative of the reduced credit risk in the business environment as the economy gradually recovers from the effects of the pandemic,
- Total liabilities declined by 0.4% to Kshs 285.3 bn, from Kshs 286.4 bn in Q1’2021 driven by a 74.0% decline in placements to Kshs 0.3 bn, from Kshs 1.2 bn in Q1’2021,
- Deposits per branch rose by 63.7% to Kshs 12.1 bn, from Kshs 7.4 bn in Q1’2021 with the number of branches reducing to 22 from 36 in Q1’2021,
- Gross Non-Performing Loans (NPLs) increased by 1.2% to Kshs 22.6 bn in Q1’2022, from Kshs 22.3 bn recorded in Q1’2021. Non-Performing loans continue to increase given that the bank lends to sectors like manufacturing which are yet to fully recover from the effects of the pandemic. As of December 2021, the manufacturing sector accounted for 20.0% of the loan book,
- The NPL ratio, however, declined to 15.4%, from 16.4% recorded in Q1’2021. The improvement in asset quality is attributable to the faster 7.8% growth in Gross loans, as compared to the relatively slower 1.2% increase in Gross Non-Performing Loans (NPLs),
- The NPL coverage improved to 81.8%, from 81.1% in Q1’2021 on the back of a 2.1% increase in the general Loan Loss Provisions (after adding back interest suspense) outpacing the 1.2% rise in the Gross Non-Performing Loans during the same period, an indication of sufficient provisioning, and,
- Standard Chartered is currently sufficiently capitalized with a core capital to risk-weighted assets ratio of 15.4%, 4.9% points above the statutory requirement of 10.5%. In addition, the total capital to risk-weighted assets ratio was 17.6%, exceeding the statutory requirement of 14.5% by 3.1% points. Adjusting for IFRS 9, the core capital to risk-weighted assets stood at 15.4% while total capital to risk-weighted assets came in at 17.7%.
For a comprehensive analysis, please see our Standard Chartered Bank Plc’s Q1’2022 Earnings Note
Asset Quality
The table below is a summary of the asset quality for the banks that have released
|
|
Q1'2021 NPL Ratio** |
Q1'2022 NPL Ratio* |
Q1'2021 NPL Coverage** |
Q1'2022 NPL Coverage* |
% point change in NPL Ratio |
% point change in NPL Coverage |
|
Equity Group |
12.1% |
9.0% |
55.0% |
66.0% |
(3.1%) |
11.0% |
|
NCBA Group |
14.7% |
16.3% |
65.0% |
72.6% |
1.6% |
7.6% |
|
Stanbic Bank |
15.1% |
11.1% |
63.9% |
59.1% |
(4.0%) |
(4.8%) |
|
Standard Chartered |
16.4% |
15.4% |
81.1% |
81.8% |
(1.0%) |
0.7% |
|
HF Group |
24.7% |
20.5% |
64.7% |
76.1% |
(4.2%) |
11.4% |
|
Mkt Weighted Average |
13.1% |
10.6% |
58.2% |
66.1% |
(2.5%) |
7.9% |
|
*Market cap weighted as at 20/05/2022 |
||||||
|
**Market cap weighted as at 08/06/2021 |
||||||
Key take-outs from the table include;
- Asset quality for the listed banks that have released their Q1’2022 results improved during the period, with the weighted average NPL ratio declining by 2.5% points to a market cap weighted average of 10.6%, from an average of 13.1% for the listed banking sector in Q1’2021. The improvement in asset quality is attributable to declining credit risk on the back of increased business activities in the period driven by the gradual economic recovery, and,
- NPL Coverage for the listed banks increased to a market cap weighted average of 66.1% in Q1’2022, from 58.2% recorded in Q1’2021, as the banks increased their provisioning levels to proactively manage risks brought about by the emergence of new COVID-19 variants coupled with the slow recovery of some sectors such as tourism, agriculture and manufacturing.
Summary Performance
The table below highlights the performance of the banks that have released so far, showing the performance using several metrics, and the key take-outs of the performance;
|
Bank |
Core EPS Growth |
Interest Income Growth |
Interest Expense Growth |
Net Interest Income Growth |
Net Interest Margin |
Non-Funded Income Growth |
NFI to Total Operating Income |
Growth in Total Fees & Commissions |
Deposit Growth |
Growth in Government Securities |
Loan to Deposit Ratio |
Loan Growth |
Return on Average Equity |
|
Equity |
36.0% |
31.1% |
32.6% |
30.6% |
7.2% |
9.7% |
21.7% |
21.7% |
14.0% |
24.9% |
69.2% |
27.8% |
28.7% |
|
NCBA |
20.3% |
10.4% |
14.9% |
7.6% |
5.8% |
15.5% |
11.1% |
0.0% |
7.2% |
22.6% |
52.4% |
0.3% |
14.0% |
|
SCBK |
15.6% |
1.8% |
(23.6%) |
7.2% |
6.3% |
0.1% |
34.0% |
(11.0%) |
0.1% |
(1.0%) |
48.3% |
8.7% |
17.4% |
|
Stanbic |
12.0% |
9.5% |
(5.2%) |
16.9% |
6.3% |
9.6% |
13.5% |
21.8% |
3.7% |
(14.6%) |
87.8% |
30.7% |
21.6% |
|
HF |
117.8% |
1.1% |
(6.5%) |
9.7% |
4.4% |
87.2% |
26.8% |
44.1% |
3.1% |
26.5% |
90.8% |
(2.7%) |
(4.5%) |
|
Q1'22 Mkt Weighted Average* |
27.6% |
20.5% |
16.0% |
21.7% |
6.7% |
9.3% |
21.0% |
13.6% |
9.4% |
15.2% |
66.1% |
21.1% |
23.7% |
|
Q1'21 Mkt Weighted Average** |
28.4% |
14.7% |
12.7% |
17.5% |
7.4% |
2.9% |
35.3% |
(2.4%) |
21.8% |
20.3% |
69.2% |
11.0% |
13.8% |
|
*Market cap weighted as at 20/05/2022 |
|||||||||||||
|
**Market cap weighted as at 08/06/2021 |
|||||||||||||
Key takeaways from the table above include:
- The listed banks that have released recorded a 27.6% weighted average growth in core Earnings per Share (EPS), compared to a weighted average increase of 28.4% in Q1’2021 for the listed banking sector,
- The Banks have recorded a weighted average deposit growth of 9.4%, slower than the 21.8% growth recorded in Q1’2021, an indication of reduced investment risk in the business environment,
- Interest income grew by 20.5%, compared to a growth of 14.7% recorded in Q1’2021 while the weighted average Yield on Interest Earning Assets (YIEA) decreased to 8.3%, from the 9.5% recorded in Q1’2021 for the listed banking sector. Consequently, the Net Interest Margin (NIM) now stands at 6.7%, 0.7% points lower than the 7.4% recorded in Q1’2021 for the whole listed banking sector, and,
- Non-Funded Income grew by 9.3%, compared to the 2.9% growth recorded in Q1’2022. This can be attributable to the faster growth in the fees and commission which grew by 13.6% compared to a decline of 2.4% in Q1’2021, following the expiry of the waiver on fees on mobile transactions.
Cytonn coverage:
|
Company |
Price as at 13/05/2022 |
Price as at 20/05/2022 |
w/w change |
YTD Change |
Year Open 2022 |
Target Price* |
Dividend Yield |
Upside/ Downside** |
P/TBv Multiple |
Recommendation |
|
Kenya Reinsurance |
2.2 |
2.1 |
(7.7%) |
(10.5%) |
2.3 |
3.2 |
4.9% |
59.9% |
0.2x |
Buy |
|
I&M Group*** |
18.0 |
17.5 |
(2.5%) |
(18.2%) |
21.4 |
25.4 |
8.6% |
53.6% |
0.5x |
Buy |
|
KCB Group*** |
35.8 |
35.3 |
(1.3%) |
(22.5%) |
45.6 |
50.5 |
8.5% |
51.6% |
0.7x |
Buy |
|
Jubilee Holdings |
265.0 |
264.0 |
(0.4%) |
(16.7%) |
316.8 |
381.7 |
5.3% |
49.9% |
0.5x |
Buy |
|
ABSA Bank*** |
9.7 |
9.8 |
0.6% |
(16.9%) |
11.8 |
13.4 |
11.3% |
48.8% |
1.0x |
Buy |
|
Liberty Holdings |
5.7 |
5.2 |
(8.8%) |
(26.3%) |
7.1 |
7.7 |
0.0% |
47.3% |
0.4x |
Buy |
|
Diamond Trust Bank*** |
53.8 |
50.0 |
(7.1%) |
(16.1%) |
59.5 |
65.6 |
6.0% |
37.3% |
0.2x |
Buy |
|
Co-op Bank*** |
12.3 |
11.6 |
(5.3%) |
(10.8%) |
13.0 |
14.6 |
8.6% |
34.4% |
0.9x |
Buy |
|
Equity Group*** |
45.5 |
44.7 |
(1.8%) |
(15.3%) |
52.8 |
56.2 |
6.7% |
32.3% |
1.2x |
Buy |
|
Standard Chartered*** |
124.8 |
124.0 |
(0.6%) |
(4.6%) |
130.0 |
147.1 |
11.3% |
29.9% |
1.0x |
Buy |
|
Britam |
6.7 |
6.5 |
(3.3%) |
(14.0%) |
7.6 |
7.9 |
0.0% |
21.1% |
1.1x |
Buy |
|
NCBA*** |
26.5 |
26.3 |
(0.9%) |
3.1% |
25.5 |
28.2 |
11.4% |
18.8% |
0.6x |
Accumulate |
|
Stanbic Holdings |
103.3 |
104.0 |
0.7% |
19.5% |
87.0 |
107.2 |
8.7% |
11.7% |
0.9x |
Accumulate |
|
CIC Group |
2.1 |
2.0 |
(5.7%) |
(8.8%) |
2.2 |
1.9 |
0.0% |
(4.9%) |
0.7x |
Sell |
|
HF Group |
3.0 |
3.0 |
0.0% |
(21.3%) |
3.8 |
2.5 |
0.0% |
(17.4%) |
0.2x |
Sell |
|
Sanlam |
14.9 |
14.9 |
0.0% |
28.6% |
11.6 |
12.1 |
0.0% |
(18.8%) |
1.6x |
Sell |
|
*Target Price as per Cytonn Analyst estimates **Upside/ (Downside) is adjusted for Dividend Yield ***For Disclosure, these are stocks in which Cytonn and/or its affiliates are invested in |
||||||||||
We are “Neutral” on the Equities markets in the short term. With the market currently trading at an undervalued value to its future growth (PEG Ratio at 0.9x), we believe that investors should reposition towards value stocks with strong earnings growth and that are trading at discounts to their intrinsic value. We expect the discovery of new COVID-19 variants, the upcoming Kenyan general elections and the slow vaccine rollout to continue weighing down the economic outlook. On the upside, we believe that the relaxation of COVID-19 containment measures in the country will lead to improved investor sentiments.
- Industry Reports
- Prime Global Cities Index Q1’2022, by Knight Frank
During the week, Knight Frank, an international property consulting and management company, released the Prime Global Cities Index - Q1’2022, a report highlighting the performance of prime residential cities across the globe based on capital appreciation. The following were the key take-outs from the report:
- The average selling prices for houses in the sampled prime cities globally recorded a capital appreciation of 2.2% q/q and 9.4% y/y. This was attributed to a high demand for decent houses across the globe, resulting from increasing population and urbanization growth rates, infrastructure developments which are mostly concentrated in the urban areas, and, adequate amenities enhancing investments,
- Dubai recorded the highest YoY capital appreciation at 58.9% with a q/q appreciation of 6.8% driven by; i) its world class infrastructure developments driving major investments in the city, such as Dubai Highway and Dubai Water Canal, among many others, and, ii) its recognition as a financial hub globally thus attracting high end investments,
- On the other hand, Jakarta ranked last from the sampled prime cities with a YoY price correction of 4.7% and no price q/q change, attributed to declining demand for housing units in the city, that results from challenges such as floods and congestion, and,
- Nairobi city ranked position 32 out of the sampled 45 cities globally, in addition to also being the only ranked African city, with a capital appreciation of 1.3% q/q and 3.5% YoY. The increase in performance driven by increased demand for housing resulting from: a growing middle income class, recognition of Nairobi as a regional hub thus promoting investments, and, a high urbanization growth rate in Kenya currently at 4.0% compared to the world’s 1.8% according to the World Bank. The table below shows the house selling price performance for various prime cities in the world as at Q1’2022:
|
Capital Appreciations For Prime Cities in the World Q1’2022 |
|||||||||||
|
# |
City |
Q/Q Change (Q4'2021-Q1'2022) |
YoY Change (Q1'2021-Q1'2022) |
# |
City |
Q/Q Change (Q4'2021-Q1'2022) |
YoY Change (Q1'2021-Q1'2022) |
# |
City |
Q/Q Change (Q4'2021-Q1'2022) |
YoY Change (Q1'2021-Q1'2022) |
|
1 |
Dubai |
6.8% |
58.9% |
16 |
Monaco |
0.0% |
10.0% |
31 |
Lisbon |
2.2% |
3.8% |
|
2 |
Miami |
6.9% |
33.1% |
17 |
Berlin |
4.0% |
9.4% |
32 |
Nairobi |
1.3% |
3.5% |
|
3 |
Toronto |
6.7% |
24.0% |
18 |
Edinburgh |
2.5% |
8.9% |
33 |
Singapore |
(0.5%) |
2.6% |
|
4 |
San Fransisco |
6.5% |
23.4% |
19 |
Vancouver |
3.4% |
8.8% |
34 |
Bucharest |
1.4% |
2.3% |
|
4 |
Los Angeles |
6.0% |
22.8% |
20 |
Paris |
2.6% |
8.7% |
35 |
London |
0.9% |
2.1% |
|
6 |
Seoul |
1.7% |
20.2% |
21 |
Shanghai |
1.0% |
8.5% |
36 |
Frankfurt |
(2.0%) |
1.6% |
|
7 |
Gold Coast |
3.1% |
19.3% |
22 |
Dublin |
2.9% |
8.3% |
37 |
Bengaluru |
0.5% |
1.4% |
|
8 |
Auckland |
3.1% |
17.6% |
23 |
Zurich |
2.2% |
8.2% |
38 |
Mumbai |
1.0% |
1.4% |
|
9 |
Sydney |
1.8% |
15.0% |
24 |
Hong Kong |
(0.4%) |
8.0% |
39 |
Delhi |
0.2% |
0.2% |
|
10 |
Tokyo |
8.4% |
15.4% |
25 |
Geneva |
1.2% |
7.4% |
40 |
Kuala Lumpur |
0.6% |
(0.7%) |
|
11 |
Stockholm |
7.0% |
13.2% |
26 |
Beijing |
2.8% |
7.3% |
41 |
Manila |
0.0% |
(1.5%) |
|
12 |
Brisbane |
1.8% |
11.3% |
27 |
New York |
0.9% |
5.6% |
42 |
Shenzen |
(0.1%) |
(2.3%) |
|
13 |
Perth |
7.0% |
11.0% |
28 |
Wellington |
(2.8%) |
5.2% |
43 |
Bangkok |
0.9% |
(2.7%) |
|
14 |
Melbourne |
2.1% |
10.9% |
29 |
Madrid |
1.9% |
4.2% |
44 |
Guangzhou |
(3.0%) |
(4.0%) |
|
15 |
Taipei |
1.6% |
10.1% |
30 |
Vienna |
0.7% |
4.0% |
45 |
Jakarta |
0.0% |
(4.7%) |
|
Average Change |
2.2% |
9.4% |
|||||||||
Source: Knight Frank Research 2022
Based on the above, Nairobi City positions itself as a viable area for Real Estate investments having been the only ranked African city globally. As such, we expect more properties in the city to record capital appreciations, which trickles down to the overall performance of the residential sector coupled with increased investor appetite in the sector.
- Leading Economic Indicators March 2022, by the Kenya National Bureau of Statistics (KNBS)
During the week, the Kenya National Bureau of Statistics (KNBS) released the Leading Economic Indicators March 2022, a report highlighting the performance of key economic indicators in Kenya. The key highlights related to the Real Estate sector include:
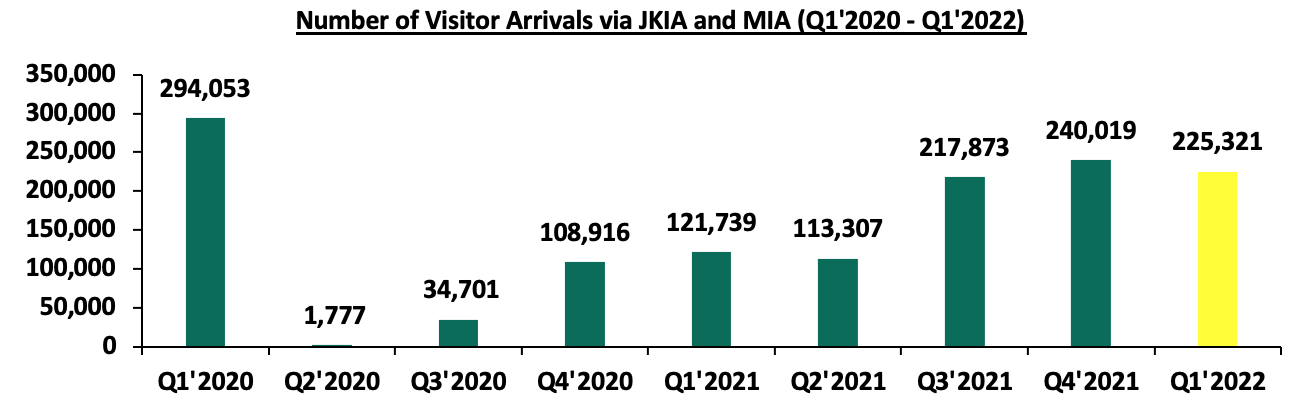
- The overall number of tourist arrivals into Kenya via the Jomo Kenyatta International Airport (JKIA) and Moi International Airport (MIA) came in at 225,321 in Q1’2022. This is a 6.1% decline in the arrivals from the 240,019 visitors recorded in Q4’2021. The decline in the number of arrivals is due to the reduced tourism and leisure activities in the hospitality sector, as visitors embarked to their work and studies after the festive season. However, on a YoY basis, the performance was an 85.1% increase from the 121,739 visitors recorded in Q1’2021. The performance was due to the lowered travel restrictions, and, lifting of flight bans from major Kenya tourism markets such as the United Kingdom and the United States of America, which in turn led to increased visitor arrivals into the country. The graph below shows the number of international arrivals in Kenya between Q1’2020 and Q1’2022:
Source: Kenya National Bureau of Statistics
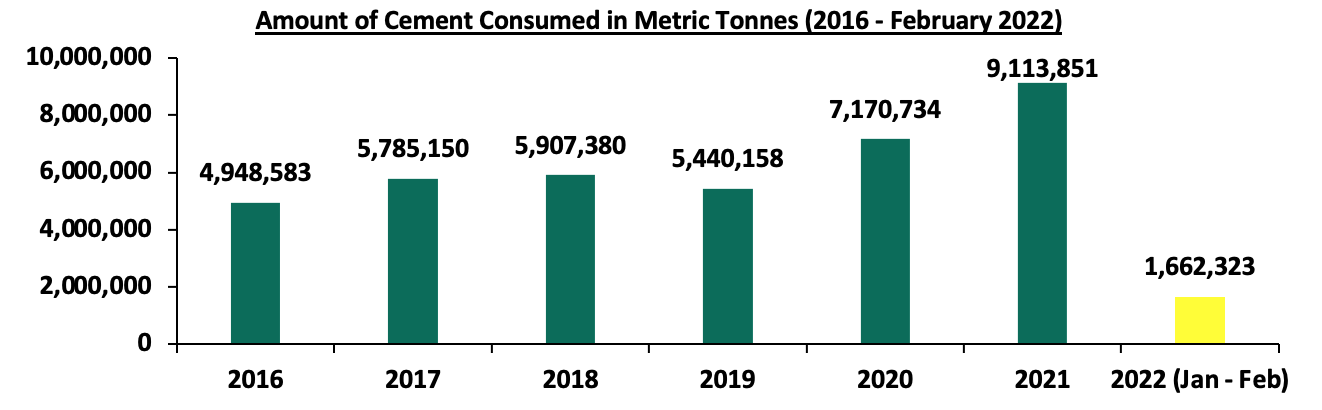
- Cement consumption increased by 34.9% to 817,726 metric tonnes in February 2022, from the 606,547 metric tonnes that was recorded in February 2021. This was because of increased construction activities particularly in the residential and infrastructure sectors, with some of the construction projects being berth one of the LAPSET corridor, the Nairobi-Western Bypass project, Nairobi Expressway, and, the Pangani Affordable Housing project, among others. However, on a MoM basis, the amount of cement consumption declined by 3.2% from the 844,597 metric tonnes that was recorded in January 2022 because of the winding up of some of the major construction projects in the pipeline such the Nairobi expressway, coupled with an overall increase in the construction costs. The graph below shows the volumes of cement consumption in Nairobi between 2016 and Jan – Feb 2022:
Source: Kenya National Bureau of Statistics
Kenyan property market continues to record significant development activities, which continues to drive the overall performance of the Real Estate sector. The performance of the sector continues to be driven by factors such as increased demand for housing which necessitates more housing construction projects, increased tourism arrivals into the country, and, continued focus on infrastructural developments.
- Commercial Office Sector
Housing Finance Group (HFG), a Kenyan financial institution, announced plans to sell its head office, Rehani House, located in Nairobi’s Central Business District by the end of 2022. The 13-storey building will be sold at an undisclosed amount, following the financier’s need to acquire additional capital to repay its loan obligations. In its Q1’2022 Financial Results, HF Group had total loan obligations worth Kshs 5.0 bn. Moreover, HF Group aims at restructuring its business in order to comply with the regulatory requirement on fixed asset investments that should not exceed 20.0% of core capital. As at FY’2021, Housing Finance Group’s investments in land and buildings as a percentage of core capital came in at 52.0%, which is 32.0% points above the regulatory requirement.
Upon the sale of the building, the financial institution will therefore shift to become a rent payer in the same building, after having been the owner for 44 years. HF Group is expected to benefit from the affordable rental rates in Nairobi CBD compared to other regions within the Nairobi Metropolitan Area. As per our Cytonn Q1’2022 Markets Review, Nairobi CBD recorded rental rates of Kshs 82 per SQFT, 12.8% lower than the market average of Kshs 94 per SQFT in the period under review. The table below shows summary of Nairobi Metropolitan Area commercial office sub market performance;
All Values in Kshs Unless Stated Otherwise
|
Nairobi Metropolitan Area Commercial Office Submarket Performance Q1’2022 |
||||
|
Area |
Price (Kshs) /SQFT Q1’2022 |
Rent Kshs/ SQFT Q1’2022 |
Occupancy (%) Q1’2022 |
Rental Yield (%) Q1’2022 |
|
Gigiri |
13,500 |
118 |
83.3% |
8.8% |
|
Westlands |
11,846 |
105 |
74.5% |
8.1% |
|
Karen |
13,325 |
107 |
82.8% |
7.8% |
|
Parklands |
11,562 |
91 |
82.8% |
7.7% |
|
Kilimani |
12,440 |
91 |
80.2% |
7.1% |
|
Upperhill |
12,409 |
94 |
76.1% |
6.9% |
|
Nairobi CBD |
11,863 |
82 |
83.8% |
6.9% |
|
Thika Road |
12,571 |
78 |
77.6% |
5.7% |
|
Mombasa Road |
11,250 |
73 |
64.6% |
5.1% |
|
Average |
12,113 |
94 |
77.9% |
7.3% |
Source; Cytonn Research
- Retail Sector
- Naivas Supermarket Opens a New Outlet in Naivasha
During the week, Naivas Supermarket opened a new outlet in Naivasha’s Safari Centre, along the Nairobi – Nakuru Highway. This brings the retailer’s operating outlets to 84, and the fifth to be opened so far in 2022 in various counties such as Kiambu, Machakos, and, Nairobi. Naivas continues to outperform other retailers in its expansion drive to maintain market dominance, when compared its peers such as QuickMart and Chandarana Supermarkets that currently have 51 and 24 branches, respectively. In light of this, the retailer also plans to open another outlet in Meru town this year. The opening of the new outlet in Naivasha is driven by:
- availability of prime retail space,
- strategic location of the retail center along the busy Nairobi Nakuru Highway which promotes quick access to the retail store, and,
- Nakuru’s high population growth rate at 3.2% compared to Kenya’s 2.3%, which in turn promotes rapid demand for goods and services.
In terms of performance, according to our Kenya Retail Report 2021, Nakuru County where Naivasha lies recorded average rental rates of Kshs 59 per SQFT, 39.9% lower than Kenya’s market average of Kshs 118 per SQFT, a sign of affordability being the retailer’s basis of investments. This is also coupled with high occupancy rates at 80.0%, 2.4% points higher than the market average of 78.4%, signaling more uptake of retail spaces in the area and an indication of high footfall in retail centers. The performance of the key urban centers in Kenya is as summarized below:
|
Summary of Retail Performance in Key Urban Cities in Kenya 2021 |
|||
|
Region |
Rent (Kshs) 2021 |
Occupancy Rate 2021 |
Rental yield 2021 |
|
Mount Kenya |
128 |
81.7% |
7.9% |
|
Nairobi |
168 |
75.8% |
7.5% |
|
Mombasa |
119 |
77.6% |
6.8% |
|
Kisumu |
101 |
74.6% |
6.4% |
|
Eldoret |
131 |
80.8% |
6.3% |
|
Nakuru |
59 |
80.0% |
6.1% |
|
Average |
118 |
78.4% |
6.8% |
Source: Cytonn Research 2021
The table below shows a summary of the number of stores of the key local and international retailer supermarket chains in Kenya;
|
Main Local and International Retail Supermarket Chains |
||||||||||
|
Name of retailer |
Category |
Highest number of branches that have existed as at FY’ 2018 |
Highest number of branches that have existed as at FY’ 2019 |
Highest number of branches that have existed as at FY’ 2020 |
Highest number of branches that have existed as at FY’ 2021 |
Number of branches opened in 2022 |
Closed branches |
Current number of branches |
Number of branches expected to be opened |
Projected number of branches FY’2022 |
|
Naivas |
Local |
46 |
61 |
69 |
79 |
5 |
0 |
84 |
1 |
85 |
|
QuickMart |
Local |
10 |
29 |
37 |
48 |
3 |
0 |
51 |
0 |
51 |
|
Chandarana |
Local |
14 |
19 |
20 |
23 |
1 |
1 |
24 |
4 |
28 |
|
Carrefour |
International |
6 |
7 |
9 |
16 |
0 |
0 |
16 |
0 |
16 |
|
Cleanshelf |
Local |
9 |
10 |
11 |
12 |
0 |
0 |
12 |
0 |
12 |
|
Tuskys |
Local |
53 |
64 |
64 |
3 |
0 |
61 |
3 |
0 |
3 |
|
Game Stores |
International |
2 |
2 |
3 |
3 |
0 |
0 |
3 |
0 |
3 |
|
Uchumi |
Local |
37 |
37 |
37 |
2 |
0 |
35 |
2 |
0 |
2 |
|
Choppies |
International |
13 |
15 |
15 |
0 |
0 |
13 |
0 |
0 |
0 |
|
Shoprite |
International |
2 |
4 |
4 |
0 |
0 |
4 |
0 |
0 |
0 |
|
Nakumatt |
Local |
65 |
65 |
65 |
0 |
0 |
65 |
0 |
0 |
0 |
|
Total |
|
257 |
313 |
334 |
186 |
9 |
179 |
195 |
5 |
200 |
Source: Cytonn Research
- Optica Opens a New Outlet in Kitengela and Kilimani
During the week, Optica Limited, a local eye-wear retailer, opened two new outlets at Rubis Business Block in Kitengela, and in Argwing’s Arcade in Kilimani. This brings the retailer’s total number of operating outlets countrywide to 62, after having opened a new outlet in Ruiru’s Kamakis, in January 2022. The opening of the two new outlets was driven by:
- its expansion strategy to further reach out its product and services to target clients,
- suitable locations of the outlets, along the busy Nairobi-Namanga Highway, and Argwings Kodhek Road, thus promoting accessibility to the store, and,
- increasing demand for prescription sunglasses which also offer protection from UV rays.
In terms of performance, according to the Cytonn Q1’2022 Markets Review, satellite towns where Kitengela lies recorded average rental rates per SQFT of Kshs 145, 14.7% lower than the market average of Kshs 170 per SQFT. The retailer is therefore leveraging on the affordability of retail spaces in Kitengela as basis of investments. For Nairobi, the retailer is leveraging on Kilimani’s remarkable performance with an average investor return of 9.9% against a market average of 7.9%, as its basis for investments, and the existence of a high footfall to retail centers in the area. The table below shows the submarket performance of nodes in the Nairobi Metropolitan Area (NMA):
|
Nairobi Metropolitan Area Retail Market Performance Q1’2022 |
|||
|
Area |
Rent Kshs/ SQFT Q1’2022 |
Occupancy (%) Q1’2022 |
Rental Yield (%) Q1’2022 |
|
Karen |
200 |
85.0% |
10.0% |
|
Kilimani |
183 |
86.8% |
9.9% |
|
Westlands |
214 |
72.9% |
9.5% |
|
Ngong Road |
164 |
81.0% |
8.3% |
|
Kiambu road |
179 |
77.6% |
8.1% |
|
Mombasa road |
146 |
78.6% |
7.0% |
|
Thika Road |
156 |
74.2% |
6.6% |
|
Satellite towns |
145 |
70.8% |
6.2% |
|
Eastlands |
131 |
73.0% |
5.8% |
|
Average |
170 |
77.2% |
7.9% |
Source: Cytonn Research 2022
Kenya’s retail sector continues to record rapid expansion and developments by both local and international retailers such as Naivas, QuickMart, Eat N’ Go Limited, Optica Limited, and, ChicKing Limited. We expect a similar trend to continue driving performance of the sector, with some of the supporting factors being:
- Kenya’s recognition as a regional hub thus enhancing foreign investments. In light of this, ChicKing, an international fast food chain, announced plans to open 30 new outlets in Kenya, over the next five years. Also, Eat’N’Go Limited recently opened a new outlet in Westlands Square, Nairobi, and plans to open a total 100 new stores in Kenya,
- Favorable business environment as Kenya also currently ranks position 56 worldwide in terms of ease of doing business according to World Bank,
- Positive Demographics driving demand for goods and services. According to the World Bank, Kenya’s urbanization and growth rates currently stand at 4.0% and 2.3%, respectively, which is high compared to the world’s 1.8% and 1.0%, respectively, and,
- Infrastructure developments opening up areas for investments such as roads and water systems.
Despite the above driving factors, the current oversupply of retail spaces at 3.0 mn SQFT in the Nairobi Metropolitan Area, and, 1.7 mn SQFT in the Kenyan retail market, continues to weigh the optimum performance of the sector.
- Hospitality Sector
- PrideInn Hotels Opens a New Hotel dubbed PrideInn Mara Camp in Narok County
During the week, PrideInn Hotels and Resorts, a local hospitality Group, opened a new hotel at the Maasai Mara dubbed PrideInn Mara Camp, in Narok County. The luxury Camp which sits on a 25-acre piece of land along River Talek banks consists of 31 cottages worth 1,000 SQFT each, a 70-seater deck restaurant, a 700-hotel room capacity, and, 15 safari tents. This comes after the hotel group signed a management contract with Azure Hotels and Resorts in 2020 to merge operations, thereby bringing its current branches to 7 branches countrywide, with the other recent opening being the Westlands PrideInn that was also rebranded from Azure Hotel. The opening of the hotel is part of PrideInn’s plans to increase its footprint to all 47 counties in the country in the next 10 years, and has so far identified 10 undisclosed counties that they aim to invest in. PrideInn’s decision to open the new branch is mainly driven by:
- The strategic location of the hotel in a tourism hotspot area i.e near the Maasai Mara National Park,
- Availability of prime property for uptake, and,
- Presence of adequate infrastructure promoting investments, accessibility, and, tourism activities such as the Maasai Mara Airstrip.
- Hilton Hotel Announces Plans to Open a New Branch dubbed Kwetu Nairobi, in Westlands
In addition, during the week, Hilton Hotel, an international hotel chain, announced plans to open a new branch in Westlands dubbed Kwetu Nairobi, at the junction of Peponi and Kitisuru Roads. The 100-room hotel capacity will therefore bring Hilton’s operating branches in Kenya to three, with the other two being Hilton Nairobi Hurling ham, and, Hilton Garden Inn Nairobi. This will therefore affirm Hilton’s stay in the Kenyan hospitality sector after having announced plans to shut down its icon Nairobi Central Business District (CBD) branch indefinitely as from 31st December 2022, in April 2022. The decision to invest in Westlands is driven by:
- Close proximity to the Nairobi CBD,
- Westlands popularity as a commercial zone thus suitable for hospitality activities such as conferences and meetings,
- Adequate infrastructure and amenities such as the Nairobi Expressway, Westgate Mall, and Kitisuru Road,
- Presence of numerous international embassies and organizations that are key markets for the hospitality sector, with others being the German Embassy, Netherlands Embassy, Eastern Africa Farmers Federation, and, HD Centre for Humanitarian Dialogue, and,
- Direct accessibility to and from Kenya’s main international airport, the Jomo Kenyatta International Airport (JKIA), via the Nairobi Expressway.
Kenya’s hospitality sector continues to show resilience in its performance, development, and expansion activities. This has mainly boosted by the increased international tourism arrivals into the country, conferences, leisure, and, sport activities, following the reopening of the country in 2021. In turn, the overall number of operating hotels and hotel bed occupancies in Kenya has also been increasing. In May 2022 Radisson Blu, an international hotel chain, resumed its operations in Nairobi’s Upperhill, after having been shut down for 16 months, and therefore becoming the second five-star hotel to resume operations in the country, after Norfolk hotel which reopened in April 2022. Additionally, Central Bank of Kenya’s Monetary Policy Committee Hotels Survey March 2022, highlights that the overall number of operating hotels in Kenya stood at 100.0% in March 2022, whereas the overall bed occupancy rates increased to 57.0% in March 2022, from the 21.0% that was recorded in January 2021. This is a sign of the hospitality sector recovery, and, the resumption of activities after having been one of the worst hit economic sectors, with the onset of the pandemic.
We expect the hospitality sector’s performance to continue being resilient, fueled by factors such as aggressive marketing of the tourism sector, conferences and events boosting hotel and service apartments’ occupancies, and, the safari rally expected to be hosted in Kenya annually until 2026.
- Infrastructure Sector
In the cabinet meeting that was held on 12 May 2022, President Uhuru Kenyatta approved Laikipia County Government’s request to float the 7 – year Infrastructure Bond worth Kshs 1.2 bn, at the Nairobi Stock Exchange. The infrastructure bond, which does not have a green shoe option and capped at a 12.0% interest rate per annum, will be used to finance 16 infrastructure projects including water supply for agricultural production, sewerage system establishments, street lighting, upgrade of markets, and, walkways infrastructure rehabilitation, among other projects. Some of the towns targeted for development in the subject County include Nyahururu, Nanyuki, Kinamba, Ol Jabet, Wiyumiririe, Doldol, Karuga, Naibor, Kalalu, Mouwarak and, Pesi towns. We expect to see a high subscription of the infrastructure bond given the increased investor appetite for bonds in the market, since they are also tax-free. This also comes at a time when financial constraints continue to be the major challenge incurred while undertaking infrastructural developments thus government sourcing for other financing options such as issuing of bonds. Therefore, with the approval and success of the infrastructure bond, we also expect the aforementioned projects to be fast tracked, and in turn boost the overall performance of the Laikipia economy, as well as the Real Estate sector in the area.
In addition, during the week, Transport Principal Secretary Joseph Njoroge announced that the construction of the Nairobi City Railway Project worth Kshs 27.9 bn would commence by August 2022. The infrastructure project, which is part of the wider Nairobi Railway City redevelopment program, will be jointly developed with the Kenyan and United Kingdom governments, after having signed a partnership deal during the Africa Investment Summit that was held in 2020. The railway project will cover 425 acres of the central Nairobi; have 8 railway lines and additional four lines for freight services, upon its completion by December 2024. Once completed, the project is expected to; i) spur economic growth in Nairobi County, ii) minimize transport congestion while also promoting accessibility to various areas, and, iii) boost property investments in Nairobi.
Kenya’s infrastructure sector continues to witness rapid developments aimed at improving the economy’s performance. This is evidenced by the numerous ongoing and completed projects in the country resulting from government’s continued focus on the same. We expect a similar trend in the sector with other projects in pipeline being: Nairobi Commuter Rail project, the Nairobi Western Bypass, Athi River-Mlolongo-Mombasa exit, and, the Eastern Bypass project, among many others. Additionally, the government plans to increase budgetary allocation to the infrastructure sector by 16.4% to 212.5 bn in FY’2022/23 from Kshs 182.5 bn in FY’2021/2022 according to the proposed FY’2022/23 Budget Estimates, highlighting that infrastructure remains a priority area for the current government. The graph below shows the budget allocation to the transport sector over last ten financial years;
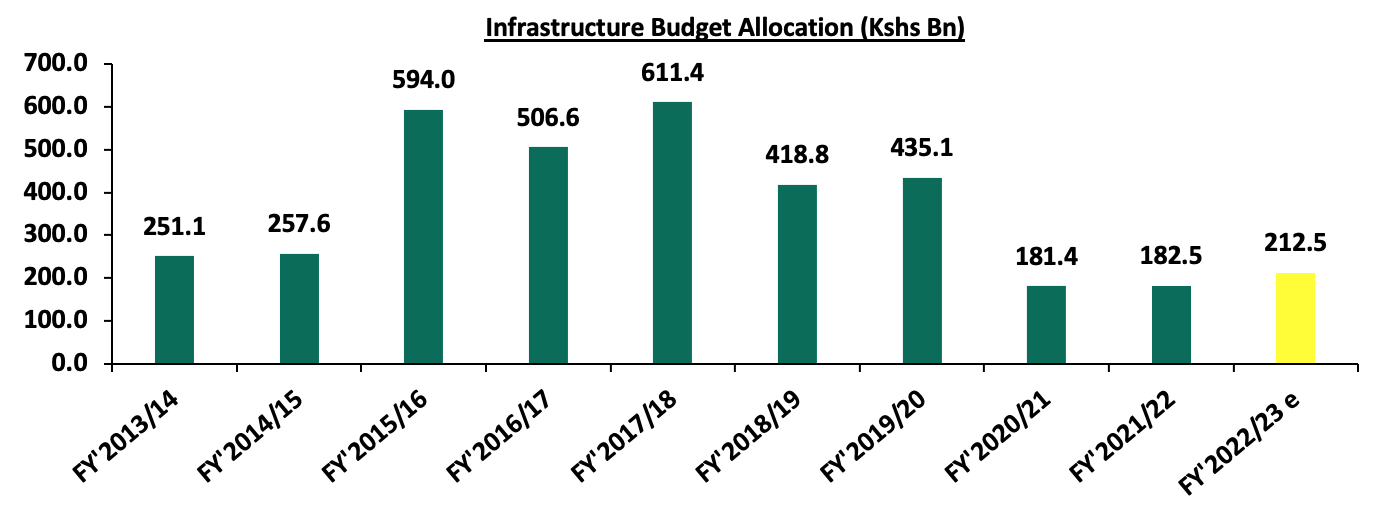
Source: National Treasury of Kenya
- Industrial Sector
During the week, Purple Dot International Limited, a Real Estate development firm, announced plans to develop a warehousing hub worth Kshs 600.0 mn at the Harvest Industrial Park in Athi River, Machakos County. The warehouse facility, which will total 7,425 SQFT, will consist of 24 units with three level spaces. Additionally, the first phase of the project development is expected to be completed in a span of 18 months, thus adding up to the more than 300 warehouses currently owned by Purple Dot. The development move by the Real Estate firm comes barely two months after Grit Real Estate Income Group, a Mauritius based Real Estate Investment Company, completed the purchase of Orbit Products Africa, a warehouse and manufacturing facility located in Machakos County, at a cost of Kshs 6.1 bn, signifying an increasing investment appetite in Kenya’s industrial sector. The decision to invest in Athi River is driven by:
- Strategic location of the industrial park, near the Mombasa Road and Mlolongo Athi River Road, thus promoting accessibility to and from the place,
- Completion of the Mombasa Inland Container Depot in Syokimau thus enabling ease of access to warehousing facilities, and,
- Increased demand for warehouse storage facilities, because of the popularity of e-commerce in the country.
We expect the sector to continue recording a boom in activities and performance mainly as a result of the rapid infrastructural developments such as the Standard Gauge Railway and the Nairobi Mombasa Highway, that enhance transport of goods and cargo, coupled with increased demand for warehouse and storage facilities resulting from the rise in e-commerce.
- Real Estate Investment Trusts (REITS)
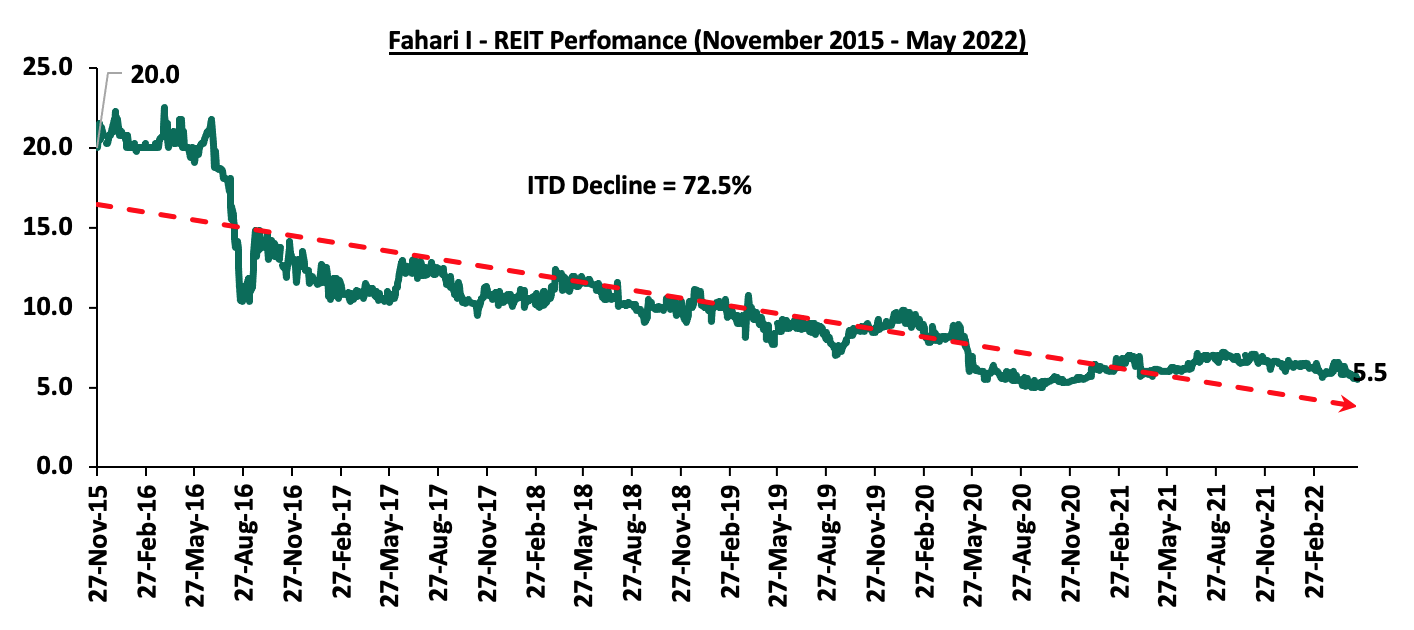
In the Nairobi Stock Exchange, ILAM Fahari I-Reit closed the week trading at an average price of Kshs 5.5 per share. This represented a 3.5% and 14.1% Week-to-Date (WTD) and Year-to-Date (YTD) decline respectively, from Kshs 5.7 per share and Kshs 6.4 per share, respectively. Also, on Inception-to-Date (ITD) basis, the REIT’s performance continues to be weighed down having realized a 72.5% decline from Kshs 20.0. The graph below shows Fahari I-REIT’s performance from November 2015 to 20th May 2022:
We expect Kenya’s property market to continue being shaped by; increased construction activities in the housing sector, aggressive expansion in the retail sector, improvement in the performance of the hospitality sector, and, rapid infrastructure developments. However, setbacks such as financial constraints, oversupply in select property sectors, and, investor’s minimal appetite for the REIT instrument is expected to continue weighing down the overall performance of the property sector.
The trend towards Public-Private Partnerships (PPPs) has continued to take shape with numerous developing nations across the world realizing that economic development should not be limited to the framework of either public or private sector, that the two can work together to accelerate economic development. PPPs continue to play a crucial role in improving efficiencies in delivering public services, especially narrowing the infrastructure gap. Kenya as a developing nation, has witnessed the pros of PPPs in different thematic Real Estate sectors including infrastructure, tourism, and, housing among others. This has been made possible due to shifting the development, maintenance, and operational risk on to the private sector often resulting in higher quality and overall better results as the government capitalizes on private sector expertise.
We have previously covered a topical on PPPs dubbed ‘Public Private Partnerships in the Real Estate Industry in Kenya’ where we looked at the status of PPPs in Kenya with an aim of giving recommendations on what can be done to make them more efficient. This week, we shall update the progress of PPPs in Kenya and offer recommendations on strategies that can be adopted to ensure effectiveness of PPPs by looking into:
- Overview of Public-Private Partnerships (PPPs)
- Public- Private Partnerships (PPPs) in Kenya
- Case Study: Canada Public-Private Partnerships (PPPs)
- Recommendations for Success of PPPs in Kenya
- Conclusion
Section I: Overview of Public-Private Partnerships (PPPs)
A Public-Private Partnership is an agreement between the public sector and the private sector for the purpose of designing, planning, financing, constructing, and/or operating projects that would traditionally be regarded as falling within the remit of the public sector. PPPs became popular due to the increasing demand by citizens of different countries, for quality and affordable services in sectors such as transport, water and sewerage, telecommunications, power, social services. These demands could not be fully met by the public sector alone hence the adoption of the arrangements. There are different types of PPP arrangements which include:
- Build Operate Transfer (BOT): the private sector institution finances, builds, maintains and operates a facility for a given period of time and recoups its investment by collecting tolls during the concession period,
- Build Own Operate (BOO): the private entity will finance, build and operate the project but there will be no transfer back to the government,
- Build Own Operate Transfer (BOOT): the private sector builds, owns, operates and eventually transfers the PPP project to the public sector after an agreed period of time,
- Build Transfer Operate (BTO): the private organization finances, builds and upon completion, transfers the ownership to the public sector agency. The public sector agency then leases the facility back to the private developer under a long term lease. During the lease, the private developer operates the facility and earns a return from user charges, and,
- Design Build Finance Operate (DBFO): the private sector is responsible for financing, designing, construction and operation of the project and is compensated by service payments from the government during the life of the project.
According to World Bank PPPs are presented not only as a way of bringing needed additional investment to public infrastructure but also as a mechanism for improving infrastructure planning and project selection. It is also a mechanism for enhancing project management and guaranteeing adequate maintenance, avoiding cycles of construction followed by persistent neglect and then high-cost reconstruction. The International Finance Corporation (IFC) as part of the World Bank Group, advises governments implementing PPPs by providing advice on technical, legal, and regulatory requirements; building capacity; addressing social and sustainability issues; and devising the strategies necessary to deliver successful PPPs, and this has helped governments leverage the expertise and efficiency of the private sector, raise capital, and spur development.
- Global Overview
Globally, PPPs have emerged as the main contractual vehicle to facilitate private participation in economic development. In developed nations such as the Canada, Australia, Japan and the United Kingdom, there are dedicated and specialized PPP units that act as a policy tool to facilitate projects and attract capital for development. Canada has managed to have one of the best models having a total of 291 active projects worth USD 134.5 bn. This has been supported by the fact that Canada established a national not-for-profit non-partisan, member-based organization in 1993 with broad representation from across the public and private sectors named Canadian Council for Public-Private Partnerships (CCPPP). The agency’s aim has been to facilitate the adoption of international best practices, and educates stakeholders and the community on the economic and social benefits of public-private partnerships and encourage PPPs.
- Sub-Saharan Region Overview
PPPs in SSA are still in a developmental phase although there are indications that their uses are increasing. South Africa PPP sector leads in Africa, as the country has a strong legislative framework implemented by its National Treasury, which manages risk and helps to stabilize returns for private investors having been in existence since mid-2000. As at 2021, 34 PPP projects valued at USD 5.6 bn had been completed in sectors including health, transport, tourism, water and sanitation, and office accommodation. Other countries that have embraced PPPs include; Uganda with 28 projects worth USD 1.9 bn reaching final closure as of 2018; Rwanda with 10 PPP projects worth USD 694 mn in the same period and Kenya with 23 projects worth USD 2.9 bn reaching final closure as of 2018. We will now look into PPPs in Kenya which has a pipeline of over 70 projects at different stages of approval and in different economic sectors.
Section II: Public Private Partnerships (PPPs) in Kenya
PPPs in Kenya were established under PPP Policy Statement 2011, and later revised in Act 15 of 2013 titled ‘Public Private Partnership Act’, which stipulates that; i) the government retains total strategic control on the service, ii) the government is mandated to secure new infrastructure which will become the government’s assets at the end of the contract period, and, iii) allocation of project and performance risks is to the party best able to manage or mitigate. Kenya has one of the more mature PPP markets in Africa with a comprehensive legislative framework where recently in December 2021, the Public Private Partnerships (PPP) Bill 2021 was signed into law. The purpose of the Act was to address the shortcomings of the PPP Act 2013 by including a framework for streamlined project processes with clear timelines, expanded procurement options and robust processes for Privately Initiated Investment Proposals (PIIP). They key take outs from the Act are;
- Establishing the Directorate of Public Private Partnerships to replace the PPP Unit under 2013 legislation, and conferred broad but separate functions from those of a PPP Committee. The directorate shall be the lead institution in the implementation of PPP projects. Some of the activities under the directorate of PPPs include; guiding the selection of PPP projects, overseeing project appraisals as well as contract management frameworks for projects. This is in an aim to establish open, efficient and equitable processes for the implementation, management and monitoring of projects,
- Concession period for investors involved in State-owned Build-Operate-Transfer (BoT) projects to be capped at 30 years. The timeline set is assumed sufficient for investors to recoup their major initial investments. However, in setting timelines within this range, the contracting authorities must take into account the lifespan of the technology used, investment standards required, economic and financial viability, and, the consideration for maintaining delivery standards,
- The new law expands the role of the private sector in PPP initiatives beyond financing to include construction, operation and maintenance of the projects. It also adds a number of permissible contract structures, including public-private joint ventures and strategic partnerships. The effect of these changes is to broaden the scope of what is classed as a PPP, funnelling more contracting arrangements between the public and private sector, and,
- The County Governments can enter into PPP agreements with a private party and shall be responsible for administration of the entire project after conducting a feasibility study. After approval by the county assembly, the counties are expected to submit a list of projects to the Directorate of Public Private Partnerships for inclusion in the published national list of projects. The counties will be operating under an expanded procurement process with the inclusion of direct procurement and a greater clarification on timelines. This includes the period within which bids must be evaluated and for appeals by bidders. An example of this is the planned Laikipia County Infrastructure Bond analysed in the Real Estate section in this topical.
Other regulatory changes to support PPPs development in Kenya include the addition of debt instruments for financing of infrastructure or approved affordable housing projects under the PPPs Act’ as an allowable investment class under the Retirement Benefits Regulations. In effect, Pension schemes can invest up to 10.0% of their assets in PPPs. Moreover, in support of the above, the government in the FY’2022/23 Budget Statement mentioned that;
- It has elevated the PPP Unit to a Directorate in the National Treasury,
- It is putting in place a joint Public Investment Management and Public-Private Partnership planning framework and strengthening the coordination between Public Debt Management Office and the Public Private Partnership Directorate for effective control of fiscal exposure, as envisioned in the new PPP Act 2021, and,
- It is planning to fully operationalize the Public-Private Partnership Project Facilitation Fund to support activities of the PPP Directorate and those of the contracting authorities in the preparation phase of projects during the tendering processes and project appraisal.
With this enabling environment, the government is signalling high confidence in PPPs and its internal processes. We therefore expect the trend towards PPPs to be on the rise with the PPP Directorate having already reviewed the priority sectors for PPP Project implementation in the country with the main ones including;
- Transport and Infrastructure,
- Health Solutions including Telemedicine,
- Green and Blue Solutions including, Forestry, Fish Processing and Wildlife Conservation,
- Water and Sanitation,
- Housing including Student Hostels,
- Industrial Parks and Manufacturing, and,
- ICT including Intelligent Traffic Management System
- PPPs in Kenya’s Real Estate Sector
The Kenyan Real Estate sector continues to make significant contribution to GDP which currently stands at 8.9% as at 2021, according to the Kenya National Bureau of Statistics. The improved performance in the sector has been supported by focus on housing, continuous infrastructural development in terms of roads, water, electricity and sewerage systems, and, good performance of the tourism industry boosting the hospitality sector. Initiatives to support this good performance has not only been facilitated by the government but also complementary efforts by the private sector through PPPs and PIIPs, which have catapulted numerous development projects.
We have witnessed progress of PPPs in Kenya by numerous projects attaining financial closure and confirming the benefit of the partnerships in project delivery. In early May 2022, the government launched the 27.1 km Nairobi Expressway on a trial basis, a PPP road project between the National Government through the Kenya National Highways Authority (KENHA) and the China Road and Bridge Construction Corporation (CRBC) on a Build-Operate-Transfer (BOT) model. The road in addition to Thika Road, Southern, Northern, Eastern, and Western Bypass, which is 99.0% complete, have put the Nairobi on the map as one of the cities in Africa enforcing industrialization. In the housing sector, a number of PPP projects in affordable housing are ongoing with the most anticipated one being the Pangani Affordable Housing Project which was expected to be completed in May 2022, however, the government pushed the expected completion date to June 2023.
In the Real Estate sector, the Kenyan government has PPP projects mainly in infrastructure, affordable housing and student housing, hospitality and Privately Initiated Investment Proposals (PIIPs) i.e;
- Infrastructure and Housing
The main PPP projects in Kenya are infrastructure and housing as highlighted below,
|
Major Real Estate Public-Private Partnership Projects in Kenya |
|||||
|
Theme |
Project |
Partnership |
Project Start Date |
Project Status |
Expected Date of Completion |
|
Infrastructure |
Nairobi Express Way |
National Government and a Private Company |
October 2020 |
Completed |
- |
|
Lamu Port South Sudan Ethiopia Transport-3 berths (LAPPSET) |
National Government and other East African Countries |
June 2018 |
Completed |
- |
|
|
Nairobi-Western By Pass |
National Government and China Exim Bank |
February 2020 |
Ongoing |
August 2022 |
|
|
Affordable Housing |
River Estate, Ngara |
National Government and Edderman Property Limited |
March 2019 |
Ongoing |
- |
|
Pangani Housing Project |
National Government and Tecnofin Kenya Limited |
May 2020 |
Ongoing |
June 2023 |
|
|
Student Housing |
Kenyatta University Hostels (10,000 beds) |
Africa Integras (Kenya LLC), EPCO Contractors, Triad Architects and Broll Kenya Facility Managers |
2015 |
Ongoing |
2035 |
|
University of Embu Hostels (4,000 beds) |
Meridiam, JV Unicamp and PDM-Roko-CBA Capital and JV Unicamp |
2018 |
Pre-Qualification |
2038 |
|
|
Moi University Hostels (15,000 beds) |
Kesa, Meridiam, JV Unicamp and PDM-Roko-CBA Capital and Chinese Overseas |
2018 |
Pre-Qualification |
2038 |
|
|
South Eastern Kenya University Hostels (5,400 beds) |
Kesa and PDM Roko-CBA Capital |
2018 |
Pre-Qualification |
2038 |
|
Source: Online Research
Other fast mover PPP projects in the pipeline include;
|
Project Title |
Sector |
|
Nyali Bridge, Mombasa |
Transport/Roads |
|
Nairobi- Thika Road ( O&M) |
Transport/Roads |
|
Two sections of Mombasa – Nairobi – Malaba Road (Mombasa – Mariakani, Naivasha-Mau Summit ) |
Transport/Roads |
|
Nairobi Commuter Rail |
Transport |
|
Kisumu Sea Port |
Transport/ Airport |
|
Nairobi Jomo Kenyatta Airport Expansion |
Transport/ Airport |
|
2nd Container Terminal Mombasa |
Transport/Ports |
|
Housing for Security Forces |
Accommodation |
|
Mombasa Conventional Centre |
Tourism |
- Hospitality
The hospitality sector consists of the following PPP projects;
|
Project Title |
County |
Sector |
Contracting Authority |
Value (Kshs mn) |
|
Mombasa Conventional Centre |
Mombasa |
Tourism |
Tourism Finance Corporation |
24,000 |
|
Nairobi International Convention and Exhibition Center (NAICEC)
|
Nairobi |
Tourism, Trade and Industrialization |
Bomas of Kenya |
8,023 |
- Privately Initiated Investment Proposals (PIIP)
PPP projects can either be solicited or Privately Initiated Investment Proposal (PIIP). PIIP are a form of unsolicited PPP where the private party makes a proposal to undertake a PPP project at their own initiative by submitting the proposal to the government. In any event, the proposal should be developed to such level of empirical detail including assessment of the value-for-money proposition, the affordability proposition, and the risk transfer proposition. Examples of PIIP projects in the pipeline in Kenya are highlighted below;
|
Project Title |
County |
Sector |
Contracting Authority |
Value ( Kshs mn ) |
|
KCB Usalama Housing Program (KUHP) |
Nairobi |
Housing |
KCB Bank |
160.2 |
|
Likoni Crossing Aerial Cable Car |
Mombasa |
Transport and Infrastructure |
Kenya Ferry Services Limited (KFSL) |
14,377.8 |
|
Lamu Port (Fist Three Berths) |
Lamu |
Transport and Infrastructure |
Kenya Ports Authority |
18,900 |
|
Lamu-Garissa-Isiolo Highway |
Lamu |
Transport and Infrastructure |
Kenya National Highways Authority (Ken |
62,160 |
- Benefits and Challenges facing PPPs in Kenya
Benefits
The Kenyan government’s consideration to use PPPs to deliver development projects has proven to be beneficial as they capitalize on the private sector’s capacities and the public sector’s ability to incentivise private sector investments. Some of the major benefits experienced by the government include;
- Access to Finance for Projects: PPPs have granted the government access to private capital to carry out various development projects that would otherwise have taken a long time to implement. With the government having to focus on different sectors of the economy, priorities may shift to specific sectors and therefore lead to sluggish development of others. The private financing therefore allows the government to concentrate on important matters such as regulation, policy and planning and support the private sector in implementing development projects,
- Risk Transfer to Private Sector: The private sector has helped the government deliver projects by mitigating risks such as budget overruns, project completion times and other risks such as operational and maintenance risk. The strict adherence to contractual stipulations by most PPPs has assured the government of efficiency in delivery of projects,
- Government Access to Private Sector Efficiencies: The government has been able to acquire new and improved technology as well as expertise of professionals through PPPs as a result of undertaking projects by contracting foreign expatriates from countries such as China and Japan, who are more organised as they have worked on similar construction projects in their countries,
- Large Scale Investment and/or Development: PPPs have facilitated large-scale development projects in areas such as housing and infrastructure that would cause financial strain to taxpayers if implemented by the government. Citizens only have to pay subsidized prices over a flexible period of time to enable the investors gain return on their investments as opposed to a tax burden,
- Enhancement in Ease of Doing Business: PPPs have promoted passing of regulations that have improved the ease of doing business in Kenya due to the establishment of regulatory guidelines that have given a roadmap on procedures to be followed thus boosting foreign investor confidence in undertaking Kenyan projects. The PPP Act of 2021 has a clearer framework on concessions and hence investors are not left in limbo on the arrangement of the PPPs, and,
- Institutional Grade Projects: Through PPPs the government has been able to deliver projects of high quality with international standards. These developments are expected to boost investor confidence in the country thus enhance international relations and position Kenya as one of the well developed nations in Africa.
Challenges
Despite the benefits, PPPs have fallen short in achievement of development initiatives attributed to:
- Inadequate Planning for PPP Projects: There is a challenge in identifying suitable projects and gauging the risks involved, as well as testing the likelihood of success. In addition, selecting the most qualified project developer for a specific project has always been a tricky task when the pool of investors with capacity for PPPs is limited. PPP projects without sound plans have therefore led to lack of value for money due to ineffective implementation,
- Lengthy and Irregular Procurement Processes: Part of the delays in the PPP process are as a result of delays in the procurement of transaction advisors, which eventually affects the kicking off of projects. Additionally, cases of corruption in and irregular awarding of tenders raise speculation, hence causing loss of public confidence in the contracted parties,
- Insufficient Bulk Infrastructure Required to Support Development: Kenya has limited supporting bulk infrastructure, e.g. the insufficient sewer lines and drainage systems and poor road networks in areas the development projects are being undertaken, meaning that developers often have to incur costs to develop the infrastructure themselves and this discourages the private sector due to the huge amount required,
- Differing Goals Between the Private and Public Sector: While the private sector mainly focuses on obtaining a return on investment, the public sector’s main interest is on protecting the interests of its citizens by enacting regulations and engaging in projects that benefit the public such as affordable housing PPPs, for example, the price ceilings on affordable housing units discourage the private sector from investing as total returns may be relatively too low compared to the normal market rates for residential units,
- Bureaucracy and Lengthy Approval Processes: Bureaucracy in government systems has led to delays in approvals as applications require to go through different channels, some taking up to 6 months, in order to be granted a green light. Furthermore, some delays in responding to bidders are blamed on the failure to achieve quorum at the various levels required to provide approval, which hampers expeditious decision making,
- Inadequate Risk Mitigation Strategies: There is no specific project implementation team tasked with handling PPP projects from start to finish hence the ineffective monitoring and auditing of finances in PPP projects in Kenya has led to lack of accountability for allocated funds and imprudent utilization of finances as funds end up being spent without consideration of the budgetary allocations, and,
- High Transaction Costs: In the case of unsolicited PPPs, there are high costs involved in retaining consultants to assess the environmental, social and financial implications of a project given the time, data and analytical expertise required for this, with there being no guarantee that the proposal shall be approved and this can discourage them.
Section III: Case Study- Canada Public-Private Partnerships (PPPs)
The Canadian model of Public-Private Partnerships is considered one of the most successful in the world. The Canadian Council for Public-Private Partnerships (CCPPP) defines their PPPs as relating to the provision of public services or public infrastructure and necessitating the transfer of risk from the public to the private sector. There has been a clear recognition of the benefits of PPPs by the Government of Canada in recent years, and the model has been adopted for long-term infrastructure plans which have been introduced by successive governments in the country. However, it is governments at the provincial level that have assumed the leadership role in driving forward the Canadian PPP market. Some examples of PPP agreements in Canada include:
- Operation & Maintenance Contract (O&M): A private operator, under contract, operates a publicly-owned asset (e.g. water/wastewater treatment plant) for a specified term. Ownership of the asset remains with the public entity,
- Build-Finance: The private sector constructs an asset and finances the capital cost only during the construction period and gets returns depending on agreement with the government,
- Design-Build-Finance-Maintain (DBFM): The private sector designs, builds and finances an asset and provides hard facility management or maintenance services under a long-term agreement,
- Design-Build-Finance-Maintain-Operate (DBFMO): The private sector designs, builds, finances and provides hard facility management or maintenance services under a long-term agreement. Operation of the asset is also included in projects such as bridges, roads and water treatment plants, and,
- Concession: A private sector concessionaire undertakes investments and operates the facility for a fixed period of time after which the ownership reverts back to the public sector.
Canada so far boasts of a total of 291 active projects worth USD 134.5 bn in sectors such as Health, Transport, Water, Accommodation, Energy, among others with 68 on the pipeline.
- Success Factors of PPPs in Canada
- Clear Legislative Framework and Public Support
Among the general public in Canada, there has been a growing public acceptance of a greater role for the private sector in the delivery of infrastructure services across the country. Polls conducted on behalf of The Canadian Council for Public-Private Partnerships (CCPPP) have shown growing public support having realized benefits such as enhanced quality of public infrastructure and services; capacity of PPPs to drive Canadian employment and economic growth; opportunities for smaller, local companies, who frequently sub-contract with larger firms to take on specialized components of PPP projects. Legally, under the Canadian approach, PPPs are pursued only when;
- The procuring authority can demonstrate through a robust appraisal process that doing so will generate economic benefits (value for money), over the life of the contract. By maintaining focus on value for the taxpayer, Canada has established credibility for PPPs purely as an innovative asset delivery mode as opposed to its international counterparts that rely on different accounting standards to employ the PPP model as a means of providing additional investment,
- A project goes through a screening process where it is scored against identified criteria and only proceeds to the procurement stage if the weighted score is high, and,
- There is preparation of a procurement options business-case analysis that identifies a delivery model that best suites the project.
The clear legislative framework has gone a long way in fostering trust between the public and private sector have helped to foster a stable, competitive and efficient market environment, which are fundamental to securing the risk-sharing and good, balanced, contractual relations that are at the heart of good project delivery.
- A Stable Pipeline of Projects
The PPP market in Canada has seen strong growth in terms of the number of new projects that have entered the market since 2009. While only nine PPPs entered the procurement phase in 2009, this more than doubled to 20 in 2013 and currently 291 projects are active. The strong pipeline has benefited all players, and, helps to maintain efficient capacity on both the demand and the supply side of the market. This capacity is now being used to expand the use of PPPs into untapped provincial and municipal areas of Canada markets. The stability has had advantages such as;
- Interest by prospective operators are better able to allocate their resources and maintain a presence in the market,
- Securing efficient contract prices and high quality bids due to attracting a high number of bidders, with the public sector benefiting from the stable base of PPP expertise that is established and nurtured with a stable pipeline and level of deal-flow,
- Diversification in management as lower levels of government embrace the PPP concept, and,
- Demand for a wider range of assets, including water and wastewater treatment facilities, public transit infrastructure, and solid waste management assets from its citizens.
- Government Support Through Budgetary Allocation and Specialized Funds
The Canadian government created a PPP fund in 2007 to be coordinated by a specialized PPP office that ultimately evolved to be named ‘PPP Canada’. It has remained supportive and committed to PPPs by ensuring that there is budgetary allocation to the fund over the years. The fund is currently named ‘New Building Canada Fund’ with USD 10.9 bn supporting more than 20 projects in infrastructure, and facilitate rigorous implementation of PPP projects promoted by government as a matter of routine. Other ways in which the Canadian government showed its support for PPP in previous years include;
- Reaffirming its strong commitment to PPPs in a long-term infrastructure plan since 2013 which envisaged a USD 546.1 bn infrastructure financing over a 10-year period leading to 2023,
- Enabled leveraging of capital expenditure of the projects which lie within six provinces and territories and 13 municipalities thus showing support to the private sector players involved in the projects,
- Effective Procurement Processes
Of the mature PPP markets around the world, Canada is acknowledged to have one of the most efficient procurement processes. The median procurement time over the whole programme period is approximately 18 months, compared to the average procurement time for the UK at 34 months. Strategies used in Canada have clearly played a key role in improving the efficiency of the procurement process and have greatly reduced bid costs. These include;
- Rigorous adherence to project timelines and the disciplined avoidance of further bid stages after the Request for Proposal (RFP) stage,
- Fewer information requirements, relying more on the preferred bidder developing their proposal (before and after commercial close) and on protections within project agreements,
- Rapid and transparent bid processes necessitating that a bidder submit proposal which includes full financing. Because the financiers are unable to hold their debt financing commitment for a long time, that provides a strong incentive for the private sector to agree to quick and firm deadlines for procurement, and,
- Greater discipline in avoiding extended project timeline especially after the selection of the preferred bidder through continuous monitoring and evaluation of projects,
These have provided an enabling environment for operations as there is reduced bureaucracy supported by the minimal set of standards to be reinforced.
- Diverse Market of Project Finance:
The Canadian PPP market, attracted numerous international private firms funding their projects since previous years, owing to the firms benefitting from relatively good performance of the country’s banking sectors coupled with diversified sources of funding for projects in the following ways;
- Both Canadian and foreign banks continued to be active in financing Canadian infrastructure conservatively despite the financial crisis of 2008, as they took a more cautious approach to infrastructure lending (typically making only shorter-term loans, up to five-to-seven years),
- There exists flexible financing method for PPPs such as capital markets, and hybrid financing which incorporates a combination of bank debt and long-term bond financing. As at 2015, 30.0% of projects had been financed through these methods. Additionally, the PPP bond markets in Canada, are often structured to be investment grade, as opposed to monoline bond insurance model which covers only one project line, and,
- Canada’s pension funds have spearheaded direct investments in infrastructure since the early 2000s, with one of the highest asset allocation dedicated to infrastructure by pension funds at 5.0% compared to the global average of approximately 1.0%.
This diversification has become a boost to projects hence ensuring that projects can easily kick off and therefore supporting increased developments.
- Decentralized Management of PPPs
The governments at the provincial and municipal level have assumed the leading government role in driving forward the Canadian PPP market. In particular, the provinces of Alberta, British Columbia, Ontario, and Quebec have developed and refined the Canadian PPP model, by establishing their own specialist agencies, and collectively these have helped to create a distinctively Canadian approach to PPP project and programme management. The work of these agencies has benefitted the Canadian market significantly, providing;
- A steady pipeline of well-structured economic and social infrastructure projects;
- Standardized procurement processes, including consistent project agreements and payment mechanisms, evaluation methodologies, and financing requirements, and,
- Fostering a collegiate approach both among and within the provinces, including the sharing of lessons learned and new approaches.
These strategies have enabled provinces and municipalities focus on complex infrastructure delivery thus making their services and expertise available within their respective jurisdictions, and increasingly being an important source of demand for PPPs in Canada.
- Challenges to PPP Projects in Canada
- High Costs
Despite the fact that Canada has risk analysis and value-for-money accounting used to justify PPPs, the method is sometimes flawed hence leading to excess project costs. This forces governments in Canada will to rescue or bail out a growing number of PPP projects. There are also higher PPP transactions fees associated with longer and more complex contract negotiations, and the private sector's required return on investment, usually paid by the government.
- Poor Risk Evaluations
The intensiveness of how Canada invests in many PPPs projects underestimates the risk that it poses to the government when the governments will always be ultimately accountable for delivering public services and infrastructure. Canada may need more investment enhance their economy, but they cannot afford more expensive, unaccountable, and risky public-private partnerships considering they have experienced cases of unsuccessful PPPs.
Section IV: Recommendations for PPPs Success in Kenya
Public Private Partnerships have enabled Canada to deliver numerous development projects that have industrialized the country, and Kenya can emulate Canada’s success in delivery of PPP projects in the following ways:
- Regulatory Framework: The government of Kenya has made a great stride in improving regulatory framework for PPPs through the PPP Act 2021, especially in matters of concession period. It should now consider ensuring that all the processes are clear in regulations to ensure that projects undertaken ensure value-for- money just like the Canada model which has a clear framework for procurement and risk analysis of projects before implementation. It can also consider amending regulations and legislation to exempt smaller projects from onerous requirements, taking specific conditions into consideration.
- Decentralization of PPPs: In future, the government should consider decentralizing PPPs from the National Government to County governments as seen in Canada where management of PPPs is decentralized to provincial and municipal governments. This will encourage uptake of PPP projects and enhance development activities at the county level. In this line;
- It will reduce the bureaucratic processes for getting contracts at the national level and provide options for investment in different counties, and,
- It will ensure that county governments are more involved economic development of the county.
- Financing for Projects: The government should incorporate provisions for supporting PPPs for example ensuring that there is budgetary allocation to the Kenyan Project Facilitation Fund which supports Contracting Authorities in project preparation, supports funding gap and offers contingent liability support. This will help make projects commercially viable for private investors for example just as the case for Canada where the PPP fund has budgetary allocation. The option of diversification through bond issuance should also be supported to increase the financing pool.
- Housing Related Recommendation: Given Housing as a Big Four Agenda item, we have the following recommendations:
- The government should focus on intensifying the role of the enabling the private sector in construction through implementing incentives to meet project delivery timelines; since announcing the Big Four agenda about 4 years ago, the government has delivered less than 1,000 houses so far thus falling short of the annual 500,000 target. Private sector players with the right incentive will accelerate delivery,
- The government should focus on financing and infrastructure incentives such as diversifying the role of capital markets in pooling resources for private developers instead of looking at land as an important component. There is no shortage of land, as there is a lot of private land looking for Joint Venture partners,
- Provide housing infrastructure incentives in areas such as roads, sewer, water and power, either through delivering them or providing rebates for developers who put them up, and,
- Expedite statutory approvals for developments that are registered as part of the Housing Agenda.
Section V: Conclusion
Public-Private Partnerships (PPPs) in Kenya are becoming an emerging trend in facilitating economic development and completion of various projects. With the launch of numerous infrastructure projects such the Nairobi Expressway, the anticipated completion of Nairobi Western Bypass and Pangani Affordable project, we expect to witness increased public-private partnership agreements. In our view, the country will benefit from these partnerships by enforcing a regulatory framework that supports private sector engagement, ensuring strict adherence to the project timelines and streamline procurement processes. We therefore expect that PPPs will continue enhancing development in the country and thus fast track achievement of industrialization. Additionally, the funding of the government’s ambitious development agenda through Private Public Partnerships (PPPs) does not necessitate the incurring of additional debt, and will help with the ongoing fiscal consolidation efforts and allow the government to refinance other critical sectors, such as agriculture, resulting in increased revenue. Capital expenditure should be restricted to projects with a high social impact or a high Economic Rate of Return (ERR), indicating that the economic benefits outweigh the costs.
Disclaimer: The views expressed in this publication are those of the writers where particulars are not warranted. This publication, which is in compliance with Section 2 of the Capital Markets Authority Act Cap 485A, is meant for general information only and is not a warranty, representation, advice or solicitation of any nature. Readers are advised in all circumstances to seek the advice of a registered investment advisor.

- Talk to us
- Kenya
- P.O Box 20695 - 00200, Nairobi, Kenya
- Cell +254709101200
- Tel +254709101200
- WhatsApp +254741676635
- United States
- +254709101200
- DOWNLOAD OUR APP
-


- Kenya
- 8th Floor, Pinetree Plaza, Kaburu Drive, Ngong Road, Nairobi, Kenya
- USA
- Suite 1150, 1775 Eye Street NW, USA, Washington DC 20006, USA
- Investments
- High Yield
- Private Equity
- Real Estate
- Real Estate
- RiverRun Estates
- Cytonn Towers
- The Ridge
- Taraji Heights
- The Alma