Nairobi Metropolitan Area (NMA) Mixed Use Developments Report 2023, & Cytonn Weekly #50/2023
By Research Team, Dec 17, 2023
Executive Summary
Fixed Income
During the week, T-bills were undersubscribed for the first time in six weeks, with the overall undersubscription rate coming in at 72.3%, a reversal from the oversubscription rate of 156.9% recorded the previous week. Investors’ preference for the shorter 91-day paper persisted, with the paper receiving bids worth Kshs 13.8 bn against the offered Kshs 4.0 bn, translating to an oversubscription rate of 344.8%, albeit lower than the oversubscription rate of 786.1% recorded the previous week. The subscription rates for the 182-day and 364-day papers decreased to 29.2% and 6.3% from 54.1% and 8.0%, respectively, recorded the previous week. The government accepted a total of Kshs 17.1 bn worth of bids out of Kshs 17.3 bn of bids received, translating to an acceptance rate of 98.5%. The yields on the government papers were on an upward trajectory, with the yields on the 364-day,182-day, and 91-day papers increasing by 3.9 bps, 17.3 bps, and 13.6 bps to 15.8%, 15.9%, and 15.8% respectively;
In the primary bond market, the government is seeking to raise an additional Kshs 35.0 bn for budgetary support by issuing a new bond, FXD1/2024/03 with a tenor of 3.0 years and reopening the 5-year bond FXDI/2023/05 with a tenor to maturity of 4.7 years. The coupon rate for the FXD1/2024/03 will be market-determined; however, that of FXD1/2023/05 is set at 16.8%. The bidding opened on 14th December 2023 and will close on 14th January 2024, giving the bonds a value date of 15th January 2024. Any discount amounts and interest payments from the bonds will be subject to a withholding tax at a rate of 15.0%. We anticipate the bonds to be oversubscribed, given the short tenor to maturity of the FXD1/2024/03, with investors attaching higher yields;
During the week, the Energy and Petroleum Regulatory Authority (EPRA) released its monthly statement on the maximum retail fuel prices in Kenya, effective from 15th December 2023 to 14th January 2024. Notably, the prices for super petrol, Diesel, and Kerosene decreased by 2.3%, 1.0%, and 2.0% from the November prices and will retail at Kshs 212.4, Kshs 201.5 and Kshs 199.1 per litre from Kshs 217.4, Kshs 203.5 and Kshs 203.1 per litre respectively;
Equities
During the week, the equities market was on a downward trajectory, with NASI losing the most by 2.1%, while NSE 20, NSE 25, and NSE 10 lost by 1.4% 1.9%, and 2.0% respectively, taking the YTD performance to losses of 27.8%, 24.3% and 11.0% for NASI, NSE 25, and NSE 20, respectively. The equities market performance was driven by losses recorded by large-cap stocks such as Bamburi, Equity Bank, and Standard Chartered Bank of 8.0%, 5.8%, and 3.4%. The losses were, however, mitigated by gains recorded by large-cap stocks such as NCBA, DTB-K Bank, and BAT of 4.5%, 2.2%, and 1.6% respectively;
Real Estate
During the week, property developer Erdemann Property Limited launched a new project in Athi River, Machakos County, that is set to deliver 3,000 residential housing units. The project, dubbed ‘Great Wall Gardens 6’, offers a mix of different amenities, targeting different segments of the market;
In the regulated Real Estate Funds sector, under the Real Estate Investment Trusts (REITs) segment, Fahari I-REIT closed the week trading at an average price of Kshs 6.4 per share in the Nairobi Securities Exchange, remaining relatively unchanged from the previous week;
On the Unquoted Securities Platform, as at 1st December 2023, Acorn D-REIT and I-REIT closed the week trading at Kshs 25.3 and Kshs 21.7 per unit, a 26.6% and 8.3% gain for the D-REIT and I-REIT, respectively, from the Kshs 20.0 inception price. In addition, Cytonn High Yield Fund (CHYF) closed the week with an annualized yield of 18.0%, remaining relatively unchanged from the previous week;
Focus of the Week
In October 2022, we released the Nairobi Metropolitan Area Mixed-Use Developments (MUDs) Report 2022, which highlighted that Mixed-Use Developments (MUDs) recorded an average rental yield of 7.4%, which was 0.9% points higher than the 6.5% rental yield for the retail, commercial office and residential single themes in 2021. The relatively better performance was mainly attributed to; i) an improved business environment, ii) strategic and prime locations of the developments with the capability of attracting prospective clients, and, iii) preference by target clients due to their convenience hence improved demand and returns to investors. This week we update our report with 2023 market research data in order to determine the progress and performance of MUDs against the performance of single-use Residential, Commercial Office, and Retail developments. In terms of performance, Mixed-Use Developments in the Nairobi Metropolitan Area (NMA) recorded an average rental yield of 8.4% in 2023, 1.3% points higher than the respective single-use themes which recorded an average rental yield of 7.1% in a similar period the previous year. Additionally, the performance was a 1.0% points y/y increase in the average rental yield to 8.4% in 2023, from the 7.4% realized in 2022 for MUD themes;
Investment Updates:
- Weekly Rates:
- Cytonn Money Market Fund closed the week at a yield of 15.43% p.a. To invest, dial *809# or download the Cytonn App from Google Play store here or from the Appstore here;
- Cytonn High Yield Fund closed the week at a yield of 17.95% p.a. To invest, email us at sales@cytonn.com and to withdraw the interest, dial *809# or download the Cytonn App from Google Play store here or from the Appstore here;
- We continue to offer Wealth Management Training every Monday, from 10:00 am to 12:00 pm. The training aims to grow financial literacy among the general public. To register for any of our Wealth Management Trainings, click here;
- If interested in our Private Wealth Management Training for your employees or investment group, please get in touch with us through wmt@cytonn.com;
- Cytonn Insurance Agency acts as an intermediary for those looking to secure their assets and loved ones’ future through insurance namely; Motor, Medical, Life, Property, WIBA, Credit and Fire and Burglary insurance covers. For assistance, get in touch with us through insuranceagency@cytonn.com;
- Cytonn Asset Managers Limited (CAML) continues to offer pension products to meet the needs of both individual clients who want to save for their retirement during their working years and Institutional clients that want to contribute on behalf of their employees to help them build their retirement pot. To more about our pension schemes, kindly get in touch with us through pensions@cytonn.com;
Real Estate Updates:
- For more information on Cytonn’s real estate developments, email us at sales@cytonn.com;
- Phase 3 of The Alma is now ready for occupation and the show house is open daily. To join the waiting list to rent, please email properties@cytonn.com;
- For Third Party Real Estate Consultancy Services, email us at rdo@cytonn.com;
- For recent news about the group, see our news section here;
Hospitality Updates:
- We currently have promotions for Staycations. Visit cysuites.com/offers for details or email us at sales@cysuites.com;
Money Markets, T-Bills Primary Auction:
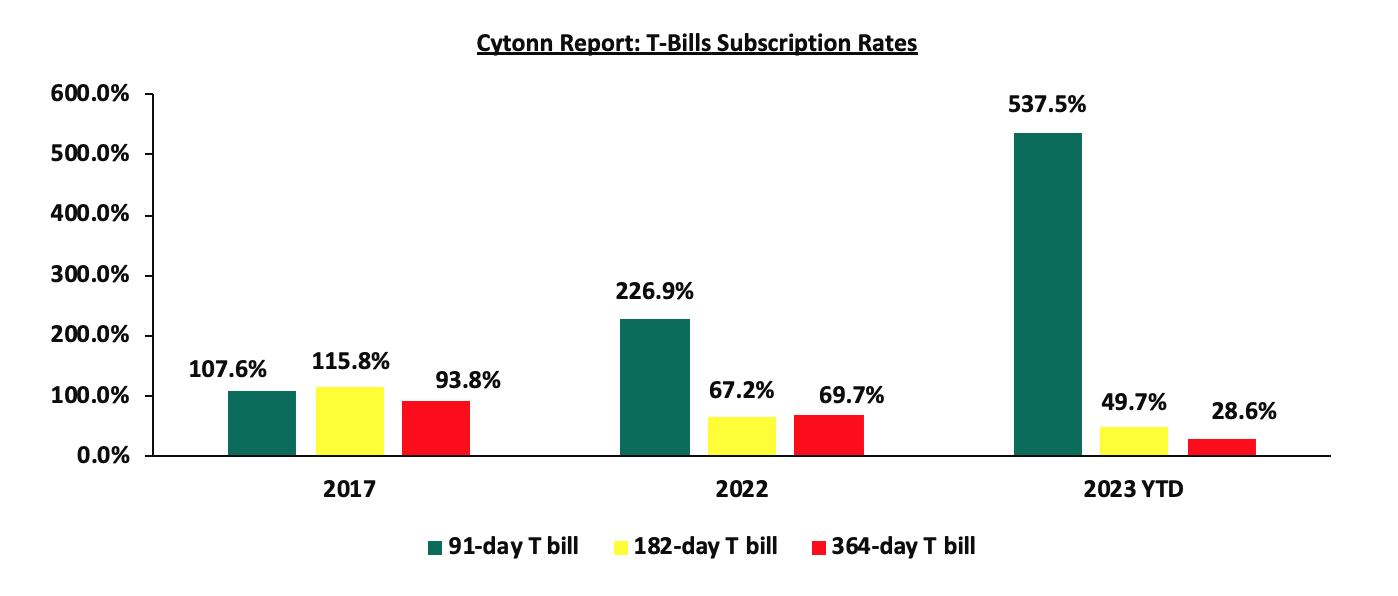
During the week, T-bills were undersubscribed for the first time in six weeks, with the overall undersubscription rate coming in at 72.3%, a reversal from the oversubscription rate of 156.9% recorded the previous week. Investors’ preference for the shorter 91-day paper persisted, with the paper receiving bids worth Kshs 13.8 bn against the offered Kshs 4.0 bn, translating to an oversubscription rate of 344.8%, albeit lower than the oversubscription rate of 786.1% recorded the previous week. The subscription rates for the 182-day and 364-day papers decreased to 29.2% and 6.3% from 54.1% and 8.0%, respectively, recorded the previous week. The government accepted a total of Kshs 17.1 bn worth of bids out of Kshs 17.3 bn of bids received, translating to an acceptance rate of 98.5%. The yields on the government papers were on an upward trajectory, with the yields on the 364-day,182-day, and 91-day papers increasing by 3.9 bps, 17.3 bps, and 13.6 bps to 15.8%, 15.9%, and 15.8% respectively. The chart below compares the overall average T-bill subscription rates obtained in 2017, 2022, and 2023 Year-to-date (YTD):
In the primary bond market, the government is seeking to raise an additional Kshs 35.0 bn for budgetary support by issuing a new bond FXD1/2024/03 with a tenor of 3.0 years and reopening the 5-year bond FXDI/2023/05 with a tenor to maturity of 4.7 years. The coupon rate for the FXD1/2024/03 will be market-determined; however, that of FXD1/2023/05 is set at 16.8%. The bidding opened on 14th December 2023 and will close on 14th January 2024, giving the bonds a value date of 15th January 2024. Any discount amounts and interest payments from the bonds will be subject to a withholding tax at a rate of 15.0%. We anticipate the bonds to be oversubscribed, given the short tenor to maturity of the FXD1/2024/03, with investors attaching higher yields as they seek to cushion themselves against future losses on the back of the government’s debt sustainability concerns and the sustained inflationary pressures experienced in the country.
Money Market Performance:
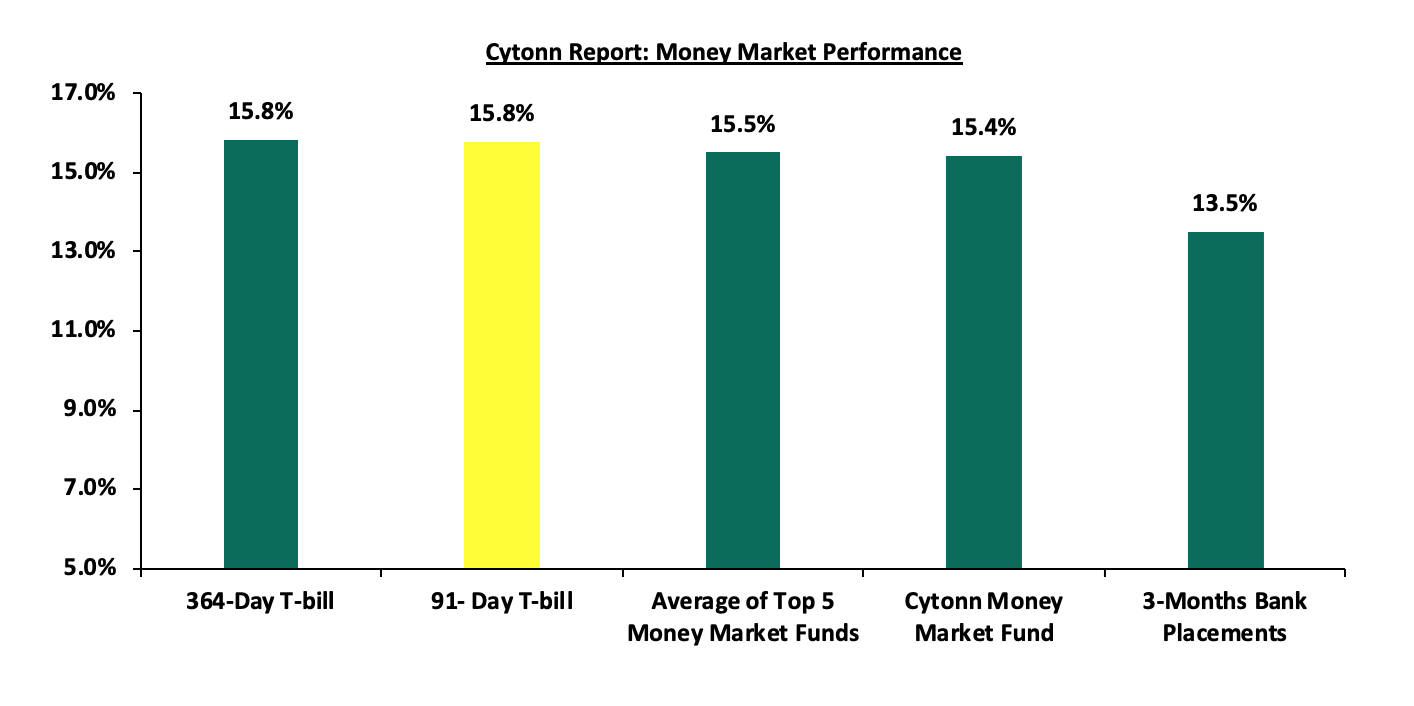
In the money markets, 3-month bank placements ended the week at 13.5% (based on what we have been offered by various banks), and the yields on the 364-day paper increased by 3.9 bps to 15.8% and 91-day T-bill yield increased by 13.6 bps to 15.8%. The yields of the Cytonn Money Market Fund increased by 4.0 bps to 15.43% from 15.39% recorded the previous week, and the average yields on the Top 5 Money Market Funds increased by 22.0 bps to 15.5%, from 15.3% recorded the previous week.
The table below shows the Money Market Fund Yields for Kenyan Fund Managers as published on 15th December 2023:
|
Cytonn Report: Money Market Fund Yield for Fund Managers as published on 15th December 2023 |
||
|
Rank |
Fund Manager |
Effective Annual |
|
1 |
Nabo Africa Money Market Fund |
16.0% |
|
2 |
Etica Money Market Fund |
15.6% |
|
3 |
Cytonn Money Market Fund (Dial *809# or download Cytonn App) |
15.4% |
|
4 |
Lofty-Corban Money Market Fund |
15.3% |
|
5 |
GenAfrica Money Market Fund |
15.2% |
|
6 |
Sanlam Money Market Fund |
14.8% |
|
7 |
Apollo Money Market Fund |
14.3% |
|
8 |
Enwealth Money Market Fund |
14.2% |
|
9 |
Kuza Money Market fund |
13.8% |
|
10 |
Equity Money Market Fund |
13.7% |
|
11 |
Jubilee Money Market Fund |
13.5% |
|
12 |
Co-op Money Market Fund |
13.5% |
|
13 |
GenCap Hela Imara Money Market Fund |
13.4% |
|
14 |
AA Kenya Shillings Fund |
13.1% |
|
15 |
Absa Shilling Money Market Fund |
13.1% |
|
16 |
Old Mutual Money Market Fund |
12.9% |
|
17 |
Madison Money Market Fund |
12.9% |
|
18 |
Dry Associates Money Market Fund |
12.3% |
|
19 |
KCB Money Market Fund |
12.2% |
|
20 |
Orient Kasha Money Market Fund |
12.1% |
|
21 |
Mayfair Money Market Fund |
12.1% |
|
22 |
CIC Money Market Fund |
11.8% |
|
23 |
ICEA Lion Money Market Fund |
11.6% |
|
24 |
Mali Money Market Fund |
10.5% |
|
25 |
British-American Money Market Fund |
9.2% |
Source: Business Daily
Liquidity:
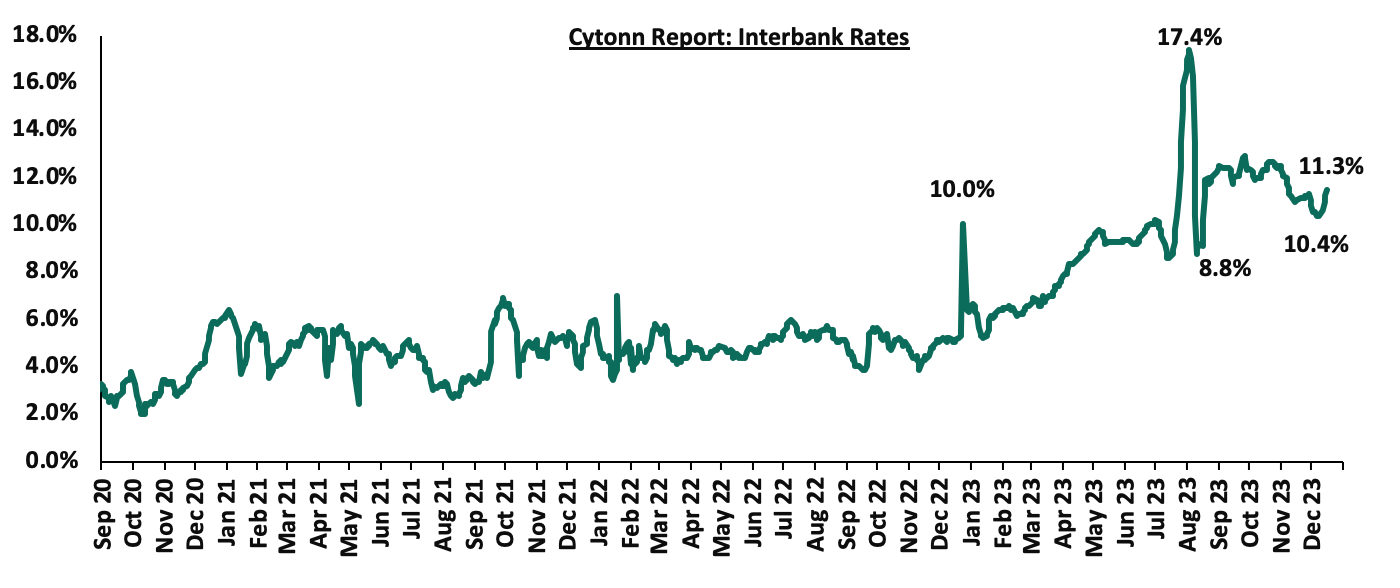
During the week, liquidity in the money markets slightly tightened, with the average interbank rate increasing to 11.1% from 10.4% recorded the previous week, partly attributable to the tax remittances that offset government payments. The average interbank volumes traded increased by 55.9% to Kshs 32.2 bn from Kshs 20.6 bn recorded the previous week. The chart below shows the interbank rates in the market over the years:
Kenya Eurobonds:
During the week, the yields on Eurobonds were on a downward trajectory, with the yields on the 7-year Eurobond issued in 2019 declining the most, to 10.2% from 11.5% recorded the previous week, while the yields on the 30-year Eurobond issued in 2018 declined the least by 0.1% points to 10.9% from 11.0% recorded the previous week. The table below shows the summary of the performance of the Kenyan Eurobonds as of 14th December 2023;
|
Cytonn Report: Kenya Eurobonds Performance |
||||||
|
|
2014 |
2018 |
2019 |
2021 |
||
|
Tenor |
10-year issue |
10-year issue |
30-year issue |
7-year issue |
12-year issue |
12-year issue |
|
Amount Issued (USD) |
2.0 bn |
1.0 bn |
1.0 bn |
0.9 bn |
1.2 bn |
1.0 bn |
|
Years to Maturity |
0.5 |
4.2 |
24.2 |
3.5 |
8.5 |
10.5 |
|
Yields at Issue |
6.6% |
7.3% |
8.3% |
7.0% |
7.9% |
6.2% |
|
02-Jan-23 |
12.9% |
10.5% |
10.9% |
10.9% |
10.8% |
9.9% |
|
01-Dec-23 |
14.4% |
11.3% |
11.2% |
11.8% |
11.2% |
10.6% |
|
07-Dec-23 |
14.4% |
11.0% |
11.0% |
11.5% |
11.2% |
10.4% |
|
08-Dec-23 |
14.4% |
11.0% |
11.3% |
11.0% |
11.0% |
10.3% |
|
11-Dec-23 |
14.7% |
11.0% |
11.3% |
11.0% |
11.0% |
10.3% |
|
12-Dec-23 |
14.8% |
10.9% |
11.4% |
10.8% |
10.9% |
10.3% |
|
13-Dec-23 |
14.8% |
10.8% |
11.4% |
10.2% |
10.3% |
10.3% |
|
14-Dec-23 |
13.9% |
10.2% |
10.9% |
10.2% |
10.3% |
9.8% |
|
Weekly Change |
(0.5%) |
(0.8%) |
(0.1%) |
(1.3%) |
(0.9%) |
(0.5%) |
|
MTD Change |
(0.5%) |
(1.1%) |
(0.3%) |
(1.6%) |
(0.9%) |
(0.8%) |
|
YTD Change |
0.9% |
(0.3%) |
0.0% |
(0.7%) |
(0.5%) |
(0.0%) |
Source: Central Bank of Kenya (CBK) and National Treasury
Kenya Shilling:
During the week, the Kenya Shilling depreciated against the US Dollar by 0.3% to close at Kshs 153.7, from Kshs 153.3 recorded the previous week. On a year-to-date basis, the shilling has depreciated by 24.6% against the dollar, adding to the 9.0% depreciation recorded in 2022. We expect the shilling to remain under pressure in 2023 as a result of:
- An ever-present current account deficit which came at 3.7% of GDP in Q2’2023 from 6.0% recorded in a similar period last year,
- The need for government debt servicing, continues to put pressure on forex reserves given that 67.1% of Kenya’s external debt was US Dollar denominated as of June 2023, and,
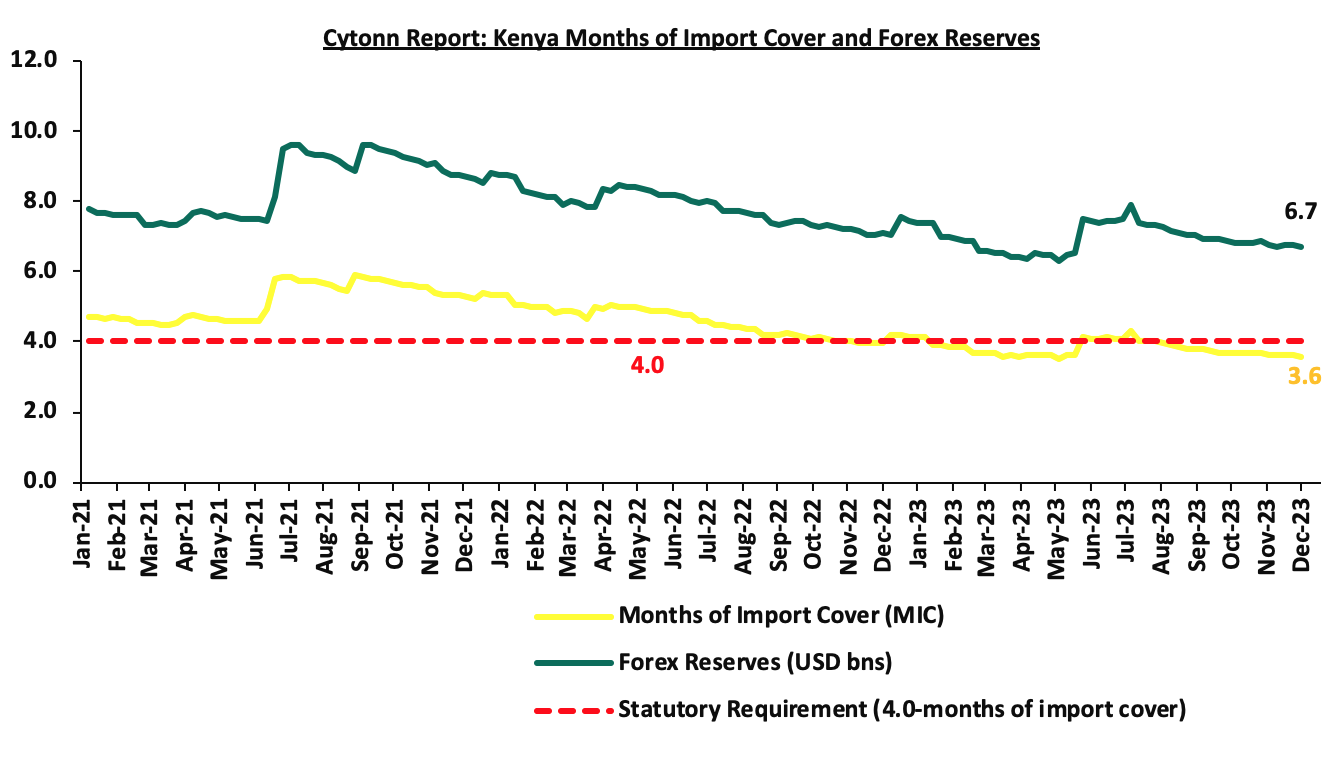
- Dwindling forex reserves, currently at USD 6.7 mn (equivalent to 3.6 months of import cover), which is below the statutory requirement of maintaining at least 4.0 months of import cover.
The shilling is however expected to be supported by:
- Diaspora remittances standing at a cumulative USD 3,462.4 mn as of October 2023, 4.1% higher than the USD 3,325.1 mn recorded over the same period in 2022, which has continued to cushion the shilling against further depreciation. In the October 2023 diaspora remittances figures, North America remained the largest source of remittances to Kenya accounting for 57.0% in the period, and,
- The tourism inflow receipts which came in at USD 268.1 mn in 2022, a significant 82.9% increase from USD 146.5 mn inflow receipts recorded in 2021.
Key to note, Kenya’s forex reserves remained relatively unchanged during the week at USD 6.7 mn recorded the previous week, equivalent to 3.6 months of import cover same as the previous week, and remained below the statutory requirement of maintaining at least 4.0 months of import cover. The chart below summarizes the evolution of Kenya's months of import cover over the years:
Weekly Highlights:
- Fuel Prices effective 15th December 2023 to 14th January 2024
During the week, the Energy and Petroleum Regulatory Authority (EPRA) released their monthly statement on the maximum retail fuel prices in Kenya, effective 15th December 2023 to 14th January 2024. Notably, the prices for super petrol, Diesel and Kerosene decreased by 2.3%, 1.0% and 2.0% from the November prices and will retail at Kshs 212.4, Kshs 201.5 and Kshs 199.1 per litre from Kshs 217.4, Kshs 203.5 and Kshs 203.1 per litre respectively.
Other key take-outs from the performance include;
- The average landing costs per cubic meter of Diesel, Kerosene and super petrol decreased by 5.4%, 6.6% and 16.1% to USD 826.0, USD 759.9 and USD 694.4 in November 2023, from USD 873.4, USD 813.9 and USD 827.8, respectively in October 2023.
- The Kenyan shilling depreciated against the US Dollar by 1.2% to Kshs 157.5 in November 2023, compared to the mean monthly exchange rate of Kshs 155.6 recorded in October 2023.
We note that fuel prices in the country have decreased largely attributed to the decline in global oil prices coupled with the government's efforts to stabilize pump prices through the petroleum pump price stabilization mechanism which has so far expended Kshs 9.9 bn in the FY2023/24 to cushion the increases applied to the petroleum pump prices. Nevertheless, fuel prices in the country still remain under pressure from the high cost of fuel imports resulting from weak shilling against the US dollar, as well as the high taxation of petroleum products as provided in the Finance Act 2023.
Rates in the Fixed Income market have been on an upward trend given the continued high demand for cash by the government and the occasional liquidity tightness in the money market. The government is 15.4% ahead of its prorated net domestic borrowing target of Kshs 145.0 bn, having a net borrowing position of Kshs 167.3 bn out of the domestic net borrowing target of Kshs 316.0 bn for the FY’2023/2024. Therefore, we expect a continued upward readjustment of the yield curve in the short and medium term. Owing to this, our view is that investors should be biased towards short-term fixed-income securities to reduce duration risk.
Market Performance:
During the week, the equities market was on a downward trajectory, with NASI losing the most by 2.1%, while NSE 20, NSE 25, and NSE 10 lost by 1.4% 1.9%, and 2.0% respectively, taking the YTD performance to losses of 27.8%, 24.3% and 11.0% for NASI, NSE 25, and NSE 20, respectively. The equities market performance was driven by losses recorded by large-cap stocks such as Bamburi, Equity Bank, and Standard Chartered Bank of 8.0%, 5.8%, and 3.4%. The losses were, however, mitigated by gains recorded by large-cap stocks such as NCBA, DTB-K Bank, and BAT of 4.5%, 2.2%, and 1.6% respectively.
During the week, equities turnover decreased by 64.5% to USD 3.1 mn from USD 8.8 mn recorded the previous week, taking the YTD total turnover to USD 641.5 mn. Foreign investors remained net sellers for the third consecutive week with a net selling position of USD 1.5 mn, from a net selling position of USD 5.6 mn recorded the previous week, taking the YTD foreign net selling position to USD 295.3 mn.
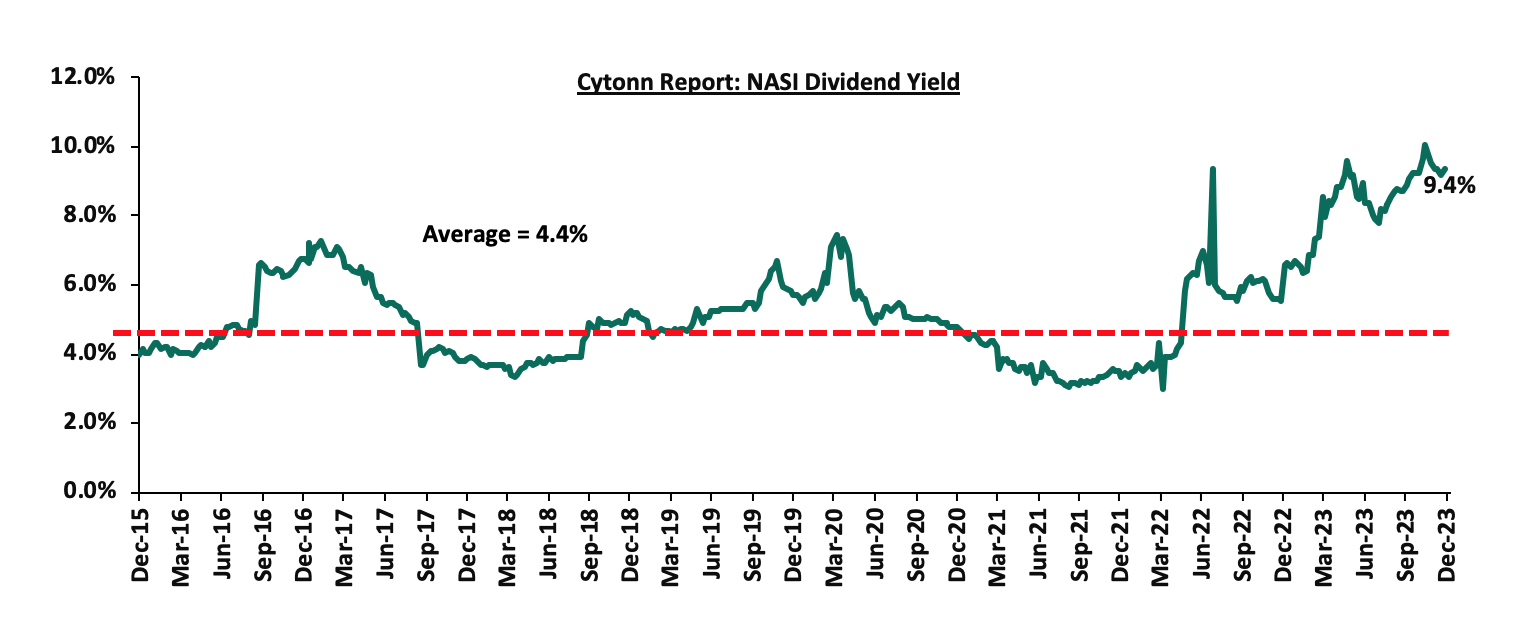
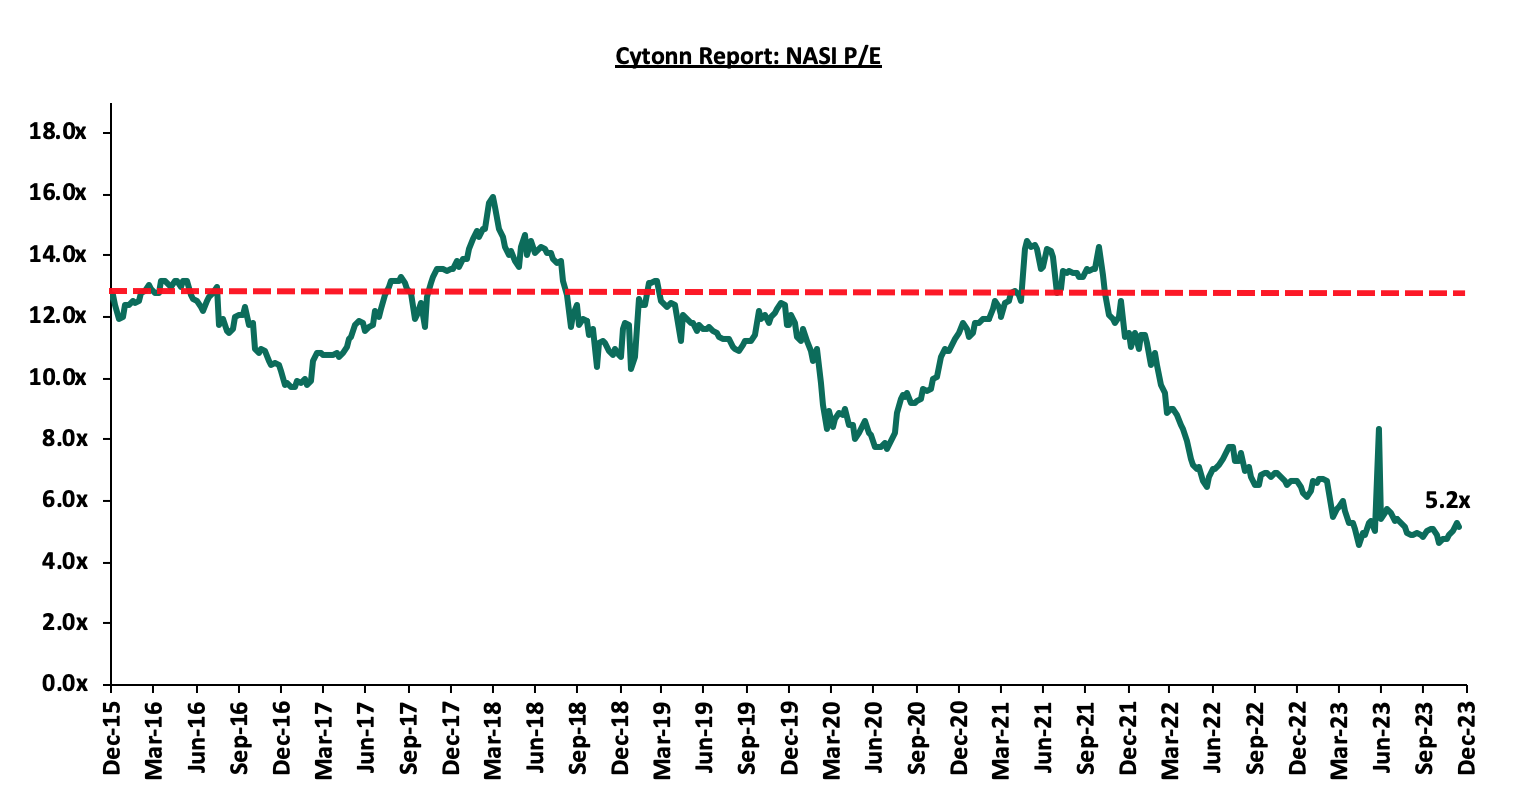
The market is currently trading at a price-to-earnings ratio (P/E) of 5.2x, 57.4% below the historical average of 12.1x. The dividend yield stands at 9.4%, 5.0% points above the historical average of 4.4%. Key to note, NASI’s PEG ratio currently stands at 0.7x, an indication that the market is undervalued relative to its future growth. A PEG ratio greater than 1.0x indicates that the market is overvalued while a PEG ratio less than 1.0x indicates that the market is undervalued. The charts below indicate the historical P/E and dividend yields of the market;
Universe of Coverage:
|
Cytonn Report: Universe of Coverage |
|||||||||
|
Company |
Price as at 8/12/2023 |
Price as at 15/12/2023 |
w/w change |
YTD Change |
Target Price* |
Dividend Yield |
Upside/ Downside** |
P/TBv Multiple |
Recommendation |
|
KCB Group*** |
19.3 |
19.1 |
(1.0%) |
(50.2%) |
30.7 |
10.5% |
71.2% |
0.3x |
Buy |
|
Sanlam |
7.3 |
6.1 |
(15.9%) |
(35.9%) |
10.3 |
0.0% |
67.6% |
1.7x |
Buy |
|
Liberty Holdings |
3.6 |
3.7 |
1.4% |
(27.6%) |
5.9 |
0.0% |
62.2% |
0.3x |
Buy |
|
Kenya Reinsurance |
1.8 |
1.8 |
0.0% |
(5.9%) |
2.5 |
11.4% |
54.0% |
0.1x |
Buy |
|
Jubilee Holdings |
185.0 |
184.0 |
(0.5%) |
(7.4%) |
260.7 |
6.5% |
48.2% |
0.3x |
Buy |
|
ABSA Bank*** |
11.5 |
11.3 |
(1.7%) |
(7.4%) |
14.8 |
11.9% |
42.9% |
0.9x |
Buy |
|
I&M Group*** |
17.5 |
17.5 |
0.0% |
2.6% |
21.8 |
12.9% |
37.4% |
0.4x |
Buy |
|
Diamond Trust Bank*** |
46.0 |
47.0 |
2.2% |
(5.7%) |
58.1 |
10.6% |
34.3% |
0.2x |
Buy |
|
Co-op Bank*** |
11.1 |
11.2 |
0.5% |
(7.9%) |
13.5 |
13.5% |
34.5% |
0.5x |
Buy |
|
Equity Group*** |
37.9 |
35.7 |
(5.8%) |
(20.8%) |
42.6 |
11.2% |
30.5% |
0.8x |
Buy |
|
Stanbic Holdings |
108.3 |
105.0 |
(3.0%) |
2.9% |
118.2 |
12.0% |
24.6% |
0.8x |
Buy |
|
Standard Chartered*** |
161.0 |
155.5 |
(3.4%) |
7.2% |
170.9 |
14.1% |
24.1% |
1.1x |
Buy |
|
Britam |
5.0 |
4.9 |
(1.8%) |
(5.2%) |
6.0 |
0.0% |
21.1% |
0.7x |
Buy |
|
NCBA*** |
38.0 |
39.7 |
4.5% |
1.9% |
43.2 |
10.7% |
19.5% |
0.8x |
Accumulate |
|
CIC Group |
2.3 |
2.3 |
0.0% |
20.4% |
2.5 |
5.7% |
14.3% |
0.7x |
Accumulate |
|
HF Group |
3.6 |
3.5 |
(1.9%) |
11.7% |
3.2 |
0.0% |
(9.1%) |
0.2x |
Sell |
We are “Neutral” on the Equities markets in the short term due to the current tough operating environment and huge foreign investor outflows, and, “Bullish” in the long term due to current cheap valuations and expected global and local economic recovery.
With the market currently being undervalued to its future growth (PEG Ratio at 0.7x), we believe that investors should reposition towards value stocks with strong earnings growth and that are trading at discounts to their intrinsic value. We expect the current high foreign investors' sell-offs to continue weighing down the equities outlook in the short term.
- Residential Sector
During the week, property developer Erdemann Property Limited launched a new project in Athi River, Machakos County, that is set to deliver 3,000 residential housing units. The project, dubbed ‘Great Wall Gardens 6’, offers a mix of different amenities, targeting different segments of the market. The development incorporates 3-bedroom unit apartments, 108 shops, a management office, a public toilet, and two car wash stations. Additionally, the project features essential facilities such as garbage collection points, transformer rooms, gatehouses with security offices, and two high-speed lifts on each block. The table below gives a summary of the unit type, size and prices for the 6th phase of the project
|
|
Cytonn Report: Great Wall Gardens Phase 6 Project |
|||
|
# |
Typology |
Unit Size (SQM) |
Unit Price (Kshs) |
Price per SQM (Kshs) |
|
1 |
3-Bedroom (Master Ensuite) |
104 |
2.9 mn |
27,885 |
Source: Erdemann Property Limited
Other notable projects by the developer include; Greatwall Apartments Phase 5 which are located in Mlolongo, Seefar Apartments situated in High Rise Estate, Windsor View Apartments in Kiambu, Kileleshwa Executive Apartments, and, Metro Fairview Towers located in Pangani.
This project is expected to; i) address the growing housing demand in the Nairobi Metropolitan Area, leveraging the region's high urbanization and population growth rates standing at 3.7% and 1.9%, respectively, ii) offer its residents with quality affordable housing, in line with the government’s agenda on housing, and, iii) improve the standard of life of its residents. Beyond meeting housing needs, the development aims to foster inclusive urban development, and stimulate employment opportunities, both directly and indirectly.
Going forward, we continue to witness more private developers venturing into the affordable housing. As the Affordable Housing Programme (AHP) continues to take shape in the country, we expect to see consistent project initiations and completions of affordable housing projects, in line with the government’s agenda on housing. The table below summarizes various affordable housing projects by the private sector in Kenya;
|
Cytonn Report: Affordable Housing Projects Initiated by Private Sector Players in Kenya |
||
|
Project Name |
Location |
Number of Units |
|
Great Wall Gardens Phase 6 |
Athi River, Machakos County |
3,000 |
|
Great Wall Gardens Phase 5 |
Mavoko, Machakos County |
1,128 |
|
Samara Estate |
Ruiru |
1,824 |
|
Moke Gardens |
Athi River |
30,000 |
|
Habitat Heights |
Mavoko |
8,888 |
|
Tsavo Apartments |
Embakasi, Riruta, Thindigua, Roysambu, and, Rongai |
3,200 |
|
Unity West |
Tatu City |
3,000 |
|
RiverView |
Athi River |
561 |
|
Kings Serenity |
Ongata Rongai, Kajiado County |
734 |
|
Joinven Estate |
Syokimau, Machakos County |
440 |
|
Kisima Park |
Lukenya |
17,152 |
|
Oasis Park, Athi River |
Athi River |
20,000 |
|
Muselele Estate |
Mavoko |
3,250 |
|
Joinven Investments Ltd |
Syokimau |
400 |
|
Jewel Heights |
1,550 |
|
|
Benvar Estates |
Juja, Kiambu |
15,034 |
|
Kentek Ventures |
Syokimau, Machakos |
53,716 |
|
Samara Estates |
Migaa, Kiambu |
1,824 |
|
Edeville |
Donholm |
1,300 |
|
Breezewood Gardens |
4,950 |
|
|
Centum Investments, Rea Vipingo |
Vipingo, Kilifi |
5,300 |
|
The Creek Village |
Mshomoroni, Mombasa |
968 |
|
Buxton Point |
Buxton, Mombasa |
1,984 |
|
Total |
180,203 |
|
Source: Boma Yangu, Online Research
- Regulated Real Estate Funds
- Real Estate Investments Trusts (REITs)
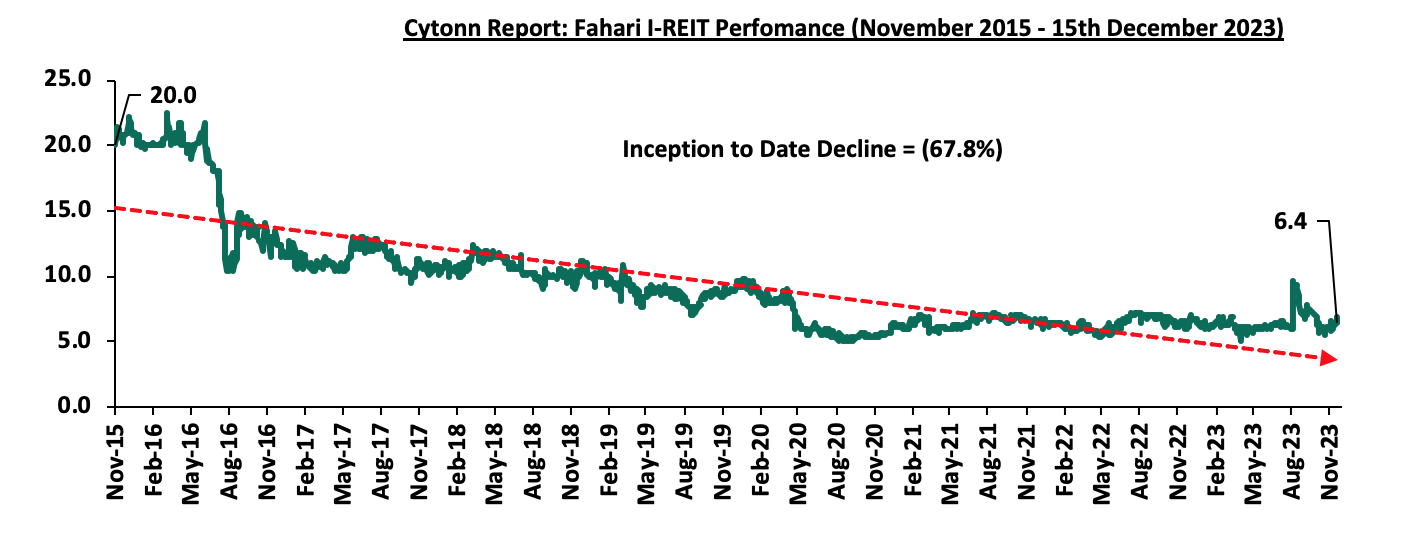
In the Nairobi Securities Exchange, ILAM Fahari I-REIT closed the week trading at an average price of Kshs 6.4 per share, remaining relatively unchanged from the previous week. The performance represents a 5.0% Year-to-Date (YTD) loss from Kshs 6.8 per share recorded on 3 January 2023, taking it to a 67.8% Inception-to-Date (ITD) loss from the Kshs 20.0 price. The dividend yield currently stands at 10.1%. The graph below shows Fahari I-REIT’s performance from November 2015 to 15th December 2023;
In the Unquoted Securities Platform, Acorn D-REIT and I-REIT traded at Kshs 25.3 and Kshs 21.7 per unit, respectively, as of 1st December 2023. The performance represented a 26.6% and 8.3% gain for the D-REIT and I-REIT, respectively, from the Kshs 20.0 inception price. The volumes traded for the D-REIT and I-REIT came in at 12.3 mn and 30.7 mn shares, respectively, with a turnover of Kshs 257.5 mn and Kshs 633.8 mn, respectively, since inception in February 2021.
- Cytonn High Yield Fund (CHYF)
Cytonn High Yield Fund (CHYF) closed the week with an annualized yield of 18.0%, remaining relatively unchanged from the previous week. The performance represented a 4.1%-points Year-to-Date (YTD) increase from 13.9% yield recorded on 1st January 2023, and 2.3%-points from Inception-to-Date (ITD) increase from the 15.7% yield. The graph below shows Cytonn High Yield Fund’s performance from November 2019 to 8th December 2023;
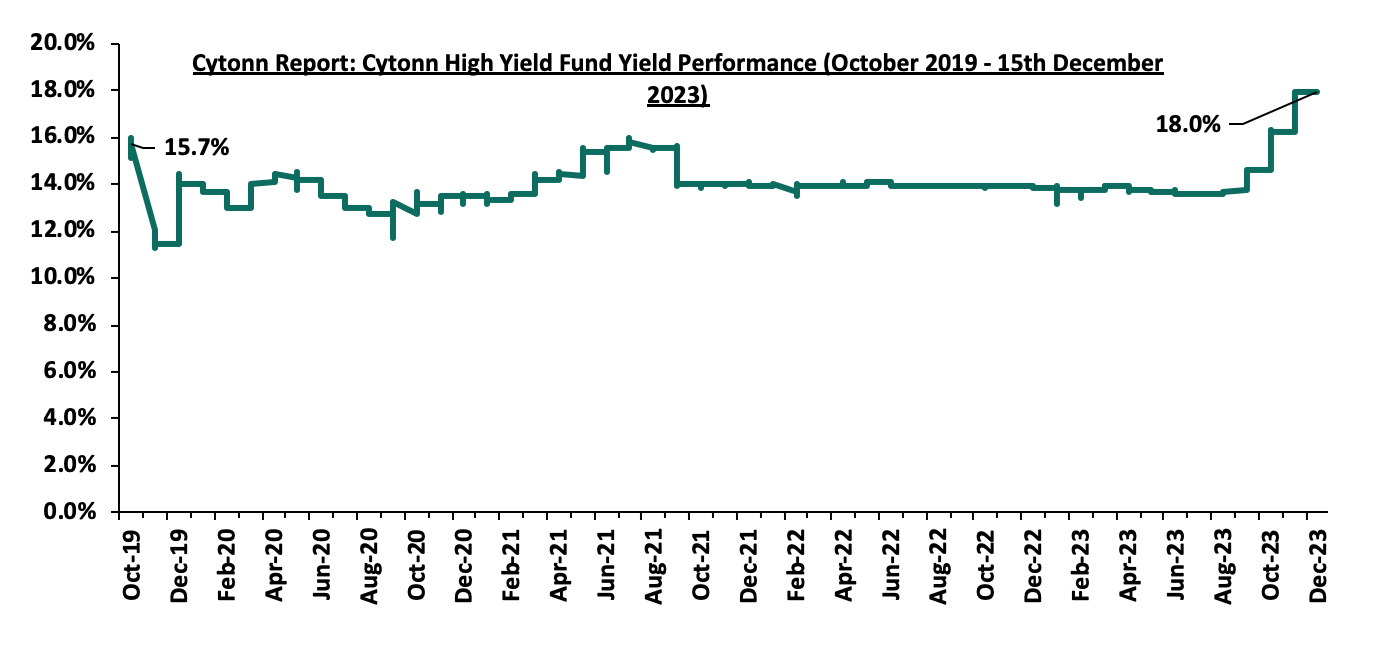
Notably, the CHYF has outperformed other regulated Real Estate funds with an annualized yield of 18.0%, as compared to Fahari I-REIT and Acorn I-REIT with yields of 10.1%, and 2.8% respectively. As such, the higher yields offered by CHYF makes the fund one of the best alternative investment resource in the Real Estate sector. The graph below shows the yield performance of the Regulated Real Estate Funds;
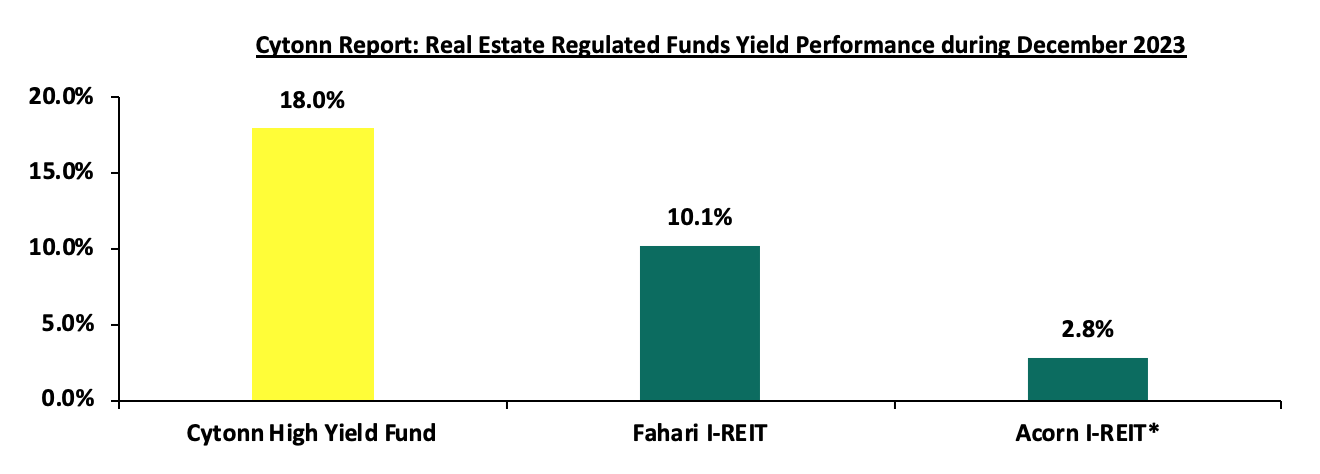
*H1’2023
Source: Cytonn Research
We expect the performance of Kenya’s Real Estate sector to remain resilient, supported by factors such as; i) initiation and development of affordable housing projects expected to boost the residential sector, ii) relatively positive demographics in the country increasing demand for housing, and, iii) increased foreign investments into the country positioning Kenya as a regional hub. However, factors such as; i) rising costs of construction, ii) limited investor knowledge in REITs, and, iii) existing oversupply in select Real Estate sectors will continue to hinder optimal performance of the sector by limiting developments and investments.
In October 2022, we released the Nairobi Metropolitan Area Mixed-Use Developments (MUDs) Report 2022, which highlighted that Mixed-Use Developments (MUDs) recorded an average rental yield of 7.4%, which was 0.9% points higher than the 6.5% rental yield for the retail, commercial Office and residential themes in 2021. The relatively better performance was mainly attributed to; i) an improved business environment, ii) strategic and prime locations of the developments with the capability to attract prospective clients, and, iii) preference by target clients due to their convenience hence improved demand and returns to investors.
This week we update our report with 2023 market research data in order to determine the progress and performance of MUDs against the market performance of single use Residential, Commercial Office, and Retail developments. Therefore, this topical will cover the following:
- Overview of Mixed-Use Developments,
- Mixed-Use Developments Performance Summary in 2023, and,
- Mixed-Use Developments Investment Opportunity and Outlook.
Section I: Overview of Mixed-Use Developments
A Mixed-Use Development (MUD) is an urban development that combines multiple Real Estate themes including residential, commercial, retail, and hospitality. Due to this integration, a single development project serves more than one purpose within a single location. MUDs thus offer benefits such as enhanced access to amenities and services, and, convenience of living and working areas at the same place. Consequently, they have been gaining traction in Kenya owing to the various changing life patterns and needs of clients. For the year 2023;
- Property developer Mi Vida Homes broke ground for the construction of three projects namely, Amaiya, 237 Garden City (237 GC) and KEZA located within Garden City along Thika Road, and Riruta areas respectively. This came more than a year after the developer announced plans to begin construction in April 2022. For more information, see Cytonn Weekly #47/2023,
- Absa Bank Kenya announced a strategic partnership with Unity Homes, a leading property developer of residential communities in Kenya, which will allow potential home buyers to access affordable mortgage loans backed by the Kenya Mortgage Refinancing Company to purchase homes at Unity One. For more information, please see our Cytonn Weekly #36/2023,
- The International Finance Corporation (IFC) disclosed details of a Kshs 2.9 bn (USD 20.0 mn) proposed loan to Centum Real Estate Limited (CRE), a wholly owned subsidiary of Centum Investment Company Plc. According to disclosures from the IFC, the loan will be used to partially finance Centum’s Mzizi Court project consisting of 1,940 affordable housing units located at Two Rivers. For more information, please see our Cytonn Weekly #36/2023,
- Pan Pacific Hotels Group, a subsidiary of Singapore-listed UOL Group Limited, one of Asia’s most established hotel and property companies, opened a luxurious hotel facility dubbed ‘Pan Pacific Serviced Suites Nairobi’ located at the Global Trade Centre (GTC) in Westlands. For more information, please see Cytonn Weekly #24/2023,
- French retailer Carrefour Supermarket, opened a new outlet at the Business Bay Square (BBS) mall located in Eastleigh, Nairobi, bringing the retailer’s number of operating outlets countrywide to 20. The recently launched mall, with phase 1 currently at about 90.0% complete, comprises of retail facilities, banks and micro-finance institutions, food courts and restaurants, medical facilities, a mosque, commercial offices, entertainment and recreation facilities, and a kid’s playground. For more information, please see our Cytonn Monthly - May 2023,
- Improvon, a South African based logistics and industrial developer, announced ongoing expansion efforts to set up mini-warehouse units at Nairobi Gate Industrial Park in Northlands City, Ruiru. The facility targets medium-sized firms seeking specialized logistics solutions and already hosts two 5,000 SQM depots. For more information, see our Cytonn Weekly #15/2023,
- Centum Real Estate, the development affiliate of Centum Investment Company PLC, completed the construction of phase one of its 32 luxurious four-bedroom duplexes dubbed ‘Loft Residences’, which sits on 3.9 acres situated in Two Rivers. For more information, see our Cytonn Weekly #07/2023,
- Madison Insurance entered into a Joint-Venture (JV) agreement with Housing Finance Company (HFC), a subsidiary of HF Group, to develop a Master Planned Community project dubbed ‘Villakazi Homes’ in Athi River, Machakos County. For more information, see our Cytonn Weekly #07/2023,
- Local retail chain Cleanshelf Supermarket opened a new outlet located in Greenpark Estate along Mombasa road, Athi River bringing the retailer’s number of operating outlets countrywide to 13. For more information, For more information, see our Cytonn Weekly #07/2023, and,
- Additionally, Tatu City, a mixed-use satellite city development, launched a luxurious lakeside-living project dubbed ‘Kofinaf Tatu Residences’, sitting on a 200-acre piece of land within Kofinaf Estate, located in Tatu City, Kiambu County. For more information, see our Cytonn Weekly #02/2023.
Some of the factors that have been driving the growth of MUDs include;
- Evolving Lifestyles and Consumer Preferences: Mixed-Use Developments present a convenient and integrated lifestyle that resonates with urban living preferences. Consequently, there is a growing demand for such developments in Kenya due to shifts in lifestyle patterns, leading to an upswing in their construction,
- Growing Demand: Kenya exhibits relatively high annual population and urbanization growth rates of 1.9% and 3.7% respectively, surpassing the global rates 0.8% and 1.6%, as of 2022. This dynamic demographic landscape fuels the demand for development, propelling the growth and success of Mixed-Use Developments. Furthermore, the market demand for diverse and integrated spaces that cater to the varied needs of residents and businesses has been a significant driver. Mixed-Use Developments respond to this demand by providing a holistic solution in a single development,
- Relatively Higher Returns: The incorporation of diverse real estate themes within a single location makes Mixed-Use Developments more financially rewarding compared to single-use developments. Investors can capitalize on multiple revenue streams from the sale and lease of residential, office, and retail spaces,
- Improved Infrastructure: Recent years have witnessed significant advancements in infrastructure, fostering the establishment of Mixed-Use Developments. Massive infrastructure projects, such as the Nairobi Expressway and Western Bypass, play a pivotal role in supporting the development of these integrated spaces,
- Optimal Land Utilization: Given the scarcity of appropriate land, especially in urban settings experiencing heightened population and urbanization growth, Mixed-Use Developments (MUDs) guarantee the effective utilization of available land by integrating various asset classes within a single project and location,
- Risk Diversification: Mixed-Use Developments offer a risk mitigation strategy by providing diversification across various asset classes. This shields against market forces that might negatively impact a specific theme, such as low uptake or demand,
- Strategic Locations: Mixed-Use Developments are often strategically positioned in urban areas with ample infrastructure, catering to both high and middle-income demographics. This accessibility attracts a substantial number of high-end potential clients, and,
- Sustainability: Mixed-Use Developments seamlessly integrate different real estate classes in a single project and location, optimizing space usage. This approach minimizes the need for extensive commutes, as residents can live, work, and shop all within one locale, contributing to a more sustainable lifestyle.
Despite the aforementioned factors, there exist various setbacks hindering the development and performance of MUDs such as:
- High Costs of Development: Developing and financing Mixed-Use Developments (MUDs) proves to be more costly than single-use projects. This is due to the need for intricate designs to guarantee the seamless integration of diverse Real Estate themes. The challenge lies in making the overall project both appealing and functional, making it challenging for developers to secure funding from banks and other stakeholders for MUDs. Adding to the complexity, construction costs have seen an increase in 2023. This rise is attributed to inflationary pressures resulting from supply chain disruptions and the depreciation of the Kenyan Shilling. Consequently, the expenses associated with importing construction materials have surged in turn increasing the costs of construction,
- Oversupply in Select Real Estate Sectors such as the 5.8 mn SQFT in the NMA commercial office market, 3.3 mn SQFT in the NMA retail market, which in turn hinder optimum performance of the developments, and,
- Coordinating Different Uses: Integrating the diverse uses included in MUDs may be challenging, as each Real Estate theme has different needs and requirements. Incorporating the right mix requires specific management considerations, as the tenants need to complement each other and support the overall goals of the development, which may be difficult to implement.
Section II: Mixed-Use Developments Performance Summary in 2023
- Summary of MUDs Performance in Comparison to General Market Performance
Mixed-Use Developments recorded an average rental yield of 8.4% in 2023, 1.3% points higher than the respective single use themes which recorded an average rental yield of 7.1% in a similar period the previous year. The relatively better performance was mainly attributable to changing client preferences and MUDs attractiveness driven by the diversity in amenities and social offerings they provide to clients.
The retail and commercial office themes in the MUDs recorded 1.0% and 0.7% points increase in average rental yields to 9.8% and 8.0%, respectively in 2023, from 8.8% and 7.3% in 2022. This was mainly supported by the addition of prime spaces fetching higher rents and yields such as Business Bay Square (BBS) Mall, improved absorption rates on account of reduced supply of office space delivered into the market as compared to a similar period in 2022, and, aggressive expansion strategies explored by both local and international retailers. For the Residential theme in the MUDs, the average rental yield improved by 1.6% points to 6.8% in 2023, from 5.2% in 2022 majorly attributable to an increase in rents per SQM chargeable. The table below shows the performance of single-use and Mixed-Use development themes between 2022 and 2023;
|
Cytonn Report: Thematic Performance in MUDs Vs. Key Nodes Hosting MUDs Market Performance 2022-2023 |
||||||
|
|
MUD Themes Average |
Market Average |
|
|
||
|
|
Rental Yield % 2022 |
Rental Yield % 2023 |
Rental Yield % 2022 |
Rental Yield % 2023 |
∆ in y/y MUD Rental yields |
∆ in theme Rental Yields |
|
Retail |
8.8% |
9.8% |
7.8% |
8.5% |
1.0% |
0.7% |
|
Offices |
7.3% |
8.0% |
7.0% |
7.3% |
0.7% |
0.3% |
|
Residential |
5.2% |
6.8% |
5.5% |
5.7% |
1.6% |
0.2% |
|
Average |
7.4% |
8.4% |
6.8% |
7.1% |
1.0% |
0.3% |
|
*Market performance is calculated from nodes where sampled MUDs exist |
||||||
Source: Cytonn Research
- Mixed-Use Developments Performance per Node
In terms of performance per node, Karen, Limuru Road and Westlands were the best performing of all sampled nodes with average MUD rental yield of 9.7%, 9.5% and 8.8% respectively, 1.3% points, 1.1% points and 0.4% points higher than the market average of 8.4% in 2023. The remarkable performance was largely attributed to; i) the presence of prime retail and office spaces fetching higher rents and yields, ii) quality infrastructure supporting investments, and, iii) affluent residents with high consumer spending power. On the other hand, Thika Road was the worst performing node with an average MUD rental yield of 7.1%, 1.3% points lower than the market average of 8.4%. The relatively poor performance was mainly attributed to; i) low rental rates attracted by developments, ii) the long commute to main commercial zone coupled frequent with traffic snarl-ups and congestion along Thika Road, and, iii) a relatively lower consumer spending power of residents. The table below shows the performance of Mixed-Use Developments by node in 2023;
|
Cytonn Report: Nairobi Metropolitan Area Mixed Use Developments Performance by Nodes 2023 |
|||||||||||
|
Location |
Commercial Retail |
Commercial Office |
Residential |
Average MUD Yield |
|||||||
|
Rent (Kshs/SQFT) |
Occupancy |
Rental Yield |
Rent (Kshs/SQFT) |
Occupancy |
Rental Yield |
Price (Kshs/SQM) |
Rent (Kshs/SQM) |
Annual Uptake |
Rental Yield |
||
|
Karen |
270 |
92.5% |
11.5% |
125 |
82.5% |
7.8% |
9.7% |
||||
|
Limuru Road |
325 |
82.5% |
12.1% |
112 |
75.5% |
7.2% |
162,030 |
1,538 |
27.2% |
9.0% |
9.5% |
|
Westlands |
211 |
70.3% |
9.5% |
134 |
74.7% |
9.0% |
284,147 |
3,448 |
13.7% |
7.9% |
8.8% |
|
Kilimani |
193 |
83.2% |
9.7% |
114 |
82.4% |
7.6% |
8.6% |
||||
|
Upperhill |
147 |
75.7% |
8.0% |
102 |
81.3% |
8.5% |
8.3% |
||||
|
Eastlands |
243 |
84.7% |
11.2% |
80 |
67.5% |
5.4% |
8.3% |
||||
|
Mombasa Road |
203 |
75.0% |
8.7% |
90 |
80.0% |
7.2% |
118,812 |
662 |
13.7% |
6.0% |
7.3% |
|
Thika Road |
198 |
76.7% |
9.2% |
111 |
75.0% |
7.8% |
126,545 |
732 |
17.8% |
4.2% |
7.1% |
|
Average |
211 |
77.9% |
9.8% |
116 |
77.2% |
8.0% |
174,434 |
1,603 |
16.8% |
6.8% |
8.4% |
|
*Selling prices used in the computation of rental yields for commercial office and retail themes entailed a combination of both real figures and market estimates of comparable properties in the locations of the Mixed-Use Developments (MUDs) sampled |
|||||||||||
Source: Cytonn Research
- Performance of Real Estate Themes in MUDs versus Single-themed Developments’ Performance
In our Mixed-Use Development analysis, we looked into the performance of the retail, commercial office and residential themes:
- Retail Space
The average rental yield of retail spaces in Mixed-Use Developments came in at 9.8% in 2023, 1.3% points higher than single use retail developments that realized an average rental yield of 8.5%. This was mainly attributable to the high rental rates that MUDs generated at Kshs 211 per SQFT when compared to the Kshs 189 per SQFT recorded for the single-use retail spaces owing to the addition of prime quality spaces attracting higher rates such as Business Bay Square (BBS) mall located in Eastleigh.
Limuru Road and Karen were the best performing nodes with the average rental yield at 12.1% and 11.5%, significantly higher than the market average of 9.8%. This was mainly driven by; i) increased and relatively higher rental rates which translates to higher returns, ii) stable occupancy rates, relatively higher than the market average, iii) presence of residents with high incomes and significant purchasing power, and iv) the availability of sufficient infrastructure that effectively supports the MUDs. Conversely, Upper Hill recorded the lowest rental yields at 8.0%, 1.8% points lower than the market average of 9.8%. This was attributed to the popularity of the area as a commercial office node, coupled with a limited presence of retail developments, and, ii) relatively lower rental rates in comparison to other retail nodes in the Nairobi metropolitan Area. The table below provides a summary of the performance of retail spaces in MUDs against market performance in 2023;
|
Location |
MUD Performance |
Market Performance |
∆ in MUD/Mkt Occupancy |
∆ in y/y MUD/Mkt rental yield |
||||
|
Rent/SQFT |
Occupancy (%) |
Rental Yield (%) |
Rent/SQFT |
Occupancy (%) |
Rental Yield (%) |
|||
|
Limuru Road |
325 |
82.5% |
12.1% |
202 |
74.0% |
8.7% |
8.5% |
3.4% |
|
Karen |
270 |
92.5% |
11.5% |
217 |
85.0% |
10.0% |
7.5% |
1.5% |
|
Eastlands |
243 |
84.7% |
11.2% |
160 |
71.7% |
6.2% |
13.0% |
5.0% |
|
Kilimani |
193 |
83.2% |
9.7% |
192 |
82.3% |
9.9% |
0.9% |
(0.2%) |
|
Westlands |
211 |
70.3% |
9.5% |
216 |
77.6% |
9.1% |
(7.3%) |
0.4% |
|
Thika Rd |
198 |
76.7% |
9.2% |
165 |
80.7% |
7.5% |
(4.0%) |
1.7% |
|
Mombasa Rd |
203 |
75.0% |
8.7% |
168 |
78.7% |
8.0% |
(3.7%) |
0.7% |
|
Upper Hill |
147 |
75.7% |
8.0% |
|
|
|
|
|
|
Average |
211 |
77.9% |
9.8% |
189 |
78.6% |
8.5% |
1.9% |
1.6% |
Source: Cytonn Research
- Commercial Office Space
The average rental yield for commercial office spaces in MUDs came in at 8.0%, 0.7% points higher than single use commercial developments which realized an average rental yield of 7.3% in 2023. The performance by MUDs was largely attributed to the high rental rates chargeable per SQM within the developments driven by; i) the presence of prime grade A offices fetching higher rental rates owing to their superior quality, sustainable and energy efficient features designed to enhance businesses and workers’ experience, and, ii) their strategic locations appealing to multinationals and international organizations which enhances demand.
In terms of submarket performance, Westlands, Upper Hill and Karen were the best performing nodes posting average rental yields of 9.0%, 8.5% and 7.8% attributable to; i) the existence of upscale business parks like GTC, the Hub and the Galleria business park among others, offering higher rental rates and returns, ii) well-established and ample infrastructure linking the nodes, and, iii) heightened demand for the prime locations, attracting clients willing to pay premium rents for the spaces. In contrast, Eastlands exhibited the lowest performance among nodes, with an average rental yield of 5.4%, primarily due to: i) the presence of lower-quality office spaces offering lower rents, and, ii) inadequate quality infrastructure incapable of seamlessly supporting MUDs. The table below shows the performance of office spaces in MUDs against the single use themed market in 2023;
|
(All Values in Kshs Unless Stated Otherwise) |
||||||
|
Cytonn Report: Performance of Commercial Offices in MUDs Vs. Market Performance 2023 |
||||||
|
Location |
MUD Performance |
Market Performance |
||||
|
Rent/SQFT |
Occupancy (%) |
Rental Yield (%) |
Rent/SQFT |
Occupancy (%) |
Rental Yield (%) |
|
|
Westlands |
134 |
74.7% |
9.0% |
114 |
75.2% |
8.4% |
|
Upper Hill |
102 |
81.3% |
8.5% |
98 |
83.4% |
7.9% |
|
Karen |
125 |
82.5% |
7.8% |
116 |
79.7% |
8.3% |
|
Thika Road |
111 |
75.0% |
7.8% |
79 |
80.1% |
6.0% |
|
Kilimani |
114 |
82.4% |
7.6% |
98 |
76.1% |
7.1% |
|
Limuru Road |
112 |
75.5% |
7.2% |
115 |
81.8% |
8.5% |
|
Mombasa Road |
90 |
80.0% |
7.2% |
71 |
67.9% |
5.2% |
|
Eastlands |
80 |
67.5% |
5.4% |
|
|
|
|
Average |
116 |
77.2% |
8.0% |
99 |
77.7% |
7.3% |
Source: Cytonn Research
- Residential Space
In 2023, residential units within MUDs achieved an average rental yield of 6.8%, marking a 1.1% increase compared to the single-use residential market average of 5.7%. This relatively improved performance was primarily influenced by an increase in asking rents to Kshs 1,603 per SQM from Kshs 1,030 per SQM recorded in 2022. Additionally, the supply of newer developments decreased as compared to a similar period last year which allowed for absorption rates to stabilize. Notable projects delivered during the year include, Centum's Loft Residences comprising 32 four-bedroom luxurious units situated within Two Rivers. This was in comparison to last year’s supply of 225 units injected through the Mi Vida project at Garden City.
Regarding sub-market performance, Limuru Road and Westlands emerged as the top-performing node with an average rental yield of 9.0% and 7.9%, attributed to; i) the presence of high-end developments commanding premium rents, ii) the area's robust infrastructure including Limuru, Redhill and Mwanzi roads, along with the Nairobi Expressway, and, iii) the area’s proximity to amenities such as shopping malls enhancing the desirability of apartments in the locations. Conversely, Thika road ranked as the least performing node, registering an average rental yield of 4.2%, mainly due to the lower prices and rental rates associated with developments within that specific area. The table below summarizes the performance of residential spaces in MUDs against the single themed market in 2023:
|
Cytonn Report: Performance of Residential Units in MUDs Vs. Market Performance 2023 |
||||||||
|
Location |
MUD Performace |
Market Performance |
||||||
|
Price/SQM |
Rent/SQM |
Annual Uptake |
Rental Yield % |
Price/SQM |
Rent/SQM |
Annual Uptake |
Rental Yield % |
|
|
Limuru Road |
162,030 |
1,538 |
27.2% |
9.0% |
108,246 |
546 |
16.5% |
5.2% |
|
Westlands |
284,147 |
3,448 |
13.7% |
7.9% |
125,592 |
812 |
15.3% |
5.7% |
|
Mombasa Road |
118,812 |
662 |
13.7% |
6.0% |
76,673 |
428 |
12.2% |
5.7% |
|
Thika Road |
126,545 |
732 |
17.8% |
4.2% |
82,469 |
467 |
11.1% |
5.8% |
|
Average |
174,434 |
1,603 |
16.8% |
6.8% |
86,151 |
494 |
12.4% |
5.7% |
Source: Cytonn Research
Section III: Mixed-Use Developments Investment Opportunity and Outlook
The table below summarizes our outlook on Mixed-Use Developments (MUDs), where we look at the general performance of the key sectors that compose MUDs i.e. retail, commercial office and residential and investment opportunities that lies in the themes;
|
Cytonn Report: Mixed-Use Developments (MUDs) Outlook |
|||
|
Sector |
2023 Sentiment and Outlook |
2023 Outlook |
|
|
Retail |
|
Neutral |
|
|
Office |
|
Neutral |
|
|
Residential |
|
Neutral |
|
|
Outlook |
Given that all our metrics are neutral, we retain a NEUTRAL outlook for Mixed-Use Developments (MUDs), supported by the remarkable returns compared to single-use themes, changing client preferences, and MUDs attractiveness driven by the diversity in amenities and social offerings they provide to clients. However, the existing oversupply of the NMA office market at 5.8 mn SQFT, 3.3 mn SQFT in the NMA retail market, and 2.1 mn SQFT in the Kenyan Retail market is expected to weigh down the performance. Karen, Limuru Road, and nodes provide the best investment opportunities, with the areas providing the highest average MUD yields of 9.7%, 9.5%, and 8.8% respectively, compared to the market average of 7.1%. |
||
Disclaimer: The views expressed in this publication are those of the writers where particulars are not warranted. This publication, which is in compliance with Section 2 of the Capital Markets Authority Act Cap 485A, is meant for general information only and is not a warranty, representation, advice or solicitation of any nature. Readers are advised in all circumstances to seek the advice of a registered investment advisor.

- Talk to us
- Kenya
- P.O Box 20695 - 00200, Nairobi, Kenya
- Cell +254709101200
- Tel +254709101200
- WhatsApp +254741676635
- United States
- +254709101200
- DOWNLOAD OUR APP
-


- Kenya
- 8th Floor, Pinetree Plaza, Kaburu Drive, Ngong Road, Nairobi, Kenya
- USA
- Suite 1150, 1775 Eye Street NW, USA, Washington DC 20006, USA
- Investments
- High Yield
- Private Equity
- Real Estate
- Real Estate
- RiverRun Estates
- Cytonn Towers
- The Ridge
- Taraji Heights
- The Alma