Nairobi Metropolitan Area Residential Report 2017/2018 & Cytonn Weekly #26/2018
By Cytonn Investments Team, Jul 8, 2018
Executive Summary
Fixed Income
T-bills were oversubscribed during the week with the overall subscription rate coming in at 146.0%, up from 126.0% recorded the previous week. Yields on the 91- day paper remained unchanged at 7.7%, while yields on the 182 and 364-day paper declined to 9.5% and 10.4% from 9.6% and 10.5% the previous week, respectively. According to Kenya National Bureau of Statistics (KNBS), Kenya’s economy expanded by 5.7% in Q1’2018, higher than 4.8% in Q1’2017. This was due to: (i) recovery in the agricultural sector, which recorded a growth of 5.2% due to improved weather conditions, (ii) improved business and consumer confidence, and (iii) increased output in the real estate, manufacturing, and wholesale & retail trade sectors, which grew by 6.8%, 2.3% and 6.3%, respectively;
Equities
During the week, the equities market recorded mixed performance, with NASI and NSE 25 declining 0.8% and 0.6%, respectively, while NSE 20 gained 0.9%. For the last twelve months (LTM), NASI and NSE 25 have gained 14.2% and 12.2%, respectively, while NSE 20 has declined by 7.4%. Commercial banks in Kenya have begun implementing Treasury’s new Robin Hood tax of 0.05% on bank transfers of above Kshs 500,000 that was proposed in last month’s budget statement to Parliament;
Private Equity
In fundraising news for the week, Musoni, a microfinance institution based in Nairobi, which targets small-scale farmers and the informal sector, has issued out Kshs 2.0 bn in debt notes through a private placement, with the main targets being asset managers, trust management funds, and high net-worth individuals. In the financial services sector, Mauritius-based SBM Holdings, through its subsidiary SBM Kenya Limited, has acquired certain assets and liabilities of Chase Bank after getting the approval of the Cabinet Secretary for the National Treasury. After the acquisition, SBM Kenya will assume 75% of the value of deposits as well as take up majority of the branches and employees;
Real Estate
During the week, Kenya National Bureau of Statistics (KNBS) released their Gross Domestic Report Q1'2018, which indicated that the real estate sector grew by 6.8% in Q1’2018, compared to a 6.1% growth recorded in Q1’2017. We attribute this increase to increased investor confidence in the sector and thus increased development activities. In the hospitality sector, Jumia Travel released their Hospitality Report Kenya 2018, highlighting that the travel and hospitality sector contributed approximately 3.7% to the 2017 GDP, and this is expected to increase to 5.2% in 2018. In the retail sector, foreign retailers continued with the local expansion, with South Africa’s Massmart announcing plans to open hardware outlets in Kenya;
Focus of the Week
In September 2017, we released the Nairobi Metropolitan Area Residential Report 2017, which showed that the residential sector performance softened in 2017, with the total returns coming in at 9.4%, from 12.6% in 2016. This week, we update the findings of that report by looking at the residential market performance since then up till now. Per our findings, the residential sector recorded total returns of 8.2%, a 1.2% points decline from the 9.4% total returns recorded in 2017; the average price appreciation was 2.8% with an average rental yield of 5.4%. The performance is attributable to a decline in performance of selected markets such as the lower middle market for detached units and upper middle markets for apartments which recorded big declines in price appreciation of 4.1% and 1.5%, respectively attributable to the effect of last year’s electioneering period, and tight access to financing especially for potential home buyers, with private sector credit growth falling to 2.1% as at April 2018 compared to a five year average of 14.0%.
- Maurice Oduor, Senior Investments Manager, discussed the financial budget 2018/2019 and its effects on the economy. Watch Maurice on Citizen TV here
- Caleb Mugendi, Senior Investments Analyst, discussed the adoption of IFRS 9 by SACCOs, and the proposed private placement of Kenya’s treasury bond sale. Watch him on CNBC here
- On Saturday 7th July 2018, Cytonn Real Estate held an open day at Amara Ridge, the differentiated and aspirational gated community in Karen. See Event Note
- We continue to hold weekly workshops and site visits on how to build wealth through real estate investments. The weekly workshops and site visits target both investors looking to invest in real estate directly and those interested in high yield investment products to familiarize themselves with how we support our high yields. Watch progress videos and pictures of The Alma, Amara Ridge, The Ridge, and Taraji Heights. Key to note is that our cost of capital is priced off the loan markets, where all-in pricing ranges from 16.0% to 20.0%, and our yield on real estate developments ranges from 23.0% to 25.0%, hence our top-line gross spread is about 6.0%. If interested in attending the site visits, kindly register here
- We continue to see very strong interest in our weekly Private Wealth Management Training (largely covering financial planning and structured products). The training is at no cost and is open only to pre-screened participants. We also continue to see institutions and investment groups interested in the trainings for their teams. The Wealth Management Trainings are run by the Cytonn Foundation under its financial literacy pillar. If interested in our Private Wealth Management Training for your employees or investment group please get in touch with us through wmt@cytonn.com. To view the Wealth Management Training topics, click here
- For recent news about the company, see our news section here
- We have 10 investment-ready projects, offering attractive development and buyer targeted returns of around 23.0% to 25.0% p.a. See further details here: Summary of Investment-Ready Projects
- We continue to beef up the team with ongoing hires for: Chief Executive Officer Cytonn Education Services (CES), Full Stack Software Engineer, and Unit Manager-Nairobi. Visit the Careers section on our website to apply.
T-Bills & T-Bonds Primary Auction:
T-bills were oversubscribed during the week with the subscription rate coming in at 146.0%, up from 126.0% recorded the previous week. Yields on the 91-day paper remained unchanged at 7.7%, while yields on the 182 and 364-day paper declined to 9.5% and 10.4% from 9.6% and 10.5% the previous week, respectively. T-bill yields continue to decline as the government continues to reject expensive bids in the primary market due to the reduced pressure to borrow, given the reduction in the domestic borrowing target in the 2018/2019 fiscal year to Kshs 271.9 bn, 8.6% lower than the 2017/2018 fiscal year’s target of Kshs 297.6 bn. The acceptance rate for T-bills declined to 70.8%, from 88.5% the previous week, with the government accepting Kshs 24.8 bn of the Kshs 35.0 bn worth of bids received. The subscription rates for the 91, 182 and 364-day papers came in at 18.7%, 77.1%, and 265.9%, compared to 115.0%, 57.5%, and 198.9%, respectively, the previous week as investors participation was more skewed towards the longer dated papers.
Liquidity:
The average interbank rate increased to 6.4%, from 6.2%, the previous week, while the average volumes traded in the interbank market increased by 28.5% to Kshs 25.7 bn, from Kshs 20.0 bn the previous week. The increase in the average interbank rate points to declined liquidity, which the Central Bank of Kenya attributed to some banks seeking funds in the interbank market for quarterly tax remittances.
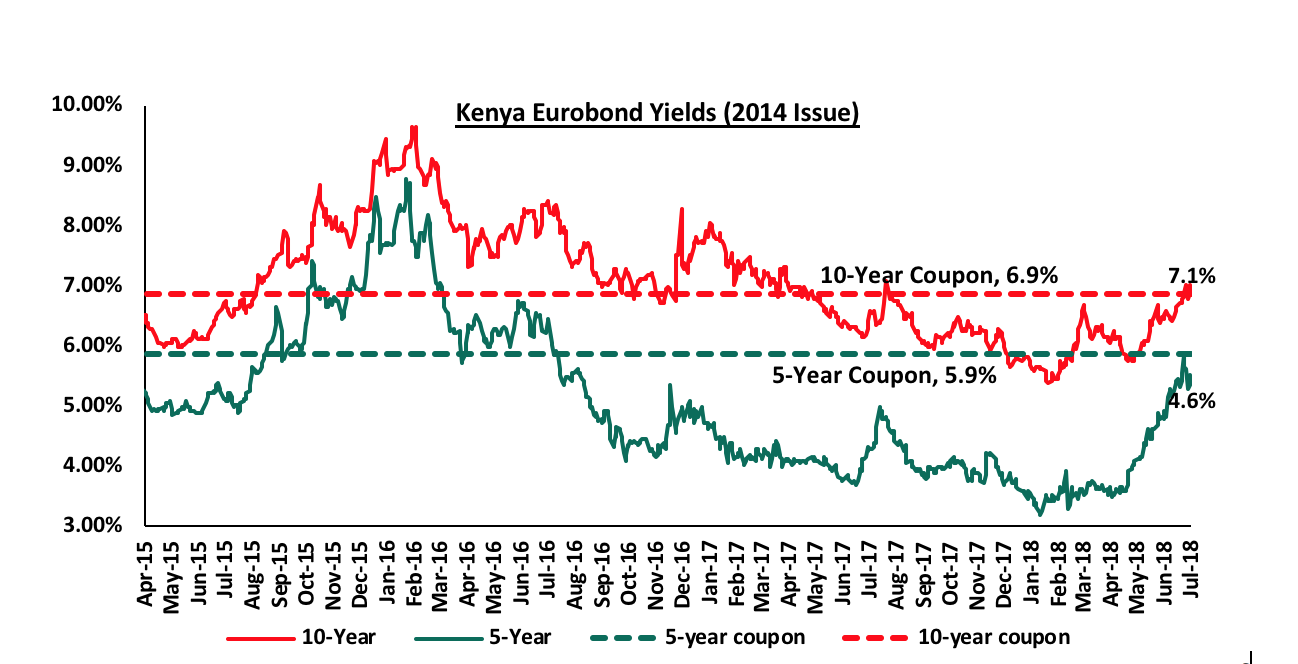
Kenya Eurobonds:
According to Bloomberg, the yield on the 10-year Eurobond issued in 2014 remained unchanged at 7.1%, while the 5-year Eurobond declined by 70 bps to 4.6%, from 5.3% the previous week, a reflection of improved investor sentiment following the expansion of Kenya’s economy by 5.7% in Q1’2018, higher than the estimated 2018 growth projection of 5.5%. Since the mid-January 2016 peak, yields on the Kenya Eurobonds have declined by 4.2% points and 2.6% points for the 5-year and 10-year Eurobonds, respectively, an indication of the relatively stable macroeconomic conditions in the country.
For the February 2018 Eurobond issue, during the week, the yields on the 10-year Eurobond declined by 20 bps to 7.6% from 7.8% the previous week, while the 30-year Eurobonds declined by 10 bps to 8.7%, from 8.8% the previous week. Since the issue date, yields on the 10-year and 30-year Eurobonds have both increased by 0.4% points.
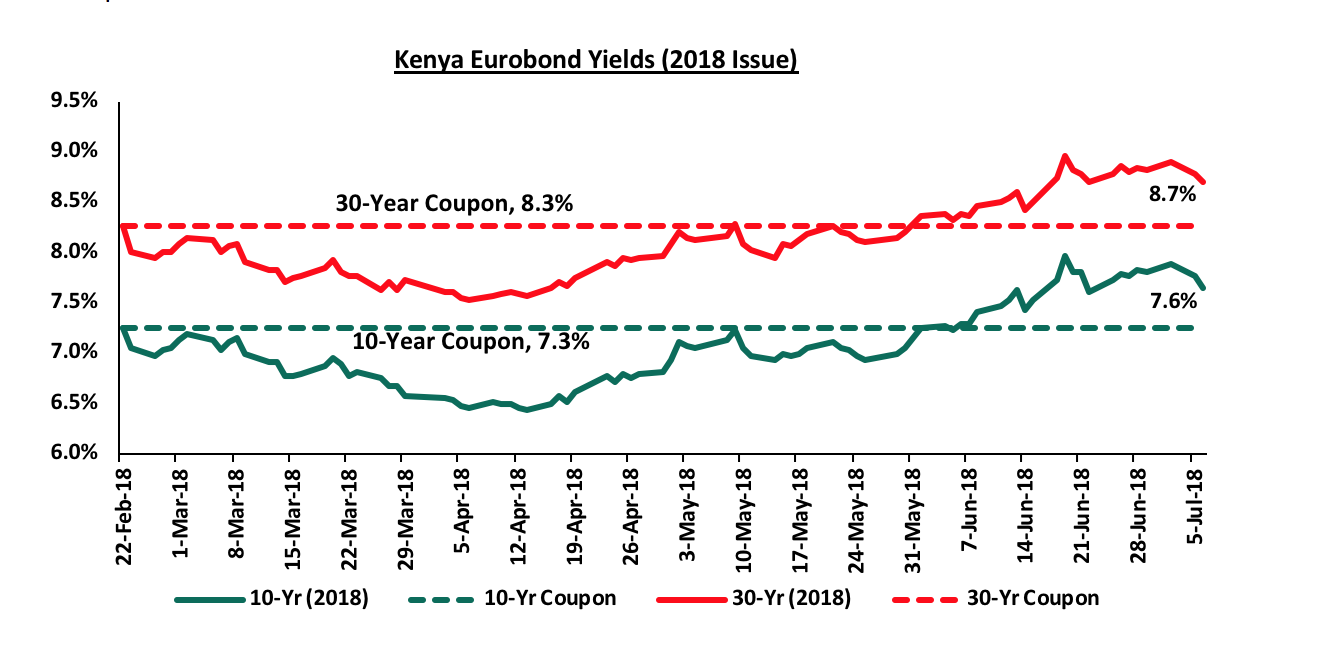
We have noted the recent rise in Kenya Eurobond yields and this may be attributed to the current corruption scandals erupting in the country that seem to have led to varying sentiments across the market.
The Kenya Shilling:
During the week, the Kenya Shilling appreciated by 0.3% to close at Kshs 100.8, from Kshs 101.1 the previous week, which the CBK attributed to increased inflows from Kenyans living abroad. In our view, the shilling should remain relatively stable against the dollar in the short term, supported by:
- The narrowing of the current account deficit, which stood at 6.1% of GDP as at March 2018 from 6.4% in December 2017,
- Stronger inflows from principal exports, which include coffee, tea and horticulture, which increased by 9.3% during the month of April to Kshs 21.9 bn from Kshs 20.0 bn in a similar period the previous year, with the exports from coffee, and horticulture increasing by 6.7%, and 25.0% y/y, respectively, while tea exports have declined marginally by 1.6% y/y,
- Improving diaspora remittances, which increased by 16.9% to USD 253.7 mn in May 2018, from USD 217.1 mn in April 2018, with the bulk contribution coming from North America at USD 122.8 mn attributed to (a) recovery of the global economy, (b) increased uptake of financial products by the diaspora due to financial services firms, particularly banks, targeting the diaspora, and (c) new partnerships between international money remittance providers and local commercial banks making the process more convenient, and,
- High forex reserves, currently at USD 8.9 bn (equivalent to 5.9 months of import cover) and the USD 1.5 bn stand-by credit and precautionary facility by the IMF, still available until September 2018.
Weekly Highlights:
According to Kenya National Bureau of Statistics (KNBS), Kenya’s economy expanded by 5.7% in Q1’2018, higher than 4.8% in Q1’2017. This was due to; (i) recovery in agriculture, which recorded a growth of 5.2% due to improved weather conditions, (ii) improved business and consumer confidence, and (iii) increased output in the real estate, manufacturing, and wholesale & retail trade sectors, which grew by 6.8%, 2.3% and 6.3%, respectively. The agriculture & forestry sector had the highest sectoral contribution to the overall GDP growth, with a weighted contribution of 1.3% of the 5.7% growth. For a more comprehensive analysis on the economic growth review, see Kenya Q1’2018 GDP Review and Outlook.
According to the Stanbic Bank’s Monthly Purchasing Manager’s Index (PMI), the business environment in the country continued to improve in June 2018, mainly driven by favorable economic conditions and continued strong demand from international markets. The improvement however was at a slower pace compared to May owing to slower rise in output and new business. The seasonally adjusted PMI declined to 55.0 in June from 55.4 in May, the lowest since February. A PMI reading of above 50 indicates improvements in the business environment, while a reading below 50 indicates a worsening outlook. Firms reported growth in value of outputs due to the continued rise in new export orders. This was despite high input costs attributed to an increase in fuel prices, leading to upward pressure on production costs, and consequently a rise in average selling prices with the cost burden being transferred to customers. In response to increased output requirements, firms also raised their staffing levels at a steady pace. We expect output to continue rising, driven by a recovery in agricultural produce, mainly horticulture, as the Eurozone (Kenya’s main horticultural export destination) continues to recover and boost demand. The private sector has remained resilient, since the index is still above 50.0, which is a signal of improved business conditions. The rate cap, however, continues to limit private sector credit growth, which stood at an average growth of 2.0% in Q1’2018, compared to 3.8% in Q1’2017. However, if the proposal by the National Treasury CS in the FY2018/19 budget to repeal the interest rate cap law is approved by Parliament, we expect it to spur growth of the private sector driven by better access to credit as banks will be able to price borrowers appropriately.
Kenya’s current account deficit improved during Q1’2018, coming in at Kshs 107.9 bn from Kshs 129.7 bn in Q1’2017, a decline of 16.8%, equivalent to 8.9% of GDP in Q1’2018, from 11.3% recorded in Q1’2017. This was due to export growth outpacing the growth in imports, growing at 7.1% to Kshs 162.9 bn from Kshs 152.1 bn in Q1’2017, compared to the 6.5% increase in imports to Kshs 432.1 bn from Kshs 406.4 bn in Q1’2017. In addition, there was a 28.0% increase in the services trade balance, coupled with the 26.9% increase in the secondary income (transfers) balance, whose increase could be attributed to the 46.1% increase in diaspora remittances. While the improvement in the trade deficit is commendable, we are still of the view that the government still has to focus on putting further practical measures in place to move to a surplus from the current deficit. This includes: (i) supporting the growth of the domestic manufacturing sector in order to reduce importation of goods that can be produced and sourced locally and strengthening a national marketing body for such products abroad to boost exports, and (ii) providing incentives for exporters, which the government is already planning for through the rolling out of Special Economic Zones (SEZs). For a more comprehensive analysis see the Q1’2018 Quarterly Balance of Payments Note
Rates in the fixed income market have remained stable, and had been on a declining trend towards the tail end of the fiscal year 2017/18, as the government rejected expensive bids given it had been under no pressure to borrow. The government is however likely to remain behind its borrowing target for the better part of the first half of the 2018/19 financial year as per historical data. The newly released 2018/19 budget gives a domestic borrowing target of Kshs 271.9 bn, 8.6% lower than the 2017/2018 fiscal year’s target of Kshs 297.6 bn, which may result in reduced pressure on domestic borrowing. However, the National Treasury has proposed to repeal the interest rate cap, which if repealed can result in upward pressure on interest rates, as banks would resume pricing of loans to the private sector based on their risk profiles. With the cap still in place, we maintain our expectation of stability in the interest rate environment. With the expectation of a relatively stable interest rate environment, our view is that investors should be biased towards medium to long-term fixed income instruments.
Market Performance:
During the week, the equities market recorded mixed performance, with NASI and NSE 25 declining 0.8% and 0.6%, respectively, while NSE 20 gained 0.9%, taking YTD performance to 1.0%, (10.7%) and 1.7%, for NASI, NSE 20 and NSE 25, respectively. This week’s performance was mixed, with gains made by NIC Group, Standard Chartered, Equity Group and KCB Group of 4.4%, 3.5%, 3.2% and 1.1%, respectively, which was offset by declines by Barclays, Co-operative Bank, Bamburi Cement and Diamond Trust Bank, of 3.0%, 2.9%, 2.2% and 2.0%, respectively. For the last twelve months (LTM), NASI and NSE 25 have gained 14.2% and 12.2%, respectively, while NSE 20 has declined by 7.4%.
Equities turnover declined by 34.1% this week to USD 24.1 mn, from USD 36.5 mn the previous week, with foreign investors dominating the market activity during the week. We expect the market to remain resilient this year supported by positive investor sentiment, as investors take advantage of the attractive stock valuations in select counters.
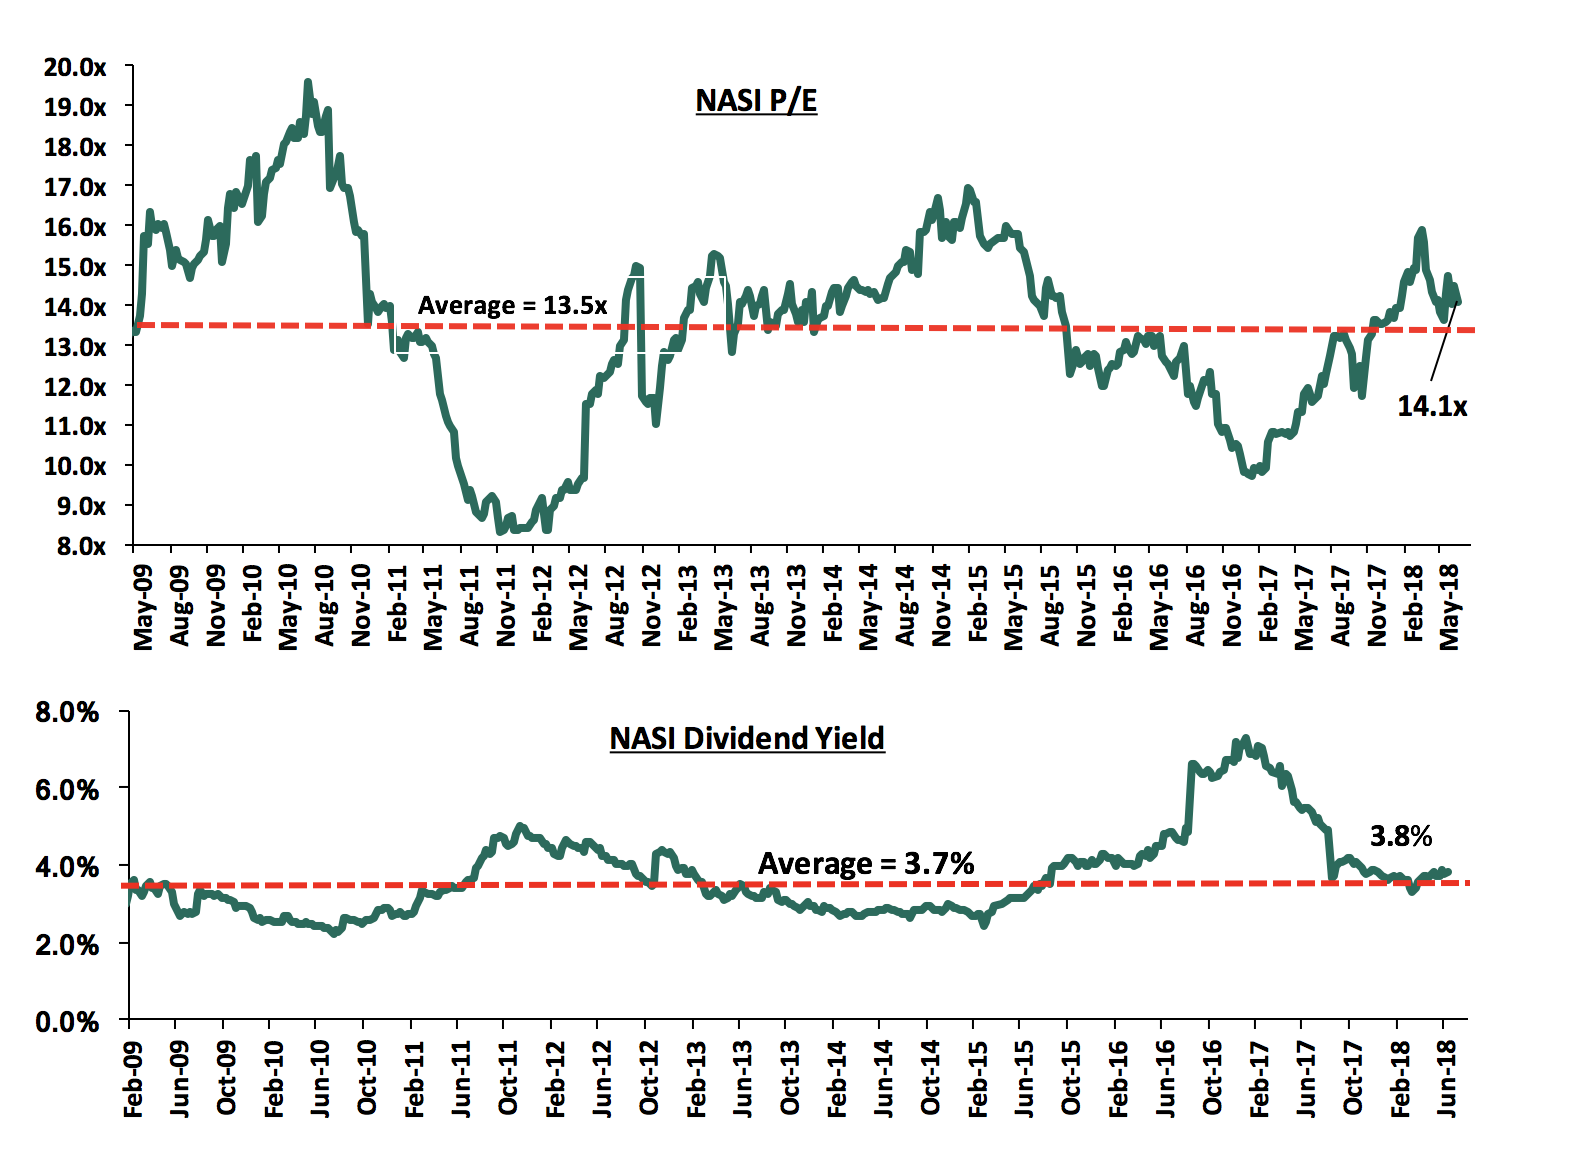
The market is currently trading at a price to earnings ratio (P/E) of 14.1x, which is above the historical average of 13.5x, and a dividend yield of 3.8%, which exceeds the historical average of 3.7%. The current P/E valuation of 14.1x is 43.9% above the most recent trough valuation of 9.8x experienced in the first week of February 2017, and 69.9% above the previous trough valuation of 8.3x experienced in December 2011. The charts below indicate the historical P/E and dividend yields of the market.
Weekly Highlights:
Commercial banks have begun implementing Treasury’s new Robin Hood tax of 0.05% on bank transfers of above Kshs 500,000 that was proposed in the 2018/19 Budget presented to Parliament. Some lenders have communicated to customers notifying them of the new fee adjustment that took effect from 1st July 2018. Treasury Secretary Henry Rotich also proposed to raise the excise duty on mobile transfers to 12.0% from 10.0% as part of broader measures that are projected to generate Kshs 27.5 bn in extra revenues for the state. The extra revenue to be generated from the recently proposed taxes will be used to finance the President’s Big Four Agenda, which focuses on four key pillars of (i) affordable housing, (ii) universal healthcare, (iii) manufacturing, and (iv) food security.
Capital markets stakeholders have agreed to collaborate on a joint strategy to ensure proper packaging of products that meet issuers and investors’ expectations, in a bid to enhance the listing and uptake of investment products. The strategy incorporates agencies such as the Treasury, the Nairobi Securities Exchange, the Central Depository and Settlement Corporation (CDSC), as well as the Fund Managers Association (FMA), alongside the Kenya Association of Stockbrokers and Investment Banks (KASIB), licensed market intermediaries, and the East African Venture Capital Association (EAVCA). NSE Chief Executive Geoffrey Odundo said a proposal to introduce an incubator board would assist issuing entities in oversight of new products to make their offerings more attractive to investors. The initiative is informed by a recent study conducted by Capital Markets Authority (CMA) that raised concern over the low number of listings and low uptake of capital markets products such as the Barclays Gold ETF and the Fahari I-REIT. According to the CMA study, factors influencing the low uptake of products include:
- Reluctance to innovate and implement new products,
- Failure to attract large private and public potential issuers to list at the NSE,
- The perception that regulatory bottlenecks overweigh the relatively lower cost of raising funds through capital markets compared with bank lending rates,
- Adverse macroeconomic environment and emerging competition from other quick return investments such as real estate, mobile money products and betting, and,
- Others are reputational risk exposure for potential issuers to post-offer/listing price correction following professional valuation, and the absence of a clear action plan towards compensation of bond investors whose funds remained locked in Chase Bank and Imperial Bank, which has dampened investor confidence specifically in the corporate bond market.
We are of the view that this initiative will not only help investors better evaluate and understand capital market products, thereby increasing uptake of investment products, but will also assist issuers take advantage of capital-raising opportunities by tailoring investment products that meet investors’ expectations.
Equities Universe of Coverage:
Below is our Equities Universe of Coverage:
|
Banks |
Country Currency |
Price as at 6/07/2018 |
w/w change |
YTD Change |
Target Price* |
Dividend Yield |
Upside/ Downside** |
P/TBv Multiple |
||
|
Ghana Commercial Bank*** |
Ghanaian Cedi |
5.0 |
(3.5%) |
(1.0%) |
7.7 |
7.3% |
56.4% |
1.3x |
||
|
NIC Bank*** |
Kenya Shilling |
36.5 |
2.8% |
8.1% |
54.1 |
2.8% |
55.2% |
0.8x |
||
|
I&M Holdings*** |
Kenya Shilling |
115.0 |
0.0% |
10.6% |
169.5 |
3.0% |
50.4% |
1.2x |
||
|
Zenith Bank |
Nigerian Naira |
24.3 |
(2.8%) |
(5.2%) |
33.3 |
10.8% |
44.1% |
1.1x |
||
|
Diamond Trust Bank*** |
Kenya Shilling |
195.0 |
(2.0%) |
1.6% |
280.1 |
1.3% |
42.1% |
1.1x |
||
|
KCB Group*** |
Kenya Shilling |
46.5 |
0.5% |
8.8% |
60.9 |
6.5% |
38.2% |
1.5x |
||
|
Union Bank Plc |
Nigerian Naira |
6.0 |
(2.5%) |
(23.7%) |
8.2 |
0.0% |
33.6% |
0.6x |
||
|
CRDB |
Tanzanian Shilling |
160.0 |
0.0% |
0.0% |
207.7 |
0.0% |
29.8% |
0.5x |
||
|
Barclays |
Kenya Shilling |
11.4 |
(3.4%) |
18.2% |
14.0 |
8.5% |
27.7% |
1.5x |
||
|
Ecobank |
Ghanaian Cedi |
7.6 |
(10.1%) |
0.0% |
10.7 |
0.0% |
27.0% |
2.4x |
||
|
Equity Group |
Kenya Shilling |
47.8 |
3.2% |
20.1% |
55.5 |
4.3% |
24.3% |
2.3x |
||
|
HF Group*** |
Kenya Shilling |
8.4 |
(1.2%) |
(19.2%) |
10.2 |
3.8% |
23.8% |
0.3x |
||
|
Co-operative Bank |
Kenya Shilling |
17.1 |
(2.3%) |
6.9% |
19.7 |
4.6% |
17.1% |
1.5x |
||
|
Stanbic Bank Uganda |
Ugandan Shilling |
32.0 |
0.0% |
17.4% |
36.3 |
3.7% |
17.0% |
2.0x |
||
|
UBA Bank |
Nigerian Naira |
10.4 |
(1.4%) |
0.5% |
10.7 |
14.3% |
16.2% |
0.7x |
||
|
CAL Bank |
Ghanaian Cedi |
1.3 |
6.6% |
20.4% |
1.4 |
0.0% |
14.8% |
1.0x |
||
|
Bank of Kigali |
Rwandan Franc |
288.0 |
0.7% |
(4.0%) |
299.9 |
4.8% |
9.7% |
1.6x |
||
|
Standard Chartered |
Kenya Shilling |
204.0 |
3.0% |
(1.9%) |
184.3 |
6.3% |
(0.6%) |
1.5x |
||
|
Stanbic Holdings |
Kenya Shilling |
91.0 |
(1.1%) |
12.3% |
85.9 |
5.7% |
(0.9%) |
1.1x |
||
|
Guaranty Trust Bank |
Nigerian Naira |
41.5 |
2.5% |
1.8% |
37.2 |
5.9% |
(2.2%) |
2.3x |
||
|
Access Bank |
Nigerian Naira |
10.4 |
0.5% |
(0.5%) |
9.5 |
3.9% |
(4.3%) |
0.7x |
||
|
SBM Holdings |
Mauritian Rupee |
7.2 |
(1.1%) |
(4.0%) |
6.6 |
4.1% |
(5.8%) |
1.0x |
||
|
Bank of Baroda |
Ugandan Shilling |
149.0 |
(0.7%) |
31.9% |
130.6 |
1.7% |
(11.3%) |
1.3x |
||
|
Standard Chartered |
Ghanaian Cedi |
26.6 |
14.9% |
5.3% |
19.5 |
0.0% |
(15.9%) |
2.9x |
||
|
Stanbic IBTC Holdings |
Nigerian Naira |
52.0 |
0.0% |
25.3% |
37.0 |
1.1% |
(27.7%) |
2.7x |
||
|
FBN Holdings |
Nigerian Naira |
10.5 |
(0.9%) |
19.3% |
6.6 |
2.4% |
(35.1%) |
0.6x |
||
|
Ecobank Transnational |
Nigerian Naira |
20.5 |
2.5% |
20.6% |
9.3 |
0.0% |
(53.6%) |
0.7x |
||
|
National Bank |
Kenya Shilling |
6.5 |
3.2% |
(31.0%) |
2.8 |
0.0% |
(55.2%) |
0.4x |
||
|
*Target Price as per Cytonn Analyst estimates |
||||||||||
|
**Upside / (Downside) is adjusted for Dividend Yield |
||||||||||
|
***Banks in which Cytonn and/or its affiliates holds a stake. For full disclosure, Cytonn and/or its affiliates holds a significant stake in NIC Bank, ranking as the 5th largest shareholder |
||||||||||
We are “NEUTRAL” on equities for investors with a short-term investment horizon since the market has rallied and brought the market P/E slightly above its’ historical average. However, pockets of value exist, with a number of undervalued sectors like Financial Services, which provide an attractive entry point for long-term investors, and with expectations of higher corporate earnings this year, we are “POSITIVE” for investors with a long-term investment horizon.
Musoni, a Kenyan microfinance institution, has issued out Kshs 2.0 bn in debt notes. The financier, which has 25 branches across the country, was founded in 2010 and focuses on funding small-scale farmers and businesses in the informal sector. The issue mainly targets asset managers, trust management funds, and high net-worth individuals, and is part of the initiative by the institution to shift from foreign-based funding to local financing. The change to local financing is a move by the company to avoid the exchange rate risk it will incur on paying back the debt to foreign investors in their respective currencies. Details of the debt issue include:
- The tenor of the debt is 2-3 years, and investors have a chance to roll over instead of cashing in, and,
- The issue of the debt notes is to take place in four tranches of Kshs 500.0 mn each.
Given that similar microfinance institutions are in the market raising debt through 2-year and 3-year medium term notes at yields of 16.0% and 17.0%, respectively, we are of the view that the Musoni debt issuance will also be priced at around the same range, at 16% for the 2-year debt note and 17% for the 3-year debt note
The Kshs 2.0 bn debt note will be used to grow their loan book, which stood at Kshs 1.8 bn as at December 2017. Musoni offers loans from Kshs 500 to a maximum of Kshs 3.0 mn at an effective annual rate of 24.3% for group loans and an effective annual rate of 22.0% for individual loans. In February 2018, Luxembourg- based private equity firm Fonds European de Financement Solidaire (Fefisol) invested Kshs 100.0 mn in Musoni Microfinance Limited for an undisclosed stake, highlighting global capital interest in micro lending in sub Saharan Africa. Increase in credit lending agencies in Kenya, especially the digital platforms have diversified the source of funds in the country, which has enabled borrowers to tap into alternative avenues of funding that are more flexible and pocket friendly.
Alternative channels of funding, such as Musoni are important for the economy to reduce over-reliance on bank funding. In a normal developed economy, 40% of business funding comes from the banking sector, with 60% coming from non-bank institutional funding. In Kenya, 95% of all funding comes from bank funding, and only 5.0% from non-bank institutional funding, showing that the economy is over reliant on bank lending and should have more alternative and capital markets products funding businesses. Alternative Investment Managers and the Capital Markets Authority need to look at how to enhance non-bank funding, such as high yield investment vehicles, some of which include High Yield Notes.
Mauritius-based SBM Holdings, a banking institution with headquarters in Port Louis, Mauritius, has acquired 75.0% of the value of deposits of Chase Bank, which was under receivership. SBM, which has branches across Mauritius, Madagascar, India and Kenya, was founded in 1973 and provides banking and financial services to retail and corporate customers, governments and individuals through personal banking products. The acquisition is part of SBM’s regional expansion initiative, after the bank issued two bonds in Port Louis worth Kshs 10.0 bn, with these funds channelled towards regional expansion. Following the agreement between the Central Bank of Kenya (CBK), Kenya Deposit Insurance Corporation (KDIC) and SBM Bank Kenya, 75% of the value of all moratorium deposits at Chase Bank will be transferred to SBM Bank Kenya. The remaining 25% will remain with Chase Bank Limited. This is a major milestone as this is the first successful instance, in the history of Kenya, of a bank being successfully brought out of receivership. Chase Bank was taken under receivership of the CBK in 2016, with customer deposits in excess of Kshs 100.0 bn. The acquisition will see SBM take control of the 62 Chase Bank branches, significantly increasing the bank’s foothold in the country, and SBM Kenya’s market share will rise to 2.4% from the current 0.2%. SBM Bank has injected Kshs 2.6 bn in Chase Bank, and is planning to inject a further Kshs 6.0 bn after the acquisition to revive the collapsed bank. In addition to this, the bank is expected to absorb majority of the 1,300 former employees of Chase Bank Limited. For more details on the acquisition and transfer of the moratorium deposits to SBM Kenya, see our Cytonn Weekly #16/2018.
Private equity investments in Africa remains robust as evidenced by the increasing investor interest, which is attributed to; (i) rapid urbanization, a resilient and adapting middle class and increased consumerism, (ii) the attractive valuations in Sub Saharan Africa’s private markets compared to its public markets, (iii) the attractive valuations in Sub Saharan Africa’s markets compared to global markets, and (iv) better economic projections in Sub Sahara Africa compared to global markets. We remain bullish on PE as an asset class in Sub-Sahara Africa. Going forward, the increasing investor interest and stable macro-economic environment will continue to boost deal flow into African markets.
During the week, The Kenya National Bureau of Statistics (KNBS) released their Gross Domestic Report Q1'2018, the key take- outs for the real estate sector were;
- The sector’s development activities slowed down, with the construction sector growing by 7.2% in Q1’2018, 1.0% point lower than the 8.2% growth recorded in Q1’2017, and consumption of cement dropped by 12.5% to 1.4 mn tonnes in Q1’2018, from 1.6 mn tonnes in Q1’2017. The slowdown in activities has been attributed to a tough operating environment experienced in H2’2017, as well as drought and inflationary pressures that dampened the country’s overall economic growth, hence affecting the purchasing power of potential clients. Despite the slowdown, the sector’s growth is attributed to the ongoing public infrastructural projects such as, the expansion of Ngong Road Phase 2 and phase two of the Standard Gauge Railway (SGR), as well as the continued development of buildings, and,
- The real estate sector grew by 6.8% in Q1’2018, 0.7% points higher than the 6.1% growth recorded in Q1’2017, and we attribute the growth to increased investor confidence, and thus investments in real estate following the conclusion of the extended electioneering period.
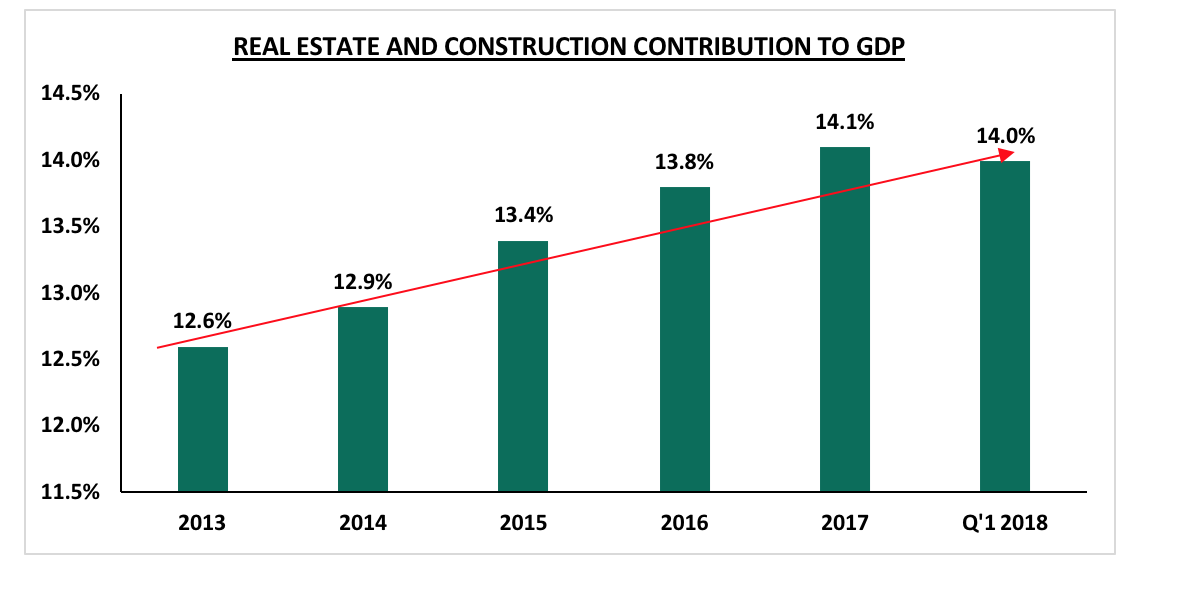
Source: KNBS
According to KNBS, the contribution of the real estate and construction sector to GDP has continued to increase as shown above, and we expect the trend to continue driven by; (i) political stability, (ii) economic recovery with the GDP projected to come in between 5.3% and 5.5% in 2018, higher than the 4.7% recorded in 2017, and (iii) government incentives such as (a) tax relief of 15.0% for developers putting up more than 100 affordable housing units p.a., (b) the scrapping of the land title search fees, NEMA and NCA Levies, and (c) digitization of the Lands Ministry.
In the hospitality sector, industry reports have been released, indicating that the sector is expected to record improved performance in 2018 driven by factors such as; (i) increased international arrivals, (ii) continued marketing, and (iii) domestic tourism and international conferences.
These reports include;
- Jumia Travel Hospitality Report Kenya 2018 –The report focused on the travel and hospitality sector contribution to GDP, the sector’s performance and main trends shaping the sector.
The key take-outs from the report include;
- The sector contributed approximately 3.7% to the 2017 GDP, 0.6% points higher than the 3.1% contribution to GDP recorded in 2016, and this is expected to increase to 5.2% in 2018, driven by a) enhanced security in the country, b) infrastructural developments such as The Standard Gauge Railway, c) a stable macroeconomic environment, d) improved budgetary allocations by the government, which increased by 1.0% p.a. to Kshs 4.5 bn in 2018 from Kshs 1.5 bn in 2016, and e) the resilience of the tourism sector where the contribution is expected to increase by 5.3% from Kshs 294.6 bn to rise to Kshs 310.1 bn,
- Hotel bed-nights occupancy rose by 11.0% to 7.2 mn in 2017 from 6.4 mn in 2016, and this is attributable to increased international arrivals, which stood at 1.4 mn in 2017, compared to 1.3 mn in 2016, representing an annual increase of 9.8%, despite a turbulent electioneering period,
- On hotel star establishments, 3- stars attracted the highest number of total bookings comprising 35.0% of the total hotel bookings in Kenya, while 2-star and 4-star hotels recorded 30.0% and 26.0% of the total hotel bookings, respectively, attributable to relatively lower average daily rate for the 3-star hotels, at approximately Kshs 7,672 compared to 4 star hotels at Kshs 12,164, and also better-quality amenities compared to 2-star hotels,
- On local travel destinations, Nairobi was the most popular destination with 35.0% of the total number of guests visiting the city, followed by Mombasa and Diani at 30.0% and 15.0%, respectively. We attribute the high numbers in Nairobi to meetings, incentives, conferences and exhibitions (MICE), and the city’s recognition as a regional hub,
- Domestic expenditure on tourism grew by 16.0%, with Kenyans taking up approximately 4.0 million bed nights in 2017, compared to 3.5 million in 2016, and this we attribute to increased domestic tourism, resulting from the implementation of various policies such as; the scrapping of VAT charges on national park fees and domestic marketing efforts that have encouraged Kenyans to visit various hospitality establishments across the country,
- Technology is the main factor driving the travel and hospitality industry, through enhancing accessibility of flights bookings via the internet. This is evidenced by the bookings trends demonstrated in June 2017, where Jumia Travel web bookings stood at 11.0%, direct bookings at 60.0%, while travel agents contributed 29.0% of the bookings. Comparatively, during the same period in 2018, the web bookings increased to 23.0% with direct bookings dropping to 47.0%, while travel agents recorded 30.0% of the bookings,
- Technological trends shaping the hospitality sector include; a) internet and mobile penetration, which stood at 83.0% in 2017, 16.0% points higher than the 67.0% penetration in 2016, b) Wi- Fi connectivity that is one of the most sought after amenity by travelers, c) online video marketing given its high level of memorability, d) mobile bookings, with Jumia Travel recording 44.0% bookings via mobiles in Q3’2017 compared to 41.0% during Q2’2017, e) virtual reality aimed at enhancing customers’ experience, f) Internet of Things (IoT), which involves the use of apps and automated systems by both guests and hotel managers, and g) artificial intelligence to enhance user experience.
- PWC Hotel Outlook 2018- 2022- the report focused on the hospitality sector’s outlook for the period between 2018 and 2022, highlighting that the sector will exude improvement in the next 5 years with guest nights expected to rise at a 6.9% CAGR during the next five years from 3.6 mn in 2018, to 4.6 mn in 2022, and the occupancy rates rise by 10.8% points to 58.1% from 47.3% during the same period. Other key take- outs from the report include;
- Kenya is expected to benefit from a number of new hotels opening, among them Hilton, Radisson Blu, Pullman, Best Western, and Mövenpick, which will result in a 1,800 increase in rooms in the next 5 years. In addition, 13 hotels are expected to enter the market in the next 5 years, adding a total of 2,600 rooms and thereby accounting for a 14.0% increase in hotel capacity and a 2.6% CAGR in room availability between 2018 and 2022,
- Hotel room revenues are expected to grow by a 9.6%, CAGR, from 461 mn USD in 2018 to 690 mn USD in year 2022, attributable to the rising number of domestic and foreign business and leisure visitors, with the number of guest nights expected to rise at a 6.9% CAGR from 3.6 mn in 2018 to 4.6 mn in 2022, driven by; (i) the introduction of direct flights to the United States of America by Kenya Airways, expected to commence in Q4’2018, which is expected to boost U.S. travel to Kenya, (ii) the rising tourist numbers from India, Poland, Russia, the Czech Republic and China, (iii) continued marketing of the country as a destination for experiences, and (iv) the promotion of the country as a beach destination, aided by the ‘Beach & Bush’ tourism campaign with Mauritius to promote both countries as tourist destinations.
The findings from the PWC Hotel Outlook 2018-2022 and Jumia Travel Hospitality Report Kenya 2018 are in line with our Cytonn Annual Outlook Report 2018, where we stated that we expect the performance of the hospitality sector to improve in 2018, with the room occupancy in Nairobi expected to increase by 4.0% points y/y from 49.0% in 2017 to 53.0% in 2018. The Average Daily Rate(ADR) is expected to increase by 11.0% y/y from 125.5 USD in 2017 to 139.3 USD in 2018, and Revenue per Available Room (RevPAR) by 20.6% y/y from 61.2 USD to 73.8 USD, driven by; (i) the stabilizing political situation, (ii) growth of meetings incentives conventions and exhibitions (MICE) and domestic tourism, (iii) sustained international business and travel tourism, and (iv) increased marketing efforts by the Kenya Tourism Board (KTB) both locally and internationally. The projections are shown below:
|
Nairobi Hospitality Sector Performance Projections 2018 |
||||||
|
Factor |
2014 |
2015 |
2016 |
2017* |
2018F |
∆ 2017/18 |
|
International Visitor arrivals ('000) |
1,350 |
1,181 |
1,340 |
1,453 |
1,612 |
11.0% |
|
Total Bed Nights ('000) |
6,282 |
5,879 |
6,449 |
6,584 |
7,244 |
10.0% |
|
Total Beds Available ('000) |
19,877 |
20,187 |
21,259 |
22,351 |
23,499 |
5.1% |
|
Kenya Bed-Night Occupancy Rate |
31.6% |
29.1% |
30.3% |
29.5% |
30.8% |
1.4% |
|
Nairobi Room Occupancy Rate |
54.0% |
53.0% |
53.0% |
49.0% |
53.0% |
4.0% |
|
Nairobi ADR (USD) |
145.2 |
142.9 |
137.0 |
125.5 |
139.3 |
11.0% |
|
Nairobi RevPAR (USD) |
77.5 |
75.9 |
72.0 |
61.2 |
73.8 |
20.6% |
|
·In Nairobi alone, we expect the ADR to increase by between 11.0% and 19.0% y/y to average at between USD 139.3 and USD 150.0, average room occupancy to increase by 4.0% points to average at 53.0% resulting in an increase in RevPAR by between 20.6% and 29.9% y/y to average at between USD 73.8 and USD 79.5 |
||||||
Source: KNBS, Cytonn Research 2018
Centum Investments Plc broke ground on Kshs 100 bn industrial park in Kilifi County named Vipingo Investment Park. The development is expected to sit on 10,254 acres of land, and will comprise of a mixed-use economic hub, industrial, commercial, residential, hospitality and institutional use. 1,150-acres of the serviced plots will be set aside for manufacturing, warehouses, logistics and commercial developments, while 200-acres for a residential estate with an affordable model dubbed Ridge Homes, which will consist of 1,200 units of one, two and three bedroom apartments priced at approximately Kshs 4.0 mn per unit. The firm is expecting to leverage from the good performance of the industrial sector, which according to our Cytonn H1'2018 Market Review, recorded 0.7% points increase in rental yields from 5.4% as at H1’2017 to 6.1% in H1’2018, attributed to an 11.8% increase in occupancy levels. Some of the major drivers of the sector include; i) the renewal of investor confidence following the conclusion of the prolonged electioneering period, and ii) increased focus by the government on manufacturing, with the sector being included among the governments Big Four Agenda of focus for the next four-years. For more details, please see our Cytonn H1'2018 Market Review.
In the retail sector, South Africa’s Massmart announced plans to open hardware outlets in Kenya. The multinational, which currently operates The Game supermarket at Garden City Mall along Thika Road, is set to open 6 new builder stores in Kenya, Mozambique and Zambia, though the exact number of outlets in each country has not been specified. The Kenyan retail sector has seen entry of other huge brands like French Retailer Carrefour, which has 5 stores and plans to open 2 new stores at Village Market and Galleria Mall, South Africa’s Shoprite, which is planning to open 7 new stores in Westgate, Garden City and 5 other undisclosed locations, and Botswana’s Choppies, which has 13 stores running and 1 planned outlet in Nanyuki Mall. We expect the expansion by retailers to lead to improved performance of the retail sector. For instance, in H1’2018, occupancy rates in malls in Nairobi increased by 0.9% points from 80.3% in FY’2017 to 81.2% resulting in a 0.1% point increase in rental yields from 9.6% in FY’2017 to 9.7% in H1’2018 according to Cytonn H1'2018 Market Review. This is as international retailers took up space in the malls, vacated by Nakumatt Holdings and Uchumi Supermarkets. We therefore have a positive outlook on the retail sector going forward, and we expect the sector to be boosted by; (i) high economic growth rates with the GDP growth rate expected to come in at 5.5% compared to the 4.7% recorded in 2017, thus leading to an increase in disposable incomes, and increasing purchasing power, (ii) Kenya’s growing position as a regional and continental hub, hence witnessing an increase in multinationals operating in the country, (iii) huge opportunity, with Kenya having a formal retail penetration of 35.0% according to Oxford Business Group, compared to markets like South Africa with a penetration of 60.0%, and (iv) the rise of e-commerce, as seen through the increased digitization of cash systems and a rise in mobile penetration at 90.4%, according to Jumia Mobile Report 2018, hence increased market coverage.
Other highlights in the sector include;
- Tuskys Supermarket is set to open a new branch in Westlands Nairobi in mid-July 2018, taking over a space initially occupied by Uchumi Supermarket. The move is part of Tusker Mattresses Group strategy to broaden its footprint in the country’s retail sector. The retailer will take over the space, previously occupied by Uchumi, which is undergoing a financial crisis as a result of poor supply chain management,
- The residential sector is expected to record increased activities following the signing of a Memorandum of Understanding that will see United States of America (USA) companies and Kenyan companies collaborate with the aim of implementing the Big 4 Agenda which include i) ensuring food security, ii) provision of affordable housing, iii) manufacturing, and iv) provision of affordable healthcare. According to the Treasury CS, Henry Rotich, the signed MOU will provide a framework where the two governments and the private sectors of the two countries will engage in business opportunities with regard to the Big 4 Agenda, however further detailed on the same are yet to be disclosed,
- Fly Tristar Airline announced plans to increase its flights from Nairobi to Mombasa, from four times a week to everyday, and also start flights from Nairobi to Malindi, and Nairobi to Ukunda. This follows a move by Silverstone Airline to increase flights between Nairobi and Kisumu, from 14 times a week to 17 times. This is driven by the increased number of guest arrivals to the Kenyan Coast and thus increased demand for accommodation. We expect increased activities in the hospitality sector, boosted by the improved security in the country, conclusion of the electioneering period and continued marketing efforts by the Kenya Tourism Board (KTB),
- PrideInn Hotels has announced plans to open a 3-star hotel in Mombasa this month. The business hotel, will have 40 rooms and conference facilities that can accommodate up to 500 people. In addition, the hotel will feature amenities such as concierge service, shuttle services, ample parking, laundry services, room service and a currency exchange bureau. The hospitality sector in Kenya continues recording increased investments due to the increased demand for accommodation and other hospitality services by both local and international guests, with the number of international arrivals have been growing by 16.7% from 1.2 mn in 2015 to 1.4 mn in 2017. Other brands that have opened new hotels in 2018 include; Hilton Hotel, City Lodge and Movenpick Hotels & Resorts. This is a clear indication of the attractiveness of the sector and thus expect continued grow driven by; (i) the improved security following the end of the electioneering period, ii) the revision of negative travel advisories, warning international citizens, e.g. from the United States against visiting Kenya, iii) positive reviews from travel advisories such as Trip Advisor who ranked Nairobi as the 3rd best place to visit in 2018, only behind Ishigaki Island in Japan and Kapaa in Hawaii, and The Travel Corporation who ranked travel to Kenya as one of the top 10 transformative travel experiences in the world, iv) improved hotel standards with the entry of global hotel brands while existing hotels refurbish their developments, v) classification of hotels into their respective hotel star ratings, as a way to improve visibility and credibility of local hotel brands and, vi) improved flight operations and systems, which will make it easier and more convenient for travelers.
Listed Real Estate
During the week, the share prices for the Fahari I- REIT declined, with the instrument closing the week at Kshs 11.0, 3.5% lower than the average price of Kshs 11.4 the previous week. Year to date the instrument has gained 4.8% from the 10.5 Kshs at the start of the year. The instrument is however trading at a 45.0% discount from its listing price of Kshs 20.8 per share. We attribute the poor performance to; i) inadequate investor knowledge ii) opacity of the exact returns from the underlying assets, iii) the negative sentiments currently engulfing the sector given the poor performance of Fahari and Fusion REIT (FRED) and iv) lack of institutional support for REITs
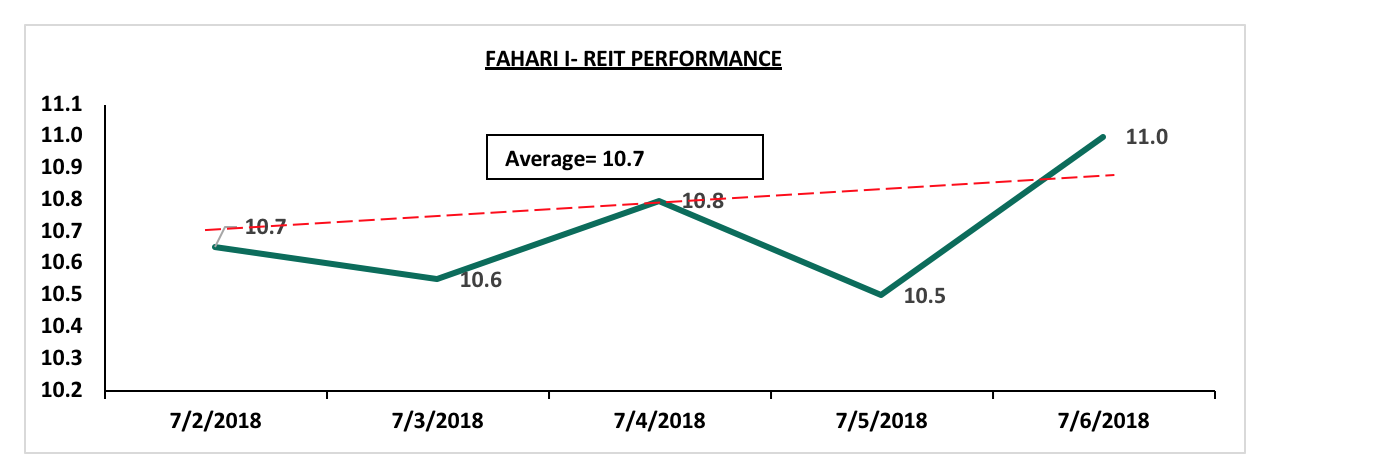
We retain a negative outlook for the listed real estate sector mainly due to market structures and poor market sentiment, and thus expect the REIT to continue trading at low prices and in low volumes.
Our outlook for the real estate sector remains positive driven by: (i) increased investor confidence in the market, (ii) positive demographic trends such as rapid urbanization that currently stands at 4.4% against a global average of 2.1%, (iii) rapid population growth rates of 2.6% against a global average of 1.2%, (iv) sustained infrastructural development, opening up areas for real estate development, and (v) a better operating environment due to political calm.
In September 2017, we released the Nairobi Metropolitan Area Residential Report 2017, which showed that residential sector performance softened in 2017, with the total returns coming in at 9.4% from 12.6% in 2016. The average rental yield was 5.6%, 0.4% points higher than the 5.2% recorded in 2016. However, average price appreciation was 3.8%, 3.6% points lower than the 7.4% recorded in 2016. The low performance was attributable to:
- A tough operating environment characterized by low credit supply, as a result of the implementation of the Banking (Amendment) Act 2015, which resulted in declining private sector credit growth from 25.8% in June 2014 to 1.7% as at September 2017, and,
- The wait and see attitude adopted by investors as a result of the prolonged electioneering period. This resulted in reduced transaction volumes and development activity with Nairobi building approvals for the period January to July 2017 declining by 18.4% in 2017 to Kshs 149.5 bn from building approvals worth Kshs 183.2 bn approved during a similar period in 2016.
This year, we update the findings of that report by looking at the residential market performance in 2017/2018. We consider the same 35 submarkets covered in 2017. We will start with an introduction to the real estate market in Kenya, an overview of the residential sector, where we will cover the factors affecting residential supply and demand; then we will cover the performance of the residential sector for the period 2017/2018, identify the investment opportunity, before concluding, as outlined below:
- Introduction to the Real Estate Sector in Kenya
- Factors Affecting Residential Demand
- Factors Affecting Residential Supply
- Market Performance
- Investment Opportunity
- Conclusion
- Introduction to the Real Estate Sector in Kenya
The real estate sector in Kenya remains an attractive asset class as a result of (i) relatively high returns that have averaged at 24.3% over the last five years, compared to an average of 13.2% for traditional asset classes, (ii) continued growth, with the real estate sector contribution to Kenya’s GDP increasing to 6.8% in Q1’2018, from the 6.1% recorded in Q1’2017, according to Kenya National Bureau of Statistics (KNBS), and (iii) low supply in some themes such as residential, which has a housing deficit of 2.0 mn units. Of key interest in the real estate sector is the residential theme, which driven by the aforementioned deficit continues to grow and has attracted government focus, with H.E. President Uhuru Kenyatta including it among the Kenyan Government Big Four Pillars of focus for 2018-2022, the others being manufacturing, universal health care and food security. As a result of the inclusion, the Kenyan Government, with the support of other key stakeholders such as the World Bank, have rolled out new initiatives aimed at driving the affordable housing initiative, key among them being:
- The Kenya Mortgage Refinancing Company; which we wrote about in our focus dated April 8, 2018. See the focus here
- The National Housing Development Fund; which we wrote about in our focus dated June 24, 2018. See the focus here
- Corporate tax rebates/cuts,
- Scrapping of NEMA and NCA levies,
- Launch of the PPP portal to enhance Public-Private Partnerships.
- Factors Affecting the Residential Demand
The residential demand in Kenya area is estimated to be 2.0 mn units, growing annually by 200,000 units, as per National Housing Corporation (NHC), World Bank, and other research institutions, against limited supply from both the government and private sector’s estimated annual delivery of 50,000 units. Thus, the sector has continued to attract interest with the main factors affecting the level of demand, as shown below:
Factors Positively Affecting Demand:
- Household Incomes: With a relatively stable economy, household incomes continue to increase further boosted by the fact that most households, especially in the middle-income class have both partners working and earning a steady income. As per the KNBS Economic Survey 2018, the number of recorded employed persons came in at 16.8 mn people in 2017, a 5.6% increase from 15.9 mn persons recorded in 2016, while average monthly wage came in at Kshs 57,008 per person in 2017, a 6.1% increase from Kshs 53,733 reported in 2016. This has resulted in increased disposable income resulting in higher demand for formal housing, and,
- Demographics: Kenya’s population has been growing at 2.6% p.a. over the last 5-years compared to a global average of 1.2%, creating demand for dwelling units. Additionally, the urbanization rate in Kenya is relatively high at 4.4%, compared to the global average of 2.1%, necessitating the need for adequate housing units in the urban areas.
Factors Negatively Affecting Demand:
- Access to Credit: Before the enactment of the Banking (Amendment) Act 2015, the average interest rate on a mortgage in 2015 stood at 18.7%, ranging between 11.9%-23.0%. This however dropped to an average of 13.5%, as at 2016, ranging between 10.5%-18.0% (CBK Bank Supervision Report 2016), due to the interest rates cap law. Despite this, the number of active mortgages dropped by 1.5% y/y in December 2016 to 24,085 from 24,458 in 2015, attributed to tight credit standards employed by banks as they prefer the less risky government securities, and thus reduced lending to the private sector, including real estate.
Of the three factors that affect demand, one is negative, that is, access to credit. However, two are positive, that is, household income and positive demographic dividend, and thus our outlook on sustained demand for residential property is positive.
- Factors Affecting Residential Supply
Development activity within the residential sector has continued on an upward trend in 2018 bolstered by increased investor appetite and the huge housing deficit. According to KNBS, the value of approved residential buildings in Nairobi between January and March 2018 came in at Kshs 36.9 bn, 8.8% higher than the Kshs 33.9 bn registered during the same period in 2017. The key factors affecting supply are below:
Factors Positively Affecting Supply:
- Government Initiatives: Owing to the huge housing deficit of 2.0 mn units, growing by 200,000 units p.a. according to NHC, the Kenyan government has put in place initiatives aimed at promoting the private sector to aid in addressing the shortage. These initiatives include the urban regeneration plan for various parts of Nairobi, and tenant purchase schemes in other counties, a 50.0% corporate tax reduction for developers of at least 100 low-cost housing units annually, and the proposal to avail public land to private developers for development under the Public-Private Partnership (PPP) structure, and,
- Infrastructural Developments: Improved infrastructural developments following the dualling of major roads such as Outer Ring Road and Ngong Road, the construction of the Standard Gauge Railway (SGR), bypasses, and electrification, have opened up new areas such as Kikuyu, Ruiru, Ruaka, and metropolitan areas such as Machakos to real estate development. This is due to ease of access. Challenges such as insufficient sewer systems, water supply and access roads in some areas, especially in satellite towns, still persist hampering supply of housing and thus necessitating the need for local government support in the real estate industry.
Factors Neutral for Supply:
- Statutory Approvals: The statutory requirements and approval procedures have been a key challenge for most developers especially due to the elongated processes and also the many fees required which ultimately add onto developer costs. However, even though inadequate, the Kenyan Government has introduced a number of measures aimed at reforming the industry such as the recently launched Sessional Paper No. 1 of 2017 National Land Use Policy (NLUP), digitization of the lands ministry and the scrapping of land title search fees, all aimed at curbing the lack of transparency and efficiency, as well as curbing poor land management.
Factors Negatively Affecting Supply:
- Land Regime: The multiple land tenure land system in Kenya and the fact that 64.0% of the land in Kenya is estimated to be communal has led to opacity in land registrations and transfers, which affects development processes,
- Access to Credit: Lack of proper funding for real estate developments has resulted in excessive debt financing, resulting in increased financing costs, especially where there are extended project time frames. The Banking (Amendment) Act 2015, which capped interest rates at 4.0% above the CBK rate, which currently stands at 9.5%, continues to impact negatively on development activity as financial institutions deprive the private sector of credit, in favor of the risk-free government securities. For instance, private sector credit growth came in at 2.1% as at April 2018, compared to a 5-year average growth of 14.0% (2013-2018), and,
- Availability and Cost of Development Class Land: Land prices in Nairobi are relatively high with an average price per acre of Kshs 222.6 mn, that is for high rise, low rise and commercial areas, compared to an average of Kshs 6.1 mn in other towns such as Kisumu and Eldoret. In satellite towns where land is relatively affordable, with an average price per acre of Kshs 17.0 mn, there is inadequate trunk infrastructure, and the developer has to provide, this ultimately leads to increased construction costs for developers amidst waning private sector credit growth.
Of the factors that affect supply, two are positive, that is government initiatives and infrastructural development, one is neutral, that is, statutory approvals, while three, that is, land regimes, access to credit and cost of development class land, are negative. Thus, our sentiments towards supply are negative due to the tough operating environment.
- Market Performance:
In 2018, we conducted market research in 35 sub-markets in Nairobi Metropolitan area to determine returns, measured by rental yields and price appreciation.
In our submarket analysis, we classified the various suburbs and satellite towns in the Nairobi Metropolitan Area into three segments:
- High-End Segment – Consists of prime suburbs in Nairobi, such as Karen, Runda and Kitisuru. Most of these areas have been zones for low rise residential developments only, and are characterized by palatial villas and bungalows on half-acre land parcels,
- Upper Middle-Income Segment – Consists of suburbs such as Kilimani, Lavington, Kileleshwa, Loresho and Ridgeways, among others. The population in these zones are middle class but with higher incomes than the average characterization of middle class. They are zones for both high rise and low-density houses, and,
- Lower Middle-Income Segment – Consists of suburbs in Nairobi habited by middle class such as Donholm, Komarock and Imara Daima as well as Satellite Towns such as Ngong, Rongai and Juja.
To note:
- Detached units refer to stand-alone houses such as townhouses, maisonettes and bungalows,
- Apartments refer to a self-contained housing unit occupying part of a building, also called flats.
In terms of overall market performance, for the period 2017/2018, the residential sector recorded total returns of 8.2%, a 1.2% points decline from the 9.4% total returns recorded in 2017; the average price appreciation was 2.8%, with an average rental yield of 5.4%. The performance is attributable to a decline in price appreciation, which dropped by 1.0% points y/y due to a sluggish growth with selected markets such as the lower middle market for detached units and upper middle markets for apartments recording big decline in price appreciation of 4.1% and 1.5%, respectively. In some sub-markets however, where there is the good infrastructure, easy access to main business nodes such as Kilimani, double-digit returns of up to 13.9% were recorded, as they continue to attract interest from investors.
The sector’s returns summary is as shown below:
|
Change in Residential Sector Performance - 2017/2018 |
|||
|
Metric |
2018 |
2017 |
Y/Y Change |
|
Annual Uptake |
23.3% |
23.6% |
(0.3% points) |
|
Capital Appreciation |
2.8% |
3.8% |
(1.0% points) |
|
Rental Yield |
5.4% |
5.6% |
(0.2% points) |
|
Total Returns |
8.2% |
9.4% |
(1.2% points) |
|
· The sector recorded subdued performance, with total returns dropping by 1.2% points to 8.2% in 2018 from 9.4% in 2017 mainly due to a decline in price appreciation, attributable to various markets softening such as the lower middle market for detached units and upper middle markets for apartments. This is as the markets receive increased supply against reduced uptake as a result of a reduction in private sector credit supply, following the implementation of the Banking Amendment Act, 2015. · Rental yields remained fairly stable declining by a marginal 0.2% points to 5.4% in 2018 from 5.6% in 2017, attributable to developers having to stabilize rents against in a bid to retain occupants |
|||
Performance by Typology
Apartments recorded the high average annual returns of 8.7%, compared to detached with 7.6% returns. This is attributable to increased demand for apartments due to a rapidly increasing population and also their affordability with apartments being 49.1% cheaper on average compared to detached units.
The performance of the residential sector for the 2017/2018 period is as summarized below:
|
(All Values in Kshs Unless Stated Otherwise) |
||||||
|
Nairobi Metropolitan Area Residential Sector Performance by Typologies 2017/2018 |
||||||
|
Typology |
Average Price Per SQM |
Average Rent Per SQM |
Average Annual Sales |
Average Rental Yield |
Y/Y Average Price Appreciation |
Total Annual Returns 2017/18 |
|
Apartments |
99,052 |
463 |
24.0% |
5.8% |
2.9% |
8.7% |
|
Detached |
140,601 |
577 |
22.6% |
4.9% |
2.7% |
7.6% |
|
Average |
119,826.7 |
519.9 |
23.3% |
5.4% |
2.8% |
8.2% |
|
· Apartments registered higher returns to investors of on average 8.7%, 0.5% points higher than the market average of 8.2%. This is attributable to high demand for high rise units, mainly due to their affordability; on average apartments are 49.1% cheaper compared to detached units |
||||||
Performance by Class
The upper middle and lower middle suburb markets for apartments recorded the highest average annual returns with 8.8%, driven by demand for apartments in these markets especially by the expanding middle-class. The lower middle market for detached posted the deepest decline in year-on-year price appreciation, by 4.1%, mainly due to increased supply in these market and also focus on affordability which has hindered price appreciation.
|
(All Values in Kshs Unless Stated Otherwise) |
|||||||||
|
Nairobi Metropolitan Area Residential Performance by Class 2017/2018 |
|||||||||
|
Segment |
Average Rental Yield (2018) |
Average Price Appreciation (2018) |
Total Returns (2018) |
Average Rental Yield (2017) |
Average Price Appreciation (2017) |
Total Returns (2017) |
Y/Y Change in Appreciation |
Y/Y Change in Rental Yield |
Y/Y Change in Total Returns |
|
Detached |
|||||||||
|
High-End |
4.7% |
3.5% |
8.3% |
5.6% |
3.9% |
9.5% |
(0.4%) |
(0.9%) |
(1.2%) |
|
Upper Middle |
5.1% |
2.4% |
7.5% |
4.9% |
2.6% |
7.5% |
(0.2%) |
0.2% |
0.0% |
|
Lower Middle |
5.0% |
2.0% |
7.0% |
5.0% |
6.1% |
11.1% |
(4.1%) |
0.0% |
(4.1%) |
|
Average |
4.9% |
2.7% |
7.6% |
5.0% |
3.9% |
8.9% |
(1.5%) |
(0.1%) |
(1.8%) |
|
Apartments |
|||||||||
|
Upper Middle |
6.0% |
2.9% |
8.9% |
6.2% |
4.3% |
10.5% |
(1.4%) |
(0.2%) |
(1.6%) |
|
Lower Middle Suburbs |
5.6% |
3.2% |
8.8% |
5.3% |
3.5% |
9.2% |
(0.3%) |
0.3% |
(0.4%) |
|
Lower Middle Satellites |
5.9% |
2.7% |
8.6% |
6.5% |
2.6% |
9.1% |
0.1% |
(0.6%) |
(0.5%) |
|
Average |
5.8% |
2.9% |
8.7% |
6.0% |
3.5% |
9.5% |
(0.6%) |
(0.2%) |
(0.9%) |
|
Grand Average |
5.4% |
2.8% |
8.2% |
5.6% |
3.8% |
9.4% |
(1.1%) |
(0.2%) |
(1.3%) |
|
· In 2018 prices increased by 2.8% on average, 1.0% points slower compared to the 3.8% recorded in 2017. This is attributable to short-term effects of last year’s electioneering period and tight access to credit which has restricted affordability for buyers and thus, asking prices have softened as developers compete to attract buyers, · The biggest decline in prices was 4.1%%, recorded in the lower middle-end sector for detached units; This is attributable sellers’ competition as investors selling old stock have had to reduce their asking prices to compete with the new affordable stock, · Lower Middle satellite towns recorded a positive change on y/y appreciation with a marginal increase of 0.1% points to 2.7%. This is as areas in these segments have a low supply of investment grade high rise properties but towns like Ruaka and Thindigua are increasingly attracting developers due to good infrastructure and high demand from young populations, · Rental yields in 2018 declined marginally by 0.2% points to 5.4%. This is attributable to increasing housing stock in the market and thus developers have had to stabilize rents in order to preserve clientele, · Upper middle market for apartments had the highest yields of 6.0% attributable to attractive rents that specific sub-markets such as Kilimani, Riverside, Westlands among others attract; while the high-end market for detached recorded the least rental yields at 4.7%, attributable to stabilized rents against high prices. |
|||||||||
Source: Cytonn Research
- Detached Units Performance
Detached units recorded subdued returns in 2018 with average total returns of 7.6%, 0.6% points lower compared to the market average of 8.2%. This is attributable to a drop in price appreciation, which declined by 1.5% points with markets such as the lower middle dropping by 4.1% points, attributable competition in the market as investors selling old stock have had to reduce their asking prices to compete with the new affordable stock; rental yields remained fairly stable dropping by 0.1% as developers stabilize their rents in order to retain occupants. The best performing sub-market was Ruiru with average returns of 11.7%, on account of i) good infrastructure, for instance, it is accessible through both the Thika Superhighway and the Eastern Bypass, and ii) relative affordability compared to other satellite towns such as Juja and Redhill.
- High-End
The high-end market comprises suburbs such as Runda, Kitisuru, Lower Kabete, Karen, and Rosslyn. In 2018, this market recorded average returns of 8.3%. The best performing market was Lower Kabete, attributable to its exclusivity, which is bound to attract more interest as more traditionally low-rise areas become densified. Rosslyn was the worst performing market recording a decline in asking prices by 1.9% on average, owing to limited options for potential investors in terms of product compared to neighbouring estates like Runda and Kitisuru, which have more new supply. However, high-end areas recorded the highest average annual uptake in the detached category with 23.1% p.a., against the detached market’s average of 22.5%, attributable to increased demand for luxury properties especially from high net-worth individuals and multinationals.
The performance of detached units in high suburbs is as summarized below;
|
(All figures in Kshs unless stated otherwise) |
||||||
|
Nairobi Metropolitan Area Detached Units Performance 2017/2018 – High-End Suburbs |
||||||
|
Location |
Average Price Per SQM |
Average Rent Per SQM |
Average Annual Sales(%) |
Average Rental Yield(%) |
Average Price Appreciation(%) |
Average Total Returns(%) |
|
Lower Kabete |
174,963 |
491 |
21.4% |
3.4% |
7.5% |
10.8% |
|
Kitisuru |
250,983 |
1,007 |
22.6% |
4.7% |
5.4% |
10.1% |
|
Karen |
194,341 |
799 |
27.7% |
4.7% |
4.0% |
8.8% |
|
Runda |
188,098 |
772 |
23.2% |
5.0% |
2.7% |
7.7% |
|
Roselyn |
164,125 |
808 |
20.8% |
5.9% |
(1.9%) |
3.9% |
|
Average |
194,502 |
776 |
23.1% |
4.7% |
3.5% |
8.3% |
|
· Lower Kabete and Kitisuru areas registered the highest returns of 10.8% and 10.1%, respectively in the high-end market. This is attributable to the exclusivity both areas offer and high land prices which leads to developers having to increase their prices in order to recoup returns · Rosslyn recorded the least returns, owing to a depreciation of asking prices by 1.9%. This is attributable to the market’s limitation in terms of what it offers investors due to inadequate land for development, and thus most investment grade stock is aged |
||||||
Source: Cytonn Research
- Upper Mid-End
The upper mid-end area comprises of areas such as Spring Valley, Lavington, Loresho, among others. The market recorded a relatively low average annual uptake of 21.7% compared to high-end areas and lower middle markets which recorded 23.1% and 22.9%, respectively. This is attributable to the continued development of high rise buildings in the upper mid-end areas which reduces the attractiveness of detached units in these markets as the suburbs no longer offer exclusivity. The area recorded average total returns of 7.5%, with Langata being the best performing node, with average total returns of 9.1%, attributable to its proximity to key business districts such as Upperhill and CBD, and a low supply of detached units, and Ridgeways was the worst performing node with total returns of 5.2% due to encroachment of apartments in and around these areas, leading to decline in value for low rise houses as the areas lose their appeal to high end buyers.
The performance is as summarized below;
|
(All figures in Kshs unless stated otherwise) |
||||||
|
Nairobi Metropolitan Area Detached Units Performance 2017/2018 - Upper Mid-End Suburbs |
||||||
|
Location |
Average Price Per SQM |
Average Rent Per SQM |
Average Annual Sales(%) |
Average Rental Yield(%) |
Average Price Appreciation(%) |
Average Total Returns(%) |
|
Langata |
129,107 |
448 |
21.6% |
4.3% |
4.7% |
9.1% |
|
Runda Mumwe |
144,346 |
687 |
24.3% |
5.8% |
2.8% |
8.7% |
|
South B/C |
131,394 |
582 |
22.3% |
4.5% |
3.5% |
8.0% |
|
Spring Valley |
167,940 |
504 |
21.2% |
4.3% |
3.5% |
7.7% |
|
Lavington |
180,498 |
658 |
16.7% |
4.4% |
3.1% |
7.5% |
|
Loresho |
150,499 |
827 |
25.0% |
6.6% |
(0.6%) |
6.0% |
|
Ridgeways |
150,422 |
822 |
20.8% |
5.5% |
(0.3%) |
5.2% |
|
Average |
150,601 |
647 |
21.7% |
5.1% |
2.4% |
7.5% |
|
· Langata had the highest returns in the upper mid end sector of 9.1% compared to the market’s average of 7.5%, and also recording the highest price appreciation in the category with 4.7%. This is attributable to its proximity to key business districts such as Upperhill, and CBD and a low supply of detached units · Ridgeways and Loresho registered a slight decline in prices by 0.3% and 0.6%, respectively. This is attributable to the encroachment of apartments in and around these areas, leading to a decline in value for low rise houses as the areas lose their appeal to high end buyers |
||||||
Source: Cytonn Research
- Lower Mid-End
Lower mid-end areas mainly comprise of areas in Nairobi’s periphery such as Athi River, Juja, and Ngong and lower mid-end suburbs such as Donholm, Komarock and Imara Daima. They recorded the lowest returns in the detached units’ category with 7.0%. This is due to selected sub-markets that have softened recording a price stagnation such as Ruai, Syokimau, and Mlolongo, amidst relatively low uptake rates at 18.8% and 20.0%, respectively, compared to the market average of 22.9%. The best performing sub-market was Ruiru with average returns of 11.7%, attributable to good infrastructure that offers easy access to areas such as CBD, and Mombasa Road, among other business nodes.
|
(All figures in Kshs unless stated otherwise) |
||||||
|
Nairobi Metropolitan Area Detached Units Performance 2017/2018 - Lower Mid-End Suburbs |
||||||
|
Location |
Average Price Per SQM |
Average Rent Per SQM |
Average Annual Sales (%) |
Average Rental Yield (%) |
Average Price Appreciation (%) |
Average Total Returns(%) |
|
Ruiru |
91,591 |
332 |
23.6% |
5.1% |
6.6% |
11.7% |
|
Kitengela |
70,558 |
309 |
22.6% |
4.8% |
6.2% |
11.0% |
|
Ruai |
49,407 |
265 |
18.8% |
6.6% |
0.0% |
6.6% |
|
Donholm & Komarock |
86,198 |
367 |
22.8% |
5.2% |
1.1% |
6.3% |
|
Rongai |
80,145 |
305 |
23.8% |
4.6% |
4.1% |
8.7% |
|
Juja |
81,844 |
277 |
23.3% |
5.1% |
1.1% |
6.1% |
|
Redhill |
89,979 |
327 |
19.2% |
4.2% |
1.6% |
5.8% |
|
Syokimau/Mlolongo |
73,333 |
340 |
20.0% |
5.7% |
0.0% |
5.7% |
|
Athi River |
91,948 |
295 |
22.6% |
3.7% |
2.4% |
6.2% |
|
Thika |
67,875 |
326 |
22.3% |
4.7% |
0.3% |
5.1% |
|
Ngong |
65,125 |
247 |
23.4% |
4.5% |
2.1% |
6.6% |
|
Imara Daima |
72,417 |
318 |
26.9% |
5.1% |
(1.0%) |
4.2% |
|
Average |
76,702 |
309 |
22.9% |
5.0% |
2.0% |
7.0% |
|
· Ruiru had the highest returns at 11.7%. The area has been performing well as a result of i) good infrastructure, for instance, it is accessible through both the Thika Superhighway and the Eastern bypass, ii) relative affordability – absolute prices are cheaper in Ruiru with an average of Kshs 16.4 mn for a typical detached unit compared to areas like Juja and Redhill where the same would go for an average of Kshs 17.1 mn and Kshs 18.6 mn, respectively · Imara Daima registered the least returns of 4.2%, compared to a market average of 7.0%, attributable to the outdated status of detached properties in the area which is predominantly a high rise area |
||||||
Source: Cytonn Research
- Apartment Performance
Apartments recorded relatively high returns with an average of 8.7%, 0.5% points higher compared to the market’s average of 8.2%. This is as apartments are more affordable compared to detached units, with 49.1% on average. Upper mid-end and lower middle suburb markets recorded the highest average annual returns at 8.8%, with selected markets such as Kilimani, Upper Kabete, Thindigua, Ruaka and South B/C recording double-digit average returns of 13.9%, 11.9%, 11.2%, 11.1% and 10.1%, respectively. These markets are boosted by good infrastructure, and good locations in relation to places where people work such as CBD, Upperhill, Westlands, thus attracting demand.
- Upper Mid-End
The upper mid-end market comprises of areas such as Kilimani, Westlands, Spring Valley and Riverside. The market recorded relatively high annual uptake at 24.2%, driven by continued demand from the expanding middle class. The best performing sub-market was Kilimani with average total returns of 13.9%. This is as the area benefits from its location in proximity to key business districts such as CBD, and Upperhill as well as easy access to other key nodes such as Westlands, and also its vast supply of amenities, which has continued to create demand from investors, and especially from the growing middle-income class. Parklands recorded the lowest returns with 5.9% compared to the market average of 8.9%, attributable to the growing supply of apartments in the area thus creating competition among developers in a bid to attract buyers, hence the negative price appreciation of 1.3%.
|
(All figures in Kshs unless stated otherwise) |
||||||
|
Nairobi Metropolitan Area Apartments Performance 2017/2018 - Upper Mid-End Performance |
||||||
|
Location |
Average Price Per SQM |
Average Rent Per SQM |
Average Annual Sales (%) |
Average Rental Yield(%) |
Average Price Appreciation(%) |
Average Total Returns(%) |
|
Kilimani |
131,594 |
621 |
25.6% |
6.1% |
7.8% |
13.9% |
|
Riverside |
121,295 |
508 |
21.7% |
5.4% |
3.8% |
9.3% |
|
Spring Valley |
144,169 |
647 |
24.1% |
5.9% |
3.1% |
9.0% |
|
Loresho |
109,426 |
558 |
23.2% |
6.0% |
2.7% |
8.7% |
|
Upperhill |
141,905 |
593 |
23.7% |
5.2% |
3.4% |
8.6% |
|
Westlands |
132,128 |
636 |
26.1% |
6.0% |
2.3% |
8.3% |
|
Kileleshwa |
124,549 |
629 |
23.6% |
6.0% |
1.0% |
7.0% |
|
Parklands |
113,908 |
641 |
25.8% |
7.3% |
(1.3%) |
5.9% |
|
Average |
127,372 |
604 |
24.2% |
6.0% |
2.9% |
8.9% |
|
· Kilimani area has the highest returns at 13.9% owing to its proximity to key business districts and nodes such as CBD, Upperhill, and Westlands, and also its vast supply of social amenities such as neighborhood malls and good infrastructure and incoming infrastructure such as the upgrade of Ngong Road, · Parklands had the lowest returns averaging at 5.9% compared to a market average of 8.8%, due to a decline in asking prices by 1.3%. This is attributable to an increase in supply of apartments as investors move out of Westlands which is increasingly being commercialized |
||||||
Source: Cytonn Research
- Lower Mid-End Suburbs
The lower mid-end suburbs comprise of areas such as South C, estates along Ngong Road such as Race Course, Thome, and Langata, among others. This market has relatively high annual uptake at 24.1%, with areas such as Upper Kabete recording 27.4% average annual uptake, especially due to the fact that most of the estates are located along major routes such as Waiyaki Way, Ngong Road and Thika Superhighway, hence demand from young people and the working population in general. The best performing sub-market was Upper Kabete, driven by its location along Waiyaki Way, and low supply of investment grade apartments against increased demand from emerging middle-income earners, and also its proximity to the upscale neighbourhoods such as Riverside, Loresho, and Westlands. The sub-market with least returns was Langata with 5.6%, compared to the market average of 8.8%, attributable to a low price appreciation which came in at 0.3% on average, compared to the market average of 3.2%, attributable to competition from areas such as South B and C.
|
(All figures in Kshs unless stated otherwise) |
||||||
|
Nairobi Metropolitan Area Apartments Performance 2017/2018 - Lower Mid-End Suburbs |
||||||
|
Location |
Average Price Per SQM |
Average Rent Per SQM |
Average Annual Sales(%) |
Average Rental Yield(%) |
Average Price Appreciation(%) |
Average Total Returns(%) |
|
Upper Kabete |
86,344 |
429 |
27.4% |
6.3% |
5.6% |
11.9% |
|
South B & C |
107,819 |
510 |
26.5% |
5.7% |
4.4% |
10.1% |
|
Donholm & Komarock |
75,072 |
374 |
20.3% |
6.0% |
3.9% |
9.9% |
|
Ngong Road |
99,630 |
453 |
25.6% |
5.9% |
4.0% |
9.9% |
|
Imara Daima |
74,232 |
381 |
26.2% |
6.3% |
3.0% |
9.4% |
|
Kahawa West |
82,166 |
416 |
22.9% |
6.2% |
1.8% |
8.1% |
|
Dagoretti |
98,038 |
482 |
22.5% |
6.2% |
1.7% |
7.8% |
|
Thome |
124,554 |
297 |
22.3% |
2.8% |
3.9% |
6.7% |
|
Langata |
107,374 |
462 |
23.2% |
5.3% |
0.3% |
5.6% |
|
Average |
95,025 |
423 |
24.1% |
5.6% |
3.2% |
8.8% |
|
· Upper Kabete recorded the best returns in the lower middle-end sector for suburbs with 11.9%. This is due to its proximity to Waiyaki Way which offers good access to business nodes such as Westlands, and the CBD, thus, attracting demand especially from the young and working populations · Langata has the lowest returns with total returns of on average 5.6% due to a slow y/y price appreciation indicating low demand from investors due to competition from areas such as South B and C |
||||||
Source: Cytonn Research
- Lower Mid-End Satellite Towns
The lower mid-end satellite towns comprise of areas located in counties bordering Nairobi and within a 40-km radius of Nairobi’s CBD; they include Juja, Athi River, Rongai, Ruiru, and Kikuyu. The market recorded relatively high annual uptake of 23.7%, albeit a relatively subdued average annual price appreciation of 2.7%, compared to other high rise markets. Total returns came in at 8.6% with Thindigua and Ruaka recording the highest average returns of 11.2% and 11.1%, respectively. The areas benefit from close proximity to high-end neighbourhoods such as Runda and Rosslyn, as well as close proximity to amenities such as Two Rivers. Juja recorded the lowest returns with 6.1%, attributable to a stagnation of prices as apartments in the area are mostly attractive to students thus buyers in that market prefer detached units.
|
(All figures in Kshs unless stated otherwise) |
||||||
|
Nairobi Metropolitan Area Apartments Performance 2017/2018- Lower Mid-End Satellite Towns |
||||||
|
Location |
Average of Price Per SQM |
Average of Rent per SQM |
Average of Annual Sales 2018(%) |
Average of Rental Yield 2018(%) |
Average of Price Appreciation 2018(%) |
Average of Total Return 2018(%) |
|
Thindigua |
92,603 |
454 |
28.2% |
5.9% |
5.3% |
11.2% |
|
Ruaka |
101,163 |
440 |
25.6% |
5.3% |
5.8% |
11.1% |
|
Ruiru |
89,918 |
469 |
20.6% |
6.3% |
3.7% |
9.9% |
|
Athi River |
63,395 |
351 |
25.4% |
6.3% |
2.4% |
8.7% |
|
Rongai |
70,983 |
338 |
23.7% |
5.9% |
2.8% |
8.7% |
|
Lower Kabete |
86,026 |
415 |
24.3% |
5.8% |
2.6% |
8.4% |
|
Kitengela |
67,018 |
327 |
19.4% |
6.4% |
1.8% |
8.2% |
|
Kikuyu |
76,046 |
336 |
22.3% |
5.3% |
2.7% |
8.1% |
|
Syokimau/Mlolongo |
75,313 |
299 |
22.0% |
5.0% |
1.8% |
6.8% |
|
Thika |
49,155 |
284 |
25.0% |
6.1% |
0.3% |
6.4% |
|
Juja |
50,728 |
259 |
23.7% |
6.1% |
0.0% |
6.1% |
|
Average |
74,759 |
361 |
23.7% |
5.9% |
2.7% |
8.6% |
|
· Thindigua and Ruaka recorded the best returns driven by relatively high y/y price appreciation of 5.3% and 5.8%, respectively, compared to the market average of 2.7%. Both areas benefit from proximity to high-end neighborhoods such as Runda and Rosslyn, thus attracting investors, · Apartments in Juja recorded the lowest returns, with total returns of 6.1% on average. This is due to the high student population in the area who take up the apartment, thus buyers in the area are more attracted to detached units |
||||||
Source: Cytonn Research
- Investment Opportunity
To gauge the investment opportunity, we look at key metrics that are considered when investing in real estate as follows:
- Weighted Annual Uptake: Refers to how fast developments sell on average, the higher/ faster the sales rate, the higher the points allotted. This was derived by getting the difference between 2018 and 2017 absolute uptake,
- Average Returns: This is the sum of the rental yield and price appreciation for each suburb. The higher the return the more points allotted,
- Amenities: Areas with a regional mall among other social amenities such as recreational and entertainment amenities, healthcare and education facilities among others, scored higher points while areas that lacked these amenities scored low,
- Distance from Main Business Nodes: This is to establish the commute distance for the majority of the working population, where we assumed Nairobi Central Business District as the common node. Using the farthest town as our guide, areas in close proximity to Nairobi CBD/ a radius of 14 km, scored high,
- State of Infrastructure: Here we looked at elements of infrastructure that affect real estate heavily, that is, roads and sewer systems. For the purpose of the ranking, the following factors have been used to rank the state of the infrastructure in the various areas;
- Good-Access mainly through tarmac Roads and main sewer,
- Average- Access mainly through tarmac roads but not main sewer,
- Poor- Access mainly through earth roads and not main sewer.
We allotted the highest weighting to uptake, and average returns at 30.0% and 35.0%, respectively. This is because for the investors these are the most important factors to consider when investing in an area. The lowest weighting was allotted to distance from main business node and amenities at 5.0%. This is as these factors are catered for in the pricing while for infrastructure (incoming and existing), we allocated 15.0% as it is what attracts both developers and buyers;
The points are allocated as shown below, with 3 being the highest for each metric and 1 being the lowest:
|
Residential Market Opportunity |
|||
|
Weighted Annual Uptake (WAU) |
<0.2% |
0.2%-0.4% |
>0.4% |
|
Points |
1 |
2 |
3 |
|
Average Returns |
<5% |
5-10% |
>10% |
|
Points |
1 |
2 |
3 |
|
Availability of Amenities |
Low (supermarket) |
Average (Neighbourhood Community + Social Amenities) |
High (Regional Mall, Social Amenities) |
|
Points |
1 |
2 |
3 |
|
Infrastructure |
Poor |
Average |
Good |
|
Points |
1 |
2 |
3 |
|
Distance from Main Business Nodes |
>28 km |
15km-28km |
Within 14km radius of NRB CBD |
|
Points |
1 |
2 |
3 |
Based on the above, the best places to invest in for apartment units are Kilimani and Westlands driven by the presence of amenities and good status of existing and incoming infrastructure such as revamping of Ngong Road and Waiyaki Way.
|
Nairobi Metropolitan Area Investment Opportunity -Top 5 Areas to Invest for Apartments |
||||||||
|
Location |
Distance from Main Business Node |
Amenities |
Infrastructure |
Weighted Annual Uptake |
Returns |
Availability of Development Land |
Total Points |
Rank |
|
Kilimani |
3.0 |
3.5 |
3.5 |
2.0 |
3.0 |
2.0 |
2.7 |
1 |
|
Westlands |
3.0 |
3.5 |
3.5 |
3.0 |
2.0 |
1.0 |
2.6 |
2 |
|
Thindigua |
3.0 |
2.0 |
2.0 |
2.0 |
3.0 |
2.0 |
2.4 |
3 |
|
Ruaka |
2.0 |
2.0 |
2.0 |
2.0 |
3.0 |
2.0 |
2.4 |
4 |
|
Upper Kabete |
3.0 |
2.0 |
2.0 |
2.0 |
3.0 |
1.0 |
2.3 |
5 |
|
South B & C |
3.0 |
2.0 |
2.0 |
2.0 |
3.0 |
1.0 |
2.3 |
5 |
|
· Kilimani and Westlands are the best areas to invest in due to their location in proximity to the CBD, the areas also have good infrastructure in terms of status of roads and connection to sewer main, and a vast supply of amenities and hence are attractive to home buyers. However, land for development is scarce in these areas which imply land prices are high, thus costly for developers to invest in them |
||||||||
Source: Cytonn Research
For detached units, the best areas to invest in are Karen and Runda Mumwe driven by the high rate of uptake at 27.7% and 24.3%, respectively, and availability of development land, making it affordable for developers to invest in these areas.
|
Nairobi Metropolitan Area Investment Opportunity- Top 5 Areas to Invest for Detached Units |
||||||||
|
Location |
Distance from main Business Node |
Amenities |
Infrastructure |
Weighted Annual Uptake |
Average Returns |
Availability of Development Land |
Total Points |
Rank |
|
Karen |
3.0 |
3.0 |
2.0 |
3.0 |
2.0 |
3.0 |
2.6 |
1 |
|
Runda Mumwe |
3.0 |
2.0 |
1.5 |
2.0 |
2.0 |
3.0 |
2.2 |
2 |
|
Ruiru |
1.0 |
2.0 |
2.0 |
2.0 |
2.0 |
3.0 |
2.1 |
3 |
|
South B/C |
3.0 |
1.0 |
1.0 |
3.0 |
2.0 |
1.0 |
2.1 |
4 |
|
Kitisuru |
3.0 |
1.0 |
2.0 |
1.0 |
3.0 |
2.0 |
2.1 |
4 |
|
· Karen and Runda Mumwe are the best areas to invest in for detached. Their viability is boosted by (i) the availability of development land, and (ii) location in close proximity to the CBD. However, the areas lack in good quality infrastructure with most served by earth roads, which is costly for developers to cater for |
||||||||
Source: Cytonn Research
- Conclusion
We expect the fundamental factors supporting the residential sector such as (i) constant demand for residential report driven by a deficit of affordable homes for the growing population and luxury properties for the growing number of wealthy individuals in Kenya and incoming multinationals, (ii) a stable macroeconomic environment that has averaged at 5.3% over the last 5 years, and (iii) continued infrastructural improvements, to remain strong thus sustaining the performance of the sector. However, the key challenges remain the high land costs, high construction and infrastructural costs, and access to financing hindering provision of affordable housing.The table below shows a summary of the residential performance:
|
Residential Report 2017/2018 Conclusion |
||||
|
Measure |
2017 Sentiment |
2018 Sentiment |
2017 Outlook |
2018 Outlook |
|
Demand |
|
|
Positive |
Positive |
|
Credit |
|
|
Negative |
Neutral |
|
Infrastructure |
|
|
Positive |
Positive |
|
Performance |
|
|
Neutral |
Neutral |
For the key metrics that have been used to determine the performance of the sector, two are positive, that is, demand and infrastructure; and two are neutral, that is, access to developer and end buyer credit, as well as the performance of the sector in terms of total returns, thus we have a positive outlook for the sector. Theresidential sector’s returns have been subdued over the last one year, partly attributable to the tightened access to end buyer financing against an increasing cost of living and the short to medium term effect of the protracted electioneering period. However, we remain bullish on the performance of the sector driven by (i) Increased demand for residential property, (ii) continued interest from global investors, (iii) government initiatives, and (iv) innovative financing solutions aimed at enhancing off take and developer financing challenges.
See the full report.
Disclaimer:The views expressed in this publication are those of the writers where particulars are not warranted. This publication, which is in compliance with Section 2 of the Capital Markets Authority Act Cap 485A, is meant for general information only and is not a warranty, representation, advice or solicitation of any nature. Readers are advised in all circumstances to seek the advice of a registered investment advisor.

- Talk to us
- Kenya
- P.O Box 20695 - 00200, Nairobi, Kenya
- Cell +254709101200
- Tel +254709101200
- WhatsApp +254741676635
- United States
- +254709101200
- DOWNLOAD OUR APP
-


- Kenya
- 8th Floor, Pinetree Plaza, Kaburu Drive, Ngong Road, Nairobi, Kenya
- USA
- Suite 1150, 1775 Eye Street NW, USA, Washington DC 20006, USA
- Investments
- High Yield
- Private Equity
- Real Estate
- Real Estate
- RiverRun Estates
- Cytonn Towers
- The Ridge
- Taraji Heights
- The Alma