Unit Trust Funds Performance, FY’2021, & Cytonn Monthly – April 2022
By Cytonn Research, May 1, 2022
Executive Summary
Fixed Income
During the month of April, T-bills remained undersubscribed, with the overall subscription rate coming in at 59.4%, a decline from the 90.7% recorded in March 2022. The decline in the subscription rate was partly attributable to the concurrent government bond issues during the month, with the higher 15-year tenor bond FXD1/2022/15, whose sale period closed on 19th April 2022, recording an oversubscription of 108.5%, as investors preferred the higher 13.9% yield on offer. The overall subscription rates for the 91-day, 182-day and 364-day papers declined to 105.5%, 46.7% and 53.6%, from 121.5%, 76.2% and 92.8%, respectively, recorded in March 2022. The average yields on the 364-day, 182-day and 91-day papers increased by 2.5 bps, 17.9 bps and 12.3 bps to 9.7%, 8.3% and 7.4%, respectively. In the primary bond market, the government issued a new ten-year and re-opened a twenty-five year bond, FXD1/2022/10 and FXD1/2021/25 respectively, for the month of May, in a bid to raise Kshs 60.0 bn for budgetary support. The period of sale for the issue runs from 28th April 2022 to 10th May 2022;
The y/y inflation for the month of April 2022 increased to 6.5%, from the 5.6% recorded in March with Food and non-alcoholic beverages index having had the greatest increase both year-on-year (12.2%) and month-on-month (3.0%) mainly due to increased cost of production. Additionally, the International Monetary Fund (IMF) announced that it had reached a staff level agreement with the Kenyan authorities that will allow Kenya to access a loan of USD 244.0 mn (Kshs 28.2 bn) once the review is formally completed;
Equities
During the month of April, the equities market was on a downward trajectory, with NASI, NSE 20 and NSE 25 declining by 3.6%, 2.5% and 5.1%, respectively. The equities market performance was driven by losses recorded by large cap stocks such as ABSA, KCB Group, BAT Kenya and Standard Chartered Bank Kenya (SCBK) of 19.8%, 15.0%, 12.6% and 10.6%, respectively. The losses were however mitigated by gains recorded by stocks such as Bamburi and NCBA Group of 3.6% and 0.6%, respectively;
During the month, Britam Holdings (the parent company), and Britam Life Assurance (subsidiary), jointly announced that the two firms are in the final stages of executing the sale agreement to sell their combined stake of 6.7% in Equity Group Holdings to the International Finance Corporation (IFC) and the IFC Financial Institutions Growth (FIG) Fund. Additionally, during the month, Equity Group Holdings Plc, announced that it has injected USD 100 mn (Kshs 11.5 bn) to its subsidiary in the Democratic Republic of Congo (DRC), Equity BCDC, in an aim to fund development projects as well as large manufacturing and mining companies in DRC;
Real Estate
During the month of April, the Cabinet Secretary for the National Treasury presented the FY’2022/23 Budget Statement, highlighting that infrastructure, housing and tourism sectors were allocated Kshs 212.5 bn, Kshs 27.7 bn and Kshs 15.8 bn, respectively, representing 6.4%, 0.8% and 0.4% of the Kshs 3.3 tn total budget, respectively. In the retail sector, QuickMart supermarket, a local retail chain, opened a new outlet at Tuskys Mall (T-mall) located along Lang’ata road, taking up prime retail space previously occupied by Tuskys Supermarket. In the hospitality sector, Hilton Hotel, an international hotel chain, announced plans to shut down its Nairobi Central Business District (CBD) operations indefinitely from 31st December 2022. For Mixed Use Developments, Sheria Savings and Credit Cooperative Society (SACCO) announced plans to build a Mixed Use Development tower in Nairobi’s Upper Hill Matumbato Close, at a cost of Kshs 3.3 bn by December 2025. For listed Real Estate, ILAM Fahari I-REIT closed the month trading at an average price of Kshs 6.0 per share;
Focus of the Week
Following the release of the Capital Markets Authority (CMA) Quarterly Statistical Bulletin – Q1’2022, we examine the performance of Unit Trust Funds. During the period of review, Unit Trusts’ Assets under Management grew by 28.6% to Kshs 134.7 bn as at the end of FY’2021, from Kshs 104.7 bn recorded in FY’2020. Additionally, as at the end of FY’2021, there were 29 approved Collective Investment Schemes, up from 23 at the end of FY’2020;
Investment Updates:
- Weekly Rates:
- Cytonn Money Market Fund closed the week at a yield of 10.54%. To invest, dial *809#;
- Cytonn High Yield Fund closed the week at a yield of 13.97% p.a. To invest, email us at sales@cytonn.com and to withdraw the interest, dial *809#;
- Stellah Swakei, an Investments and Research Analyst, moderated a panel on Twitter Spaces to discuss “The Status of Kenya’s Public Debt”. The panel included Willis Nalwenge, the Lead Analyst at Kingdom Securities Ltd, Elizabeth Nkukuu, CFA and Justin Mwangi, a Senior Investments Analyst at Cytonn Investments. Listen to the conversation here,
- We continue to offer Wealth Management Training every Thursday and every third Saturday of the month, from 9:00 am to 11:00 am, through our Cytonn Foundation. The training aims to grow financial literacy among the general public. To register for any of our Wealth Management Trainings, click here;
- If interested in our Private Wealth Management Training for your employees or investment group, please get in touch with us through wmt@cytonn.com;
- Any CHYS and CPN investors still looking to convert through assignment of debt are welcome to consider one of the five projects currently available for assignment, click here for the latest term sheet;
- Cytonn Insurance Agency acts as an intermediary for those looking to secure their assets and loved ones’ future through insurance namely; Motor, Medical, Life, Property, WIBA, Credit and Fire and Burglary insurance covers. For assistance, get in touch with us through insuranceagency@cytonn.com;
- Cytonnaire Savings and Credit Co-operative Society Limited (SACCO) provides a savings and investments avenue to help you in your financial planning journey. To enjoy competitive investment returns, kindly get in touch with us through clientservices@cytonn.com;
Real Estate Updates:
- For an exclusive tour of Cytonn’s Real Estate developments, visit: Sharp Investor's Tour, and for more information, email us at sales@cytonn.com;
- Phase 3 of The Alma is now ready for occupation. To rent please email properties@cytonn.com;
- We have 8 investment-ready projects, offering attractive development and buyer targeted returns; See further details here: Summary of Investment-ready Projects;
- For recent news about the group, see our news section here;
Hospitality Updates:
- We currently have promotions for Staycations. Visit com/offers for details or email us at sales@cysuites.com;
Money Markets, T-Bills & T-Bonds Primary Auction:
During the month of April, T-bills remained undersubscribed, with the overall subscription rate coming in at 59.4%, a decline from the 90.7% recorded in March 2022. The decline in the subscription rate was partly attributable to the concurrent government bond issues during the month, with the higher 15 –year tenor bond FXD1/2022/15, whose sale period closed on 19th April 2022, recording an oversubscription of 108.5%, as investors preferred the higher 13.9% yield on offer. The overall subscription rates for the 91-day, 182-day and 364-day papers declined to 105.5%, 46.7% and 53.6%, from 121.5%, 76.2% and 92.8%, respectively, recorded in March 2022. The average yields on the 364-day, 182-day and 91-day papers increased by 2.5 bps, 17.9 bps and 12.3 bps to 9.7%, 8.3% and 7.4%, respectively. For the month of April, the government accepted a total of Kshs 56.8 bn out of the Kshs 57.0 bn worth of bids received, translating to a 99.7% acceptance rate.
During the week, T-bills were oversubscribed, with the overall subscription rate coming in at 117.8%, up from the 98.9% recorded the previous week. The oversubscription is partly attributable to the rising yields on the government papers, pointing towards higher returns for investors. The 91-day paper recorded the highest subscription rate, receiving bids worth Kshs 10.2 bn against the offered Kshs 4.0 bn, translating to a subscription rate of 254.6%, an increase from the 204.5% recorded the previous week partly attributable to the higher return on a risk-adjusted basis. The subscription rate for the 364-day paper increased to 93.9% from 65.4% recorded the previous week, while that of the 182-day paper declined to 87.0%, from 90.2% recorded last week. The yields on the government papers were on an upward trajectory, with the yields on the 364-day, 182-day and the 91-day papers increasing by 2.1 bps, 8.5 bps and 4.9 bps to 9.8%, 8.5% and 7.5%, respectively. The government accepted bids worth Kshs 28.2 bn, out of the Kshs 28.3 bn worth of bids received, translating to an acceptance rate of 99.6%.
During the month, the government released the auction results for the April bond issues; FXD1/2022/03 and FXD1/2022/15, which recorded a total undersubscription of 95.1%. The undersubscription was partly attributable to the tightened liquidity in the money market during the period of issue. Investors preferred the longer dated bond, FXD1/2022/15, which recorded an oversubscription of 108.5%, in anticipation of a higher yield. The fifteen-year bond’s weighted average accepted yield and coupon rate was 13.9%. The government was keen on maintaining low rates and thus accepted only Kshs 60.8 bn of the Kshs 66.6 bn worth of bids received, translating to an acceptance rate of 91.3% on aggregate. The table below provides more details on the bond issued during the month:
|
Issue Date |
Bond Auctioned |
Tenor to Maturity (Years) |
Coupon |
Amount offered (Kshs bn) |
Actual Amount Raised (Kshs bn) |
Total bids received |
Average Accepted Yield |
Subscription Rate |
Acceptance Rate |
|
11-Apr-2022 |
FXD1/2022/03 |
3.0 |
11.8% |
40.0 |
33.1 |
34.0 |
11.8% |
85.1% |
97.3% |
|
FXD1/2022/15 |
15.0 |
13.9% |
30.0 |
27.6 |
32.5 |
13.9% |
108.5% |
84.9% |
|
|
April 2022 Average |
9.0 |
12.9% |
35.0 |
30.4 |
33.3 |
12.9% |
96.8% |
91.1% |
|
|
March 2022 Average |
13.9 |
12.7% |
40.8 |
21.2 |
32.9 |
13.2% |
80.5% |
70.5% |
|
For the month of May 2022, the government issued a new ten-year and re-opened a twenty-five year bond, FXD1/2022/10 and FXD1/2021/25, with tenors to maturity of 10.0 years and 24.1 years, respectively, in a bid to raise Kshs 60.0 bn for budgetary support. The period of sale for the issue runs from 28th April 2022 to 10th May 2022. The coupon rate for FXD1/2022/10 is market determined while that of FXD1/2021/25 is 13.9%. We expect investors to prefer the longer dated paper, FXD1/2021/25, in search of higher yields. FXD1/2021/25 is currently trading in the secondary market at a yield of 13.9%, and as such, our recommended bidding range is 13.7%-14.1% for FXD1/2021/25 and 13.1%-13.5% for FXD1/2022/10, the range at which bonds of a similar tenor are trading at.
Secondary Bond Market:
In the month of April 2022, the yields on government securities in the secondary market remained relatively stable, with the FTSE NSE bond index declining marginally by 0.2% to close the month at Kshs 94.8, from Kshs 95.0 recorded in March 2022, bringing the YTD performance to a decline of 1.3%. The chart below shows the yield curve movement during the period:
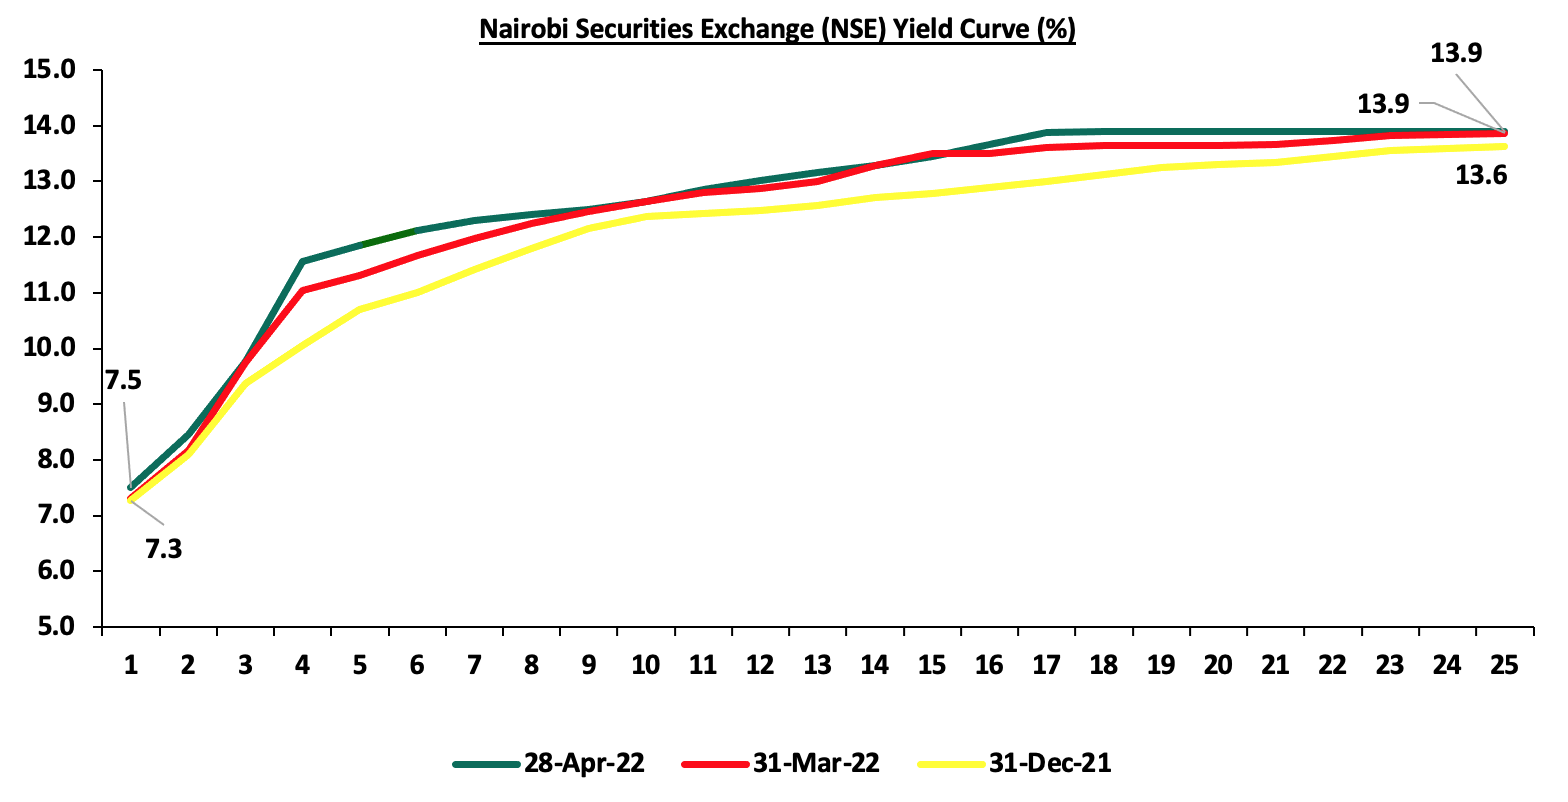
The secondary bond turnover declined by 18.1% to Kshs 70.9 bn, from Kshs 86.5 bn recorded in March 2022, pointing towards decreased activity by commercial banks in the secondary bonds market. On a year on year basis, the bonds turnover increased by 24.7% to Kshs 919.8 bn, from Kshs 737.6 bn worth of treasury bonds transacted over a similar period last year.
Money Market Performance
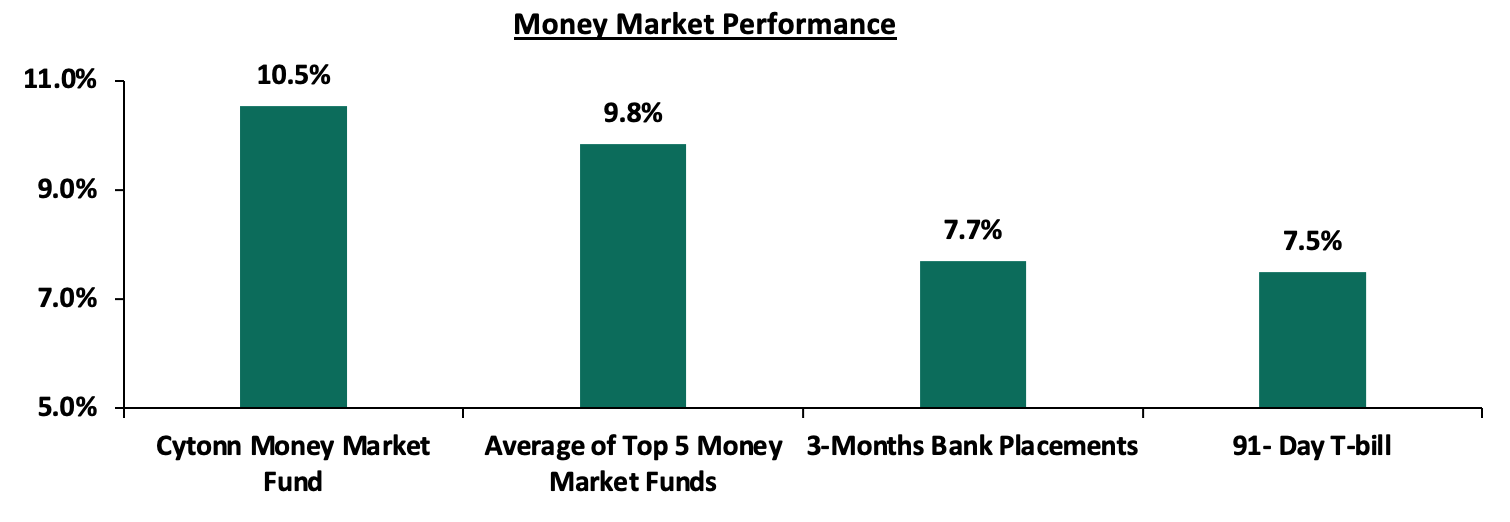
In the money markets, 3-month bank placements ended the week at 7.7% (based on what we have been offered by various banks), while the yield on the 91-day T-bill increased by 4.9 bps to 7.5%. The average yield of the Top 5 Money Market Funds remained relatively unchanged at 9.8%, as recorded the previous week while the yield on the Cytonn Money Market Fund decreased marginally by 0.1% points to 10.5%, from 10.6% recorded the previous week.
The table below shows the Money Market Fund Yields for Kenyan Fund Managers as published on 28th April 2022:
|
Money Market Fund Yield for Fund Managers as published on 28th April 2022 |
||
|
Rank |
Fund Manager |
Effective Annual Rate |
|
1 |
Cytonn Money Market Fund |
10.5% |
|
2 |
Zimele Money Market Fund |
9.9% |
|
3 |
Nabo Africa Money Market Fund |
9.8% |
|
4 |
Sanlam Money Market Fund |
9.6% |
|
5 |
Dry Associates Money Market Fund |
9.4% |
|
6 |
Madison Money Market Fund |
9.4% |
|
7 |
Apollo Money Market Fund |
9.3% |
|
8 |
CIC Money Market Fund |
9.1% |
|
9 |
ICEA Lion Money Market Fund |
8.6% |
|
10 |
Co-op Money Market Fund |
8.6% |
|
11 |
GenCap Hela Imara Money Market Fund |
8.5% |
|
12 |
NCBA Money Market Fund |
8.4% |
|
13 |
Orient Kasha Money Market Fund |
8.4% |
|
14 |
AA Kenya Shillings Fund |
7.8% |
|
15 |
Old Mutual Money Market Fund |
7.5% |
|
16 |
British-American Money Market Fund |
7.2% |
Source: Business Daily
Liquidity:
Liquidity in the money markets remained stable in the month of April 2022, with the average interbank rate remaining relatively unchanged at 4.7%, as recorded in March 2022. During the week, liquidity in the money markets tightened, with the average interbank rate increasing to 4.8%, from 4.6%, as recorded the previous week, partly attributable to tax remittances which offset government payments. The average interbank volumes traded declined by 34.9% to Kshs 17.0 bn, from Kshs 26.2 bn recorded the previous week.
Kenya Eurobonds:
During the month, the yields on the Eurobonds were on an upward trajectory partly attributable to investors attaching higher risk premium on the country due to perceived higher risks arising from increasing inflationary pressures and local currency depreciation. The yield on the 30-year Eurobond issued in 2018 increased by 1.2% points to 10.7% from 9.5%, recorded in March 2022 while the yields on the 10-year Eurobonds issued in 2014 and 2018 gained by 1.9% points and 1.7% points to 8.6% and 9.8%, from 6.7% and 8.1%, respectively. Similarly, yields on the 7-year bond issued in 2019 increased by 2.1% points to 10.2%, from 8.1% while the yields on the 12-year Eurobonds issued in 2019 and the 12-year Eurobond issued in 2021, both increased by 1.5% points, to 10.1% and 9.8%, from 8.6% and 8.3%, respectively, recorded in March 2022.
During the week, the yields on Eurobonds were also on an upward trajectory, with the yields on the 10-year Eurobonds issued in 2014 and 2018 increased by 0.9% and 0.6% points to 8.6% and 9.8%, from 7.7% and 9.2%, respectively. The 30-year Eurobond issued in 2018 and the 7-year bond issued in 2019, increased by 0.3% points and 0.8% points to 10.7% and 10.2%, from 10.4% and 9.4%, respectively. Similarly, the 12-year Eurobonds issued in 2019 and 2021 increased by 0.4% points and 0.5% points to 10.1% and 9.8%, from 9.7% and 9.3%, respectively:
|
Kenya Eurobond Performance |
||||||
|
|
2014 |
2018 |
2019 |
2021 |
||
|
Date |
10-year issue |
10-year issue |
30-year issue |
7-year issue |
12-year issue |
12-year issue |
|
3-Jan-22 |
4.4% |
8.1% |
8.1% |
5.6% |
6.7% |
6.6% |
|
31-Mar-22 |
6.7% |
8.1% |
9.5% |
8.1% |
8.6% |
8.3% |
|
22-Apr-22 |
7.7% |
9.2% |
10.4% |
9.4% |
9.7% |
9.3% |
|
25-Apr-22 |
9.3% |
9.9% |
10.8% |
10.3% |
10.3% |
9.9% |
|
26-Apr-22 |
8.4% |
9.8% |
10.7% |
9.9% |
10.0% |
9.7% |
|
27-Apr-22 |
8.6% |
9.8% |
10.7% |
10.2% |
10.1% |
9.8% |
|
Weekly Change |
0.9% |
0.6% |
0.3% |
0.8% |
0.4% |
0.5% |
|
M/m Change |
1.9% |
1.7% |
1.2% |
2.1% |
1.5% |
1.5% |
|
YTD Change |
4.2% |
1.7% |
2.6% |
4.6% |
3.4% |
3.2% |
Source: CBK
Kenya Shilling:
During the month, the Kenya Shilling depreciated by 0.7% against the US Dollar, to close the month at Kshs 115.8, from Kshs 115.0 recorded at the end of March 2022, driven by the increased dollar demand from oil and merchandise importers on the back of increased global oil prices against slower recovery in exports and in the tourism sector.
During the week, the Kenyan shilling depreciated marginally by 0.2% against the US dollar to close the week at Kshs 115.8, from Kshs 115.6 recorded the previous week, partly attributable to increased dollar demand from the oil and energy sectors. Key to note, this is the lowest the Kenyan shilling has ever depreciated against the dollar. On a year to date basis, the shilling has depreciated by 2.3% against the dollar, in comparison to the 3.6% depreciation recorded in 2021. We expect the shilling to remain under pressure in 2022 as a result of:
- Rising global crude oil prices on the back of supply constraints and geopolitical pressures at a time when demand is picking up with the easing of COVID-19 restrictions and as economies reopen. Key to note, risks abound the recovery following the emergence of the new COVID-19 variants,
- Increased demand from merchandise traders as they beef up their hard currency positions in anticipation for more trading partners reopening their economies globally,
- An ever-present current account deficit due to an imbalance between imports and exports, with Kenya’s current account deficit estimated to come in at 5.6% of GDP in the 12 months to February 2022 compared to the 4.3% for a similar period in 2021. The wider deficit reflects a higher import bill, particularly for oil, which more than offset increased receipts from agricultural and services exports, and remittances, and,
- The aggressively growing government debt, with Kenya’s public debt having increased at a 10-year CAGR of 18.6% to Kshs 8.2 tn in December 2021, from Kshs 1.5 tn in December 2011 thus putting pressure on forex reserves to service some of the public debt. It is worth noting that the average GDP growth over the same period has been 4.5%, an indicator that the increase in debt is not translating into GDP growth.
The shilling is however expected to be supported by:
- High Forex reserves currently at USD 8.4 bn (equivalent to 5.0-months of import cover), which is above the statutory requirement of maintaining at least 4.0-months of import cover, and the EAC region’s convergence criteria of 4.5-months of import cover. In addition, the reserves were boosted by the USD 750.0 mn World Bank loan facility received in March 2022 and are expected to be boosted further by the expected USD 244.0 bn from the International Monetary Fund (IMF), and,
- Improving diaspora remittances evidenced by a 25.0% y/y increase to USD 363.6 mn as of March 2022, from USD 290.8 mn recorded over the same period in 2021, the highest figure ever which has continued to cushion the shilling against further depreciation.
Weekly Highlights:
- April 2022 Inflation
The y/y inflation for the month of April 2022 increased to 6.5%, from the 5.6% recorded in March 2022, higher than our expectations. The increase was mainly attributable to the increase in the y/y Food and non-alcoholic beverages, household equipment, transport as well as housing, water, electricity, gas and other fuels, which increased by 12.2%, 7.2%, 6.9% and 5.5%, respectively. Food and non-alcoholic beverages index has had the greatest increase both year on year and month on month mainly due to increased cost of production materials and erratic weather conditions.
The table below shows a summary of both the year on year and month on month commodity groups’ performance;
|
Major Inflation Changes – April 2022 |
|||
|
Broad Commodity Group |
Price change m/m (April-22/March-22) |
Price change y/y (April-22/April-21) |
Reason |
|
Food & Non-Alcoholic Beverages |
3.0% |
12.2% |
The m/m increase was mainly contributed by increase in prices of potatoes, fresh milk and wheat flour among other food items. The increase was however mitigated by a decline in prices of sugar and oranges |
|
Housing, Water, Electricity, Gas and other Fuel |
0.7% |
5.5% |
The m/m increase was as a result of increase in the price of kerosene by 9.6% m/m and 15.8% from April 2021
|
|
Transport Cost |
2.8% |
6.9% |
The m/m increase was as a result of the increase in prices of super petrol and diesel in the month of April by 7.3% and 8.6% to Kshs 144.6 per litre and Kshs 125.5 per litre, from Kshs 129.7 per litre and Kshs 110.6 per litre, respectively, following the rise in global oil prices. This marked the highest fuel prices ever recorded in the country |
|
Overall Inflation |
1.7% |
6.5% |
The m/m increase was due to a 3.0% and 2.8% increase in the food and non-alcoholic beverages index and the transport index |
Source: KNBS
Going forward, we expect the inflation pressures to remain elevated but within the government’s set range of 2.5% - 7.5%. However, concerns remain high on the rising food and fuel prices which are expected to put more pressure on inflation, given that these are major contributors to the inflation basket. Despite the government’s efforts to cushion Kenyans against high fuel prices, we believe that the fuel subsidy program by the National Treasury stands at risk of being depleted should the landed cost of fuel continue increasing. Notably, on a year to date basis, fuel prices in Kenya are currently the highest ever recorded having increased by 11.5%, 13.5% and 9.6% to Kshs 144.6 per litre, Kshs 125.5 per litre and Kshs 113.4 per litre in April, respectively, for super petrol, diesel and kerosene.
- International Monetary Fund (IMF) Loan Facility
During the week, the International Monetary Fund (IMF) announced that it had reached a staff level agreement with the Kenyan authorities on the third review of the 38-months Extended Fund Facility (EFF) and Extended Credit Facility (ECF) financing for Kenya. The formal completion of the review will allow Kenya to access the fourth tranche of USD 244.0 mn (Kshs 28.2 bn) of the approved 38-month loan facility totalling to USD 2.34 bn (Kshs 270.9 bn) that was announced in April 2021, having already received USD 972.6 mn (Kshs 112.6 bn) in 2021. Notably, the IMF commended Kenya for its continued economic recovery and fiscal objectives which are aimed at increasing revenues and managing the country’s debt levels. The credit facility is aimed at assisting Kenya to (i) stabilize its economy, and, (ii) create a sustainable growth path. The table below shows the funding the government has received so far out of the original amount:
|
International Monetary Fund (IMF) EFF and ECF Financing Programme |
||
|
Date |
Amount Received (USD mn) |
Amount Received (Kshs bn) |
|
Apr-21 |
307.5 |
35.6 |
|
Jun-21 |
407.0 |
47.1 |
|
Dec-21 |
258.1 |
29.9 |
|
April-22 |
*244.0 |
*28.2 |
|
Total Amount Received |
1,216.6 |
140.8 |
|
Amount pending |
1,123.4 |
130.1 |
|
*Expected Funds upon IMF management and executive board approval |
||
The expected receipt of the Kshs 28.4 bn loan funds will increase the country’s dollar inflows and help protect the Kenyan shilling against significant depreciation. Additionally, the funds will help improve investor sentiments towards the country given the heightened perceived risk which has seen the yields on Eurobonds increase significantly since the year begun. According to the IMF, Kenya’s economy is projected to grow at a rate of 5.7% in 2022 backed by robust economic recovery from the adverse effects of the pandemic. However, risks lie on the downside given the rising global fuel prices and the persistent supply bottlenecks which are likely to increase the overall production costs and consequently the cost of living.
Monthly Highlights:
- Stanbic Bank released its monthly Purchasing Manager’s Index (PMI) highlighting that the index for the month of March 2022 declined to 50.5 from 52.9 recorded in February 2022 pointing towards slower growth in the Kenyan private sector. For more information, see our Cytonn Weekly #14/2022,
- Cabinet Secretary for the National Treasury presented the FY’2022/2023 Budget Statement before parliament highlighting that total revenue for FY’2022/23 is set to increase by 36.9% to Kshs 2.4 tn from the Kshs 1.8 tn in FY’2021/2022. The increase is mainly due to a 25.4% increase in ordinary revenue to Kshs 2.1 tn from the Kshs 1.8 tn collected in FY’2021/22. For a detailed analysis, see our FY’2022/2023 Budget Review topical here,
- The Cabinet Secretary for the National Treasury tabled the Finance Bill 2022 in Parliament for consideration two months earlier in April as compared to June in previous years, in order to provide Parliament with ample time to discuss the bill, before it winds down ahead of the August 2022 general elections. The bill seeks to increase excise duty on various goods such as bottled water and non-alcoholic beverages by 9.5% to Kshs 6.6 per litre, from the current Kshs 6.0 per litre. For more information, see our Cytonn Weekly #15/2022, and,
- The Energy and Petroleum Regulatory Authority (EPRA) released their monthly statement on the maximum fuel price in Kenya effective 15th April 2022 to 14th May 2022 highlighting that super petrol, diesel and kerosene prices increased by 7.3%, 8.6% and 9.6% to Kshs 144.6 per litre, Kshs 125.5 per litre and Kshs 113.4 per litre, from Kshs 129.7 per litre, Kshs 110.6 per litre and Kshs 103.5, respectively, marking the highest prices ever recorded in the country. For more information, see our Cytonn Weekly #15/2022.
Rates in the Fixed Income market have remained stable due to the relatively ample liquidity in the money market. The government is 15.1% ahead of its prorated borrowing target of Kshs 559.8 bn having borrowed Kshs 644.5 bn of the Kshs 661.6 bn borrowing target for the FY’2021/2022. We expect a gradual economic recovery as evidenced by the revenue collections of Kshs 1.2 tn during the first eight months of the current fiscal year, which was equivalent to 100.8% of the prorated revenue collection target. However, despite the projected high budget deficit of 8.1% and the recent affirmation of the `B+’ rating with negative outlook by Fitch Ratings, we believe that the support from the IMF and World Bank will help the interest rate environment remain stable since the government is not desperate for cash. Owing to this, our view is that investors should be biased towards short-term fixed-income securities to reduce duration risk.
Markets Performance
During the month of April, the equities market was on a downward trajectory, with NASI, NSE 20 and NSE 25 declining by 3.6%, 2.5% and 5.1%, respectively. The equities market performance was driven by losses recorded by large cap stocks such as ABSA, KCB Group, BAT Kenya and Standard Chartered Bank Kenya (SCBK) of 19.8%, 15.0%, 12.6% and 10.6%, respectively. The losses were however mitigated by gains recorded by stocks such as Bamburi and NCBA Group of 3.6% and 0.6%, respectively.
During the week, the equities market was on a downward trajectory, with NASI, NSE 20 and NSE 25 declining by 3.0%, 2.9% and 4.1%, respectively, taking their YTD performance to losses of 10.1%, 5.9% and 9.9% for NASI, NSE 20 and NSE 25, respectively. The equities market performance was driven by losses recorded by large cap stocks such as ABSA, KCB Group, Standard Chartered Bank Kenya (SCBK) and BAT of 20.8%, 12.9%, 11.4% and 11.1%, respectively. The losses were however mitigated by gains recorded by other large cap stocks such as Bamburi of 2.9%.
Equities turnover declined by 39.4% during the month to USD 50.6 mn, from USD 83.5 mn recorded in March 2022. Foreign investors remained net sellers during the month, with a net selling position of USD 14.3 mn, compared to March’s net selling position of USD 12.7 mn.
During the week, equities turnover declined by 50.2% to USD 8.4 mn, from USD 16.8 mn recorded the previous week, taking the YTD turnover to USD 294.6 mn. Foreign investors remained net sellers, with a net selling position of USD 0.2 mn, from a net selling position of USD 6.5 mn recorded the previous week, taking the YTD net selling position to USD 29.1 mn.
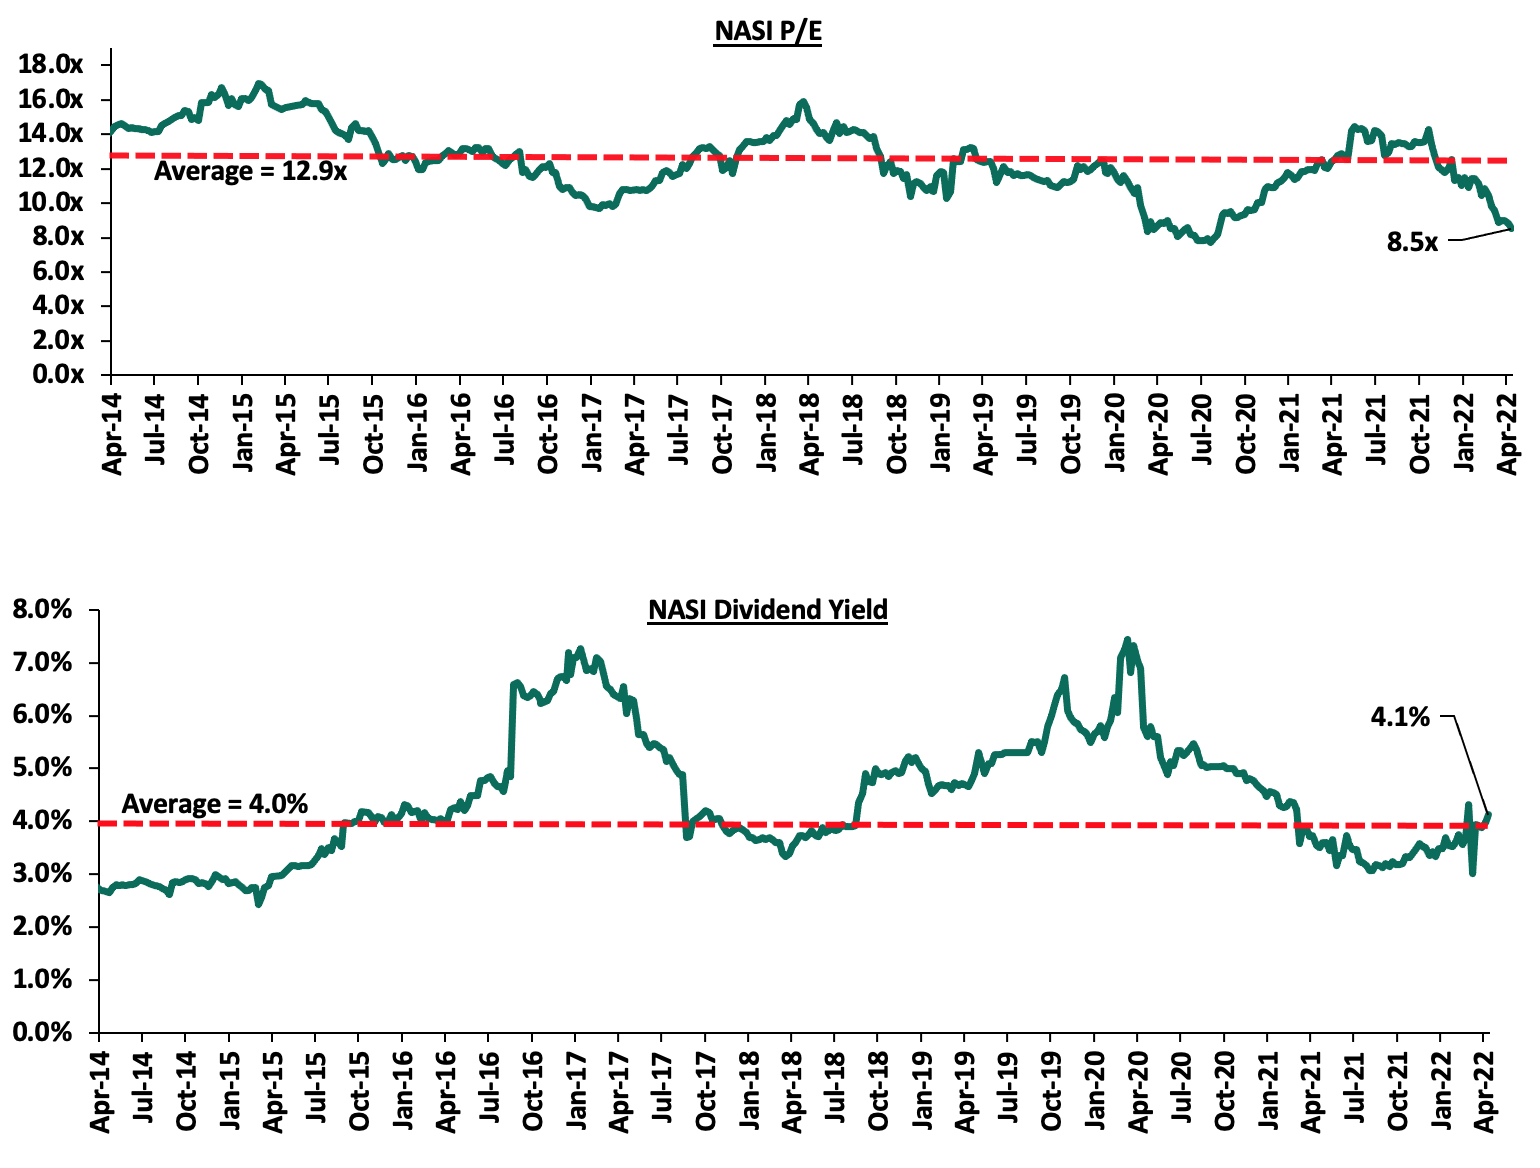
The market is currently trading at a price to earnings ratio (P/E) of 8.5x, 33.9% below the historical average of 12.9x, and a dividend yield of 4.1%, 0.1% points above the historical average of 4.0%. Key to note, NASI’s PEG ratio currently stands at 1.1x, an indication that the market is trading at a slight premium to its future earnings growth. A PEG ratio greater than 1.0x indicates the market may be overvalued while a PEG ratio less than 1.0x indicates that the market is undervalued. The current P/E valuation of 8.5x is 10.4% above the most recent trough valuation of 7.7x experienced in the first week of August 2020. The charts below indicate the historical P/E and dividend yields of the market:
Monthly highlights:
- Britam Holdings (the parent company), and Britam Life Assurance (subsidiary), jointly announced that the two firms are in the final stages of executing the sale agreement to sell their stakes in Equity Group Holdings to the International Finance Corporation (IFC) and the IFC Financial Institutions Growth (FIG) Fund, and expect to finalize the transactions by end of April 2022. Britam Holdings is seeking to sell 166,390,750 shares in EGH (110,901,488 shares to IFC and 55,489,262 shares to the IFC FIG Fund), constituting 4.4% of EGH’s issued shares, while Britam Life Assurance Company will be selling 86,719,611 shares (53,620,247 shares to IFC and 33,099,364 shares to the IFC FIG Fund), and constituting 2.3% of EGH’s issued capital. For more information, please see our Cytonn Weekly #14/2022,
- The Insurance Regulatory Authority (IRA), announced that Resolution Insurance Company had been placed under statutory management by the Commissioner of Insurance, following continued challenges by the insurer to meet its obligations such as settling claims to claimants, policyholders and other creditors, coupled with failure to mitigating inherent risks. The regulator appointed the Policyholders Compensation Fund (PCF) as the Statutory Manager of Resolution Insurance Company for a period of 12 months, commencing 5th April 2022, the date at which all existing policies ceased to exist. For more information, please see our Cytonn Weekly #14/2022,
- Equity Group Holdings Plc announced that it has injected USD 100.0 mn (Kshs 11.5 bn) to its subsidiary in the Democratic Republic of Congo (DRC), Equity BCDC, in order to fund development projects as well as large manufacturing and mining companies in the DRC given the country’s diverse and immense natural resources as well as the sectors contribution to economic growth. Notably, the two sectors contribute only 7.0% to the Group’s loan book, thus providing an opportunity that the bank can tap into, to diversify its revenues and risk exposure. For more information, please see our Cytonn Weekly #15/2022, and,
- Following the release of the FY’2021 results by Kenyan listed banks, the Cytonn Financial Services Research Team undertook an analysis on the financial performance of the listed banks and identified the key factors that shaped the performance of the sector. The Asset Quality for the listed banks improved in FY’2021, with the gross NPL ratio declining by 1.2% points to 12.3%, from 13.5% in FY’2020. Core Earnings per Share (EPS) recorded a weighted growth of 82.9% in FY’2021, from a weighted decline of 26.8% recorded in FY’2020 while the listed banks’ management quality also improved, with the Cost to Income ratio improving by 16.9% points to 56.4%, from 73.3% recorded in FY’2020, as banks continued to reduce their provisioning levels following the improved business environment during the period. For more information, please see our Cytonn Weekly#15/2022.
Universe of coverage:
|
Company |
Price as at 22/04/2022 |
Price as at 28/04/2022 |
w/w change |
m/m change |
YTD Change |
Year Open 2022 |
Target Price* |
Dividend Yield |
Upside/ Downside** |
P/TBv Multiple |
Recommendation |
|
Kenya Reinsurance |
2.1 |
2.2 |
0.9% |
(4.4%) |
(6.1%) |
2.3 |
3.2 |
4.7% |
52.5% |
0.2x |
Buy |
|
Jubilee Holdings |
268.3 |
264.0 |
(1.6%) |
(2.9%) |
(16.7%) |
316.8 |
381.7 |
5.3% |
49.9% |
0.5x |
Buy |
|
I&M Group*** |
20.0 |
18.2 |
(9.0%) |
(12.9%) |
(15.0%) |
21.4 |
25.4 |
8.2% |
47.7% |
0.5x |
Buy |
|
ABSA Bank*** |
12.6 |
10.0 |
(20.8%) |
(19.8%) |
(15.1%) |
11.8 |
13.4 |
11.0% |
45.5% |
1.0x |
Buy |
|
KCB Group*** |
43.0 |
37.5 |
(12.9%) |
(15.0%) |
(17.8%) |
45.6 |
50.5 |
8.0% |
42.9% |
0.8x |
Buy |
|
Liberty Holdings |
5.5 |
5.6 |
2.6% |
(5.1%) |
(20.4%) |
7.1 |
7.7 |
0.0% |
36.3% |
0.4x |
Buy |
|
Standard Chartered*** |
145.0 |
128.5 |
(11.4%) |
(10.6%) |
(1.2%) |
130.0 |
147.1 |
10.9% |
25.3% |
1.0x |
Buy |
|
Diamond Trust Bank*** |
57.0 |
55.0 |
(3.5%) |
(6.8%) |
(7.6%) |
59.5 |
65.6 |
5.5% |
24.7% |
0.2x |
Buy |
|
Equity Group*** |
49.8 |
47.9 |
(3.7%) |
(5.1%) |
(9.2%) |
52.8 |
56.2 |
6.3% |
23.5% |
1.2x |
Buy |
|
Co-op Bank*** |
12.7 |
12.7 |
0.4% |
(1.2%) |
(2.3%) |
13.0 |
14.6 |
7.9% |
22.8% |
1.0x |
Buy |
|
NCBA*** |
26.2 |
26.0 |
(0.8%) |
0.6% |
2.2% |
25.5 |
28.2 |
11.5% |
20.0% |
0.6x |
Accumulate |
|
Sanlam |
10.8 |
10.2 |
(5.6%) |
(7.7%) |
(12.1%) |
11.6 |
12.1 |
0.0% |
18.8% |
1.1x |
Accumulate |
|
Britam |
6.8 |
6.8 |
0.0% |
1.8% |
(10.6%) |
7.6 |
7.9 |
0.0% |
16.5% |
1.1x |
Accumulate |
|
Stanbic Holdings |
100.0 |
105.3 |
5.3% |
2.2% |
21.0% |
87.0 |
107.2 |
8.6% |
10.4% |
0.9x |
Accumulate |
|
CIC Group |
2.1 |
2.1 |
1.0% |
(2.8%) |
(3.2%) |
2.2 |
1.9 |
0.0% |
(10.3%) |
0.7x |
Sell |
|
HF Group |
3.1 |
3.0 |
(1.6%) |
(5.1%) |
(21.1%) |
3.8 |
2.5 |
0.0% |
(17.7%) |
0.2x |
Sell |
|
*Target Price as per Cytonn Analyst estimates **Upside/ (Downside) is adjusted for Dividend Yield ***For Disclosure, these are stocks in which Cytonn and/or its affiliates are invested in |
|||||||||||
We are “Neutral” on the Equities markets in the short term. With the market currently trading at a premium to its future growth (PEG Ratio at 1.1x), we believe that investors should reposition towards value stocks with strong earnings growth and that are trading at discounts to their intrinsic value. We expect the discovery of new COVID-19 variants, the upcoming Kenyan general elections and the slow vaccine rollout to continue weighing down the economic outlook. On the upside, we believe that the relaxation of COVID-19 containment measures in the country will lead to improved investor sentiments.
- Industry Report
During the month, the following industry report was released and the key take-outs were as follows:
|
# |
Theme |
Report |
Key Take-outs |
|
1 |
General Real Estate |
FY’2022/23 Budget Statement by the Cabinet Secretary for the National Treasury Ukur Yatani |
|
Based on the aforementioned increased budgetary allocations, we expect Kenyan Real Estate sector to record improved performance due to the expected increased construction activities as well as the rehabilitation of infrastructure developments. We also expect to see major activities in the affordable housing front with an aim to curb the existing housing deficit in Kenya currently at 2.0 mn. For the hospitality sector, the government reduced its budgetary allocation amidst its recovery, thus diverting funds to other critical sectors such as the housing and infrastructure sectors. We therefore expect its performance to be further boosted by increased visitor arrival into the country, roll out of vaccines, and, increased activities, events, and conferences in the sector.
- Residential Sector
Notable highlights in the sector during the month include;
- Co-operative Bank of Kenya revealed in its FY’2021 annual report that it had received Kshs 549.8 mn loan from the Kenya Mortgage Refinance Company (KMRC) in June 2021, with the aim of financing affordable housing mortgage loans. For more information, see Cytonn Weekly #15/2022, and,
- The University of Nairobi (UoN) announced plans to build 4,000 - bed capacity hostels through a Public Private Partnership (PPP) deal with the Private Infrastructure Group (PIDG), an international infrastructure development and finance organization. According to the two parties, 1,000 slots will be built at the Chiromo campus, another 1,000 at the Kenyatta National Hospital (KNH) Campus, while the remaining 2,000 slots will be established at the university’s main campus. For more information, see Cytonn Weekly #15/2022.
We expect the sector to record improved performance as a result of increased construction activities in the student housing sector through effective strategies such as PPPs, coupled with the continued efforts by KMRC and financial institutions to provide mortgages to home buyers.
- Commercial Office Sector
During the month, Jubilee Holdings, an international insurance company, purchased Coca-Cola East Africa’s former head office located in Upper Hill, Nairobi, at a cost of Kshs 1.1 bn. The insurance firm is expected to begin its operations in the Grade A Commercial Office building that has a total 116,350 SQFT sitting on a 3.2 acre piece of land, in September 2022, upon completion of the renovations. For more information, see Cytonn Weekly #14/2022.
We expect the sector to continue recording slow but rising development and expansion activities leading to its performance improvement. However, the existing oversupply of office space currently at 6.7 mn SQFT in the Nairobi Metropolitan Area (NMA) continues to weigh down the overall performance of the sector.
- Retail Sector
During the week, QuickMart supermarket, a local retail chain, opened a new outlet at Tuskys Mall (T-mall) located along Lang’ata road, thereby taking up prime retail space previously occupied by Tuskys Supermarket. This brings its total number of operational outlets to 51, having opened two other outlets so far this year in Kitengela and Machakos towns. The decision to open the outlet in Lang’ata is supported by;
- The need to step up competition and market domination against retailers such as Naivas that has opened 4 outlets this year, while also having plans to open two more in Meru and Naivasha towns,
- The strategic location of the outlet being served with roads such as Mbagathi and Lang’ata Roads thus boosting its accessibility, and,
- Availability of prime retail space left by Tuskys guaranteeing footfall in the mall.
In terms of performance, according to our Cytonn Q1’2022 Markets Review, the Nairobi Metropolitan Area (NMA) recorded a 0.1% points increase in the overall rental yields to 7.9% from the 7.8% that was recorded in FY’2021. The occupancies increased as well by 0.5% points, to 77.2% in Q1’2022, from 76.7% in FY’2021, a sign of the sector realizing significant improvements. The table below shows the submarket performance of the nodes in the Nairobi Metropolitan Area (NMA);
|
Nairobi Metropolitan Area Retail Market Performance Q1’2022 |
|||
|
Area |
Rent Kshs/ SQFT Q1’2022 |
Occupancy (%) Q1’2022 |
Rental Yield (%) Q1’2022 |
|
Karen |
200 |
85.0% |
10.0% |
|
Kilimani |
183 |
86.8% |
9.9% |
|
Westlands |
214 |
72.9% |
9.5% |
|
Ngong Road |
164 |
81.0% |
8.3% |
|
Kiambu road |
179 |
77.6% |
8.1% |
|
Mombasa road |
146 |
78.6% |
7.0% |
|
Thika Road |
156 |
74.2% |
6.6% |
|
Satellite towns |
145 |
70.8% |
6.2% |
|
Eastlands |
131 |
73.0% |
5.8% |
|
Average |
170 |
77.2% |
7.9% |
Source: Cytonn Research 2022
The table below shows a summary of the number of stores of the key local and international retailer supermarket chains in Kenya;
|
Main Local and International Retail Supermarket Chains |
||||||||||
|
Name of retailer |
Category |
Highest number of branches that have existed as at FY’ 2018 |
Highest number of branches that have existed as at FY’ 2019 |
Highest number of branches that have existed as at FY’ 2020 |
Highest number of branches that have existed as at FY’ 2021 |
Number of branches opened in 2022 |
Closed branches |
Current number of branches |
Number of branches expected to be opened |
Projected number of branches FY’2022 |
|
Naivas |
Local |
46 |
61 |
69 |
79 |
4 |
0 |
83 |
2 |
85 |
|
QuickMart |
Local |
10 |
29 |
37 |
48 |
3 |
0 |
51 |
0 |
51 |
|
Carrefour |
International |
6 |
7 |
9 |
16 |
0 |
0 |
16 |
0 |
16 |
|
Chandarana |
Local |
14 |
19 |
20 |
23 |
1 |
1 |
24 |
4 |
28 |
|
Cleanshelf |
Local |
9 |
10 |
11 |
12 |
0 |
0 |
12 |
0 |
12 |
|
Tuskys |
Local |
53 |
64 |
64 |
3 |
0 |
61 |
3 |
0 |
3 |
|
Game Stores |
International |
2 |
2 |
3 |
3 |
0 |
0 |
3 |
0 |
3 |
|
Uchumi |
Local |
37 |
37 |
37 |
2 |
0 |
35 |
2 |
0 |
2 |
|
Choppies |
International |
13 |
15 |
15 |
0 |
0 |
13 |
0 |
0 |
0 |
|
Shoprite |
International |
2 |
4 |
4 |
0 |
0 |
4 |
0 |
0 |
0 |
|
Nakumatt |
Local |
65 |
65 |
65 |
0 |
0 |
65 |
0 |
0 |
0 |
|
Total |
|
257 |
313 |
334 |
186 |
7 |
179 |
194 |
6 |
200 |
Source: Cytonn Research
Other notable highlights during the month include;
- Naivas supermarket, a local retail chain, opened a new outlet in Kiambu Mall, along Kiambu Road bringing its total operating outlets to 83. Naivas took up the prime retail space that was previously occupied by troubled Choppies Supermarket, an international retail chain. For more information, see Cytonn Weekly #15/2022, and,
- Eat’N’Go Limited, an international fast food chain, opened a new outlet in Westlands Square, Nairobi, bringing its total operating outlets in Nairobi to 9. This is addition to the master franchisee for the Domino’s Pizza, Cold Stone Creamery, and Pinkberry Gourmet Frozen Yoghurt brands having announced plans to open 100 new stores in Kenya in March 2022, beginning with Nanyuki, Kisumu, Eldoret, and Nakuru towns. For more information, see Cytonn Weekly #14/2022.
We expect the retail sector to record improvement in performance attributed to; i) the rapid expansion drive by local and international retailers, ii) positive demographics evidenced by Kenya’s relatively high urbanization and population growth rates of 4.0% p.a and 2.3% p.a, respectively, against the global average of 1.8% p.a and 1.0% p.a, respectively, as at 2020, according to World Bank, and, iii) infrastructural developments opening areas for investments and accessibility. However, factors such as e-commerce driving down the need for retail spaces, and, oversupply of retail space currently at 1.7 mn SQFT in Kenya and 3.0 mn SQFT in NMA, continues to weigh down the overall performance of the sector.
- Hospitality
During the week, Hilton Hotel, an international hotel chain, announced plans to shut down its Nairobi Central Business District (CBD) operations indefinitely as from 31st December 2022. The iconic five-star hotel consisting of 287 rooms, has been in operation for 53 years in Kenya, having been launched in 1969. According to Hilton, the hotel which is owned by the Kenyan National Government (40.6% stake), and Hilton Group of Hotels (59.4% stake), has been facing various undisclosed setbacks besides the effects of the COVID-19 pandemic, thereby leading to the decision to cease operations by the end of the year. However, Hilton will not fully leave the Kenyan hotel industry due to the existence of two other branches that have been performing well, thus will continue their operations, namely; Hilton Nairobi Hurlingham and Hilton Garden Inn Nairobi.
Despite the expected indefinite closure of Hilton CBD hotel, the Kenyan hospitality sector has witnessed increased activities positioning it on the path of recovery, after having been one of the worst hit economic sectors by the onset of the pandemic. Some of these activities and driving factors include;
- Increased tourism activities, conferences and events such as the World Rally championship program expected to run annually until 2026,
- Roll out of COVID -19 vaccines thereby boosting confidence in the sector,
- Positive accolades such as the 28th World Travel Awards winners, where Nairobi was voted as Africa’s leading business travel destination,
- Lowered pandemic restrictions such as lockdowns and social distancing, thereby increasing visitor arrival into the country, and,
- Aggressive marketing of the Kenyan tourism sector through the Magical Kenya Platform, and, Kenya Tourism Board.
The above factors have led to the increased number of operating hotels and hotel bed occupancies in Kenya, evidenced by Central Bank of Kenya’s Monetary Policy Committee Hotels Survey March 2022. According to the report, the overall number of operating hotels stood at 100.0% in March 2022, whereas the overall bed occupancy rates increased to 57.0% in March 2022, from the 21.0% that was recorded in January 2021.
Other notable highlights during the month include;
- Hotel chain Sarova Woodlands took over management of Kisumu’s Imperial hotel, after having entered into a 7-year agreement with the Gilani Family, the owners of the facility. This will bring the hotelier’s number of operating hotels countrywide to 8, with the 93–bed hotel having been renamed as Sarova Imperial Kisumu. For more information, see Cytonn Weekly #15/2022, and,
- French’s Fairmont Norfolk Hotel located in Nairobi’s Central Business District (CBD), resumed operations after having been shut down for nearly two years. The five star hotel seized its operations in July 2020 amidst the onset of the COVID-19 pandemic which caused a slowdown of business activities. For more information, see Cytonn Weekly #14/2022.
We expect the hospitality sector to continue witnessing expansion and reopening activities in order to further boost its overall performance. However, some hotels’ performance continue to be weighed down by the effects of the pandemic, which has in turn led to reduced income.
- Mixed Use Development (MUD)
During the week, Sheria Savings and Credit Cooperative Society (SACCO) announced plans to build a Mixed Use Development tower in Nairobi’s Upper Hill Matumbato Close, at a cost of Kshs 3.3 bn, by December 2025. The project set to be next to the current location of the Sheria SACCO offices, will sit on a one-acre piece of land that they bought in the year 2004 at a cost of Kshs 20.0 mn. The piece of land is currently worth an estimated Kshs 400.0 mn. Moreover, the Twin Tower project which was initiated in September 2019, will comprise of residential units, shopping centers, and commercial offices spaces. According to its FY’2020 Annual Report, the SACCO had an asset base of Kshs 6.7 bn with loan to members making up 85.4% of the total assets and property holdings making up 5.1% of the asset base at a value of Kshs 0.3 bn. The SACCO aims at increasing its Real Estate investments through the project signifying an increased appetite of SACCOs in the Kenyan Real Estate sector, with others who have also ventured into the sector being Stima SACCO and Taifa SACCO who are currently looking to develop an office block in Nyeri that will house their headquarters, among others.
For financing, Sheria SACCO launched a platform dubbed Mavuno Account on 28th April 2022, with an aim of pooling funds from investors through the locked account system which has an investment period of five to ten years, and a return of 10.0% p.a. Given the current total deposits of Kshs 4.8 bn, we believe the SACCO will require a period of intensive fundraising before they can be able to kick off construction. Besides the platform, the SACCO also plans to raise funds through off-plan selling of the residential units to its members totalling 15,689 as at December 2021, for 90 days before the construction is launched. The firm requires a minimum 20.0% deposit of a unit selling price, however, a 10.0% discount will be given to members who will make a deposit of 50.0% and above.
In terms of performance, according to our Nairobi Metropolitan Area Mixed-Use Developments (MUDs) Report 2021, MUDs recorded average rental yields of 7.2% in 2021, a 0.7% points higher than the respective single-use, retail, commercial office and residential themes with an average yield of 6.5%. This was mainly attributed to their convenience which incorporates working, shopping and living spaces, thus preferred by many investors. The table below shows the thematic comparison of rental yield performance between Single Use Themes and Mixed Use Developments;
|
Thematic Performance of MUDs in Key Nodes 2021 |
||
|
|
MUD Themes Average |
Market Average |
|
Theme |
Rental Yield 2021 |
Rental Yield 2021 |
|
Retail |
8.4% |
7.8% |
|
Offices |
7.1% |
6.6% |
|
Residential |
6.0% |
5.2% |
|
Average |
7.2% |
6.5% |
Source: Cytonn Research
We expect the MUD sector performance to continue being on an upward trajectory, as a result of their convenience which incorporates live, work and play lifestyle thus more preferred as opposed to the single use theme developments, coupled with the adequate amenities available leading to their increased demand.
However, we are not convinced that an MUD concept is compelling for Upperhill. This is as a result of the already existing oversupply of office spaces in the Nairobi Metropolitan Area at 6.7 mn SQFT, thus weighing down the overall occupancy and performance of the commercial office sector, coupled with the area not adequately supporting retail sector performance. Despite this, a residential development project could be ideal for Upperhill, having recorded average total returns to investors of 6.7%, in Q1’2022, 1.5% points higher than the residential market average returns of 4.8%, according to our Cytonn Q1’2022 Markets Review report.
- Infrastructure
During the month;
- The Ministry of Transport, Infrastructure, Housing, Urban Development and Public Works revealed plans to spend Kshs 151.0 mn in rehabilitation of four county airstrips according to the FY’2022/23 Budget Estimates, aimed at accommodating larger aircrafts. The four airstrip include Suneka in Kisii County, Sagana in Nyeri County, Sironga in Nyamira County and Gombe Airstrip in Siaya County. For more information, see Cytonn Weekly #16/2022, and,
- The Kenya Urban Roads Authority (KURA) announced that it was seeking Kshs 1.0 bn from an undisclosed party to complete the upgrade of roads in Nairobi’s informal settlement areas. The two-year project worth Kshs 5.4 bn began in 2021 and was expected to be completed by December 2022, however has been stalling for the past three months due to financial constraints. Currently, the project is approximately 90.6% done, with 370.0 Km roads done out of the total planned 408.4 Km. For more information, see Cytonn Weekly #14/2022.
We expect the sector to continue recording more development and construction activities, attributed to government’s aggressive efforts to initiate and implement projects, while also giving much priority to the sector in the annual budgetary allocations. In line with this, there are numerous infrastructure projects in the pipeline such as; i) the Nairobi Expressway project, ii) Nairobi Commuter Rail project, iii) Western Bypass, and, iv) berth two of the Lamu Port-South Sudan-Ethiopia-Transport (LAPSSET) Corridor, among many others.
- Statutory Review
During the month;
- The Landlord and Tenant Bill of 2021was tabled to the Senate for consideration having been passed by the National Assembly. The Bill aims to consolidate the laws relating to renting of business and residential premises, regulating the relationship between the landlord and tenant in order to promote stability in the rental sector, and, establish tribunals to provide for the adjudication of disputes. For more information, see Cytonn Weekly #16/2022, and,
- The Finance Bill 2022 was tabled to the parliament for debate highlighting that a property includes land, building, aircraft, ship, or motor vehicle, thus sufficient to serve as security for unpaid taxes, and therefore if a taxpayer who is also the owner of a property fails to pay tax by the stipulated date, the subject property shall be the security for the unpaid tax. Additionally, the bill proposes an increase in the Capital Gains Tax (CGT) to 15.0% from the current 5.0%. Capital Gains Tax (CGT) is a final tax payable upon the transfer or sale of property by an individual or company – it is calculated against gains on the property sale. For more information, see Cytonn Weekly #15/2022.
We expect these regulations to provide clarification as well as streamline activities in the Real Estate sector, thus in turn foster the growth and performance of the economy as a whole. However, the proposal to increase CGT rate is expected to weigh down property transaction processes, as well as the uptake of properties as result of them being more costly.
- Listed Real Estate
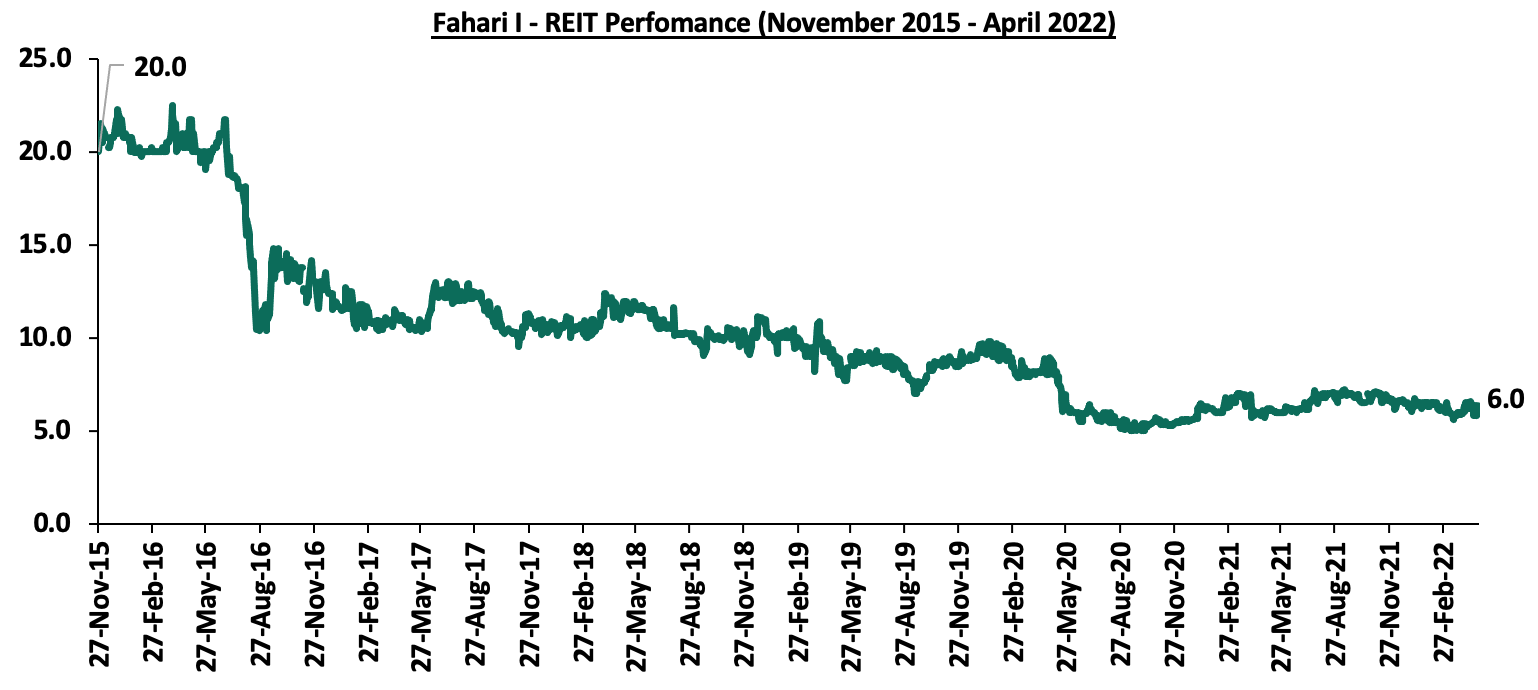
In the Nairobi Stock Exchange, ILAM Fahari I-REIT closed the month trading at an average price of Kshs 6.0 per share, representing a 1.7% Month-to-Date (MTD) increase from Kshs 5.9 per share. On a Year-to-Date (YTD) and Inception-to-Date (ITD) basis, the REIT’s performance continues to be weighed down having realized a 6.2% and 70.0% decline, respectively, from Kshs 6.4 and Kshs 20.0 per share. The graph below shows Fahari I-REIT’s performance from November 2015 to March 2022:
Also during the month, ICEA Lion Asset Management (ILAM) Limited revealed though the Fahari I-REIT FY’2021 annual report, that it had bought five million units of Fahari I-REIT’s units in 2021 as normal market purchases. At a trading price of Kshs 6.6, as at 14th April 2022, the units’ value stood at Kshs 33.0 mn. ICEA Lion which became Fahari I-REIT’s promoter in December 2020 therefore became the 8th largest shareholder of the REIT, with a 2.8% stake. For more information, see Cytonn Weekly #15/2022.
The Kenyan Real Estate market is expected to be on an upward trajectory driven by; i) increased construction activities in the residential, infrastructure and MUD sectors, ii) efforts by the government to avail mortgages at affordable rates through the KMRC, iii) increased uptake of spaces in the commercial office sector, iv) aggressive expansion by local and international retailers, v) slow but rising performance of the hospitality sector, and, vi) efforts by the government to streamline property laws to enable smooth property transactions. However, the performance of the sector is expected to be weighed down by the inadequate investor appetite in REITs, coupled with the proposal to increase Capital Gains Tax rate on property transactions.
Unit Trust Funds (UTFs) are Collective Investment Schemes that pool funds from different investors and are managed by professional fund managers. The fund managers invest the pooled funds in a portfolio of securities with the aim of generating returns to meet the specific objectives of the fund. Following the release of the Capital Markets Authority (CMA) Quarterly Statistical Bulletin – FY’2021, we analyze the performance of Unit Trust Funds, as the total Assets Under Management (AUM) have been steadily increasing, and they are among the most popular investment options in the Kenyan market. In our previous focus on Unit Trust Funds, we looked at the Q3'2021 Unit Trust Funds Performance by Fund Managers. In this topical, we focus on the FY’2021 performance of Unit Trust Funds where we shall analyze the following:
- Performance of the Unit Trust Funds Industry,
- Performance of Money Market Funds,
- Comparing Unit Trust Funds AUM Growth with other Markets, and,
- Recommendations
Section I: Performance of the Unit Trust Funds Industry
Unit Trust Funds are investment schemes that pool funds from investors and are managed by professional Fund Managers. The fund manager invests the pooled funds with the aim of generating returns in line with the specific objectives of the fund. The Unit Trust Funds earn returns in the form of dividends, interest income, rent and/or capital gains depending on the underlying security. The main types of Unit Trust Funds include:
- Money Market Funds – These are funds that invests in fixed income securities such as fixed deposits, treasury bills and bonds, commercial papers, etc. They are very liquid, have stable returns, and, they are suitable for risk averse investors,
- Equity Funds – These are funds which largely invest in listed securities and seek to offer superior returns over the medium to long-term by maximizing capital gains and dividend income. The funds invest in various sectors to reduce concentration risk and maintain some portion of the fund’s cash in liquid fixed income investments to maintain liquidity and pay investors if need be without losing value,
- Balanced Funds – These are funds whose investments are diversified across the Equities and the Fixed Income market. The Balanced Fund offers investors long-term growth as well as reasonable levels of stability of income,
- Fixed Income Funds – These are funds which invest in interest-bearing securities, which include treasury bills, treasury bonds, preference shares, corporate bonds, loan stock, approved securities, notes and liquid assets consistent with the portfolio’s investment objective, and,
- Sector Specific Funds – These are funds that invest primarily in a particular sector or industry. The funds provide a greater measure of diversification within a given sector than may be otherwise possible for the other funds. They are specifically approved by the capital Markets Authority as they are not invested as per the set rules and regulations.
As per the Capital Markets Authority (CMA) Quarterly Statistical Bulletin – Q1’2022, the industry’s overall Assets under Management (AUM) grew by 28.6% to Kshs 134.7 bn as at the end of FY’2021, from Kshs 104.7 bn as at the end of FY’2020. Additionally, the UTFs AUM has grown at a 4-year CAGR of 23.9% to Kshs 134.7 bn in FY’2021, from Kshs 57.2 bn recorded in FY’2017 as highlighted in the graph below:
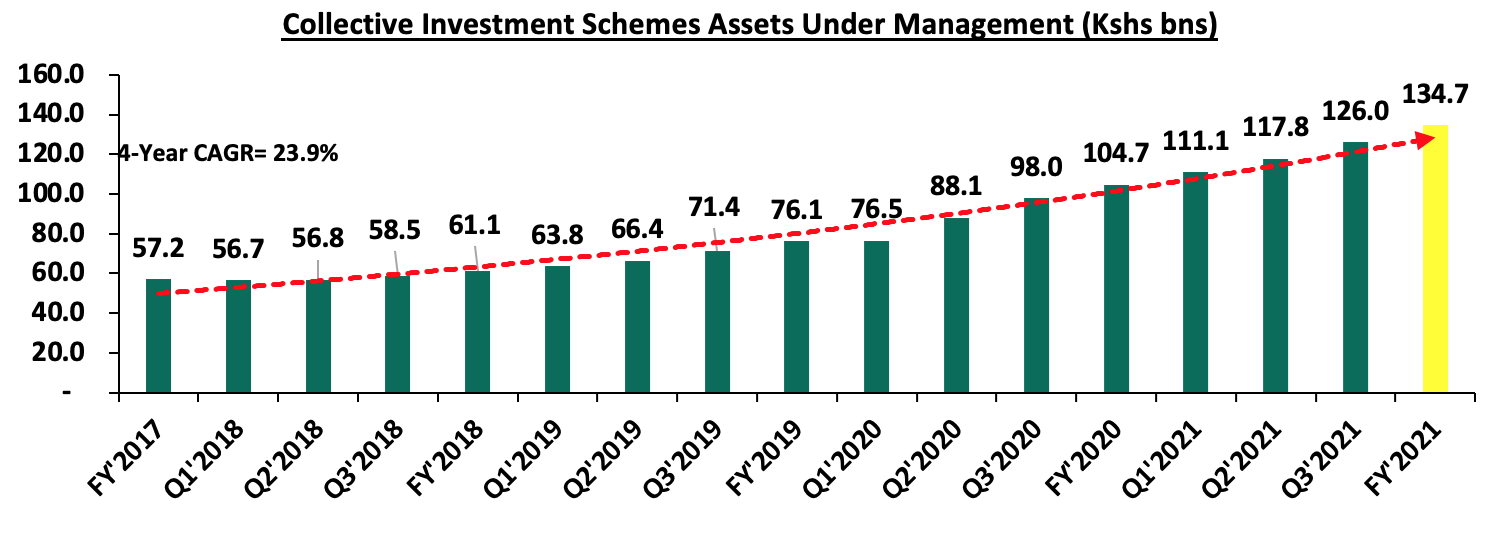
Source: Capital Markets Authority Quarterly Statistical bulletins
This growth can be largely attributable to:
- Low Investments minimums for plain vanilla funds: Majority of the Unit Trust Funds Collective Investment Schemes’ (CIS) in the market require a relatively low initial investment ranging between Kshs 100.0 - Kshs 10,000.0. This has in turn made them attractive to retail and individual investors, boosting their growth,
- Increased Investor Knowledge: There has been a drive towards investor education on the various products offered by trust funds which has meant that more people are aware and have a deeper understanding of the investment subject. As a result, their confidence has been boosted resulting to increased uptake,
- Diversified product offering: Unit Trust Funds are also advantageous in terms of providing investors with access to a wider range of investment securities through pooling of funds. This allows investors the opportunity of diversifying their portfolios which would have not been accessible if they invested on their own,
- Efficiency and ease of access to cash/High Liquidity: Funds invested in UTFs are invested as portfolios with different assets and the fund managers always maintain a cash buffer. Unit trusts are highly liquid, as it is easy to sell and buy units without depending on demand and supply at the time of investment or exit, and,
- Adoption of Fintech: Digitization and automation within the industry has enhanced liquidity, enabling investors to receive their funds within 3 to 5 working days if they are withdrawing to their bank accounts, and immediate access to funds when withdrawing via M-PESA. According to the Central Bank of Kenya, more and more individuals are transacting through mobile money services as evidenced by the increase in the total number of registered mobile money accounts to 68.0 mn in December 2021, from 37.4 mn recorded in December 2017. Fintech has increased the efficiency of processing both payments and investments for fund managers and made Collective Investment Schemes more accessible to retail investors.
According to the Capital Markets Authority, as at the end of FY’2021, there were 29 approved Collective Investment Schemes in Kenya, up from the 23 that were recorded at the end of FY’2020. Out of the 29 however, only 19 were active while 10 were inactive. The table below outlines the performance of the Collective Investment Schemes:
|
Assets Under Management (AUM) for the Approved Collective Investment Schemes |
||||||
|
No. |
Collective Investment Schemes |
FY’2020 AUM (Kshs mn) |
FY’2020 Market Share |
FY’2021 AUM (Kshs mn) |
FY’2021 Market Share |
AUM Growth FY'2020 -FY'2021 |
|
1 |
CIC Unit Trust Scheme |
42,988.1 |
41.1% |
56,278.4 |
41.8% |
30.9% |
|
2 |
NCBA Unit Trust Scheme |
12,543.2 |
12.0% |
18,003.0 |
13.4% |
43.5% |
|
3 |
Britam Unit Trust Scheme |
12,304.8 |
11.8% |
14,573.3 |
10.8% |
18.4% |
|
4 |
ICEA Lion Unit Trust Scheme |
11,521.0 |
11.0% |
13,350.7 |
9.9% |
15.9% |
|
5 |
Sanlam Unit Trust Scheme |
6,279.8 |
6.0% |
8,610.7 |
6.4% |
37.1% |
|
6 |
Old Mutual Unit Trust Scheme |
6,131.3 |
5.9% |
6,655.0 |
4.9% |
8.5% |
|
7 |
Dry Associates Unit Trust Scheme |
2,360.9 |
2.3% |
3,054.4 |
2.3% |
29.4% |
|
8 |
Co-op Unit Trust Scheme |
1,007.1 |
1.0% |
2,801.0 |
2.1% |
178.1% |
|
9 |
Madison Asset Unit Trust Fund |
1,928.6 |
1.8% |
2,660.2 |
2.0% |
37.9% |
|
10 |
Nabo Capital (Centum) |
1,654.8 |
1.6% |
2,398.3 |
1.8% |
44.9% |
|
11 |
Zimele Unit Trust Scheme |
1,420.4 |
1.4% |
1,992.5 |
1.5% |
40.3% |
|
12 |
African Alliance Kenya |
1,813.3 |
1.7% |
1,788.4 |
1.3% |
(1.4%) |
|
13 |
Apollo Unit Trust Scheme |
587.3 |
0.6% |
716.3 |
0.5% |
22.0% |
|
14 |
Cytonn Unit Trust Scheme |
819.5 |
0.8% |
704.2 |
0.5% |
(14.1%) |
|
15 |
Genghis Unit Trust Fund |
700.0 |
0.7% |
558.5 |
0.4% |
(20.2%) |
|
16 |
Equity Investment Bank |
310.8 |
0.3% |
246.4 |
0.2% |
(20.7%) |
|
17 |
Alpha Africa |
208.1 |
0.2% |
245.8 |
0.2% |
18.2% |
|
18 |
Amana Unit Trust Fund |
135.4 |
0.1% |
30.7 |
0.0% |
(77.3%) |
|
19 |
Wanafunzi |
0.5 |
0.0% |
0.6 |
0.0% |
12.0% |
|
20 |
Alpha Africa Umbrella Fund |
- |
- |
- |
- |
- |
|
21 |
First Ethical Opportunities Fund |
- |
- |
- |
- |
- |
|
22 |
Genghis Specialised Fund |
- |
- |
- |
- |
- |
|
22 |
Absa Unit Trust Fund |
- |
- |
- |
- |
- |
|
24 |
Standard Investment Trust Fund |
- |
- |
- |
- |
- |
|
25 |
Diaspora Unit Trust Scheme |
- |
- |
- |
- |
- |
|
26 |
Dyer and Blair Unit Trust Scheme |
- |
- |
- |
- |
- |
|
27 |
Jaza Unit Trust Fund |
- |
- |
- |
- |
- |
|
28 |
Masaru Unit Trust Fund |
- |
- |
- |
- |
- |
|
29 |
Adam Unit Trust Fund |
- |
- |
- |
- |
- |
|
|
Total |
104,714.9 |
100.00% |
134,668.5 |
100.0% |
28.6% |
Source: Capital Markets Authority: Quarterly Statistical Bulletins
Key to note from the above table:
- Assets Under Management: CIC Unit Trust Scheme remained the largest overall Unit Trust Fund with an AUM of Kshs 56.3 bn in FY’2021, from an AUM of Kshs 43.0 bn in FY’2020, translating to a 30.9% AUM growth,
- Market Share: CIC Unit Trust Scheme remained the largest overall Unit Trust with a market share of 41.8%, an increase of 0.7% points from 41.1% in FY’2020. The top 5 largest Collective Investment Schemes accounted for 82.3% of the total industry AUM, a marginal 0.5% points increase from FY’2020 when they accounted for 81.8% of the total AUM,
- Growth: In terms of AUM growth, Co-op Unit Trust Scheme recorded the strongest growth of 178.1%, with its AUM increasing to Kshs 2.8 bn, from Kshs 1.0 bn in FY’2020 while Amana Unit Trust Fund recorded the largest decline, with its AUM declining by 77.3% to Kshs 30.7 mn in FY’2021, from Kshs 135.4 mn in FY’2020. Amana has continued to be plagued by low investor confidence and high withdrawals since the fund manager froze funds for two years beginning 2018 in one of their offering – the Amana Shilling Fund. Amana Capital's AUM has declined by a 5-Yr CAGR of 51.3% to Kshs 30.7 mn in FY'2021 from Kshs 1.1 bn in FY'2016,
- Alpha Africa Umbrella Fund, First Ethical Opportunities Fund, Diaspora Unit Trust Scheme, Genghis Specialised Fund, Standard Investment Trust Fund, Dyer and Blair Unit Trust Scheme, Absa Unit Trust Fund, Jaza Unit Trust Fund, Masaru Unit Trust Fund, and Azam Unit Trust Fund remained inactive as at the end of FY’2021.
Section II: Performance of Money Market Funds
Money Market Funds (MMFs) in the recent past have gained popularity in Kenya driven by the higher returns money market funds offer compared to the returns on bank deposits and treasury bills. According to the Central Bank of Kenya data, the average deposit rate declined to 6.5% as at the end of FY’2021, from 6.7% at the end of FY’2020. Yields from the 91-Day T-bill increased to 7.3% as at the end of FY’2021, from 6.9% at the end of FY’2020, while average yields from MMFs remained relatively unchanged at 8.8%, as was recorded at the end of FY’2020. The graph below highlights the performance;
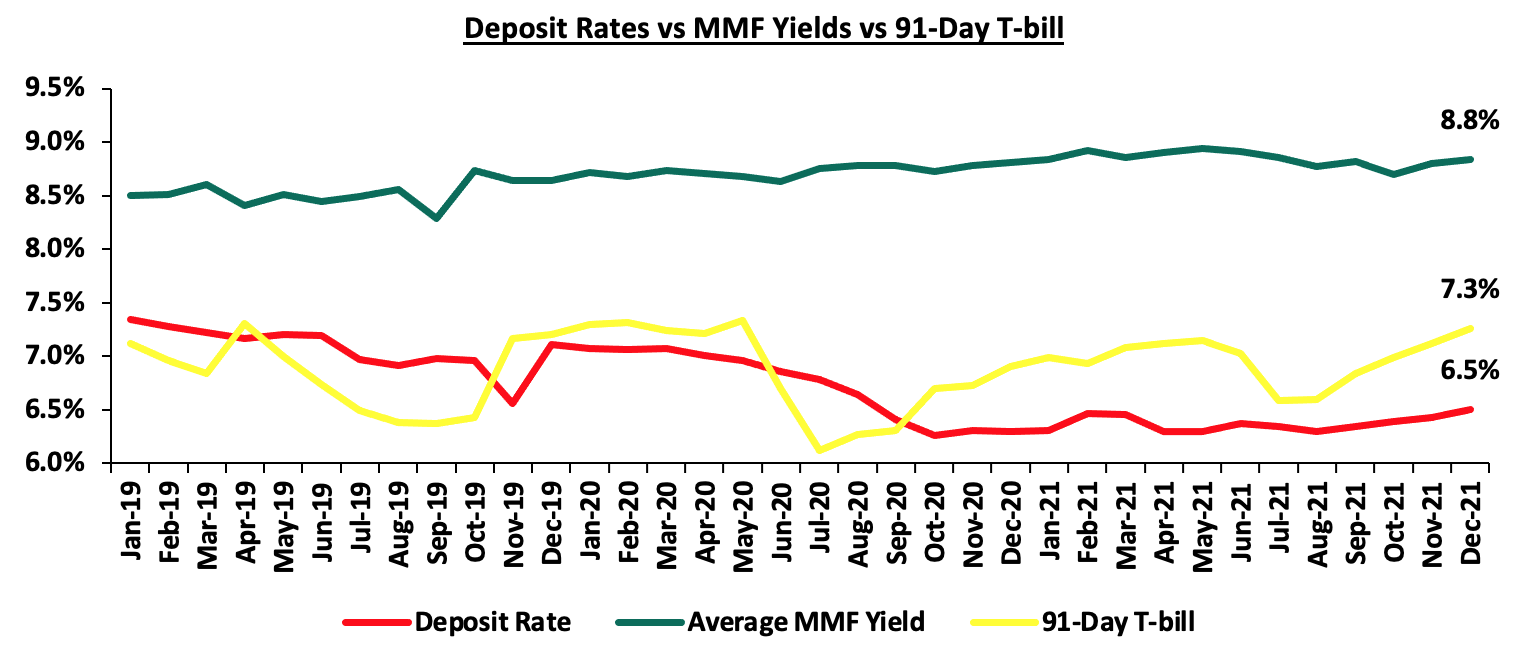
Source: Central Bank of Kenya, Cytonn Research
As per the regulations, funds in MMFs should be invested in liquid interest-bearing securities. These securities include bank deposits, fixed income securities listed on the Nairobi Securities Exchange (NSE) and securities issued by the Government of Kenya. The fund is best suited for investors who require a low-risk investment that offers capital stability, liquidity, and require a high-income yield. The fund is also a good safe haven for investors who wish to switch from a higher risk portfolio to a low risk portfolio, especially in times of uncertainty.
Top Five Money Market Funds by Yields
During the period under review, the following Money Market Funds had the highest average effective annual yield declared, with the Cytonn Money Market Fund having the highest effective annual yield at 10.6% against the industry average of 8.8%.
|
Top 5 Money Market Fund Yield in FY'2021 |
||
|
Rank |
Money Market Fund |
Effective Annual Rate (Average FY'2021) |
|
1 |
Cytonn Money Market Fund |
10.6% |
|
2 |
Zimele Money Market Fund |
9.9% |
|
3 |
Nabo Africa Money Market Fund |
9.9% |
|
4 |
Madison Money Market Fund |
9.4% |
|
5 |
Sanlam Money Market Fund |
9.3% |
|
|
Industry average |
8.8% |
Source: Cytonn Research
Section III: Comparing Unit Trust Funds AUM Growth with Bank Deposits Growth
Unit Trust Funds assets recorded a y/y growth of 28.6% in FY’2021, while the bank deposits recorded a growth of 10.4% over the same period. For both the Unit Trust Funds and bank deposits, this was lower than the values recorded as at FY’2020 of 37.6% and 13.2% respectively. The chart below highlights the Unit Trust Funds AUM growth vs bank deposits growth in FY’2021;
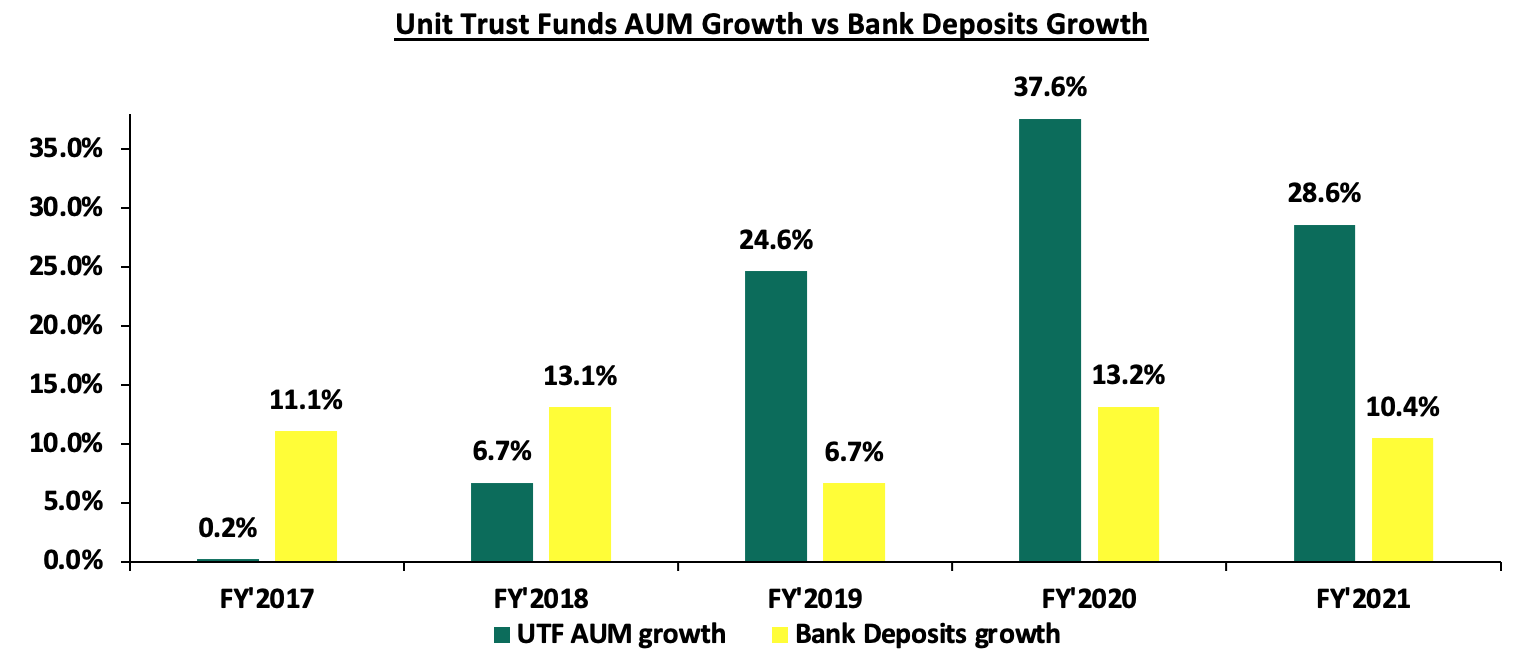
Source: Cytonn Research
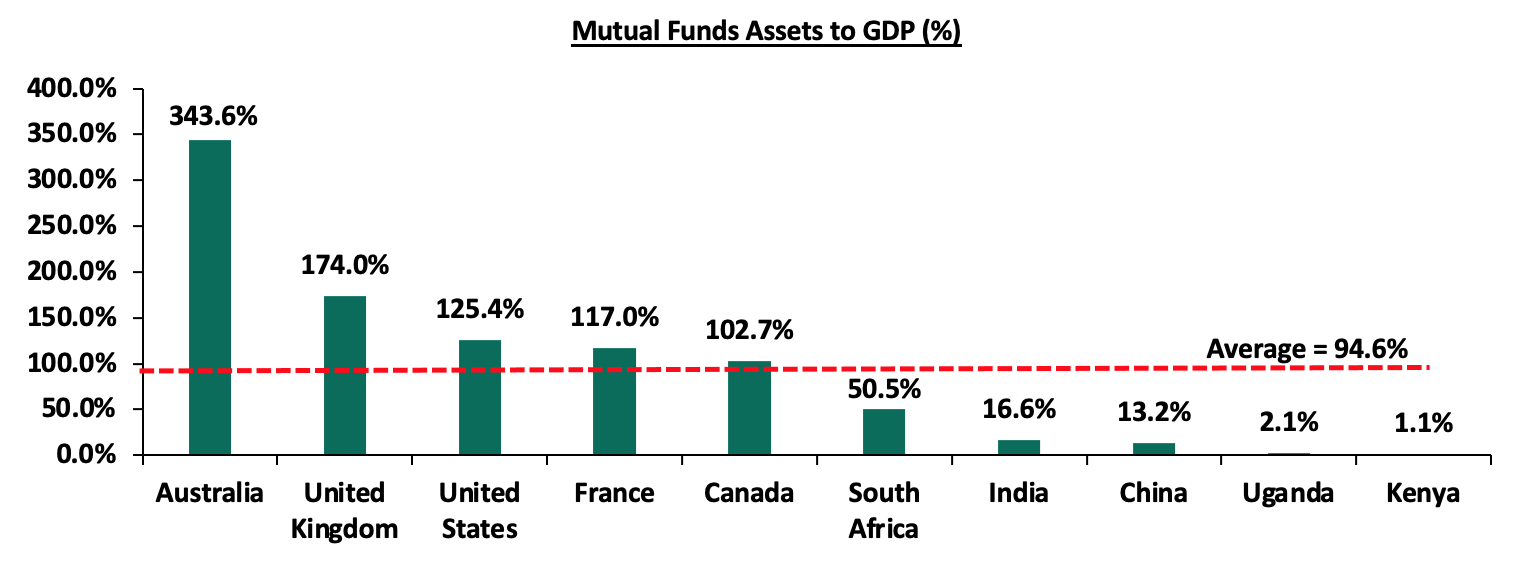
UTF’s growth at 28.6%, outpaced the listed banks deposits growth of 10.4%, and has historically been higher since FY’2019, an indication of relative and continued growth in our capital markets. However our capital markets remain constrained and according to World Bank data, in well-functioning economies, businesses rely on bank funding for a mere 40.0%, with the larger percentage of 60.0% coming from the Capital markets. Closer home, World Bank noted that businesses in Kenya relied on banks for 99.0% of their funding while less than 1.0% came from the capital markets. Notably, our Mutual Funds/UTFs to GDP ratio at 1.1% is still very low compared to an average of 94.6% amongst select global markets, indicating that we still have room to improve and enhance our capital markets. The table below shows some countries’ mutual funds as a percentage of GDP:
Source: Online research
Over the past 4 years, the UTFs AUM has grown at a CAGR of 23.9% to Kshs 134.7 bn in FY’2021, from Kshs 57.2 bn recorded in FY’2017. However, even at Kshs 134.7 bn, the industry is dwarfed by asset gatherers such as bank deposits at Kshs 4.4 tn and the pension industry at Kshs 1.5 tn as of the end of 2021. Below is a graph showing the sizes of different saving channels and capital market products in Kenya as at December 2021:
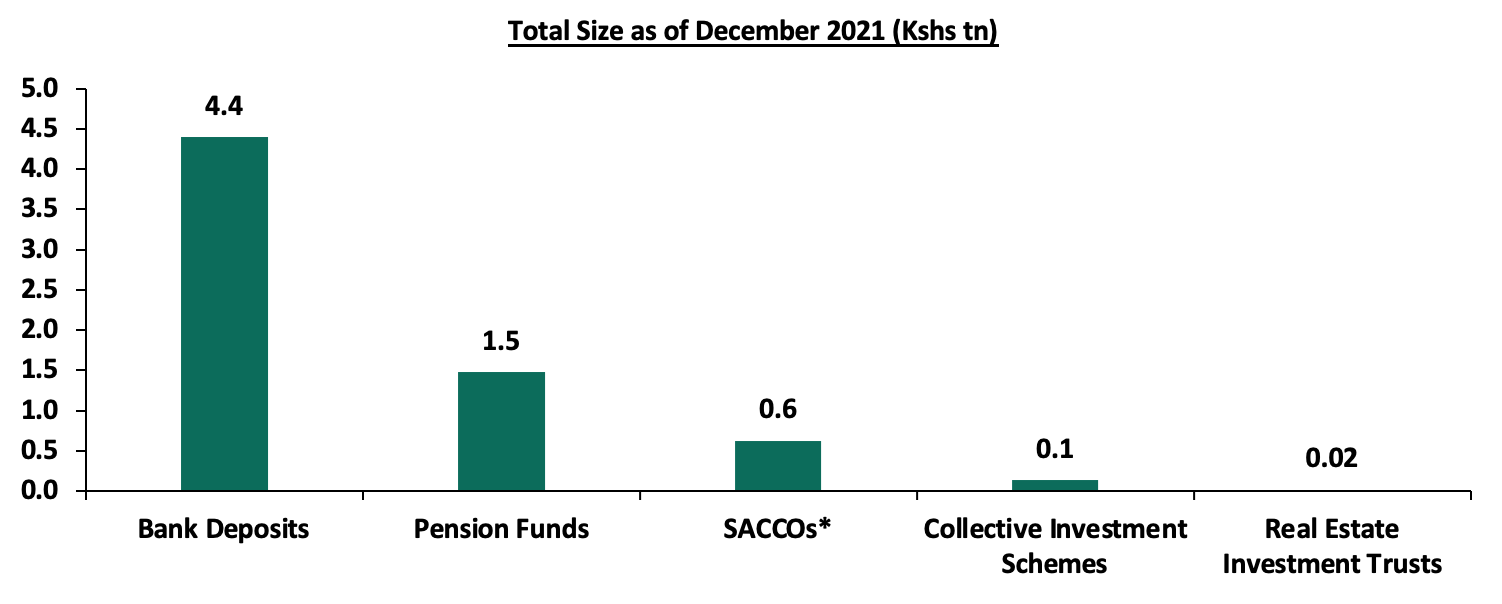
*Data as of December 2020
Source: CMA, RBA, CBK, SASRA Annual Reports and REITs Financial Statements
On a REITs to GDP Ratio, Kenya also still has a lot of room for improvement. The listed REITs capitalization as a percentage of GDP in Kenya stands at a paltry 0.07%, as compared to other countries such as Australia and South Africa at 7.9% and 7.8%, respectively as at 28th April 2022. Below is a graph showing comparison of Kenya’s REITs to GDP Ratio as compared to other countries:
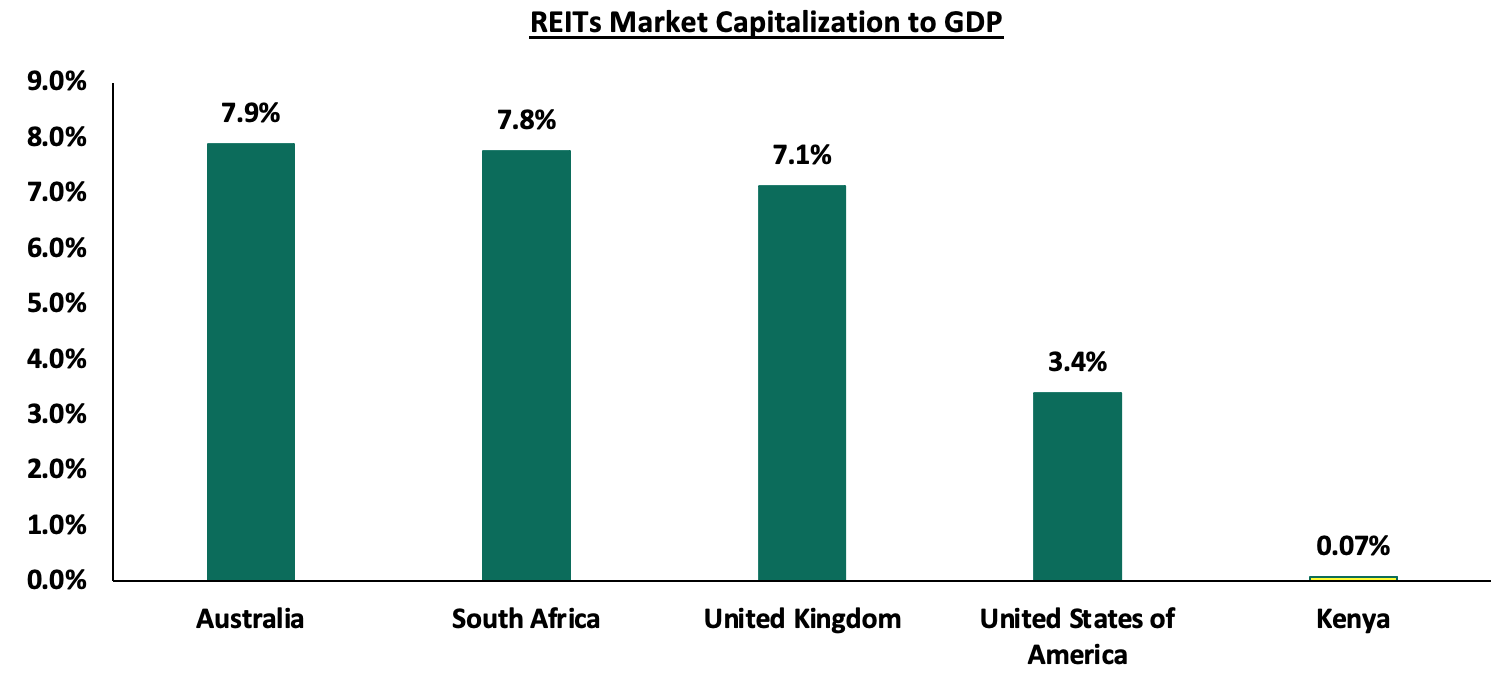
Source: Online research, Nairobi Securities Exchange (NSE)
Section IV: Recommendations
In order to improve our Capital Markets and stimulate its growth, we recommend the following actions:
- Reduce the minimum investments to reasonable amounts: Currently, the minimum investment for sector specific funds is Kshs 1.0 mn, while that for Development REITS is currently at Kshs 5.0 mn. The high minimum initial investments amounts are unreasonably high and as such, put off potential investors. According to the Kenya National Bureau of Statistics, 74.4% of all employees in the formal sector earn a median gross income of Kshs 50,000 or below per month. The high investment amounts, which are 100x the median gross income, therefore discriminate against most retail investors, giving them fewer investment choices. This is the key reason why the listed REITS to GDP ratio for Kenya remains at 0.07% compared to other countries such as Australia and South Africa at 7.9% and 7.8% respectively,
- Allow for sector funds: Under the current capital markets regulations, UTFs are required to diversify. Consequently, one has to seek special dispensation in the form of sector funds such as a financial services fund, a technology fund or a Real Estate Unit Trust Fund. Regulations allowing unit holders to invest in sector funds would go a long way in expanding the scope of unit holders interested in investing,
- Eliminate conflicts of interest in the governance of capital markets and allow different services such as the opening up of Trustees to non-financial institutions: The capital markets regulations should foster a governance structure that is more responsive to both market participants and market growth. Specifically, effectively restricting Trustees of Collective Investment Schemes to Banks only limits choices, especially given that banking markets and capital markets are in competition,
- Provide Support to Fund Managers: We are of the opinion that the regulator, CMA, needs to integrate market stabilization tools as part of the regulations/Act that will help Fund Managers meet fund obligations especially during times of distress such as mass withdrawals. We do commend and appreciate the regulator on its role on protecting investor interests. However, since Fund Managers also play a key role in the capital markets, the regulator should also be able to protect the brand image of various fund managers in the industry. This can be achieved by working together with industry players to resolve matters rather than alienating and publicly ostracizing industry players facing challenges as this may not particularly be in investors’ interest,
- Create increased competition in the market by encouraging different players to set up shop: Increased competition in capital markets will not only push Unit Trust Fund managers to provide higher returns for investors but will also eliminate conflicts of interest in markets and enhance the provision of innovative products and services,
- Improve fund transparency to provide investors with more information: Each Unit Trust Fund should be required to publish their portfolio holdings on a quarterly basis and make the information available to the public so as to enhance transparency for investors. Enhanced accountability by providing investors with more information will help both investors and prospects make better informed decisions and subsequently improve investor confidence, and,
- Supplement management of the Authority to include people with industry experience: having people with investment management and financial markets industry experience may bring relevant industry experience to resolve some of the capital markets obstacles.
In August 2021, the Capital Markets Authority (CMA) published two draft regulations; the Capital Markets (Collective Investment Schemes) Regulations 2021 and the Capital Markets (Collective Investment Schemes) (Alternative Investment Funds) Regulations 2021. The proposed regulations seek to update the current Collective Investment Scheme Regulations given the change in market dynamics since the last published Regulations in 2001, as well as address emerging issues. The move by CMA to review the current regulations is welcomed as it seems intended to improve the Capital Markets in Kenya by providing more versatile regulations and provide for existence of regulated funds that invest in alternative asset classes. However, it’s our view that proceeding with the regulations as proposed would not be ideal for the market. In our Draft CMA Investments Regulations topical, we analyzed these regulations and thereafter gave our recommendations on the areas of improvement. We continue to await and monitor developments from the CMA with regard to the draft regulations.
We believe that for continued growth of the capital markets, there is a need to leverage more on innovation and digitization in order to further propel the growth of UTFs in Kenya. The use of technology as a distribution channel for mutual fund products opens up the funds to the retail segment, which is characterized by strong demand among retail clients for convenient and innovative products. The regulators should promote and facilitate growth and diversification of UTFs, instead of impeding their expansion, which will enhance growth of capital markets and encourage entry of new players into the market.
Disclaimer: The views expressed in this publication are those of the writers where particulars are not warranted. This publication, which is in compliance with Section 2 of the Capital Markets Authority Act Cap 485A, is meant for general information only and is not a warranty, representation, advice or solicitation of any nature. Readers are advised in all circumstances to seek the advice of a registered investment advisor.

- Talk to us
- Kenya
- P.O Box 20695 - 00200, Nairobi, Kenya
- Cell +254709101200
- Tel +254709101200
- WhatsApp +254741676635
- United States
- +254709101200
- DOWNLOAD OUR APP
-


- Kenya
- 8th Floor, Pinetree Plaza, Kaburu Drive, Ngong Road, Nairobi, Kenya
- USA
- Suite 1150, 1775 Eye Street NW, USA, Washington DC 20006, USA
- Investments
- High Yield
- Private Equity
- Real Estate
- Real Estate
- RiverRun Estates
- Cytonn Towers
- The Ridge
- Taraji Heights
- The Alma