Cytonn Monthly - January 2026
By Research Team, Feb 1, 2026
Executive Summary
Fixed Income
During the month of January 2026, T-bills were oversubscribed, with the overall average subscription rate coming in at 110.8%, lower than the subscription rate of 126.5% recorded in December 2025. The overall average subscription rates for the 182-day papers increased to 75.8% from 37.7% recorded in December 2025 respectively while the subscription rates for the 91-day and 364-day papers decreased to 81.3% and 157.6% from 199.6% and 186.0% respectively recorded in December 2025. The average yields on the government papers were on a downward trajectory during the month, with the average 364-day, 91-day and 182-day papers yields decreasing by 7.9 bps, 4.7 bps, and 0.3 bps to 9.2%, 7.7% and 7.8% respectively, from an average of 9.3%, 7.8% and 7.8% recorded the previous month. For the month of January, the government accepted a total of Kshs 98.8 bn of the Kshs 106.4 bn worth of bids received in T-Bills, translating to an acceptance rate of 91.1%, compared to an acceptance rate of 92.9% in the month of January;
During the week, T-bills were oversubscribed for the first time in two weeks, with the overall subscription rate coming in at 196.7%, higher than the subscription rate of 76.5% recorded the previous week. Investors’ preference for the shorter 91-day paper persisted, with the paper receiving bids worth Kshs 6.4 bn against the offered Kshs 4.0 bn, translating to a subscription rate of 158.8%, higher than the subscription rate of 34.3%, recorded the previous week. The subscription rate for the 182-day paper decreased to 22.8% from the 88.3% recorded the previous week, while that of the 364-day papers increased significantly to 385.8% from 81.5% recorded the previous week. The government accepted a total of Kshs 47.18 bn worth of bids out of Kshs 47.21 bn bids received, translating to an acceptance rate of 99.9%. The yields on the government papers showed mixed performance with the yield on the 182-day and 364-day papers increasing by 0.7 bps and 0.6 bps to remain relatively unchanged at the 7.8% and 9.2% respectively compared to the previous week, while the yield on the 91-day paper decreased by 9.5 bps to 7.6% from the 7.7% recorded the previous week;
Additionally, January 2026 bonds were oversubscribed, with the overall average subscription rate coming in at 119.2%, albeit lower than the average subscription rate of 132.8% recorded in December 2025. The reopened bonds FXD1/2019/020 and FXD1/2022/025 with tenors to maturity of 13.2 years and 21.8 years respectively and fixed coupon rates of 12.9% and 14.2% respectively, received bids worth Kshs 71.5 bn against the offered Kshs 60.0 bn translating to an average subscription rate of 119.2%. The government accepted bids worth Kshs 60.6 bn, translating to an acceptance rate of 85.2%. The weighted average yield for the accepted bids for the FXD1/2019/020 and FXD1/2022/025 came in at 13.3% and 13.8% respectively;
The Monetary Policy Committee (MPC) is scheduled to meet on Tuesday, 10th February 2026, to review the outcome of its previous policy decisions and recent global and domestic economic developments, and to decide on the direction of the Central Bank Rate (CBR). In their previous meeting held on 9th December 2025, the committee noted that they would closely monitor the impact of the policy measures taken, as well as developments in the global and domestic economy, and stood ready to reconvene earlier if necessary;
The year-on-year inflation in January 2026 decreased by 0.1% points to 4.4% from the 4.5% recorded in December 2025 which is in line with our projection of a decrease to a range of 4.3%-4.4%. The price increase was primarily driven by a by a rise in prices of items in the Food and Nonalcoholic Beverages (7.3%); Transport (4.8%); and Housing, Water, Electricity, Gas and other fuels (2.2%); over the one-year period. The month-on-month inflation rate stood at 0.6% in January 2026;
During the week, the global ratings agency, Moody’s announced its upgrade of Kenya’s sovereign credit rating from Caa1 to B3, while revising the outlook to Stable from Positive, on the back of a reduction in near-term default risk and strengthened external liquidity;
During the week, the global ratings agency, Fitch Ratings affirmed Kenya’s credit rating at B-, maintaining the Stable outlook in a review dated 23rd January 2026. The affirmation follows an earlier review in July 2025, which also maintained the B- rating after a prior was downgrade in January 2025 from a credit rating of B in August 2024, while maintaining the Stable outlook. Fitch cited Kenya’s strengthened foreign exchange reserves, which have moderated external liquidity pressures, and the country’s economic resilience as key factors supporting the rating. Real GDP growth is projected at 4.9% in 2025, up from 4.7% in 2024, supported by a rebound in private-sector activity;
Equities
During the month of January, the equities market was on an upward trajectory, with NSE 20, NASI, NSE 25 and NSE 10 gaining by 5.1%, 4.7%, 4.4% and 4.2% respectively. The equities market performance was mainly driven by gains recorded by large-cap stocks such as Cooperative Bank, ABSA and DTB-K of 13.6%, 13.2% and 12.7% respectively. The performance was, however, weighed down by losses by large cap stocks such as EABL of 1.7%;
During the week, the equities market was on an upward trajectory, with NSE 20, NSE 10, NASI and NSE 25 gaining by 1.0%, 0.9%, 0.4% and 0.4% respectively, taking the YTD performance to gains of 5.0%, 4.3%, 4.0% and 3.6% for NSE 20, NASI, NSE 25 and NSE 10 respectively. The week-on-week equities market performance was driven by gains recorded by large-cap stocks such as DTB-K, EABL and ABSA of 10.3%, 7.4% and 5.7% respectively. However, the performance was weighed down losses recorded by large cap stocks such as NCBA, Equity and Cooperative Bank of 5.1%, 2.5% and 0.9% respectively;
Also, during the month, the banking sector index gained by 5.6% to close at 215.0 from the 203.7 recorded at the end of the December 2025. This was attributable to gains recorded by large-cap stocks such as Cooperative Bank, ABSA and DTB-K of 13.6%, 13.2% and 12.7% respectively;
However, during the week, the banking sector index declined by 0.3% to 215.0 from 215.8 recorded the previous week. This is attributable to losses recorded by large cap stocks such as NCBA, Equity and Cooperative Bank of 5.1%, 2.5% and 0.9% respectively. However, the performance was supported by gains recorded by large cap stocks such as DTB-K, ABSA and Standard Chartered of 10.3%, 5.7% and 0.7% respectively;
During the week, East African Breweries Plc (EABL) released their HY’2026 financial results for the year ending 31st December 2025, recording a 37.7% increase in the Profits After Tax (PAT) to Kshs 11.2 bn in HY’2026, from Kshs 8.1 bn in HY’2025. The increase was mainly attributable to the 36.8% decrease in finance costs to Kshs 2.2 bn from Kshs 3.4 bn in HY’2025, coupled with a 11.1% increase in net revenue to Kshs 75.5 bn from Kshs 67.9 bn in HY’2025.The growth in PAT was, however, weighed down by the 91.8% decrease in Forex income to Kshs 0.1 bn in HY’2026 from Kshs 1.2 bn in HY’2025 and 0.2% increase in the operating costs to Kshs 13.8 bn in HY’2026, from Kshs 13.7 bn in HY’2025;
Real Estate
During the week, Hass Consult, a Kenyan consulting and Real Estate development firm, released its Housing Index Q4’2025 Report , focusing on the residential Real Estate sector's performance in the Nairobi Metropolitan Area (NMA);
During the week, Hass Consult also released Land Price Index Q4’2025 Report which highlighted the performance of the Real Estate land sector in the Nairobi Metropolitan Area (NMA);
During the week, the Kenyan government announced plans to issue a Kshs 175.0 bn roads bond in February, to be released in tranches rather than as a single issue, with preference given to investment clubs over the open market. The bond will be issued by the Kenya Roads Board (KRB) and its proceeds will primarily be used to settle pending bills owed to contractors and repay loans taken from commercial banks;
On the Unquoted Securities Platform, Acorn D-REIT and I-REIT traded at Kshs 27.4 and Kshs 23.2 per unit, respectively, as per the last updated data on 30th January 2026. Additionally, ILAM Fahari I-REIT traded at Kshs 11.0 per share as of 30th January 2026 representing a 45.0% loss from the Kshs 20.0 inception price.
Investment Updates:
- Weekly Rates: Cytonn Money Market Fund closed the week at a yield of 11.9% p.a. To invest, dial *809# or download the Cytonn App from Google Play store here or from the Appstore here;
- We continue to offer Wealth Management Training every Tuesday, from 7:00pm to 8:00 pm. The training aims to grow financial literacy among the general public. To register for any of our Wealth Management Trainings, click here;
- If interested in our Private Wealth Management Training for your employees or investment group, please get in touch with us through wmt@cytonn.com;
- Cytonn Insurance Agency acts as an intermediary for those looking to secure their assets and loved ones’ future through insurance namely; Motor, Medical, Life, Property, WIBA, Credit and Fire and Burglary insurance covers. For assistance, get in touch with us through insuranceagency@cytonn.com;
- Cytonn Asset Managers Limited (CAML) continues to offer pension products to meet the needs of both individual clients who want to save for their retirement during their working years and Institutional clients that want to contribute on behalf of their employees to help them build their retirement pot. To more about our pension schemes, kindly get in touch with us through pensions@cytonn.com;
Hospitality Updates:
- We currently have promotions for Staycations. Visit cysuites.com/offers for details or email us at sales@cysuites.com;
Money Markets, T-Bills Primary Auction:
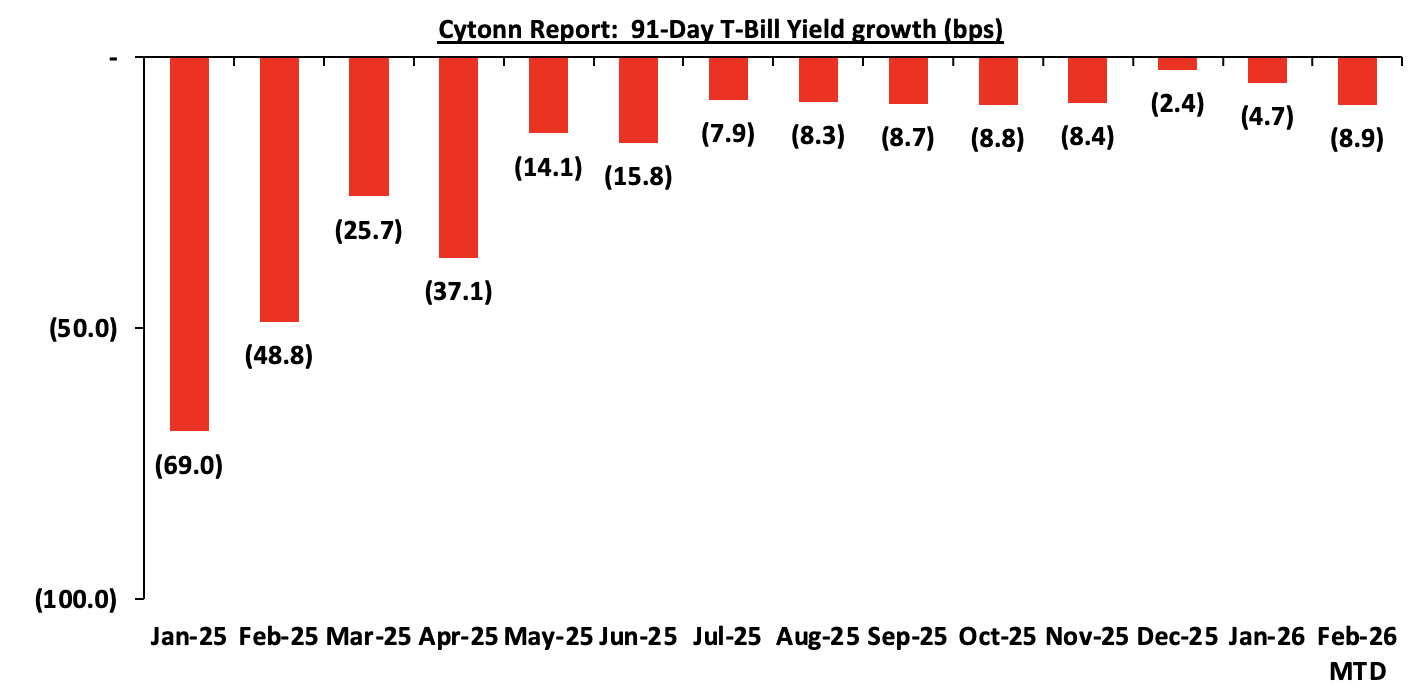
For the month of January 2026, T-bills were oversubscribed, with the overall average subscription rate coming in at 110.8%, lower than the subscription rate of 126.5% recorded in December 2025. The overall average subscription rates for the 182-day papers increased to 75.8% from 37.7% recorded in December 2025 respectively while the subscription rates for the 91-day and 364-day papers decreased to 81.3% and 157.6% from 199.6% and 186.0% recorded in December 2025. The average yields on the government papers were on a downward trajectory during the month, with the average 364-day, 91-day and 182-day papers yields decreasing by 7.9 bps, 4.7 bps, and 0.3 bps to 9.2%, 7.7% and 7.8% respectively, from an average of 9.3%, 7.8% and 7.8% recorded the previous month. For the month of January, the government accepted a total of Kshs 98.8 bn of the Kshs 106.4 bn worth of bids received in T-Bills, translating to an acceptance rate of 91.1%, compared to an acceptance rate of 92.9% in the month of January.
The chart below shows the yield growth rate for the 91-day paper in 2025 and February 2026:
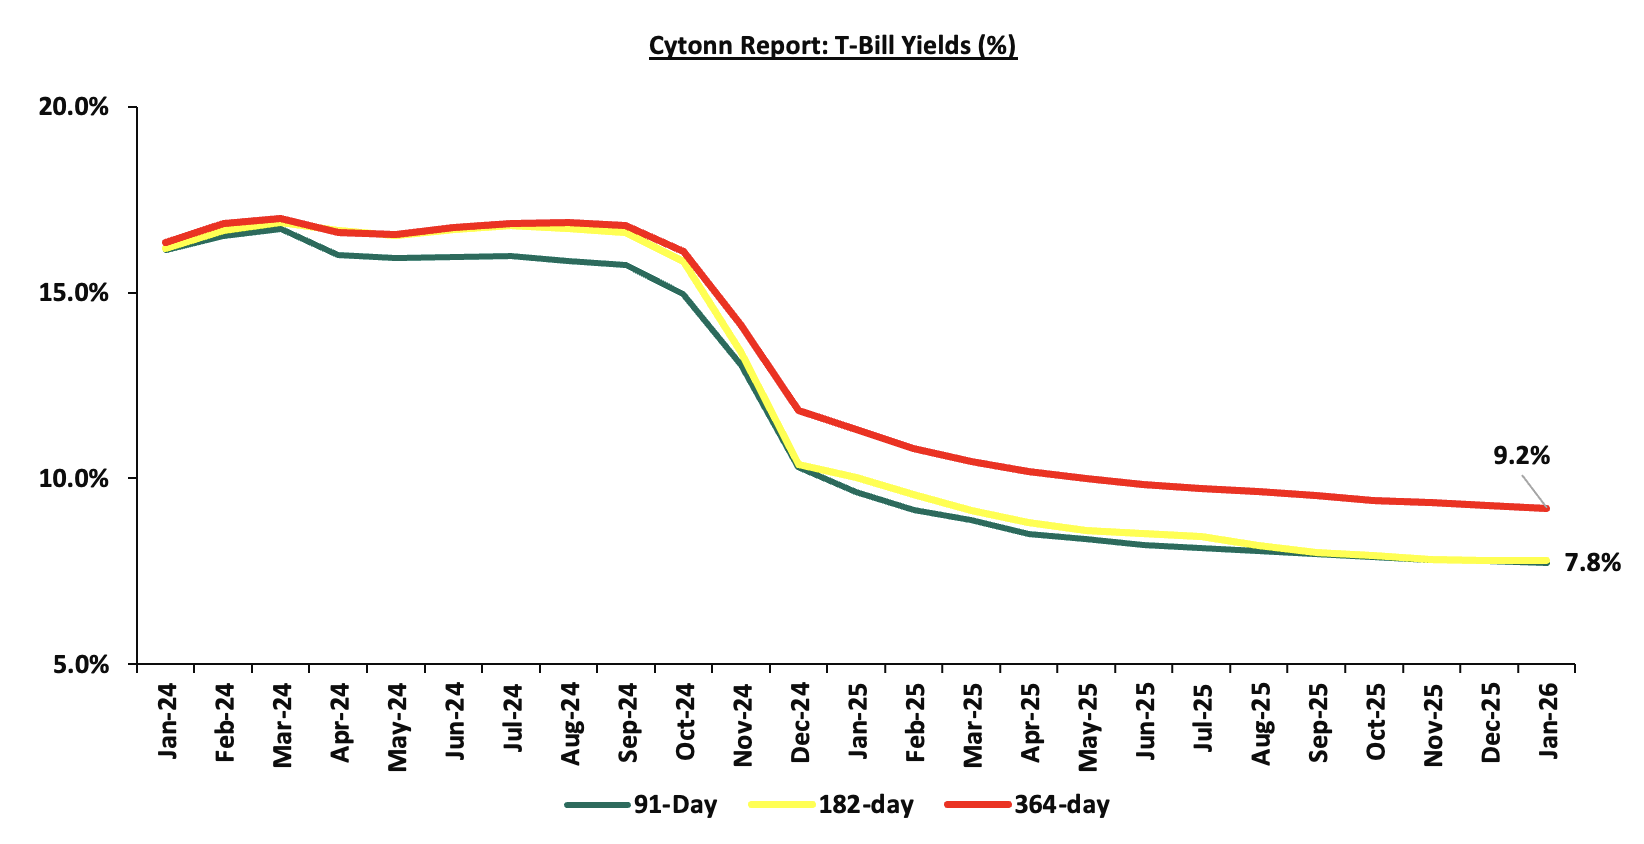
This week, T-bills were oversubscribed for the first time in two weeks, with the overall subscription rate coming in at 196.7%, higher than the subscription rate of 76.5% recorded the previous week. Investors’ preference for the shorter 91-day paper persisted, with the paper receiving bids worth Kshs 6.4 bn against the offered Kshs 4.0 bn, translating to a subscription rate of 158.8%, higher than the subscription rate of 34.3%, recorded the previous week. The subscription rate for the 182-day paper decreased to 22.8% from the 88.3% recorded the previous week, while that of the 364-day papers increased significantly to 385.8% from 81.5% recorded the previous week. The government accepted a total of Kshs 47.18 bn worth of bids out of Kshs 47.21 bn bids received, translating to an acceptance rate of 99.9%. The yields on the government papers showed mixed performance with the yield on the 182-day and 364-day papers increasing by 0.7 bps and 0.6 bps to remain relatively unchanged at the 7.8% and 9.2% respectively compared to the previous week, while the yield on the 91-day paper decreased by 9.5 bps to 7.6% from the 7.7% recorded the previous week.
The charts below show the performance of the 91-day, 182-day and 364-day papers from January 2024 to January 2026:
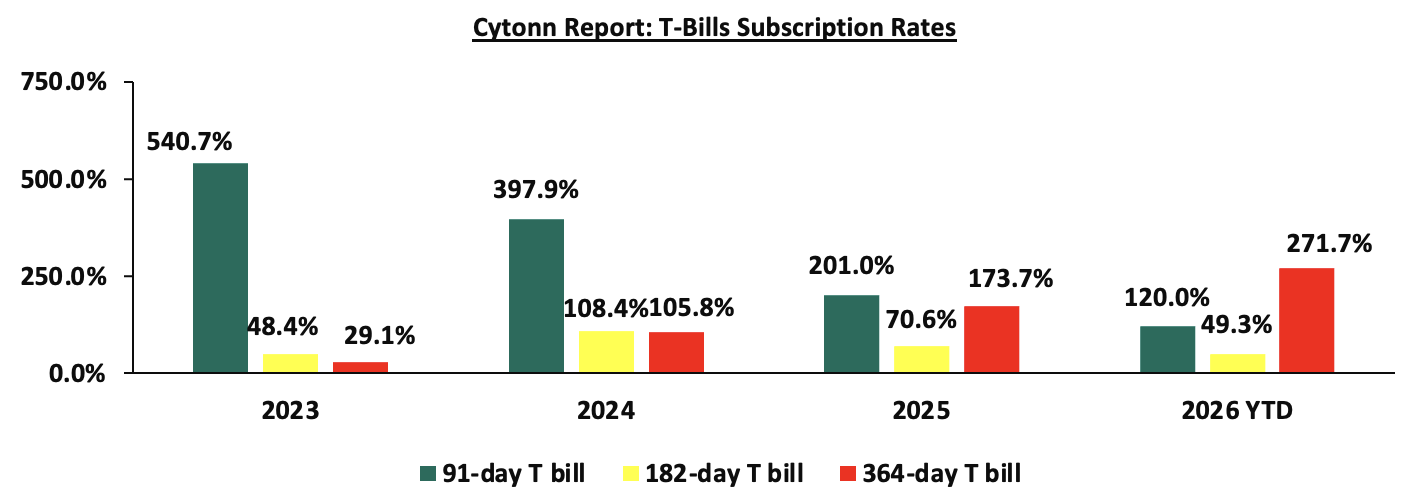
So far in the current FY’2025/26, government securities totaling Kshs 1,224.0 bn have been advertised. The government has accepted bids worth Kshs 1,530.4 bn, of which Kshs 824.6 bn and Kshs 705.8 bn were treasury bills and bonds, respectively. Total redemptions so far in FY’2025/26 equal to Kshs 757.9 bn, with treasury bills accounting for the entire amount. As a result, the government has a domestic borrowing surplus of Kshs 772.5 bn in FY’2025/26.
The chart below compares the overall average T-bill subscription rates obtained in 2023,2024, 2025 and 2026 Year-to-date (YTD):
Additionally, January 2026 bonds were oversubscribed, with the overall average subscription rate coming in at 125.8%, lower than the average subscription rate of 132.8% recorded in December 2025. The reopened bonds FXD1/2019/020 and FXD1/2022/025 with tenors to maturity of 13.2 years and 21.8 years respectively and fixed coupon rates of 12.9% and 14.2% respectively, received bids worth Kshs 71.5 bn against the offered Kshs 60.0 bn translating to an average subscription rate of 119.2%. The government accepted bids worth Kshs 60.6 bn, translating to an acceptance rate of 85.2%. The weighted average yield for the accepted bids for the FXD1/2019/020 and FXD1/2022/025 came in at 13.3% and 13.8% respectively.
The table below provides more details on the bonds issued in December 2025 and January 2026:
|
Cytonn Report: Bond Issuances for December 2025-January 2026 |
||||||||||
|
Issue Date |
Bond Auctioned |
Effective Tenor to Maturity (Years) |
Coupon |
Amount offered (Kshs bn) |
Actual Amount Raised/Accepted (Kshs bn) |
Total bids received (Subscription) |
Average Accepted Yield |
Subscription Rate |
Acceptance Rate |
|
|
19-Jan |
FXD1/2022/015-Switch |
11.3 |
13.9% |
20.0 |
25.2 |
26.5 |
13.2% |
132.46 |
95.03% |
|
|
12-Jan |
FXD1/2019/020 - Reopened |
13.2 |
12.9% |
60.0 |
20.2 |
23.4 |
13.3% |
119.24% |
86.63% |
|
|
FXD1/2022/025-Reopened |
21.8 |
14.2% |
40.3 |
48.2 |
13.8% |
83.73% |
||||
|
8-Dec |
SDB1/2021/030-Reopened |
15.2 |
12.0% |
40.0 |
3.9 |
4.6 |
13.3% |
132.83% |
85.00% |
|
|
FXD1/2021/025-Reopened |
20.4 |
13.9% |
43.2 |
48.5 |
13.6% |
89.01% |
||||
|
January 2026 Average |
15.4 |
13.7% |
80.00 |
85.8 |
98.0 |
13.4% |
125.8% |
88.5% |
||
|
December 2025 Average |
17.8 |
13.0% |
40.00 |
47.1 |
53.1 |
13.5% |
132.8% |
87.0% |
||
|
2025 Average |
13.6 |
13.2% |
44.4 |
34.8 |
53.0 |
13.7% |
201.8% |
83.9% |
||
Secondary Bond Market:
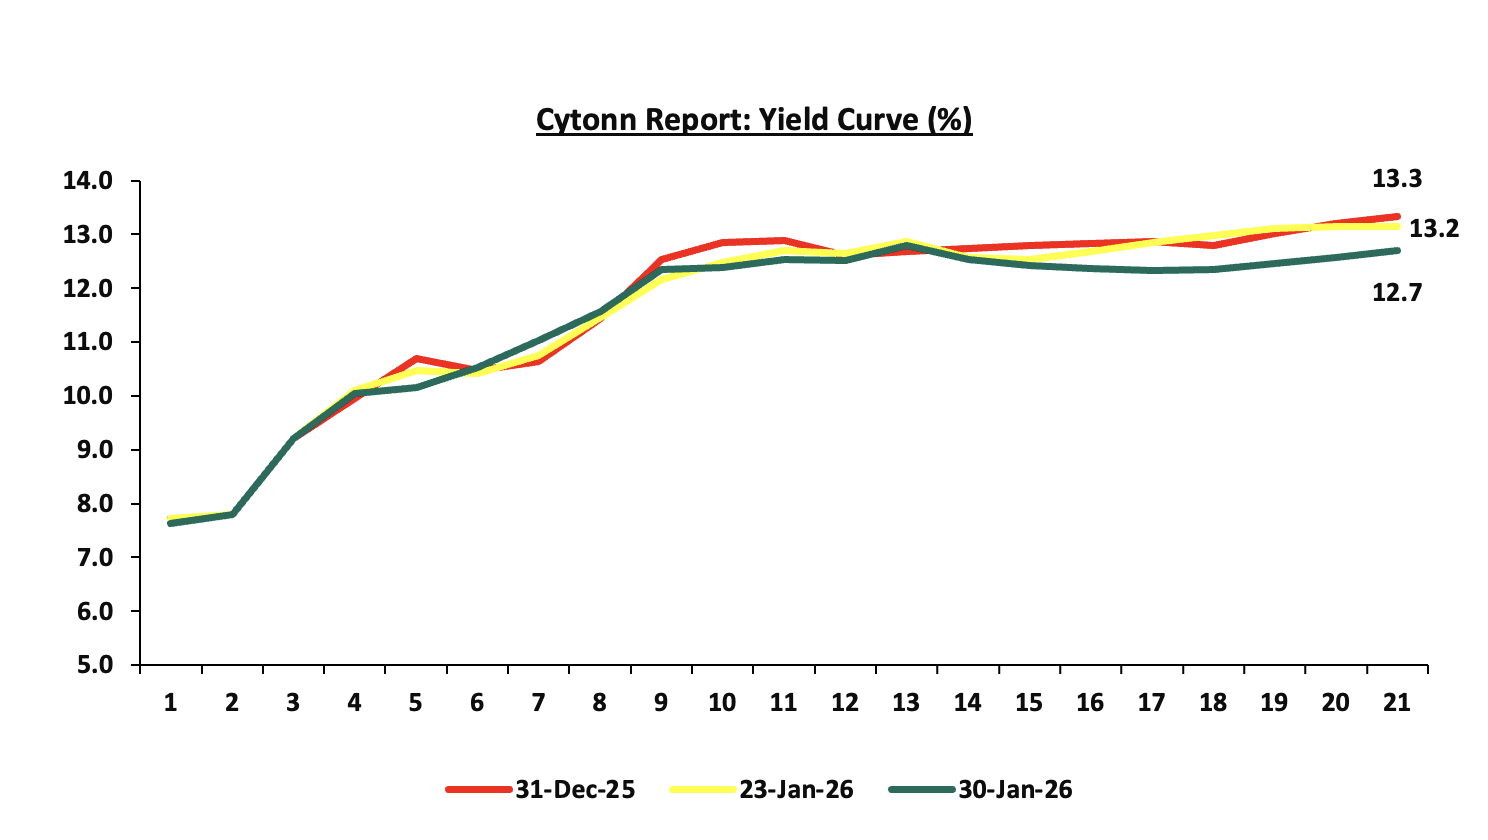
The yields on the government securities recorded a mixed performance during the month of January similar to December. Investors, apprehensive about the economic outlook in the long term, are demanding higher yields for bonds in the 15 to 21-year maturity range to compensate for the perceived risks as they anticipate potential fluctuations in economic conditions in the Kenyan market on the back of the government’s debt sustainability concerns. Notably, the yield curve adjusted to a normal upward sloping curve, with long-term bonds registering highest yields. The shift in sentiment indicates increased confidence in the short-term economic landscape, in comparison to the last two years. The chart below shows the yield curve movement during the period:
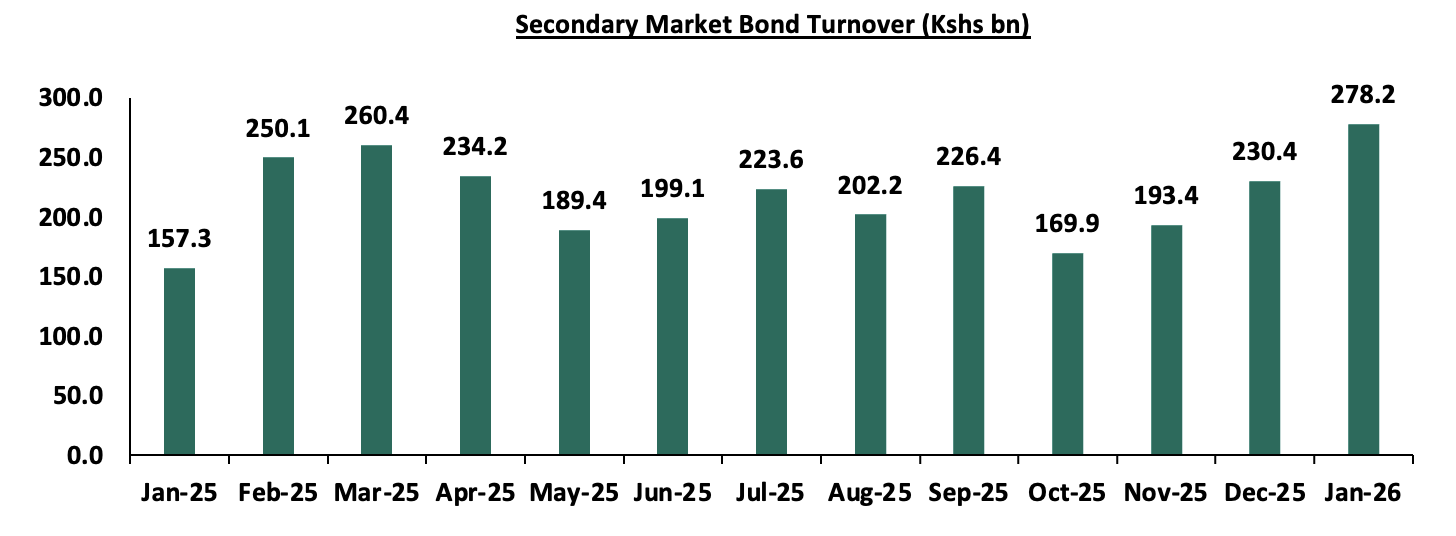
The secondary bond turnover increased by 20.7% to Kshs 278.2 bn, from Kshs 230.4 bn recorded in December 2025, pointing towards increased activities by commercial banks in the secondary bonds market for the month of January. On a year-on-year basis, the bond turnover increased by 76.9% from Kshs 157.3 bn worth of treasury bonds transacted over a similar period last year. The chart below shows the bond turnover over the past 12 months.
Money Market Performance:
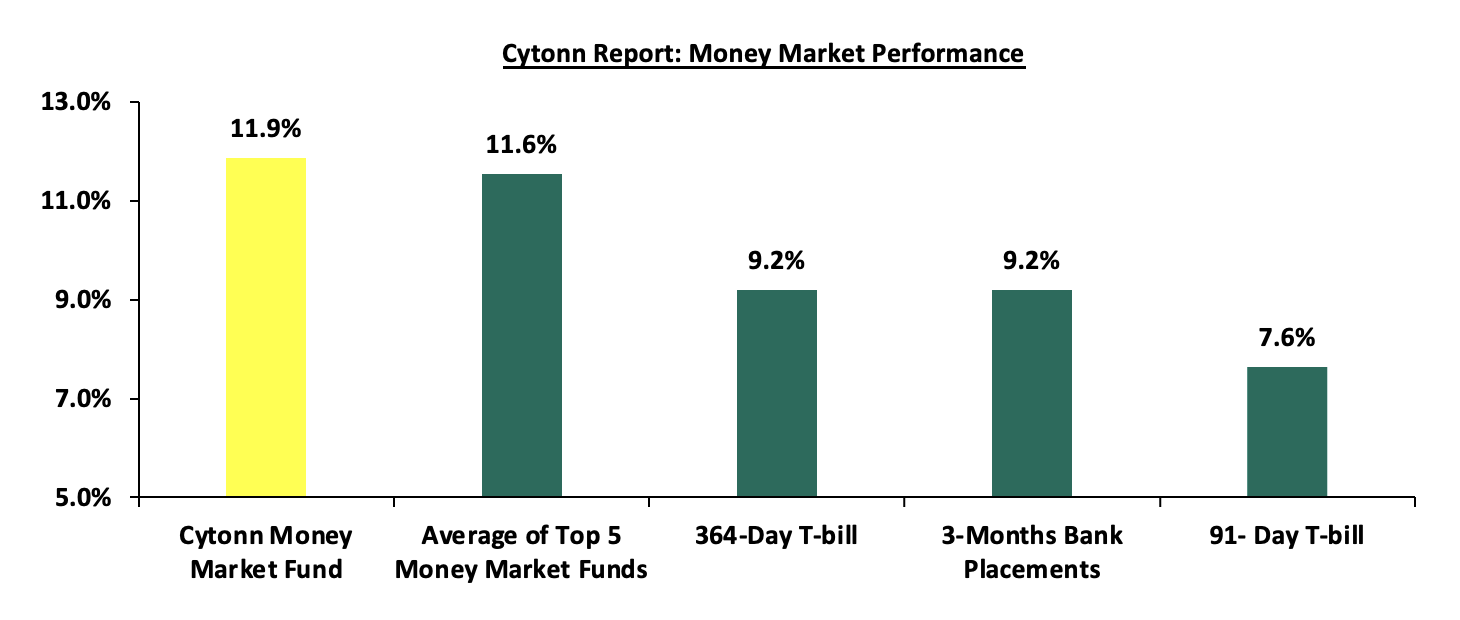
In the money markets, 3-month bank placements ended the week at 9.2% (based on what we have been offered by various banks). The yields on the 364-day papers increased by 0.6 bps to remain relatively unchanged from the 9.2% recorded the previous week, while the 91-day paper decreased by 9.5 bps to 7.6% from the 7.7% recorded the previous week and the yield on the Cytonn Money Market Fund increased by 14.0 bps to 11.9% from 11.7% recorded in the previous week, while the average yields on the Top 5 Money Market Funds increased by 8.0 bps to 11.6% from the 11.5% recorded the previous week.
 The table below shows the Money Market Fund Yields for Kenyan Fund Managers as published on 30th January 2026:
|
Money Market Fund Yield for Fund Managers as published on 30th January 2026 |
||
|
Rank |
Fund Manager |
Effective Annual Rate |
|
1 |
Cytonn Money Market Fund ( Dial *809# or download Cytonn App) |
11.9% |
|
2 |
Arvocap Money Market Fund |
11.8% |
|
3 |
Nabo Africa Money Market Fund |
11.8% |
|
4 |
Etica Money Market Fund |
11.2% |
|
5 |
Enwealth Money Market Fund |
11.1% |
|
6 |
Ndovu Money Market Fund |
11.1% |
|
7 |
Lofty-Corban Money Market Fund |
11.0% |
|
8 |
Gulfcap Money Market Fund |
10.8% |
|
9 |
Kuza Money Market fund |
10.5% |
|
10 |
Jubilee Money Market Fund |
10.3% |
|
11 |
Old Mutual Money Market Fund |
10.2% |
|
12 |
Orient Kasha Money Market Fund |
10.0% |
|
13 |
British-American Money Market Fund |
9.9% |
|
14 |
Madison Money Market Fund |
9.9% |
|
15 |
GenAfrica Money Market Fund |
9.7% |
|
16 |
Dry Associates Money Market Fund |
9.6% |
|
17 |
SanlamAllianz Money Market Fund |
9.6% |
|
18 |
Apollo Money Market Fund |
9.5% |
|
19 |
KCB Money Market Fund |
9.1% |
|
20 |
Faulu Money Market Fund |
9.0% |
|
21 |
Genghis Money Market Fund |
8.7% |
|
22 |
CIC Money Market Fund |
8.5% |
|
23 |
ICEA Lion Money Market Fund |
8.3% |
|
24 |
CPF Money Market Fund |
8.3% |
|
25 |
Co-op Money Market Fund |
8.2% |
|
26 |
Mali Money Market Fund |
8.2% |
|
27 |
Absa Shilling Money Market Fund |
7.5% |
|
28 |
Mayfair Money Market Fund |
7.0% |
|
29 |
Ziidi Money Market Fund |
6.1% |
|
30 |
AA Kenya Shillings Fund |
6.1% |
|
31 |
Stanbic Money Market Fund |
5.7% |
|
32 |
Equity Money Market Fund |
4.9% |
Source: Business Daily
Liquidity:
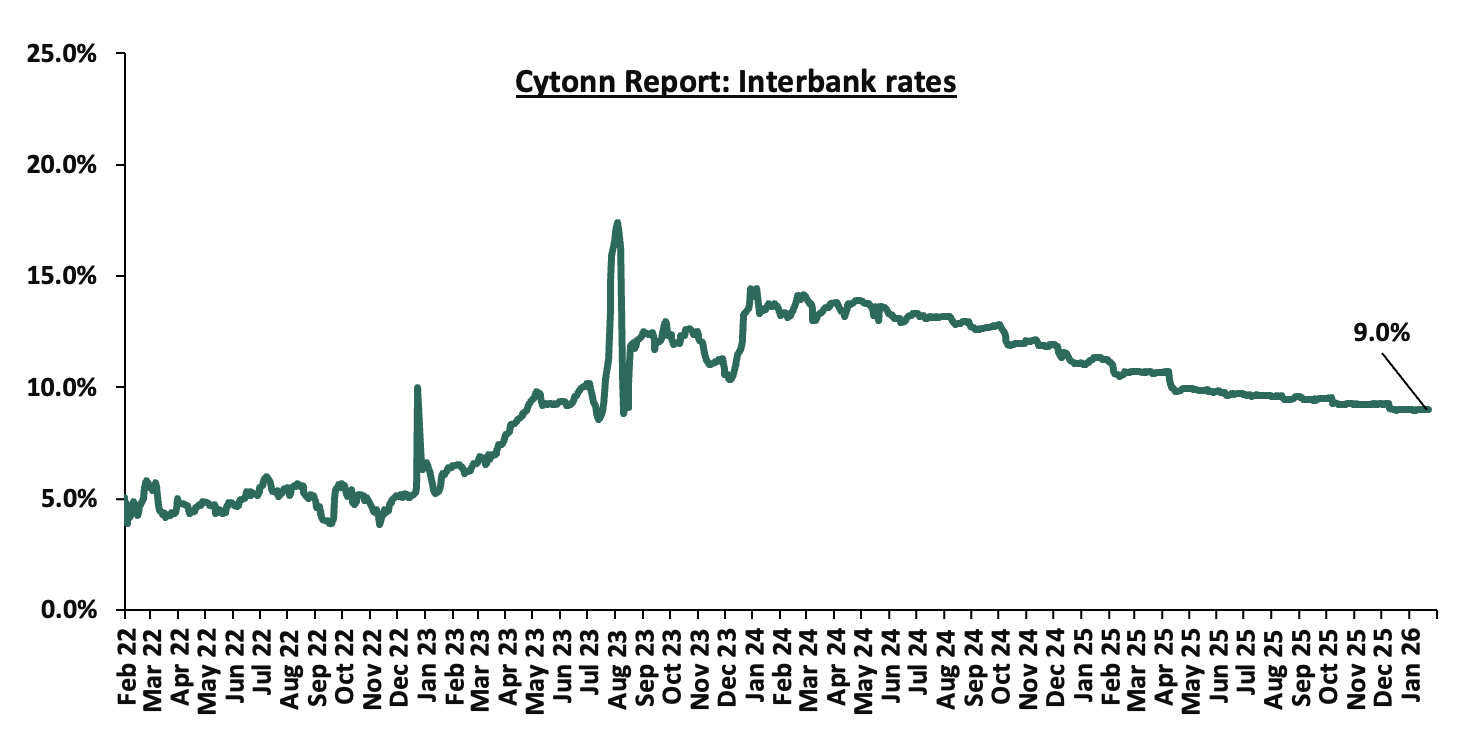
Liquidity in the money markets eased in the month of January 2026, with the average interbank rate decreasing by 10.3 bps to 9.0% from 9.1% recorded the previous month. The average interbank volumes traded increased by 11.4% to Kshs 11.8 bn, from Kshs 10.6 bn recorded in December 2025. Additionally, during the week, liquidity in the money markets eased, with the average interbank rate decreasing by 0.5 bps, to remain relatively unchanged from the 9.0% from recorded the previous week, partly attributable to government payments that offset tax remittances. The average interbank volumes traded increased by 3.3% to Kshs 12.5 bn from Kshs 12.1 bn recorded the previous week. The chart below shows the interbank rates in the market over the years:
Kenya Eurobonds:
During the month, the yields on the Eurobonds were on a downward trajectory, with the yield on the 7-year Eurobond issued in 2024 decreasing the most by 31.1 bps to 6.8% from 7.1% recorded at the end of December 2025. Similarly, during the week, the yields on the Eurobonds were on a downward trajectory with the yield on the 7-year Eurobond issued in 2024 decreasing the most by 14.0 bps to 6.8% from 6.9% recorded the previous week. The table below shows the summary performance of the Kenyan Eurobonds as of 29th January 2026;
|
|
2018 |
2019 |
2021 |
2024 |
2025 |
|||||
|
Tenor |
10-year issue |
30-year issue |
12-year issue |
13-year issue |
7-year issue |
11-year issue |
||||
|
Amount Issued (USD) |
1.0 bn |
1.0 bn |
1.2 bn |
1.0 bn |
1.5 bn |
1.5 bn |
||||
|
Years to Maturity |
2.5 |
22.5 |
6.7 |
8.8 |
5.5 |
10.5 |
||||
|
Yields at Issue |
7.3% |
8.3% |
7.9% |
6.2% |
10.4% |
9.9% |
||||
|
31-Dec-25 |
6.0% |
8.8% |
7.2% |
7.8% |
7.1% |
|
||||
|
2-Jan-26 |
6.1% |
8.8% |
7.2% |
7.8% |
7.1% |
|
||||
|
22-Jan-26 |
6.1% |
8.8% |
7.2% |
7.9% |
6.9% |
|
||||
|
23-Jan-26 |
6.1% |
8.8% |
7.2% |
7.9% |
6.9% |
|
||||
|
26-Jan-26 |
6.0% |
8.8% |
7.2% |
7.8% |
6.9% |
|
||||
|
27-Jan-26 |
6.0% |
8.7% |
7.2% |
7.8% |
6.9% |
|
||||
|
28-Jan-26 |
6.0% |
8.7% |
7.1% |
7.8% |
6.8% |
9.95% |
||||
|
29-Jan-26 |
6.0% |
8.7% |
7.1% |
7.8% |
6.8% |
|
||||
|
Weekly Change |
(0.1%) |
(0.1%) |
(0.1%) |
(0.1%) |
(0.1%) |
0.0% |
||||
|
M/M Change |
0.0% |
(0.1%) |
(0.1%) |
0.0% |
(0.3%) |
0.0% |
||||
|
YTD Change |
0.0% |
(0.1%) |
(0.1%) |
0.0% |
(0.3%) |
0.0% |
||||
Source: Central Bank of Kenya (CBK) and National Treasury
Kenya Shilling:
During the month, the Kenya Shilling depreciated marginally by 1.5 bps against the US Dollar, to remain relatively unchanged from the Kshs 129.0 recorded at the end of December.
During the week, the Kenya Shilling depreciated marginally against the US Dollar by 0.8 bps, to remain relatively unchanged from the Kshs 129.0 recorded the previous week. On a year-to-date basis, the shilling has appreciated by 1.5 bps against the dollar, lower than the 22.9 bps appreciation recorded in 2025.
We expect the shilling to be supported by:
- Diaspora remittances standing at a cumulative USD 5,036.7 mn in the 12 months to December 2025, 1.9% higher than the USD 4,945.2 mn recorded over the same period in 2024. In the December 2025 diaspora remittances figures, North America remained the largest source of remittances to Kenya accounting for 53.3% in the period, and,
- Tourism inflows, which strengthened significantly. Tourism receipts reached Kshs 560.0 bn in 2025, up from Kshs 452.2 bn in 2024, representing a 23.9% increase, supported by improved international arrivals through the country’s major airports, and,
- Improved forex reserves currently at USD 12.3 bn (equivalent to 5.3-months of import cover), which is above the statutory requirement of maintaining at least 4.0-months of import cover and above the EAC region’s convergence criteria of 4.5-months of import cover.
The shilling is however expected to remain under pressure in 2026 as a result of:
- An ever-present current account deficit which came at 2.2% of GDP in the twelve months to October 2025, and,
- The need for government debt servicing, continues to put pressure on forex reserves given that 59.7% of Kenya’s external debt is US Dollar-denominated as of June 2025.
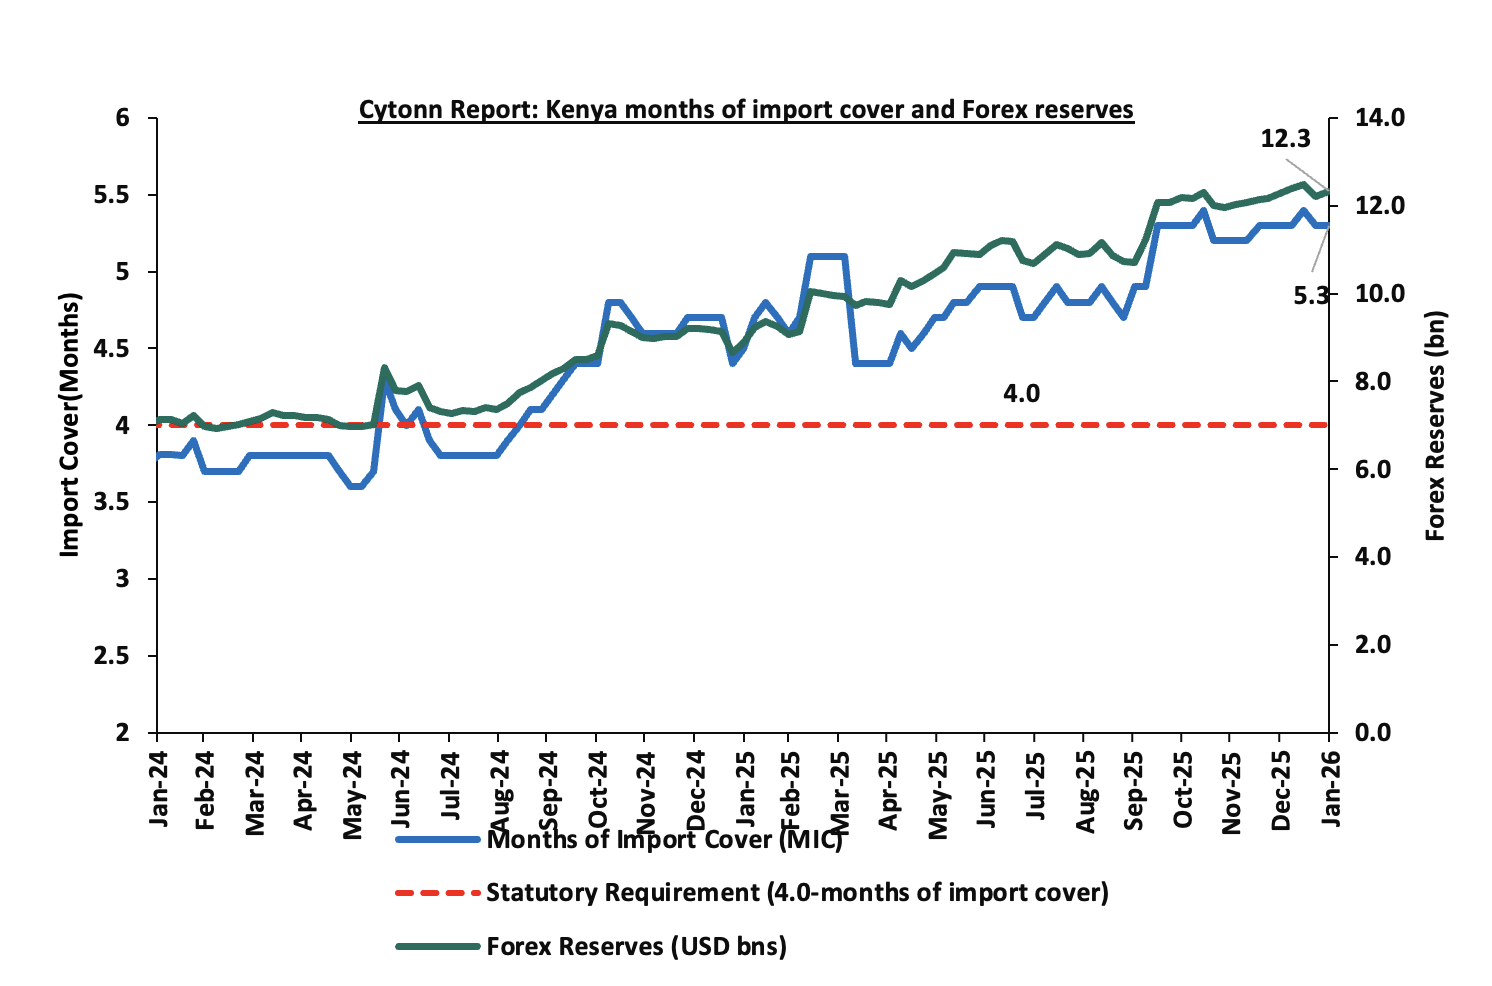
Key to note, Kenya’s forex reserves decreased by 0.5% during the month of January 2026, to USD 12.3 bn, from the USD 12.4 bn recorded in the previous month, equivalent to 5.3 months of import cover and above the statutory requirement of maintaining at least 4.0-months of import cover. Additionally, during the month, the months of import cover remained unchanged from 5.3 months recorded in the previous month. Additionally, during the week, Kenya’s forex reserves increased by 0.9% to USD 12.3 bn from the USD 12.2 bn recorded the previous week, equivalent to 5.3 months of import cover, and above the statutory requirement of maintaining at least 4.0-months of import cover.
The chart below summarizes the evolution of Kenya's months of import cover over the years:
Weekly Highlights
- Monetary Policy Committee (MPC) Note on 10th February 2026 Meeting
We expect the MPC to cut the Central Bank Rate (CBR) to within a range of 9.00% - 8.75%, with their decision mainly being supported by
- Rate cuts by global giant economies: Global monetary policy has generally remained accommodative or steady in recent months. At its January 28, 2026 Federal Open Market Committee (FOMC) meeting, the US Federal Reserve maintained the federal funds rate at 3.5%-3.75% amid moderating inflation and signals of slower economic momentum in the world’s largest economy. Meanwhile, the European Central Bank (ECB), in its 18th December 2025 meeting, chose to hold its benchmark policy rate at 2.0% (deposit rate) for several consecutive meetings while continuing to monitor inflation dynamics in the Euro Area. In addition, other major central banks such as the Bank of England and the Bank of Japan have maintained steady rates or signalled conditional easing depending on inflation outcomes and growth prospects,
- The need to support the economy: A supportive monetary policy remains crucial to enhance financing activities and support private sector lending, particularly in an environment where credit uptake has been moderate. In November 2025, private sector credit grew by 6.3%, up from 5.9% in October 2025, an encouraging sign of recovery. However, this growth remains well below the 5-year average of 7.7%, indicating that credit expansion is still relatively subdued. A reduction in the Central Bank Rate (CBR) would help unlock the full potential of the private sector, allowing it to play a more significant role in driving economic recovery and supporting sustained growth. Given the still-muted business environment, a rate cut would also stimulate economic activity, boost money supply, and improve overall business confidence and investment.
- The continued stability of the Shilling against major currencies: Despite the December 2025 rate cut, the Kenyan Shilling has remained relatively stable, appreciating by 16.4 bps against the US Dollar to 129.0 as at 30th January 2026 from the Kshs 129.2 recorded on 9th December 2025. This stability, supported by foreign exchange reserves currently at 5.3 months of import cover (above the 4.0 months statutory requirement), provides the MPC with flexibility to maintain the current rate without risking currency volatility or capital outflows.
- January 2026 Inflation
The year-on-year inflation in January 2026 decreased by 0.1% points to 4.4% from the 4.5% recorded in December 2025 which is in line with our projection of a decrease to a range of 4.3%-4.4%. The price increase was primarily driven by a by a rise in prices of items in the Food and Nonalcoholic Beverages (7.3%); Transport (4.8%); and Housing, Water, Electricity, Gas and other fuels (2.2%); over the one-year period. The month-on-month inflation rate stood at 0.6% in January 2026. The table below summarizes the performance of commodity indices both on a year-on-year and month-on-month basis:
|
Cytonn Report: Major Inflation Changes – January 2026 |
|||
|
Broad Commodity Group |
Price change m/m (January-2026/ December -2025) |
Price change y/y January-2026/January-2025) |
Reason |
|
Food and Non- Alcoholic Beverages |
1.1% |
7.3% |
The m/m increase was mainly driven by the rise in prices of cabbages, fortified maize flour and kale/sukuma wiki by 9.3%, 6.7%and 4.0% respectively. However, the increase was weighed down by a decline in prices of mangoes, sugar and cooking oil(salad) of 3.0%, 3.2% and 0.1% respectively. |
|
Transport |
(0.7%) |
4.8% |
The m/m decrease was driven by the 1.9% decrease in country bus and matatu fares for travel between towns coupled with the decrease in prices for petrol and diesel by 1.1% and 0.6% respectively. |
|
Housing, Water, Electricity, Gas and Other fuels |
0.7% |
2.2% |
The m/m increase was mainly due to increase in electricity prices, with 50 kWh and 200 kWh increasing by 3.7% and 3.4% respectively. However, the increase was partially offset by a 0.6% decrease in the price of kerosene. |
|
Overall Inflation |
0.6% |
4.4% |
The m/m increase was mainly attributable to the 1.1% increase in Food and non- alcoholic beverages. |
In January 2026, overall inflation decreased by 0.1% points to 4.4% from the 4.5% recorded in December 2025 on a y/y basis, signaling a mild moderation in price pressures across major categories. Additionally, the inflation rate remained within the Central Bank of Kenya’s preferred range of 2.5%–7.5% for the thirty first consecutive month, reflecting sustained macroeconomic stability. The increase was mainly driven by a 7.3% y/y rise in food and non-alcoholic beverage prices, a 4.8% increase in transport costs, and a 2.2% rise in housing, water, electricity, gas and other fuels. On a month-to-month basis, inflation remained modest at 0.6%, indicating relative price stability. Prices for Super Petrol, Diesel and Kerosene decreased by Kshs 2.0, Kshs 1.0 and Kshs 1.0 per litre to Kshs 182.5, Kshs 170.5 and Kshs 153.8 per litre from Kshs 184.5, Kshs 171.5 and Kshs 171.5 per litre respectively in December 2025 effective from 15th January 2026 to 14th February 2026. Electricity costs increased during the month, with 50 kWh and 200 kWh increasing by 3.7% and 3.4%, respectively. Additionally, the recent reduction in the Central Bank Rate to 9.0% from 9.25% in December is expected to continue to stimulate credit uptake and increase money supply, which could gradually exert upward pressure on inflation in the coming months as monetary easing transmits through the broader economy. Meanwhile, the Kenya Shilling depreciated marginally by 1.5 bps m/m against the US Dollar, to Kshs 129.03 from Kshs 129.01 recorded at the end of December and a 1.5 bps year-to-date appreciation to Kshs 129.3 as of 30th January 2026, from the Kshs 129.01 recorded at the beginning of the year. This stabilization in the exchange rate, combined with manageable fuel price changes, continues to anchor inflation expectations within the CBK’s target range.
The chart below shows the inflation rates for the past 5 years:
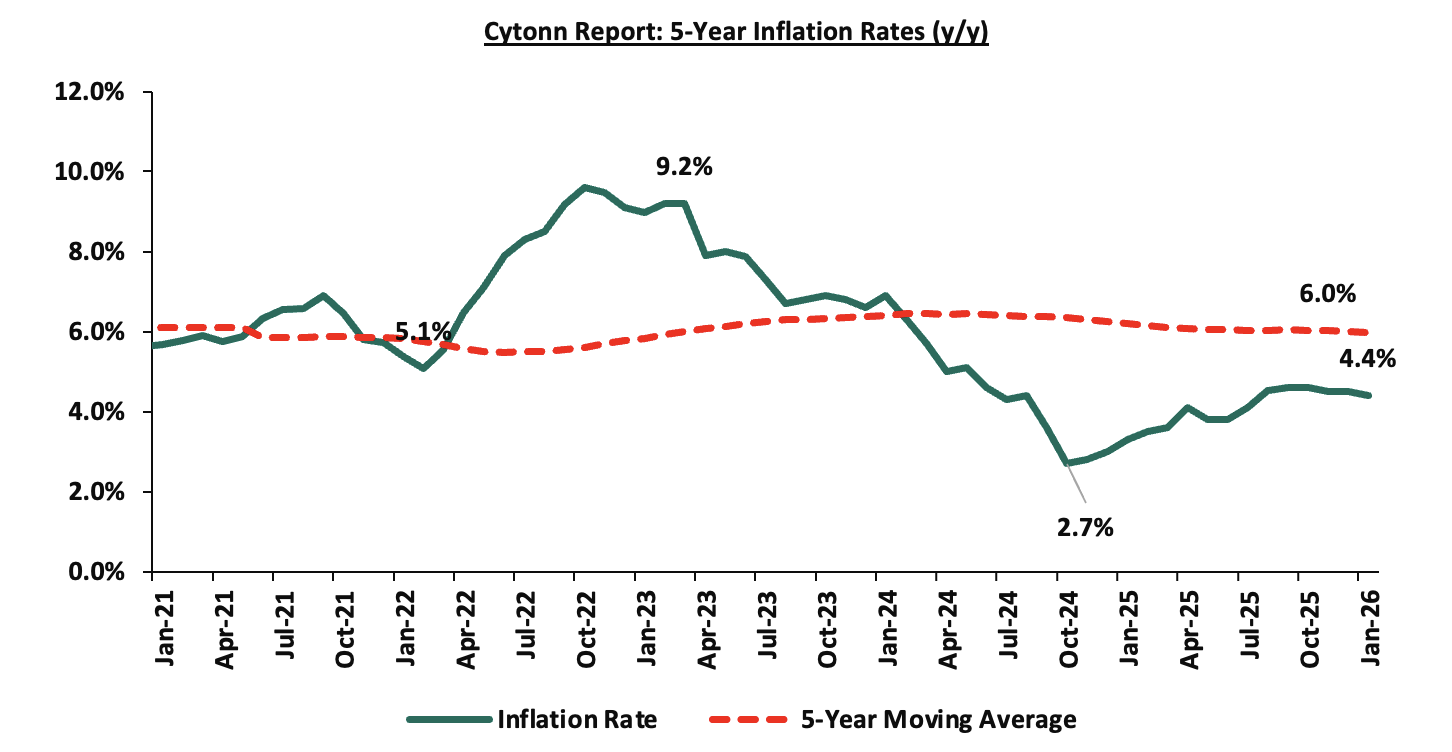
Going forward, we expect inflation to remain within the CBK’s preferred range of 2.5%-7.5%, mainly on the back of a stable currency and stable fuel prices. Additionally, favorable weather conditions will also contribute to stabilizing food prices, further supporting stable inflation rates. The risk, however, lies in the fuel prices which despite their stability still remain elevated compared to historical levels. Additionally, the Monetary Policy Committee cut the Central Bank Rate by 25.0 bps to 9.0% from 9.25% in its December 2025 meeting, with the aim of easing the monetary policy, while maintaining exchange rate stability, and will meet again on 10th February 2026. This consistent accommodative monetary policy stance is likely to elevate inflationary pressures gradually as consumer spending rises from increased money supply. The committee is expected to adopt a more cautious approach to rate adjustments in the coming meetings in a bid to continue supporting the private sector, while also keeping an eye on the effect on the inflation and exchange rate.
- Moody’s Revises Kenya’s Positive Outlook to Stable and Affirms B3 Credit rating
On January 27th 2026, the global ratings agency, Moody’s announced its upgrade of Kenya’s sovereign credit rating from Caa1 to B3, while revising the outlook to Stable from Positive, on the back of a reduction in near-term default risk and strengthened external liquidity. The improved creditworthiness is largely attributable to enhanced foreign-exchange reserves, a narrower current-account deficit, and improved access to international capital markets, which have reduced refinancing pressures and supported government liquidity. Given the relatively low inflation, stability in the exchange rate, and sustained accommodative monetary policy, domestic borrowing costs are expected to remain manageable over the short to medium term.
Inflation remained with the CBK’s preferred target range of 2.5%-7.5% throughout 2025, with the average inflation rate for 2025 coming in at 4.1%. As of January 2026, inflation came in at 4.4%, a 0.1% reduction from the 4.5% recorded in December 2025, remaining well within the target range. The low and stable inflation coupled with a stable exchange rate has led to an expansionary monetary stance by the Central Bank of Kenya, improving domestic liquidity and reduced short-term interest rates. Since July 2025, the government’s domestic borrowing costs have marginally decreased with the average yields on the 91-day treasury bill decreasing by 0.4% points to 7.7% by January 2026 from 8.1% in July 2025. While yields on Treasury bonds have slightly increased, the rise has been more gradual. Bonds with 10 year and 15 year maturities saw yields increase from 12.2% and 12.4% six months ago to 13.0% and 14.5% in recent auctions.
The upgraded B3 credit rating reflects a reduction in near-term sovereign credit risk, though fiscal vulnerabilities remain. According to Moody’s, government debt remains elevated, with debt-service to revenue ratios still above the IMF threshold of 30.0%, signaling continued pressure on public finances. Improved external liquidity, including higher foreign-exchange reserves and narrower current-account deficits, coupled with relatively contained domestic borrowing costs, supports a more positive trajectory for government debt and fiscal sustainability. In addition, Kenya's local currency (LC) ceiling remains at B1, maintaining a three-notch gap with the sovereign rating. The foreign currency (FC) ceiling was also remains at B2, one notch below the LC ceiling, reflecting Kenya's relatively low external debt and moderately open capital account, which, while not completely eliminating, do reduce the need for transfer and convertibility restrictions during periods of financial stress.
This move positions Kenya alongside emerging economies like Nigeria and Egypt. The revision reflects improvements in Kenya’s fiscal and external position in 2025, including stronger foreign-exchange reserves, manageable domestic borrowing costs and a narrower current-account deficit, which reduced near-term default risks. Notably, S&P Global Ratings currently assigns Kenya a B rating with a Stable outlook, reflecting continued fiscal consolidation, stable inflation and a resilient external position in 2025. Fitch Ratings maintains Kenya at B- with a Stable outlook, highlighting that, although debt service remains elevated, external risk pressures moderated through 2025. Their decisions were influenced by the government’s fiscal management in 2025, including efforts to strengthen external liquidity, return to international bond markets, and improve domestic financing conditions, which significantly impacted Kenya’s fiscal trajectory and financing needs. Below is a summary of the credit rating on Kenya by various rating agencies;
|
Cytonn Report: Kenya’s Credit Ratings |
||||||
|
Rating Agency |
Previous Rating |
Previous Outlook |
Current Rating |
Current Outlook |
Meaning |
Date Released |
|
Moody's Rating |
Caa1 |
Positive |
B3 |
Stable |
Highly Speculative |
27th January, 2026 |
|
Fitch Ratings |
B- |
Stable |
B- |
Stable |
Highly Speculative |
23rd January 2026 |
|
S&P Global |
B |
Negative |
B- |
Stable |
Extremely high risk, very vulnerable to default |
23rd August 2025 |
Source: Fitch Ratings, S&P Global, Moody’s
Going forward, Kenya's government faces the challenge of managing a fiscal strategy that relies on revenue growth through a broadened tax base and effective expenditure management. Moody’s noted that Kenya’s rating could be further upgraded if domestic financing conditions continue to improve, fiscal reforms succeed in reducing liquidity risks, and the debt burden begins to decline sustainably. Strong external reserves, improved access to affordable external funding, and continued moderation of debt-service obligations would also support a potential upgrade. However, if financing conditions deteriorate or fail to improve, leading to higher liquidity risks and weaker debt affordability, the outlook would remain stable. A downgrade is considered unlikely in the near term but could occur if rising liquidity pressures constrain funding access and weaken fiscal and debt metrics.
- Fitch Ratings affirms Kenya’s Credit Rating at B- and maintains stable outlook
On 23rd January 2026, the global ratings agency Fitch Ratings affirmed Kenya’s Long-Term Foreign-Currency Issuer Default Rating (IDR) at B-, while maintaining a Stable outlook. The affirmation reflects Fitch’s assessment that Kenya’s medium-term growth prospects remain supported by a diversified economy, continued access to multilateral and bilateral financing, and improved external liquidity buffers, despite elevated public debt levels and ongoing fiscal pressures.
Kenya’s economy has continued to demonstrate resilience amid tight global financial conditions. Fitch projects real GDP growth at 4.9% in 2025, up from 4.7% in 2024, supported by a recovery in private-sector activity, improved agricultural output, and resilient services sector performance. However, fiscal pressures remain elevated, with the fiscal deficit projected at 5.8% of GDP in FY’2025/26, reflecting rising interest costs, a growing public-sector wage bill, and increased social and security-related expenditures.
Public debt remains elevated, estimated at about 67.8% of GDP in FY2025/26, well above the IMF’s 55.0% benchmark for countries at high risk of debt distress However, Fitch noted improvements in debt management, including a successful Eurobond buyback and re-issuance in February 2025, which helped smooth the external debt maturity profile and reduce near-term refinancing risks. Additionally, Kenya’s foreign-exchange reserves strengthened through 2025, supported by continued multilateral and bilateral disbursements, helping to bolster external liquidity and mitigate short-term balance-of-payments pressures.
The government’s fiscal deficit is projected to narrow to about 4.8% of GDP in FY2025/26, down from an 5.8% in FY2024/25, as part of ongoing fiscal consolidation efforts outlined in the 2025/26 budget plan, reflecting persistent pressures from rising interest payments, a growing public‑sector wage bill, and increased social and security expenditures that have offset gains from revenue mobilization and expenditure containment. Fitch expects only a modest narrowing to around 5.2% of GDP in FY’2025/26, leaving the deficit above government targets and underscoring constraints to fiscal consolidation. The authorities’ commitment to fiscal discipline is acknowledged, but the pace of adjustment is limited by weak revenue performance, high debt service costs, and socio‑political pressures.
The Stable outlook is underpinned by expectations that Kenya will maintain macroeconomic stability, avoid major policy slippage, and continue receiving financial support from development partners. However, Fitch cautioned that persistent vulnerabilities such as high external debt service, reliance on concessional borrowing, and limited fiscal space continue to weigh on the sovereign rating.
Kenya’s sovereign rating remains broadly in line with several other Sub‑Saharan African (SSA) economies. Following Fitch’s affirmation in January 2026, Moody’s Ratings upgraded Kenya’s long‑term foreign‑currency issuer rating to B3 from Caa1 and revised the outlook to Stable on 27th January 2026, citing stronger external liquidity and reduced near‑term default risk. Meanwhile, S&P Global Ratings upgraded Kenya’s long‑term sovereign rating to B with a Stable outlook in August 2025, attributing the improvement to eased external liquidity pressures and robust export and remittance inflows.
On international capital markets, Kenya has continued to access global funding to manage its external obligations. In October 2025, the government successfully raised USD 1.5 bn through a dual‑tranche Eurobond issuance, comprising equal tranches of USD 750.0 mn with maturities in 2033 and 2038 and coupon rates around 7.875% and 8.80% respectively. Proceeds were used primarily to refinance near‑term Eurobond maturities and reduce rollover risk, marking another proactive liability‑management operation following earlier buybacks and restructuring efforts.
Below is a table comparing Kenya, Ivory Coast, Senegal, Cameroon Benin’s Fitch’s credit rating and summary of the Eurobond issues:
|
Cytonn Report: Fitch’s Rating's Long-Term Foreign-Currency Issuer Default Rating (IDR) |
||||||||
|
Fitch’s Rating's Long-Term Foreign-Currency Issuer Default Rating (IDR) |
2024/2025 Eurobond Issues |
|||||||
|
Country |
IDR Credit Rating |
IDR Credit Outlook |
Rating Date |
Value (USD mn) |
Tenor (Years) |
Coupon Rate |
Yield at issuance |
Issuance Date |
|
Ivory Coast |
BB- |
Stable |
June-2025 |
1,750.0 |
11.0 |
6.45% |
6.45% |
Mar-25 |
|
Benin |
B+ |
Stable |
Jul-2025 |
500.0 |
16.0 |
8.625% |
8.75% |
Jan-25 |
|
Kenya |
B- |
Stable |
Jan-2026 |
1,500.0 |
7/12 |
8.35% |
8.7% |
Oct-25 |
|
Senegal |
B- |
Stable |
June-2025 |
750.0 |
7.0 |
7.75% |
7.75% |
Jun-24 |
|
Cameroon |
B |
Negative |
May-2025 |
550.0 |
11.0 |
9.5% |
10.75 |
Jul-24 |
Going forward, Kenya’s government faces the challenge of maintaining fiscal consolidation momentum amid rising expenditure pressures. Fitch projects the fiscal deficit to remain elevated at about 5.8 % of GDP for the financial year ending June 2026, significantly above the government’s 4.7% target, reflecting continued spending pressures from rising interest costs, drought‑related and social expenditures, and the public wage bill. Despite modest improvements in revenue mobilization, weak tax performance and structural constraints limit the scope for significant deficit reduction. Fitch also warned that external financing needs will remain high, with government external debt service expected to exceed USD 5.0 bn (about 3.7% of GDP) in FY’2025/26, keeping gross external financing requirements elevated. Sustained policy discipline, enhanced revenue mobilization, and rigorous expenditure control will be critical to bolstering investor confidence and supporting longer‑term fiscal sustainability.
Monthly Highlights:
- During the month, the Kenya National Bureau of Statistics (KNBS) released the Q3’2025 Quarterly Gross Domestic Product Report, indicating that the Kenyan economy expanded by 4.9% in Q3’2025, higher than the 4.2% growth recorded in Q3’2024. The improved performance was largely driven by accelerated growth in key sectors, with Mining and Quarrying rebounding to 16.6% in Q3’2025 from a 12.2% contraction in Q3’2024, Construction expanding by 6.7% in Q3’2025 from a 2.6% contraction in Q3’2024, and Electricity and Water Supply growing by 3.6% in Q3’2025 from 0.9% in Q3’2024. However, the Agriculture and Forestry sector, the main contributor to GDP, recorded a slower growth of 3.2% in Q3’2025, down from 4.2% in Q3’2024, while several service-oriented sectors experienced moderated growth rates, including Information and Communication, which slowed to 4.5% in Q3’2025 from 6.1% in Q3’2024, and Professional Services, which moderated to 6.1% from 7.8%. Despite the moderation, the economy demonstrated resilience supported by recovery in extractive, construction, and selected service sectors For more information please check our Cytonn Weekly#01
- During the month, according to the Q3’2025 Kenya Quarterly Balance of Payment Report released by the Kenya National Bureau of Statistics (KNBS), Kenya’s balance of payments position improved significantly by 458.9% in Q3’2025, to a surplus of Kshs 63.7 bn, from a deficit of Kshs 17.8 bn in Q3’2024. For more information, please check our Cytonn Weekly#01
- During the month, Stanbic Bank released its monthly Purchasing Manager’s Index (PMI), highlighting that the index for the month of December 2025 remained in expansion territory, coming in at 53.7, albeit lower than 55.0 recorded in November 2025, marking the fourth consecutive month the index remained above the 50.0 neutral mark, signaling a sustained improvement in business conditions. For more information, please check our Cytonn Weekly#01
- During the month, the National Treasury gazetted the revenue and net expenditures for the sixth month of FY’2025/2026, ending 31st December 2025, highlighting that the total revenue collected as at the end of December 2025 amounted to Kshs 1,249.8 bn, equivalent to 45.4% of the original estimates of Kshs 2,754.7 bn for FY’2025/2026 and is 90.7% of the prorated estimates of Kshs 1,377.4 bn. For more information please check our Cytonn 2026 Markets Outlook
- During the month, The Energy and Petroleum Regulatory Authority (EPRA) released their monthly statement on the maximum retail fuel prices in Kenya, effective from 15th January 2026 to 14th February 2026. Notably, the maximum allowed prices for Super Petrol, Diesel and Kerosene decreased by Kshs 2.0, Kshs 1.0 and Kshs 1.0 per litre to Kshs 182.5, Kshs 170.5 and Kshs 153.8 per litre from Kshs 184.5, Kshs 171.5 and Kshs 171.5 per litre respectively in December 2025. For more information please check our Cytonn 2026 Markets Outlook
- During the month the Kenya Revenue Authority (KRA) announced they had delivered a strong revenue performance for the first half of FY’2025/26, exceeding targets across all key categories. Total tax revenue amounted to Kshs 307.6 bn against a target of Kshs 285.0 bn, translating to a performance rate of 108.0%. Ex-chequer revenue reached Kshs 284.3 bn compared to a target of Kshs 261.8 bn, representing 108.6% achievement For more information please check our Cytonn Weekly#03
Rates in the Fixed Income market have been on a downward trend due to high liquidity in the money market which allowed the government to front load most of its borrowing. The government is 105.1% ahead of its prorated net domestic borrowing target of Kshs 376.7 bn, having a net borrowing position of Kshs 772.5bn (inclusive of T-bills). However, we expect a stabilization of the yield curve in the short and medium term, with the government looking to increase its external borrowing to maintain the fiscal surplus, hence alleviating pressure in the domestic market. As such, we expect the yield curve to stabilize in the short to medium-term and hence investors are expected to shift towards the long-term papers to lock in the high returns
Market Performance:
During the month of January, the equities market was on an upward trajectory, with NSE 20, NASI, NSE 25 and NSE 10 gaining by 5.1%, 4.7%, 4.4% and 4.2% respectively. The equities market performance was mainly driven by gains recorded by large-cap stocks such as Cooperative Bank, ABSA and DTB-K of 13.6%, 13.2% and 12.7% respectively. The performance was, however, weighed down by losses by large cap stocks such as EABL of 1.7%.
During the week, the equities market was on an upward trajectory, with NSE 20, NSE 10, NASI and NSE 25 gaining by 1.0%, 0.9%, 0.4% and 0.4% respectively, taking the YTD performance to gains of 5.0%, 4.3%, 4.0% and 3.6% for NSE 20, NASI, NSE 25 and NSE 10 respectively. The week-on-week equities market performance was driven by gains recorded by large-cap stocks such as DTB-K, EABL and ABSA of 10.3%, 7.4% and 5.7% respectively. However, the performance was weighed down by losses recorded by large cap stocks such as NCBA, Equity and Cooperative Bank of 5.1%, 2.5% and 0.9% respectively.
Also, during the month, the banking sector index gained by 5.6% to close at 215.0 from the 203.7 recorded at the end of the December 2025. This was attributable to gains recorded by large-cap stocks such as Cooperative Bank, ABSA and DTB-K of 13.6%, 13.2% and 12.7% respectively.
During the week, the banking sector index declined by 0.3% to 215.0 from 215.8 recorded the previous week. This is attributable to losses recorded by large cap stocks such as NCBA, Equity and Cooperative Bank of 5.1%, 2.5% and 0.9% respectively. However, the performance was supported by gains recorded by large cap stocks such as DTB-K, ABSA and Standard Chartered of 10.3%, 5.7% and 0.7% respectively.
Equities turnover decreased by 20.7% in the month of January to USD 104.5 mn from USD 131.7 mn recorded during the month of December 2025. Foreign investors became net sellers, with a net selling position of USD 8.4 mn, from a net buying position of USD 0.1 mn recorded in December 2025.
During the week, equities turnover increased by 29.6% to USD 30.9 mn from USD 23.9 mn recorded the previous week, taking the YTD total turnover to USD 104.5 mn. Foreign investors became net buyers for the first time in three weeks with a net buying position of USD 4.0 mn, from a net selling position of USD 4.2 mn recorded the previous week, taking the YTD foreign net selling position to USD 8.4 mn, compared to a net selling position of USD 92.9 mn recorded in 2025.
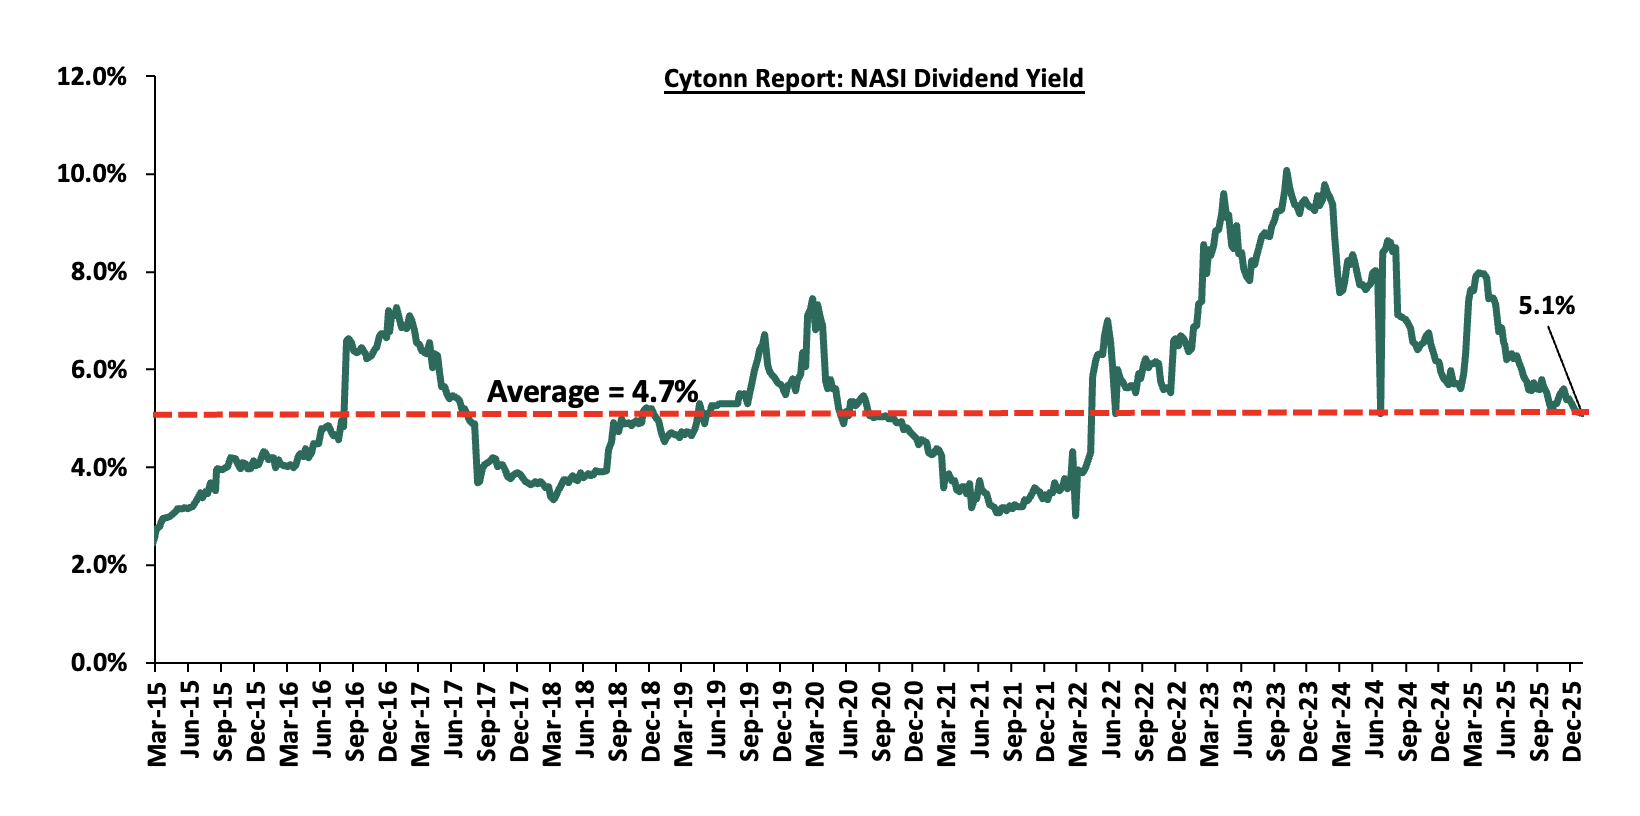
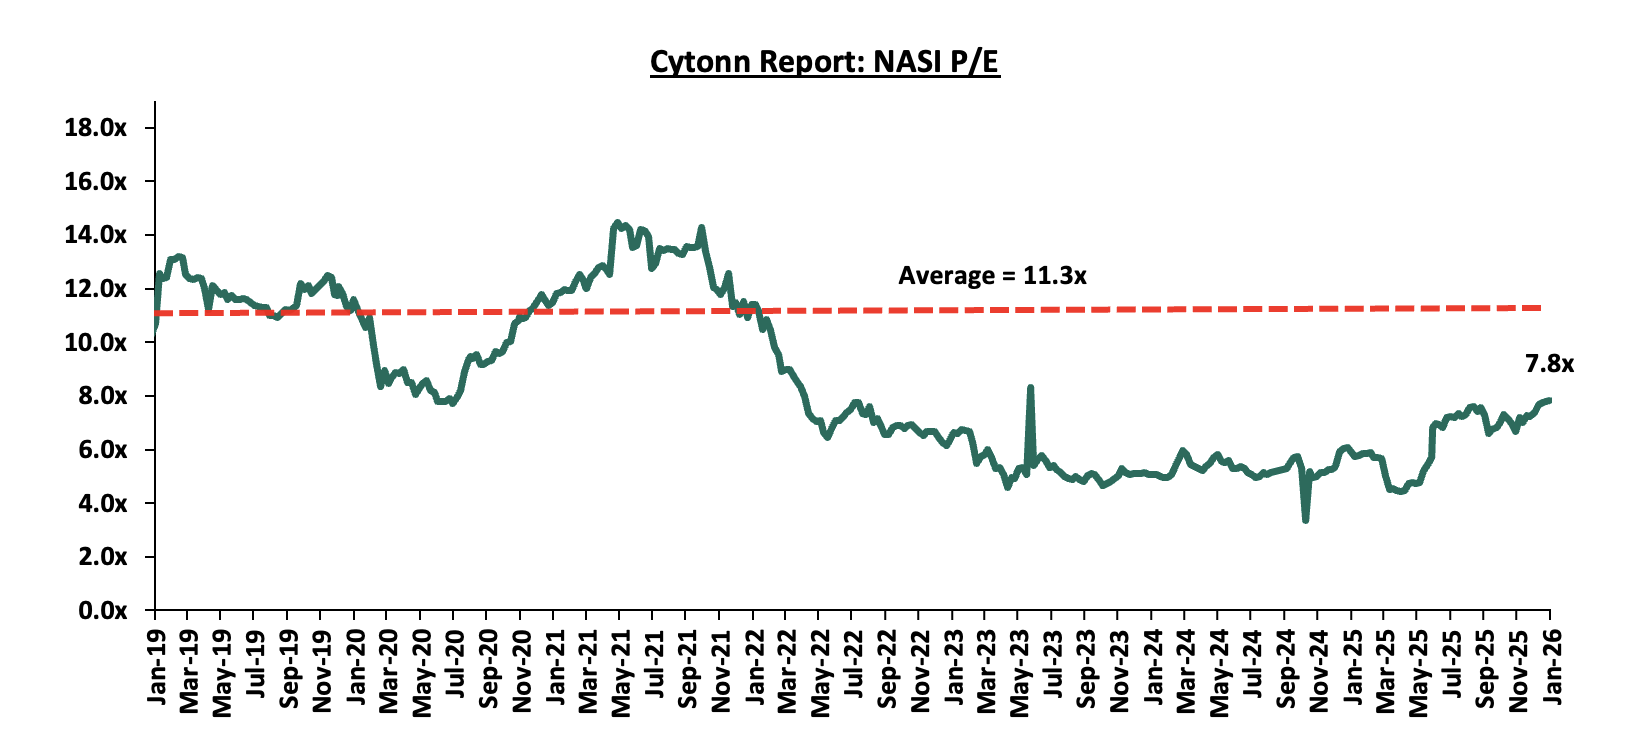
The market is currently trading at a price to earnings ratio (P/E) of 7.8x, 31.0% below the historical average of 11.3x, and a dividend yield of 5.1%, 0.4% points above the historical average of 4.7%. Key to note, NASI’s PEG ratio currently stands at 1.0x, an indication that the market is fairly valued relative to its future growth. A PEG ratio greater than 1.0x indicates the market may be overvalued while a PEG ratio less than 1.0x indicates that the market is undervalued.
The charts below indicate the historical P/E and dividend yields of the market;
Universe of Coverage:
|
Cytonn Report: Equities Universe of Coverage |
||||||||||||
|
Company |
Price as at 23/01/2026 |
Price as at 30/01/2026 |
w/w change |
m/m change |
YTD Change |
Year Open 2026 |
Target Price* |
Dividend Yield |
Upside/ Downside** |
P/TBv Multiple |
Recommendation |
|
|
Standard Chartered Bank |
307.8 |
310.0 |
0.7% |
4.3% |
3.4% |
299.8 |
354.6 |
14.5% |
28.9% |
1.8x |
Buy |
|
|
I&M Group |
45.0 |
45.0 |
0.0% |
6.0% |
5.1% |
42.8 |
53.1 |
6.7% |
24.7% |
0.8x |
Buy |
|
|
Co-op Bank |
27.5 |
27.2 |
(0.9%) |
13.6% |
13.8% |
23.9 |
31.5 |
5.5% |
21.3% |
1.0x |
Buy |
|
|
Equity Group |
68.75 |
67.0 |
(2.5%) |
0.4% |
0.0% |
67.0 |
75.2 |
6.3% |
18.6% |
1.2x |
Accumulate |
|
|
NCBA |
97.5 |
92.5 |
(5.1%) |
10.1% |
8.8% |
85.0 |
101.3 |
5.9% |
15.5% |
1.5x |
Accumulate |
|
|
Stanbic Holdings |
198.0 |
198.0 |
0.0% |
0.1% |
0.1% |
197.8 |
205.5 |
10.5% |
14.3% |
1.2x |
Accumulate |
|
|
Jubilee Holdings |
330.0 |
325.0 |
(1.5%) |
(3.0%) |
0.8% |
322.5 |
354.3 |
4.2% |
13.2% |
0.5x |
Accumulate |
|
|
KCB Group |
66.8 |
66.5 |
(0.4%) |
1.1% |
1.1% |
65.8 |
71.0 |
4.5% |
11.3% |
0.8x |
Accumulate |
|
|
Britam |
9.8 |
9.7 |
(0.6%) |
6.6% |
7.1% |
9.1 |
10.5 |
0.0% |
8.2% |
0.9x |
Hold |
|
|
CIC Group |
4.6 |
4.5 |
(1.7%) |
(1.1%) |
(0.4%) |
4.5 |
4.8 |
2.9% |
8.0% |
1.2x |
Hold |
|
|
ABSA Bank |
26.5 |
28.0 |
5.7% |
13.2% |
12.5% |
24.9 |
28.3 |
6.3% |
7.5% |
1.8x |
Hold |
|
|
Diamond Trust Bank |
117.0 |
129.0 |
10.3% |
12.7% |
12.4% |
114.8 |
129.4 |
5.4% |
5.7% |
0.5x |
Hold |
|
|
*Target Price as per Cytonn Analyst estimates **Upside/ (Downside) is adjusted for Dividend Yield ***Dividend Yield is calculated using FY’2024 Dividends |
||||||||||||
Weekly Highlights
- East African Breweries Plc (EABL) HY’2026 Financial performance
East African Breweries Plc (EABL) released their HY’2026 financial results for the year ending 31st December 2025, recording a 37.7% increase in the Profits After Tax (PAT) to Kshs 11.2 bn in HY’2026, from Kshs 8.1 bn in HY’2025. The increase was mainly attributable to the 36.8% decrease in finance costs to Kshs 2.2 bn from Kshs 3.4 bn in HY’2025, coupled with a 11.1% increase in net revenue to Kshs 75.5 bn from Kshs 67.9 bn in HY’2025.The growth in PAT was, however, weighed down by the 91.8% decrease in Forex income to Kshs 0.1 bn in HY’2026 from Kshs 1.2 bn in HY’2025 and 0.2% increase in the operating costs to Kshs 13.8 bn in HY’2026, from Kshs 13.7 bn in HY’2025. The tables below show the breakdown of the company’s financial performance;
|
Cytonn Report: East Africa Breweries Plc (EABL) Summarized Income Statement |
|||
|
Income Statement |
HY’2025 |
HY’2026 |
Y/Y Change |
|
Kshs (bn) |
Kshs (bn) |
||
|
Net revenue |
67.9 |
75.5 |
11.1% |
|
Cost of Sales |
(39.8) |
(43.2) |
8.5% |
|
Gross Profit |
28.1 |
32.3 |
14.8% |
|
Operating Costs |
(13.7) |
(13.8) |
0.2% |
|
Operating Profit |
14.4 |
18.5 |
28.6% |
|
Forex losses/Gains |
1.2 |
0.1 |
(91.8%) |
|
Net Finance Costs |
(3.4) |
(2.2) |
(36.8%) |
|
Profit Before Income Tax |
12.1 |
16.5 |
35.5% |
|
Income Tax Expenses |
(4.0) |
(5.3) |
31.2% |
|
Profit After Tax |
8.1 |
11.2 |
37.7% |
|
Earnings Per Share |
15.3 |
23.4 |
52.7% |
|
Dividend Per Share |
2.5 |
4.0 |
60.0% |
|
Dividend Yield (Annualized) |
4.8% |
3.9% |
(1.0%) |
|
Dividend Payout Ratio |
24.4% |
28.3% |
4.0% |
Source: East African Breweries Plc (EABL) HY’2026 financial statements
|
Cytonn Report: East Africa Breweries Plc (EABL) Summarized Balance Sheet |
|||
|
Balance Sheet |
HY’2025 |
HY’2026 |
Y/Y Change |
|
Kshs (bn) |
Kshs (bn) |
||
|
Current Assets |
53.3 |
57.1 |
7.1% |
|
Non-Current Assets |
84.4 |
83.4 |
(1.1%) |
|
Total Assets |
137.7 |
140.6 |
2.0% |
|
Short term borrowings |
7.1 |
6.7 |
(6.0%) |
|
Other Current Liabilities |
42.7 |
43.9 |
2.9% |
|
Total Current Liabilities |
49.8 |
50.6 |
1.6% |
|
Long term Borrowings |
38.5 |
33.3 |
(13.4%) |
|
Other Non-Current Liabilities |
8.6 |
8.6 |
0.9% |
|
Total Non-Current Liabilities |
47.1 |
42.0 |
(10.8%) |
|
Total Liabilities |
96.9 |
92.6 |
(4.4%) |
|
Total Equity |
40.9 |
48.0 |
17.4% |
Source: East African Breweries Plc (EABL) HY’2026 financial statements
Key take outs from the financial performance include;
- Net revenue increased by 11.1% to Kshs 75.5 bn in HY’2026, from Kshs 67.9 bn recorded in HY’2025, mainly attributable to the increase in volume sold by 8.0%, improved digital transformation such as business to consumer framework which has helped in boosting revenue levels by expanding their consumer base.
- Operating costs increased by 0.2% to Kshs 13.8 bn, from Kshs 13.7 bn attributable to factors such as external shocks, for instance, a surge in illicit and counterfeit goods and consumers are under pressure due to the rising cost of living
- Cost of sales increased by 8.5% to Kshs 43.2 bn, from Kshs 39.8 bn in HY’2025, mainly attributable to increased cost of inputs occasioned by attributable to factors such as rising raw material costs.
- The 91.8% decrease in Forex income to 0.1 bn in HY’2026 from 1.2 bn in HY’2025 can be attributed to a depreciation of the regional currencies against the dollar. For instance, the Tanzanian Shilling and depreciated by 2.2% against the US Dollar for the period under review.The Group’s balance sheet recorded
- an expansion, with the total assets increasing by 2.0% to Kshs 140.6 bn in HY’2026 from Kshs 137.7 bn recorded in HY’2025 mainly attributable to a 7.1% increase in current assets to Kshs 57.1 bn in HY’2026 from Kshs 53.3 bn in HY’2025.
- In addition, total liabilities recorded a 4.4% decrease to Kshs 92.6 bn in HY’2026 from Kshs 96.9 bn in HY’2025, mainly driven by a 10.8% decrease in total non-current liabilities to Kshs 42.0 bn in HY’2026 from Kshs 47.1 bn in HY’2025.
- The Group’s short-term borrowing decreased by 6.0% to Kshs 6.7 bn in HY’2026 from Kshs 7.1 bn in HY’2025, while the long-term borrowings decreased by 13.4% to Kshs 33.3 bn, from the Kshs 38.5 bn in HY’2025 an indication of the group’s strategic shift in its debt financing.
- Earnings per share increased by 52.7% to Kshs 23.4, from Kshs 15.3 in HY’2025, largely driven by a 37.7% increase in profit after tax to Kshs 11.2 bn, from Kshs 8.1 bn in HY’2025.
- Additionally, the Board of Directors recommends an interim dividend of Kshs 4.00 per share with a book closure of 20th February 2026 and a payment date on or about 30th April 2026. This translates to an annualized dividend yield of 3.9%, compared to an annualized dividend yield of 4.8% in HY’2025 and a dividend payout ratio of 28.3% in HY’2026 compared to 24.4% in HY’2025.
Following the improvement in macroeconomic environment arising from an ease in inflationary pressures and a stable and stronger currency, EABL has experienced an improvement in financial performance as evidenced by the increase in profitability by 37.7% as well as the 52.7% growth in earnings per share in HY’2026. Key to note, EABL realized a significant 91.8% decrease in foreign exchange gains owing to the depreciation of the local currencies in the Group’s region of operation. For instance, the Tanzanian Shilling depreciated by 2.2% against the US Dollar for the period under review. In our view, the Group’s earnings will be supported by the group’s continued diversification efforts as well as the efforts from the government to mitigate the impact of unregulated alcohol trade as illicit trade continues to grow. Moreover, the Group’s announcement of an interim dividend of Kshs 4.00 per share for the period ending 31st December 2025 is expected to boost investors’ confidence in the Group’s stock.
Monthly Highlights
- During the month, NCBA Group PLC issued a cautionary announcement following receipt of a Notice of Intention from Nedbank Group Limited to acquire approximately 1,087,362,891 ordinary shares, representing approximately 66.0% of NCBA’s issued share capital, from NCBA shareholders through a partial tender offer, subject to regulatory approvals. If successfully completed, the transaction will result in Nedbank acquiring a controlling interest in NCBA, while the remaining 34.0% of the shares will remain listed on the Nairobi Securities Exchange (NSE). For more information, please see our Cytonn Weekly #03/2026
- During the month, Kenya Pipeline Company Plc (KPC) launched an Initial Public Offer (IPO) through an Offer for Sale at the Nairobi Securities Exchange (NSE), offering 65% of its stake to the public. The transaction represents one of the largest capital markets listings in East Africa and marks a major milestone in Kenya’s privatization agenda. The IPO provides investors with access to a strategic national infrastructure asset characterized by stable cash flows, strong margins and a dividend-oriented investment profile. For more information, please see our Cytonn Weekly #03/2026 and KPC IPO Note
- During the month, the Competition Authority of Kenya has approved KCB Group’s acquisition of a 75.0% stake in fintech firm Riverbank Solutions, supporting the bank’s push to strengthen its digital payments and platform-based services. Riverbank, a long-term KCB technology partner, provides agency banking, merchant payments and revenue collection solutions across East Africa. The Sh2 billion deal was cleared subject to data protection and continuity of existing client contracts, and now awaits final approval from the Central Bank of Kenya.
- During the month, the Competition Authority of Kenya (CAK) has approved Zenith Bank Plc’s proposed acquisition of 100 % of Paramount Bank Limited, allowing the Nigerian lender to enter Kenya’s banking market as part of its East African expansion strategy. The approval was granted on condition that Zenith retains all 78 Paramount employees for at least 12 months after the deal closes, and the regulator found the transaction unlikely to harm competition in the Kenyan banking sector. Paramount Bank has strengthened its capital base ahead of the takeover to meet enhanced regulatory requirements, and the acquisition now awaits final approval from the Central Bank of Kenya before it can be completed.
- During the month, Umeme Limited, through its Board, notified its shareholders and the general public that they are most likely to register a loss after assessing their financial performance for the year ended 31st December 2025. This is mainly attributable to the cessation of operating revenue generation at the end of Q1’ 2025 following the natural end of the 20-year electricity distribution concession in Uganda on 31st March 2025.
- During the month, Liberty Insurance, through its Board, notified its shareholders that their consolidated earnings after tax for the year ended 31 December 2025 are likely to be at least 25.0% lower than the audited earnings after tax for the year ended 31 December 2024. This is mainly attributable to a reduction in overall investment yields compared to 2024, an accounting loss arising from the disposal of the Group’s interest in Heritage insurance Company, Tanzania Limited and adverse claims experience during 2025.
We are “Bullish” on the Equities markets in the short term due to current attractive valuations, lower yields on short-term government papers and expected global and local economic recovery, and, “Neutral” in the long term due to persistent foreign investor outflows. With the market currently trading at par to its future growth (PEG Ratio at 1.0x), we believe that investors should reposition towards value stocks with strong earnings growth and that are trading at discounts to their intrinsic value. We expect the current high foreign investors sell-offs to continue weighing down the economic outlook in the short term.
- Industry Report
- Hass Consult Land and property price index
During the week, Hass Consult, a Kenyan consulting and Real Estate development firm, released its Property Index Q4’2025 Report , focusing on the residential Real Estate sector's performance in the Nairobi Metropolitan Area (NMA). The following are the key take outs from the report;
- The average selling prices for all properties posted a 0.3% increase on a quarter-on-quarter (q/q) basis in Q4’2025, 0.8% points decrease from 1.1% recorded in Q3’2025. The performance was largely driven by increased activity in semi-detached housing: For example, in Lavington, where house prices rose by 2.8% in 12 weeks and by 10.3% year-on-year (y/y), and in Loresho, where the rise accelerated by 2.4% in the fourth quarter, achieving 9.7% for the year.
- On a year-on-year (y/y) basis, property prices recorded a robust 7.7% growth, 2.5% points increase from 5.2% in Q4’2024, reflecting growing confidence and improved demand across key market segments. Semi-detached houses posted the highest quarterly growth at 1.4%, followed by apartments at 0.4%, while detached houses declined by 0.7%. This trend shows a shifting buyer preference for more affordable, space-efficient housing options that balance cost, functionality, and urban convenience. The rise in property prices further increased the cost of financing home purchases, exerting pressure on buyers amid elevated interest rates. While market volatility in Q4’2024 driven by inflationary uncertainty had previously dampened pricing momentum, Q4’2025 points to a broad-based recovery. Developers are facing elevated costs with the y/y increase in construction costs in 2025 coming in at 12.1% which is 5.5% points lower than the 17.6% recorded in 2024 driven by persistent global supply challenges and high material prices, particularly for cement and steel. These increased expenses are being passed on to homebuyers, reinforcing the 1.4% q/q price surge in semi-detached units.
- The average asking rents of housing units in the Nairobi Metropolitan Area during Q4’2025 contracted by 0.9% quarter‑on‑quarter basis, a further decline from the 1.6% decrease seen in Q3’2025. Rents for apartments, semi-detached and detached houses fell by 2.1%, 0.8% and 0.3% respectively driven by decreased demand in high‑occupancy areas such as Ruaka, which recorded a 0.2% decrease.
- On an annual basis, houses in Ruiru had the highest rental price increase at 15.6%, followed by Kiambu at 14.4% and Ongata Rongai at 12.5%, reflecting strong demand in satellite towns. However, Muthaiga registered the steepest annual rental price drop at 4.2%. The overall rental trends reflect shifting demand, with increased tenant preference for apartments in affordable, high-density areas.
- In Nairobi’s suburbs, property in Lavington posted the highest quarterly sales price increase at 2.8%, driven by continued demand supported by high-end developments and robust infrastructure. In contrast, apartments in Langata recorded a quarterly price decline of 0.2%, and an annual decrease of 1.1%, making them the weakest-performing segment. Likewise, Gigiri saw an annual apartment rent drop of 4.1%, while Kitisuru recorded significant rental declines of 1.5%. These trends underscore a shift in tenant and buyer preferences toward satellite towns offering greater value and similar amenities at more competitive prices.
- In the satellite towns, Juja posted the highest year-on-year price appreciation at 12.2% in Q4’2025, down from 13.4% in Q3’2025, marking a continued strong upward trend. This surge is attributed to: (i) excellent connectivity via the Thika Superhighway, (ii) a growing preference among the middle class to settle and raise families in the area, (iii) proximity to major retail hubs such as Unicity Mall and Juja City Mall, and (iv) access to key amenities including Jomo Kenyatta University of Agriculture and Technology (JKUAT) and nearby hospitals. This divergence highlights how infrastructure, accessibility, and local amenities continue to shape real estate demand and pricing trends across Nairobi’s satellite towns.
- Among apartments in satellite towns, Ruaka registered the steepest decline, with a 1.1% quarter-on-quarter drop and a 2.5% year-on-year depreciation in Q4’2025, making it the worst-performing apartment node during the period. This subdued performance reflects elevated land prices, market saturation, and increasing competition from neighboring areas such as Kiambu and Gigiri, which offer superior amenities and better infrastructure access. In contrast, Syokimau apartments posted a 2.2% q/q price increase and a 10.1% y/y gain, supported by its affordability, continued infrastructure upgrades including expanded access via the Nairobi Expressway, Mombasa road and proximity to key social amenities such as schools, shopping malls, and hospitals. These trends highlight shifting buyer and tenant preferences toward affordable, accessible, and well-serviced nodes in Nairobi’s metropolitan periphery.
The findings of the report are in line with our Cytonn FY’2025 Markets Review, which highlighted that residential property prices in the Nairobi Metropolitan Area (NMA) appreciated by 0.8% year-on-year in the Q4’2025. This improvement reflects growing market activity and increased transaction volumes compared to Q4’2024, when price appreciation stood at just 0.4%. The uptick in pricing has been supported by stronger investor confidence, improved infrastructure in key nodes, and a shift in buyer preference towards more affordable and spacious developments, particularly in Nairobi’s satellite towns.
Hass Consult released Land Price Index Q4’2025 Report which highlighted the performance of the Real Estate land sector in the Nairobi Metropolitan Area (NMA). The following were the key take outs from the report;
- In Q4’2025, the average quarter-on-quarter selling prices for land in Nairobi suburbs increased by 1.3%, up from the 1.1% recorded in Q3’2025. On a year-on-year basis, land prices in the suburbs appreciated by 5.9%, a marginal decline from 6.3% recorded previously. Meanwhile, in Nairobi’s satellite towns, land prices grew by 1.6% q/q, up from 0.8% in Q3’2025 and posted a 6.2% y/y increase, lower than the 6.7% recorded in the previous quarter. This softening in satellite town growth suggests cooling momentum after the strong run in 2024. Despite this, the overall land market continues to demonstrate resilience, buoyed by improved infrastructure, expanding road networks, and steady demand from developers eyeing opportunities in residential, logistics, and mixed-use projects. Strategic corridors such as the Thika Superhighway, Eastern Bypass, and Nairobi Expressway remain key focal points for land acquisition as urban growth extends further into the Nairobi Metropolitan Area.
- In the Nairobi suburbs, Karen recorded the highest quarter-on-quarter price gain at 3.0%, followed closely by Runda at 2.9%. Apart from Muthaiga, Muthangari and Westlands all the other 15 suburbs tracked in the report recorded positive land price movement, albeit at varied rates. Growth in other suburbs remained more modest as buyers shifted focus to areas with better returns or lower entry prices. The performance of Karen and Runda reflects a broader market preference for low-density, amenity-rich neighborhoods where long-term capital appreciation is more likely.
- In the satellite towns, land markets reflected cooling momentum compared to the previous quarters. Nodes such as Kiserian, Kitengela, Ngong, Ongata Rongai, Juja, and Thika recorded slower price gains, mainly due to weakening demand from middle-income buyers and the after-effects of a strong rally in 2024, where satellite town prices had hit a seven-year high annual growth of 12.5%. In Q4’2025, none of the satellite towns exceeded a 5.0% q/q growth rate. The general market trend pointed to softened growth amid economic constraints and shifting buyer sentiment.
These findings align with broader market trends observed in the Cytonn FY’2025 Annual Markets Review, which reported that the overall average selling prices for land in the Nairobi Metropolitan Area (NMA) appreciated by 2.8% in Q4’2025, reaching Kshs 136.7 mn, up from Kshs 133.0 mn in Q4’2024. This growth was supported by: i) sustained housing demand driven by favorable demographics, with Kenya’s urbanization and population growth rates at 2.8% and 2.0% respectively, both higher than global averages of 1.4% and 1.0% respectively ii) constrained land supply in key urban nodes, particularly for residential and commercial development; iii) rising land investment interest from a growing middle class with access to more structured financing and investment tools; iv) continued rollout of key infrastructure projects such as the Nairobi Expressway, Eastern Bypass, and water and sewerage extensions, which are opening up new development frontiers; v) land’s entrenched role as a preferred wealth preservation vehicle for Kenyan households; and vi) the Affordable Housing Program under BETA, which remains a critical driver of construction activity and has continued to support upward pressure on land prices in and around key housing project zones.
There were two notable industry reports during the month;
|
Cytonn Report: Notable Industry Reports during January 2026 |
|||
|
# |
Theme |
Report |
Key Take-outs |
|
1 |
Real Estate, Hospitality, Building and Construction |
The Real Estate sector posted steady growth of 5.7% in Q3’2025, which is 0.9% points faster than the 4.8% growth registered in Q3’2024.For more information, please see our Cytonn Weekly #01/2026 |
|
|
2 |
Hospitality, Building and Construction |
LEI report for November 2025 |
In November 2025, cement consumption reached 960,182 metric tonnes, representing a 20.0% y/y increase from the same month in 2024. Month-on-month, consumption decreased by 1.1%, reflecting a decline in momentum in the construction sector. For more information, please see our Cytonn Weekly #01/2026 |
- Hospitality Sector
There was one notable hospitality highlight during the month;
- During the month, Smartwings Airlines begun direct charter flights from Budapest, Hungary, to Mombasa, Kenya, reflecting growing interest in Kenya’s coastal tourism from Eastern Europe. The inaugural flight, carrying 183 passengers, was welcomed on 29th December 2025 highlighting Kenya’s effort to boost tourism. The Hungary-Mombasa route operates through a partnership with tour companies Private Safaris and iBUSZ, targeting travelers seeking beach holidays and wildlife experiences. While arrivals from Eastern Europe remain lower than from Western Europe, this new route indicates potential growth in regional tourism. For more information please see our Cytonn Weekly #01/2026
We expect the hospitality sector to record positive performance, supported by a combination of rising international and domestic tourism demand, stronger investment interest, and strategic positioning as a hub for both leisure and business travel. The launch of direct charter flights from Budapest, Hungary, to Mombasa, Kenya, reflect a growing interest in Kenya’s coastal tourism from Eastern Europe in January 2026, However, inconsistent infrastructure in rural areas and financial constraints in urban markets remain key challenges that could limit the sector’s optimal growth.
- Commercial Office Sector
There was one notable highlight during the month;
- During the week, co-working space provider Kofisi closed two of its Nairobi locations, Karen and Upper Hill, following a Kshs 416.7 mn (USD 3.2 mn) loss in 2024, reversing a profit of Kshs 2.3 bn (USD 16.3 mn) in 2023. The London-based company aims to focus on larger, higher-capacity sites to enhance client experience through community spaces, better services, and economies of scale. Despite the loss, Kofisi’s revenues rose 24.5% to Kshs. 1.4 bn (USD 10.3 mn) in 2024, supported by high occupancy rates averaging above 90% across its offices. Kenya remains Kofisi’s largest market in Africa, accounting for Kshs 1.0 bn (USD 7.6 mn) or 74.4% of its 2024 revenue. For more information please see our Cytonn Weekly #01/2026
We expect that the commercial office sector will continue to grow, supported by several key dynamics: first, the increasing presence of multinational companies in Kenya is likely to drive up occupancy levels, particularly in Grade A developments; second, co-working spaces are gaining popularity as firms seek flexible and cost-efficient workspace solutions. However, the sector continues to face notable challenges, including the closure by Kofisi of two of its Nairobi locations in Karen and Upper Hill in January 2026, which underscores pressures within the flexible office segment. In addition, the market is facing an oversupply challenge, especially in prime office nodes such as Upper Hill and parts of Westlands, where new completions continue to outpace effective demand, placing downward pressure on rental yields, extending vacancy periods, and compelling landlords to offer incentives and more flexible lease terms to attract and retain tenants.
- Infrastructure Sector
- State to issue Kshs 175.0 bn roads bond in February 2026
During the week, The Kenyan government announced plans to issue a Kshs 175.0 bn roads bond in February, to be released in tranches rather than as a single issue, with preference given to investment clubs over the open market. The bond will be issued by the Kenya Roads Board (KRB) and its proceeds will primarily be used to settle pending bills owed to contractors and repay loans taken from commercial banks. The move follows delays in earlier plans to issue the bond in November, which failed to materialise due to market constraints.
A significant portion of the funds will address Kshs 650.0 bn worth of accumulated pending bills, part of which had already been financed by commercial banks including Trade Development Bank, KCB, Kenya Bankers Association members, and Absa. These banks had advanced funds to clear contractor arrears, helping restart stalled road projects. The bond is securitised through the Road Maintenance Levy (RML) Fund, with repayments supported by fuel levy collections. However, final pricing of the bond has not yet been disclosed, amid concerns over high interest rates, with Treasury officials seeking returns above prevailing 91-day Treasury bill rates.
The issuance of the Kshs 175.0 bn roads bond is expected to have a positive spillover effect on Kenya’s real estate sector by improving infrastructure connectivity and unlocking development corridors. Faster completion of road projects enhances accessibility to satellite towns and peri-urban areas, increasing land values and making previously underdeveloped locations viable for residential, commercial, and industrial projects. Improved transport networks also lower construction and logistics costs for developers, support housing demand through reduced commuting times, and stimulate mixed-use developments along major road arteries.
There were two notable highlights during the month
- During the month, updates on the Naivasha–Malaba SGR project indicated progressin preparation for the extension, with funding arrangements and compensation processes advancing after feasibility and environmental studies were completed. The broader Naivasha–Kisumu–Malaba project, estimated to cost Kshs 7 bn aims to enhance regional connectivity, linking Kenya’s rail network to Uganda and beyond, and is positioned as a key component of East Africa’s transport infrastructure. For more information, please see our Cytonn Markets Outlook 2026.
- During the month, the Kenya Railways Corporation announcedthat it has completed the reconstruction of the Uplands-Kijabe-Longonot Metre Gauge Railway which was destroyed when the Mai Mahiu dam burst its banks in April 2024 which also led to the death of more than 60 people. Some parts of the railway were also washed away by heavy rains which rendered it impassable. For more information please see our Cytonn Weekly #03/2026.
We expect the infrastructure sector to be supported by a combination of new road projects like the issuance of the Kshs. 175.0 bn infrastructure bond in February 2026 which will help pay pending bills and facilitate resumption of works and completion of the funding agreements and compensation processes in preparation of extension of the Naivasha-Malaba SGR project will typically influence land values and development activity along the corridor. We also expect that the reopening of the Kijabe railway line will go beyond disaster recovery and signals progress in building a more resilient and efficient infrastructure system in Kenya. It strengthens freight logistics, supports regional trade, and reduces pressure on roads, all while aligning with sustainable transport objectives.
- Real Estate Investments Trusts
- Centum Investment plans to develop a 22-storey office tower at the Two Rivers Special Economic Zone (SEZ) through the Centum REIT
During the week, Centum Investment Company announced plans to develop a 22-storey office tower at the Two Rivers Special Economic Zone (SEZ) through proceeds from its Centum Real Estate Investment Trust (I-REIT), which is scheduled to be issued before the end of the first quarter of the year. The new tower will be developed within the Two Rivers International Finance and Innovation Centre (Trific) and will add approximately 76,400 sqm of lettable space. Part of the REIT proceeds will also be used to acquire an existing office property within the SEZ, known as Trific North Tower, which has a 16,234 sqm net lettable area and is already fully occupied.
The Kshs 5.0 bn REIT is backed by fully dollar-denominated rental income, largely targeting multinational firms, business process outsourcing companies, shared services providers, and professional services firms. The development is being financed through a hybrid debt-equity structure, including mezzanine debt from Arica-focused fund manager Vintage Capital. Centum expects the REIT to offer investors an annual return of about 8.0% in US dollar terms, with guaranteed rental escalations, positioning it as a stable income product primarily aimed at professional and institutional investors.
Centum’s Two Rivers SEZ development is positive for Kenya’s REITs sector as it demonstrates how REITs can be structured around high-quality, income-generating assets with stable and predictable cash flows. The use of dollar-denominated leases and fully occupied grade-A offices helps address key challenges that have weighed down the sector, including low yields, currency risk, and weak investor confidence. By positioning the REIT as an institutional product backed by strong tenants and long-term leases, the transaction strengthens market credibility and could encourage more developers and institutional investors to participate, supporting the gradual deepening and recovery of Kenya’s REIT market.
- REITS Weekly Performance
On the Unquoted Securities Platform, Acorn D-REIT and I-REIT traded at Kshs 27.4 and Kshs 23.2 per unit, respectively, as per the last updated data on 30th January 2026. The performance represented a 33.4% and 14.5% gain for the D-REIT and I-REIT, respectively, from the Kshs 20.0 inception price. The volumes traded for the D-REIT and I-REIT came in at 13.4 mn and 42.0 mn shares respectively. Additionally, ILAM Fahari I-REIT traded at Kshs 11.0 per share as of 30th January 2026, representing a 45.0% loss from the Kshs 20.0 inception price. The volume traded to date came in at 1.2 mn shares for the I-REIT.
REITs offer various benefits, such as tax exemptions, diversified portfolios, and stable long-term profits. However, the ongoing decline in the performance of Kenyan REITs and the restructuring of their business portfolios are hindering significant previous investments. Additional general challenges include:
- Insufficient understanding of the investment instrument among investors leading to a slower uptake of REIT products,
- Lengthy approval processes for REIT creation,
- High minimum capital requirements of Kshs 100.0 mn for REIT trustees compared to Kshs 10.0 mn for pension funds Trustees, essentially limiting the licensed REIT Trustee to banks only
- The rigidity of choice between either a D-REIT or and I-REIT forces managers to form two REITs, rather than having one Hybrid REIT that can allocate between development and income earning properties
- Limiting the type of legal entity that can form a REIT to only a trust company, as opposed to allowing other entities such as partnerships, and companies,
- We need to give time before REITS are required to list – they would be allowed to stay private for a few years before the requirement to list given that not all companies maybe comfortable with listing on day one, and,
- Minimum subscription amounts or offer parcels set at Kshs 0.1 mn for D-REITs and Kshs 5.0 mn for restricted I-REITs. The significant capital requirements still make REITs relatively inaccessible to smaller retail investors compared to other investment vehicles like unit trusts or government bonds, all of which continue to limit the performance of Kenyan REITs.
There was one notable highlight during the month.
- During the month, the Private Infrastructure Development Group (PIDG) announcedit will take up 33.0% of Africa Logistics Properties’ dollar denominated Industrial Income Property Fund (IPF). The fund which is backed by six governments such as the United Kingdom, Netherlands, Switzerland, Australia, Sweden and Canada has committed to invest up to Kshs 1.9 bn to become the anchor investor in the Real Estate Investment Trust. For more information, please see our Cytonn Weekly #03/2026.
We expect the performance of Kenya’s Real Estate sector to remain resilient, supported by several factors: i) plans by the Kenyan government to raise Kshs 175.0 bn through issuance of infrastructure bonds in February 2026 ii) growth in the REITs market as seen through the plan by Centum Investments to fund the development 22-storey office tower at the Two Rivers Special Economic Zone (SEZ) through the Centum I-REIT. However, challenges such as rising construction costs, infrastructure constraints, weak investor appetite in listed REITs such as ILAM Fahari I-REIT, oversupply in select real estate classes, and high capital demands will continue to impede the sector’s optimal performance.
Disclaimer: The views expressed in this publication are those of the writers where particulars are not warranted. This publication, which is in compliance with Section 2 of the Capital Markets Authority Act Cap 485A, is meant for general information only and is not a warranty, representation, advice, or solicitation of any nature. Readers are advised in all circumstances to seek the advice of a registered investment advisor.

- Talk to us
- Kenya
- P.O Box 20695 - 00200, Nairobi, Kenya
- Cell +254709101200
- Tel +254709101200
- WhatsApp +254741676635
- United States
- +254709101200
- DOWNLOAD OUR APP
-


- Kenya
- 8th Floor, Pinetree Plaza, Kaburu Drive, Ngong Road, Nairobi, Kenya
- USA
- Suite 1150, 1775 Eye Street NW, USA, Washington DC 20006, USA
- Investments
- High Yield
- Private Equity
- Real Estate
- Real Estate
- RiverRun Estates
- Cytonn Towers
- The Ridge
- Taraji Heights
- The Alma