Kenya Listed Banks H1'2021 Report, & Cytonn Weekly #36/2021
By Cytonn Research, Sep 12, 2021
Executive Summary
Fixed Income
During the week, T-bills remained undersubscribed, with the overall subscription rate coming in at 72.6%, down from the 99.5% recorded the previous week as investors focused on the infrastructure bond on offer. The 91-day paper recorded the highest subscription rate, receiving bids worth Kshs 6.9 bn against the offered Kshs 4.0 bn, translating to a subscription rate of 172.5%, an increase from the 100.8% subscription rate recorded the previous week. The 182-day and 364-day papers were undersubscribed, with the subscription rates declining to 77.0% and 28.3%, from 99.5% and 98.9%, respectively, recorded the previous week. The yields on the 91-day, 182-day and 364-day papers increased by 0.7 bps, 2.7 bps and 26.0 bps to 6.8%, 7.3% and 7.8%, respectively;
During the week, Stanbic Bank released its monthly Purchasing Managers’ Index (PMI) highlighting that the index for the month of August 2021 increased to 51.1 from the 50.6 recorded in July 2021, driven by an acceleration in new order growth in August as sales rose in four of the five monitored sectors, but were unchanged among manufacturing firms. The covered sectors are construction, agriculture, mining, wholesale, retail and services. Also, during the week, the Kenya National Bureau of Statistics (KNBS) released the Economic Survey 2021, highlighting that the economy contracted by 0.3% in 2020, from the 5.0% growth recorded in 2019, attributable to the slowdown in economic activities due to emergence of the COVID-19 pandemic which resulted in sharp declines in demand and supply of goods and services;
Equities
During the week, the equities market was on an upward trajectory, with NSE 20 gaining by 1.9%, while both NASI and NSE 25 gained by 0.4%. This week’s performance took their YTD performance to gains of 18.5%, 15.8% and 10.2% for NASI, NSE 25 and NSE 20, respectively. The equities market performance was mainly driven by gains recorded by large-cap stocks such as Equity Group, NCBA Group and Safaricom, which gained by 2.2%, 1.7% and 0.8%, respectively. The gains were however weighed down by losses recorded by banking stocks such as Diamond Trust Bank (DTB-K) and ABSA Bank which declined by 1.5% and 1.4%, respectively. During the week, the Insurance Regulatory Authority (IRA), released the Q2'2021 Insurance Industry Report highlighting that the industry’s gross premiums rose by 19.0% to Kshs 144.0 bn in Q2’2021, from Kshs 121.0 bn recorded in Q2’2020;
Real Estate
During the week, the Kenya National Bureau of Statistics (KNBS) released the Economic Survey 2021 highlighting a general increase in the performance for the different real estate sectors in the review period 2019/2020. In the residential sector, Purple Dot International Limited, a local real estate developer, began the handing over of its Kshs 1.0 bn Marigold gated community development off Link Road in Lang’ata constituency. Additionally, Gulf African Bank launched a mortgage facility that will see home buyers access mortgage loans at 11.8% p.a, 1.2% points lower than the 13.0% interest rate currently offered by the bank. In the hospitality sector, British Airways (BA), announced the resumption of operations on the Nairobi-London route after a 5-month hiatus due to the Covid-19 operatory environment guidelines;
Focus of the Week
Following the release of the H1’2021 results by Kenyan listed banks, this week we analyse the performance of the 10 listed local banks (previously 11, before the acquisition of National Bank by KCB Group Plc), identify the key factors that influenced their performance, and give our outlook for the banking sector;
Investment Updates:
- Weekly Rates:
- Cytonn Money Market Fund closed the week at a yield of 10.55%. To invest, just dial *809#;
- Cytonn High Yield Fund closed the week at a yield of 15.58% p.a. To invest, email us at sales@cytonn.com and to withdraw the interest you just dial *809#;
- We continue to offer Wealth Management Training daily, from 9:00 am to 11:00 am, through our Cytonn Foundation. The training aims to grow financial literacy among the general public. To register for any of our Wealth Management Trainings, click here;
- If interested in our Private Wealth Management Training for your employees or investment group, please get in touch with us through wmt@cytonn.com;
- As of 1st of September 2021, Cytonn CHYS and CPN Investors have converted Ksh 2.5 billion of their investment funds from the two illiquid funds into real estate, translating to a 20.0% resolution of the debt owed by the two funds. For more information, please see the Cytonn CHYS and CPN Conversion 2.5 bn Real Estate article;
- Cytonn Insurance Agency acts as an intermediary for those looking to secure their assets and loved ones’ future through insurance namely; Motor, Medical, Life, Property, WIBA, Credit and Fire and Burglary insurance covers. For assistance, get in touch with us through insuranceagency@cytonn.com;
- Cytonnaire Savings and Credit Co-operative Society Limited (SACCO) provides a savings and investments avenue to help you in your financial planning journey. To enjoy competitive investment returns, kindly get in touch with us through clientservices@cytonn.com;
Real Estate Updates:
- For an exclusive tour of Cytonn’s real estate developments, visit: Sharp Investor's Tour, and for more information, email us at sales@cytonn.com;
- Phase 3 of The Alma is now ready for occupation. To rent please email properties@cytonn.com;
- We have 8 investment-ready projects, offering attractive development and buyer targeted returns. See further details here: Summary of Investment-ready Projects;
- For recent news about the group, see our news section here;
Hospitality Updates:
- We currently have promotions for Staycations. Visit cysuites.com/offers for details or email us at sales@cysuites.com;
- Share a meal with a friend during the Sunday Brunch at The Hive Restaurant at Cysuites Hotel and Apartment. Every Sunday from 11.00 AM to 4.00 PM at a price of Kshs 2,500 for Adults and Kshs 1,500 for children under 12 years;
Money Markets, T-Bills & T-Bonds Primary Auction:
During the week, T-bills remained undersubscribed, with the overall subscription rate coming in at 72.6%, down from the 99.5% recorded the previous week. The continued undersubscription of T-bills can be attributed to the fact that investors are shifting to the bond market in search for higher yields. The 91-day paper recorded the highest subscription rate, receiving bids worth Kshs 6.9 bn against the offered Kshs 4.0 bn, translating to a subscription rate of 172.5%, an increase from the 100.8% recorded the previous week. The subscription rate for the 182-day and the 364-day papers declined to 77.0% and 28.3%, from 99.5% and 98.9% recorded the previous week, respectively. The yields on the 91-day, 182-day and 364-day papers increased by 0.7 bps, 2.7 bps and 26.0 bps to 6.8%, 7.3% and 7.8%, respectively. The government accepted all the Kshs 17.4 bn worth of bids received, translating to an acceptance rate of 100.0%.
In the Primary Bond Market, the 21-year infrastructure bond, IFB1/2021/021, recorded an oversubscription of 201.7%. The government sought to raise Kshs 75.0 bn for funding of infrastructure projects in the FY’2021/22 budget estimates, received bids worth Kshs 151.3 bn and accepted bids worth Kshs 106.8 bn, translating to an acceptance rate of 70.6%. The high subscription rate is mainly attributable to the tax free incentive for infrastructure bonds which translates to a higher return. The coupon for the bond was market weighted which is to be the weighted average yield rate of the issue and it came in at 12.7%.
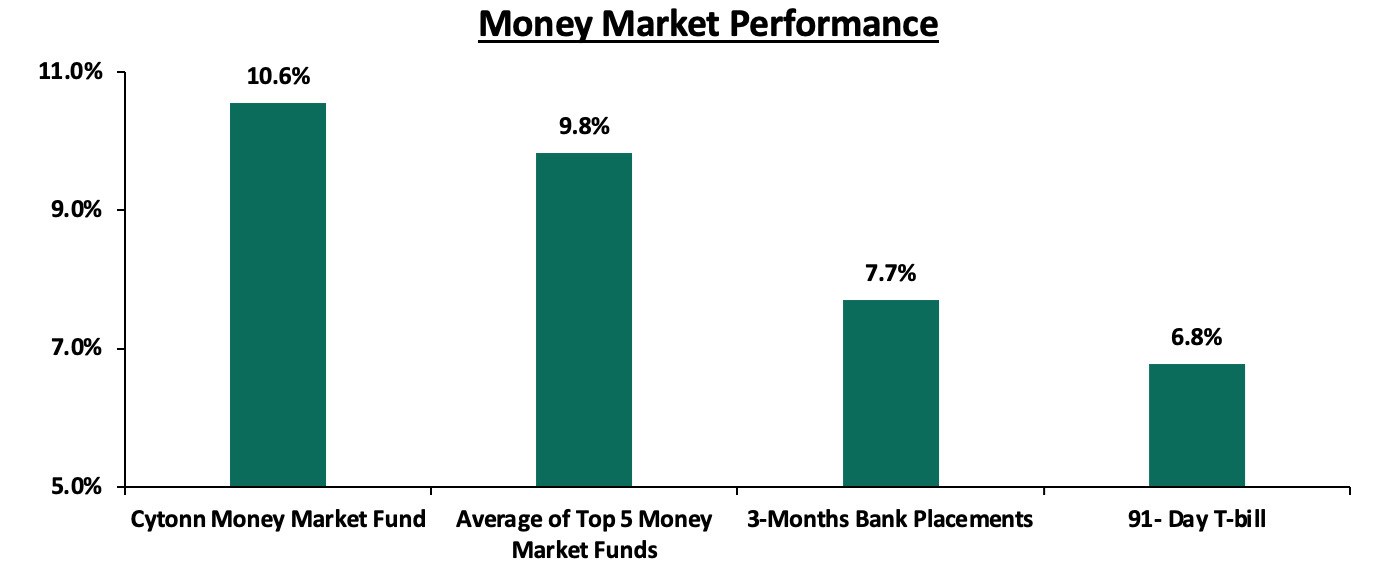
In the money markets, 3-month bank placements ended the week at 7.7% (based on what we have been offered by various banks), while the yield on the 91-day T-bill increased by 0.7 bps to 6.8%. The average yield of the Top 5 Money Market Funds declined by 0.1% points to 9.8%, from the 9.9% recorded the previous week. The yield on the Cytonn Money Market Fund also declined by 0.1% points to 10.6%, from 10.7% recorded last week.
The table below shows the Money Market Fund Yields for Kenyan Fund Managers as published on 10th September 2021:
|
Money Market Fund Yield for Fund Managers as published on 10th September 2021 |
|||
|
Rank |
Fund Manager |
Daily Yield |
Effective Annual Rate |
|
1 |
Cytonn Money Market Fund |
10.03% |
10.55% |
|
2 |
Nabo Africa Money Market Fund |
9.70% |
10.18% |
|
3 |
Zimele Money Market Fund |
9.56% |
9.91% |
|
4 |
Sanlam Money Market Fund |
8.98% |
9.39% |
|
5 |
Madison Money Market Fund |
8.76% |
9.16% |
|
6 |
CIC Money Market Fund |
8.70% |
9.00% |
|
7 |
Apollo Money Market Fund |
9.10% |
8.95% |
|
8 |
Dry Associates Money Market Fund |
8.43% |
8.76% |
|
9 |
Orient Kasha Money Market Fund |
8.35% |
8.71% |
|
10 |
Co-op Money Market Fund |
8.33% |
8.69% |
|
11 |
GenCapHela Imara Money Market Fund |
8.26% |
8.61% |
|
12 |
British-American Money Market Fund |
8.20% |
8.51% |
|
13 |
ICEA Lion Money Market Fund |
8.02% |
8.35% |
|
14 |
NCBA Money Market Fund |
8.02% |
8.33% |
|
15 |
Old Mutual Money Market Fund |
7.38% |
7.14% |
|
16 |
AA Kenya Shillings Fund |
6.53% |
6.72% |
Source: Business Daily
Liquidity:
During the week, liquidity in the money markets tightened, with the average interbank rate increasing by 0.3% points to 3.6% from 3.3% recorded the previous week, attributable to tax remittances which offset government payments made during the week. The average interbank volumes increased by 21.8% to Kshs 13.7 bn, from Kshs 11.2 bn recorded the previous week.
Kenya Eurobonds:
During the week, the yields on all Eurobonds increased, with the yields on the 30-year bond issued in 2018, the 10-year bond issued in 2018, the 7-year bond issued in 2019, and the 12-year bond issued in 2019 all increasing by 10.0 bps to close the week at 7.2%, 5.0%, 4.7%, and 6.1% respectively. The 12-year bond issued in 2021 and the 10-year bond issued in 2014 both increased by 20.0 bps to close the week at 6.1% and 3.3%, respectively. Below is a summary of the performance:
|
Kenya Eurobond Performance |
||||||
|
|
2014 |
2018 |
2019 |
2021 |
||
|
Date |
10-year issue |
10-year issue |
30-year issue |
7-year issue |
12-year issue |
12-year issue |
|
31-Dec-20 |
3.9% |
5.2% |
7.0% |
4.9% |
5.9% |
- |
|
31-Aug-21 |
3.1% |
5.0% |
7.1% |
4.6% |
6.0% |
5.9% |
|
3-Sep-21 |
3.1% |
4.9% |
7.1% |
4.6% |
6.0% |
5.9% |
|
6-Sep-21 |
3.1% |
4.9% |
7.1% |
4.6% |
6.0% |
5.9% |
|
7-Sep-21 |
3.1% |
4.9% |
7.1% |
4.7% |
6.1% |
6.0% |
|
8-Sep-21 |
3.1% |
5.0% |
7.1% |
4.7% |
6.1% |
6.0% |
|
9-Sep-21 |
3.1% |
5.0% |
7.2% |
4.7% |
6.1% |
6.1% |
|
10-Sep-21 |
3.3% |
5.0% |
7.2% |
4.7% |
6.1% |
6.1% |
|
Weekly Change |
0.2% |
0.1% |
0.1% |
0.1% |
0.1% |
0.2% |
|
MTD Change |
0.0% |
0.0% |
0.1% |
0.1% |
0.1% |
0.1% |
|
YTD Change |
(0.9%) |
(0.2%) |
0.2% |
(0.1%) |
0.2% |
- |
Source: Reuters
Kenya Shilling:
During the week, the Kenyan shilling appreciated marginally by 0.1% against the US dollar to close the week at Kshs 109.9, from Kshs 110.0 recorded the previous week, mainly attributable to the lacklustre dollar demand from general importers. On a YTD basis, the shilling has depreciated by 0.6% against the dollar, in comparison to the 7.7% depreciation recorded in 2020. We expect the shilling to remain under pressure for the remainder of 2021 as a result of:
- Rising uncertainties in the global market due to the Coronavirus pandemic, which has seen investors continue to prefer holding their investments in dollars and other hard currencies and commodities,
- The widened current account position which increased by 0.5% points to 5.4% of GDP in the 12 months to August 2021 from 4.9% of GDP for a similar period in 2020, and,
- Demand from energy importers as they beef up their hard currency positions in the prevailing elevated global oil prices.
The shilling is however expected to be supported by:
- The Forex reserves, currently at USD 9.6 bn (equivalent to 5.9 months of import cover), which is above the statutory requirement of maintaining at least 4.0 months of import cover, and the EAC region’s convergence criteria of 4.5-months of import cover, and,
- Improving diaspora remittances evidenced by a 21.6% y/y increase to USD 336.7 mn in July 2021, from USD 277.0 mn recorded over the same period in 2020, which has continued to cushion the shilling against further depreciation.
Weekly Highlight
- Stanbic Bank’s Monthly Purchasing Manager’s Index (PMI)
The headline Purchasing Manager’s Index (PMI) for the month of August increased to 51.1 from 50.6 recorded in the month of July 2021, indicating that the business conditions in the Kenyan private sector recorded an expansion. Output levels continued to expand, but at a slower pace compared to July, an indication that some businesses lacked the capacity to keep up with the growth in demand. The chart below summarizes the evolution of the PMI over the last 24 months:
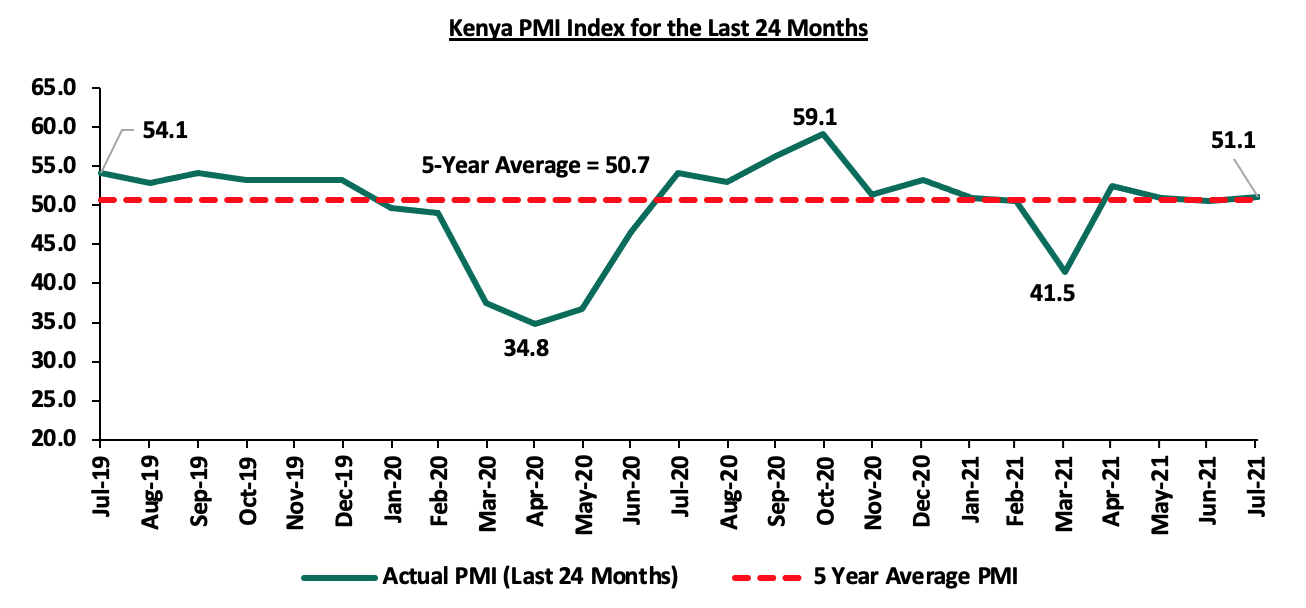
*** Key to note, a reading above 50.0 signals an improvement in business conditions, while readings below 50.0 indicate a deterioration
In line with the increase of the PMI index reading for the month of August 2021, we maintain a cautious outlook in the short-term owing to the increasing cost pressures, slowing sales growth and more worryingly, concerns of an uptick in COVID-19 infections. The discovery of new variants, especially the Delta variant, which is more easily transmissible might lead to another wave of infections and more restrictions that will affect the business environment.
- KNBS Economic Survey 2021
During the week, the Kenya National Bureau of Statistics (KNBS) released the Economic Survey 2021, indicating that the economy contracted by 0.3% in 2020, from the restated 5.0% growth recorded in 2019. The contraction is mainly attributable to the slowdown in economic activities due to emergence of the COVID-19 pandemic which resulted in sharp declines in demand and supply of goods and services. The contraction was spread across all sectors of the economy but the sectors that were hard hit included the accommodation and food serving activities, education, and professional and administrative services. Some of the key observations made were;
- The agriculture, forestry and fishing activities grew at a faster rate of 4.6% compared to the 2.3% growth recorded in 2019. This was despite a contraction in global demand in 2020 due to the prevailing economic situation brought about by the pandemic,
- Growth in the manufacturing sector was slower in 2020, recording a 0.2% growth, down from the 2.8% growth recorded in 2019. The lower growth is attributed to declines in some sub-sectors such as; manufacture of leather and leather related products, beverages, motor vehicle, trailers and semi-trailers, and dairy products. These declines were however mitigated by increased production in sugar, tea, cement, chemical and chemical products, and pharmaceutical products,
- Tourism earnings declined by 43.9% to Kshs 91.7 bn in 2020, from Kshs 163.6 bn in 2019 as hotel bed-night occupancy contracted by 58.0% to 3.8 mn from 9.2 mn in 2019. The number of international visitor arrivals declined drastically by 71.5% to 0.6 mn from 2.0 mn in 2019, and,
- The Central Bank of Kenya (CBK) reviewed the Central Bank Rate (CBR) downwards during the year by 1.3% points to 7.0% April from 8.3% in December 2019. The downward revision was to help cushion the banking system from adverse effects of the COVID-19 pandemic. During the review period, there was a general decline in the interest rates as the lending rate for commercial banks’ loans and advances reduced to 12.0% in December 2020, from 12.2% in December 2019 while the average deposit rate reduced to 6.3% in 2020 from 7.1% in 2019.
Some other key highlights from the report include:
- Public Debt: Total stock of public debt rose by 14.3% to Kshs 6,057.8 bn in 2020 from 5,301.6 bn in 2019, with public external debt accounting for 55.3% of the total debt. In 2020/21 a total of Kshs 713.3 bn is expected to be spent on servicing public debt,
- Employment: During the year, total employment outside small-scale agriculture and pastoral activities stood at 17.4 mn, down from 18.1 mn recorded in 2019. During the review period, informal sector employment is estimated to have contracted to 14.5 mn jobs,
- Money Supply: Broad money supply increased to Kshs 3,990.9 bn in December 2020 from Kshs 3,524.0 in December 2019. Total domestic credit grew by 50.9% to Kshs 1,358.4 bn compared to a growth of 4.8% seen in 2019,
- Liquidity: Quasi money, money supply (M2), broad money supply (M3), and overall liquidity grew by 10.9%, 11.9%, 13.2%, and 16.6% respectively in the review period,
- Imports & Exports: Total exports increased by 7.9% to Kshs 643.7 bn in 2020, from Kshs 596.7 bn in 2019, mainly on account of increased value of domestic exports. As a result, the balance of trade narrowed by 17.3% to a deficit of Kshs 999.9 bn in 2020, from 1,209.7 bn in 2019. The total value of trade transactions declined to Kshs 2,287.3 bn, from Kshs 2,403.0 bn in 2019, and,
- Balance of Payments: The overall Balance of Payment position deteriorated to a deficit of Kshs 152.5 bn, from a surplus of Kshs 111.4 bn in 2019, this was partly attributable to the depreciation of the Kenyan Shilling against major currencies in 2020, and,
- Current Account: The current account balance improved to a deficit of Kshs 491.7 bn in 2020, from a deficit of Kshs 539.2 bn in 2019. The current account deficit as a percentage of GDP came in at 4.6% in 2020.
The tourism and hospitality sector recorded reduced activities following the containment measures leading to a 47.7% decline in food and accommodation services in 2020. We expect Kenya’s economy to rebound in 2021, with a projected growth rate of 4.0%-4.5%, driven by the upturn in economic activities following the reopening of the services sectors including education, the recovery in manufacturing, and stronger global demand. Given the uneven vaccine distribution, we believe there are risks abound this economic rebound as more strains of the virus continue to be discovered. The other key challenge shall be the performance of the Agriculture sector given the adverse weather being witnessed currently. It is worth noting that the KNBS has revised and rebased the national accounts with the base year changing to 2016 from 2009. The rebased nominal GDP for 2020 now stands at Kshs 10.8 tn, from Kshs 10.3 tn in 2019.
Rates in the fixed income market have remained relatively stable due the sufficient levels of liquidity in the money market, coupled with the discipline by the Central Bank to reject expensive bids. The government is 21.6% ahead of its prorated borrowing target of Kshs 139.3 bn having borrowed Kshs 169.4 bn of the Kshs 658.5 bn borrowing target for the FY’2021/2022. We expect a gradual economic recovery going into FY’2021/2022 as evidenced by the KRA July collections of Kshs 267.1 bn compared to the monthly prorated amount of Kshs 266.0 bn. However, despite the projected high budget deficit of 7.5% and the lower credit rating from S&P Global to 'B' from 'B+', we believe that the monetary support from the IMF and World Bank will mean that the interest rate environment may stabilize since the government will not be desperate for cash.
Markets Performance
During the week, the equities market was on an upward trajectory, with NSE 20 gaining by 1.9%, while both NASI and NSE 25 gained by 0.4%, taking their YTD performance to gains of 18.5%, 15.8% and 10.2% for NASI, NSE 25 and NSE 20, respectively. The equities market performance was mainly driven by gains recorded by large-cap stocks such as Equity Group, NCBA Group and Safaricom which gained by 2.2%, 1.7% and 0.8%, respectively. The gains were however weighed down by losses recorded by banking stocks such as Diamond Trust Bank (DTB-K) and ABSA Bank, which declined by 1.5% and 1.4%, respectively.
During the week, equities turnover increased by 0.7% to USD 18.2 mn, from USD 18.1 mn recorded the previous week, taking the YTD turnover to USD 862.6 mn. Foreign investors turned net buyers, with a net buying position of USD 2.2 mn, from a net selling position of USD 1.9 mn recorded the previous week, taking the YTD net selling position to USD 9.1 mn.
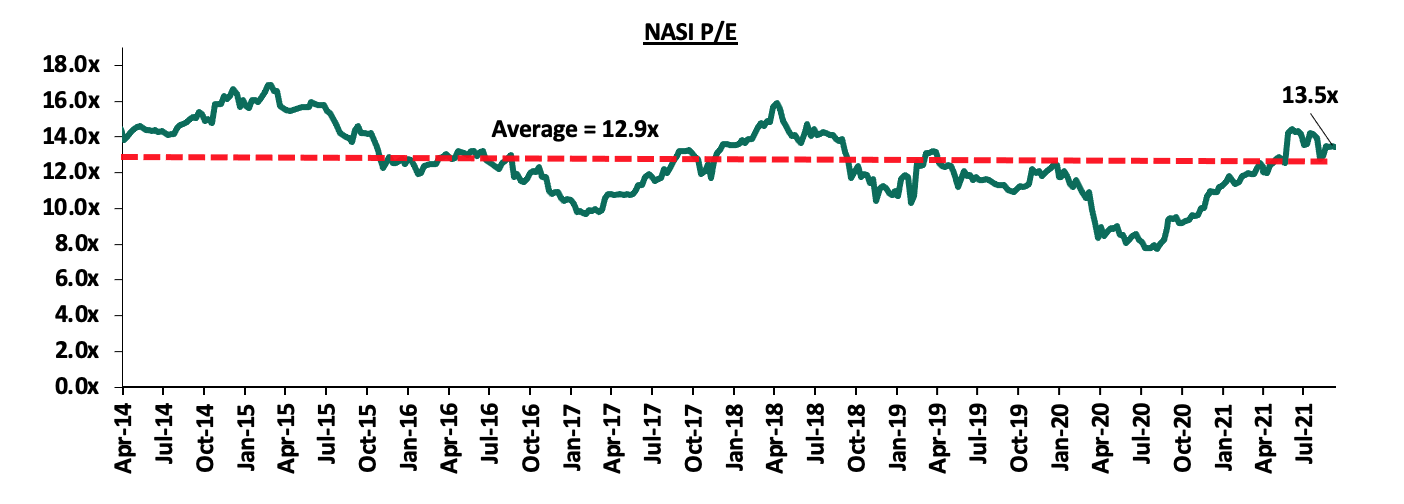
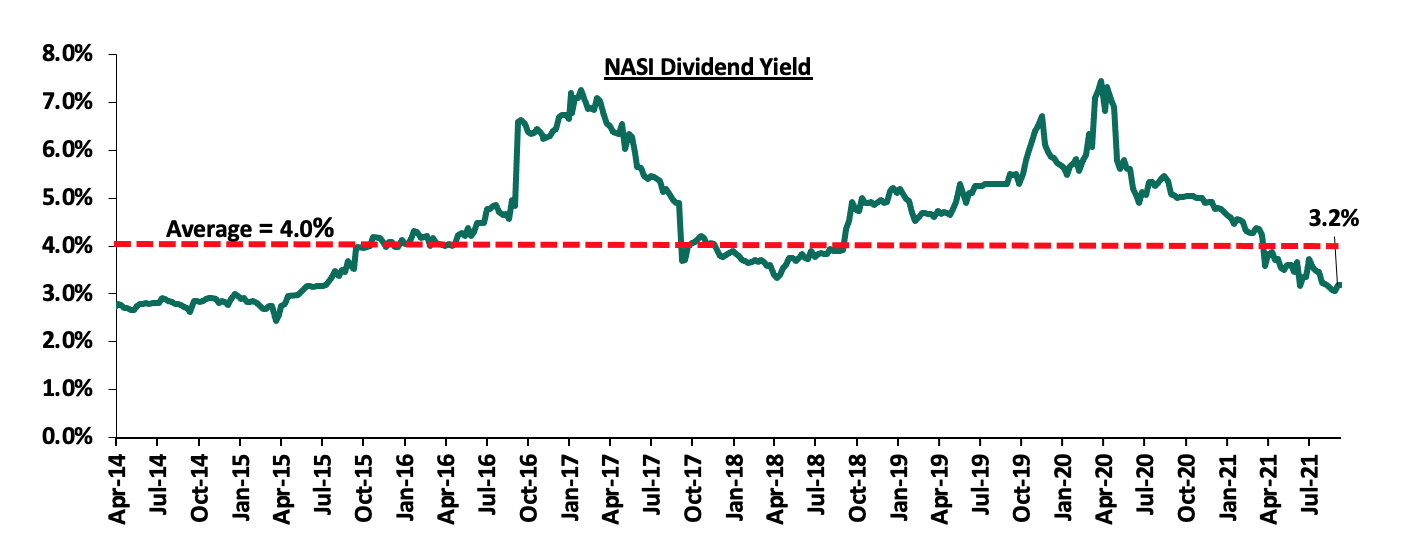
The market is currently trading at a price to earnings ratio (P/E) of 13.5x, 4.1% above the historical average of 12.9x, and a dividend yield of 3.2%, 0.8% points below the historical average of 4.0%. Key to note, NASI’s PEG ratio currently stands at 1.5x, an indication that the market is trading at a premium to its future earnings growth. Basically, a PEG ratio greater than 1.0x indicates the market may be overvalued while a PEG ratio less than 1.0x indicates that the market is undervalued. Excluding Safaricom, which is currently 61.4% of the market, the market is trading at a P/E ratio of 12.1x and a PEG ratio of 1.4x. The current P/E valuation of 13.5x is 74.8% above the most recent trough valuation of 7.7x experienced in the first week of August 2020. The charts below indicate the historical P/E and dividend yields of the market;
Weekly Highlight:
The Insurance Regulatory Authority (IRA), recently released the Q2'2021 Insurance Industry Report highlighting that the industry’s gross premiums rose by 19.0% to Kshs 144.0 bn, from Kshs 121.0 bn recorded in Q2’2020, with the general insurance business contributing to 59.3% of the industry’s premium income, an 8.5% points increase from the 50.8% contribution witnessed in Q2’2020. The general insurance business has continued to report high underwriting losses mainly attributed to increases in loss ratios as the net claims outpace net premiums.
Other key take-outs from the report include:
- Investment income increased significantly by 112.3% to Kshs 26.3 bn in Q2’2021, from Kshs 12.4 bn recorded in Q2’2020 for long term insurance businesses, and also increased by 42.6% for general insurance businesses to Kshs 6.3 bn, from Kshs 4.4 bn recorded in Q2’2020. The increases can be attributed to fair value gains on quoted equity investments in the capital market as evidenced by the increases in the NASI, NSE 25 and NSE 20 which have posted YTD gains of 18.5%, 15.8% and 10.2% respectively,
- The net claims for the long term insurance business increased by 15.3% to Kshs 39.4 bn, from Kshs 30.6 bn in Q2’2020, mainly driven by increased requests from individuals wishing to access their pension benefits given the reduction in their disposable income. This saw the loss ratio for the long term business increase by 3.4% points to 72.2%, from 68.8% recorded in Q2’2020,
- The loss ratio for the general insurance businesses increased to 66.8% in Q2’2021, from 61.6% in Q2’2020 owing to a 15.3% increase in claims which outpaced the 6.5% increase in the net earned premium income. The increase in claims was mainly driven by the 35.7% growth in domestic fire claims to Kshs 241.6 bn, from Kshs 178.1 bn in Q2’2020. Key to note, the incurred loss ratio during the quarter of 66.8% is 2.6% points higher than the three-year industry average of 64.2%, and,
- General insurance businesses recorded an underwriting loss of Kshs 1.5 bn in Q2’2021 as compared to a profit of Kshs 62.5 mn in Q2’2020. This increased loss was mainly driven by a 197.1% increase in Motor private class of general insurance loss to Kshs 2.9 bn from Kshs 1.0 bn in Q2’2021. Workmen’s compensation class made the highest underwriting profit of Kshs 2.0 bn while motor private and motor commercial classes of general insurance business incurred the highest losses of Kshs 2.9 bn and Kshs 1.0 bn respectively.
In our view, the insurance sector is expected to continue to record increased investment income mainly driven by gains recorded in both the Equities and Fixed income markets. The insurance sector’s profitability is however expected to be weighed down by the high loss ratios, especially in the general insurance business as the net claims outpace net premiums.
Universe of Coverage:
|
Company |
Price as at 03/09/2021 |
Price as at 10/09/2021 |
w/w change |
YTD Change |
Year Open 2021 |
Target Price* |
Dividend Yield |
Upside/ Downside** |
P/TBv Multiple |
Recommendation |
|
I&M Group*** |
22.8 |
22.5 |
(1.1%) |
(49.8%) |
44.9 |
32.0 |
10.0% |
52.2% |
0.3x |
Buy |
|
ABSA Bank*** |
10.6 |
10.4 |
(1.4%) |
9.2% |
9.5 |
13.8 |
0.0% |
32.7% |
1.2x |
Buy |
|
Kenya Reinsurance |
2.5 |
2.5 |
0.8% |
9.1% |
2.3 |
3.1 |
7.9% |
31.0% |
0.3x |
Buy |
|
Sanlam |
10.5 |
9.9 |
(5.5%) |
(23.7%) |
13.0 |
12.4 |
0.0% |
25.0% |
0.9x |
Buy |
|
NCBA*** |
27.2 |
27.7 |
1.7% |
3.9% |
26.6 |
31.0 |
5.4% |
17.5% |
0.7x |
Accumulate |
|
KCB Group*** |
46.8 |
46.6 |
(0.4%) |
21.4% |
38.4 |
53.4 |
2.1% |
16.7% |
1.0x |
Accumulate |
|
Standard Chartered*** |
136.3 |
135.0 |
(0.9%) |
(6.6%) |
144.5 |
145.4 |
7.8% |
15.5% |
1.1x |
Accumulate |
|
Co-op Bank*** |
13.4 |
13.4 |
(0.4%) |
6.4% |
12.6 |
14.1 |
7.5% |
13.1% |
0.9x |
Accumulate |
|
Equity Group*** |
49.9 |
51.0 |
2.2% |
40.7% |
36.3 |
57.5 |
0.0% |
12.7% |
1.4x |
Accumulate |
|
Stanbic Holdings |
94.0 |
89.3 |
(5.1%) |
5.0% |
85.0 |
96.6 |
1.9% |
10.1% |
0.8x |
Accumulate |
|
Liberty Holdings |
8.3 |
7.6 |
(8.0%) |
(0.8%) |
7.7 |
8.4 |
0.0% |
9.9% |
0.6x |
Hold |
|
Diamond Trust Bank*** |
65.0 |
64.0 |
(1.5%) |
(16.6%) |
76.8 |
67.3 |
0.0% |
5.2% |
0.3x |
Hold |
|
Jubilee Holdings |
360.0 |
359.3 |
(0.2%) |
30.3% |
275.8 |
330.9 |
2.5% |
(5.4%) |
0.7x |
Sell |
|
HF Group |
3.7 |
3.8 |
3.6% |
20.7% |
3.1 |
3.1 |
0.0% |
(18.2%) |
0.2x |
Sell |
|
Britam |
8.3 |
8.3 |
0.5% |
19.1% |
7.0 |
6.7 |
0.0% |
(19.7%) |
1.5x |
Sell |
|
CIC Group |
2.8 |
2.8 |
(1.4%) |
32.7% |
2.1 |
1.8 |
0.0% |
(35.7%) |
1.0x |
Sell |
|
*Target Price as per Cytonn Analyst estimates as at H1’2021 **Upside/ (Downside) is adjusted for Dividend Yield ***For Disclosure, these are stocks in which Cytonn and/or its affiliates are invested in Key to note, I&M Group YTD share price change is mainly attributable to the counter trading ex-bonus issue |
||||||||||
We are “Neutral” on the Equities markets in the short term. With the market currently trading at a premium to its future growth (PEG Ratio at 1.5x), we believe that investors should reposition towards companies with a strong earnings growth and are trading at discounts to their intrinsic value. Additionally, we expect the recent discovery of new strains of COVID-19 coupled with the introduction of strict lockdown measures in major economies to continue dampening the economic outlook.
- Industry Reports
During the week, the Kenya National Bureau of Statistics (KNBS) released the Economic Survey 2021 and below are the key take-outs related to the real estate sector;
- Real estate contribution to GDP increased marginally by 0.1% points to 9.3% in FY’2020 from 9.2% recorded in FY’2019. However, the annual growth of the real estate sector recorded a contraction of 2.6% points to 4.1% in FY’2020 from the 6.7% growth recorded in FY’2019. Loans advanced to the real estate sector increased by 8.7% to Kshs 406.8 bn as at FY’2020 from Kshs 374.1 bn as at FY’2019,
The graphs below show the percentage contribution of real estate to GDP and the real estate sector annual percentage growth from 2016-2020;
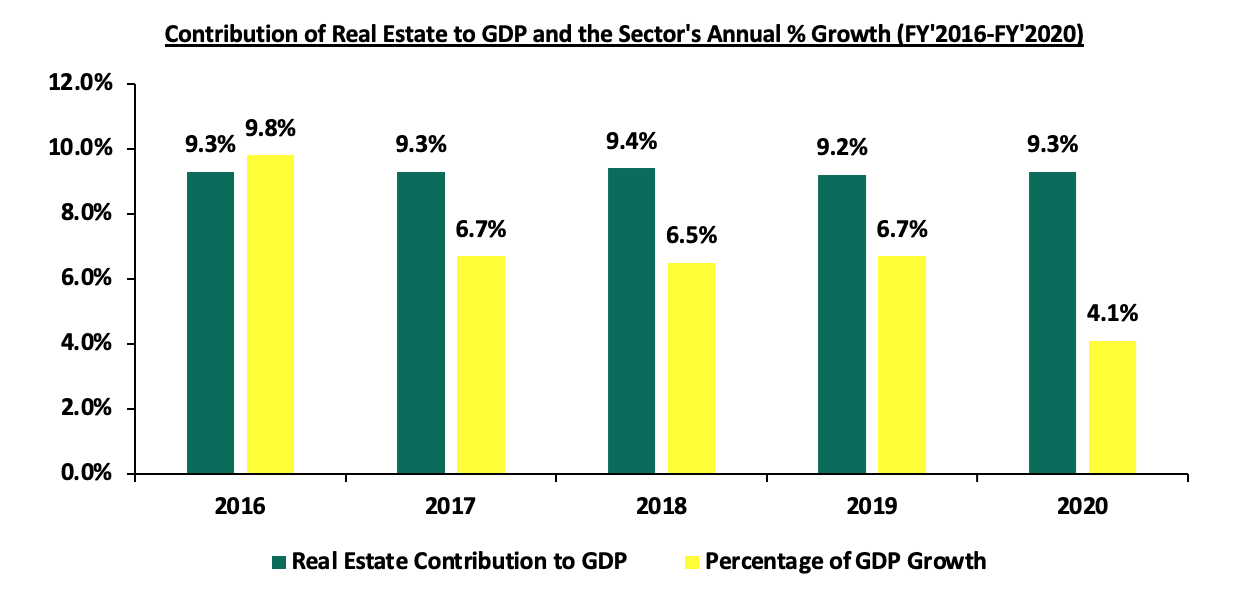
Source: Kenya National Bureau of Statistics
- In the infrastructure sector, by H1’2020, the total bitumen roads were 22,600 km, an increase of 6.1% from 21,300 km in H1’2019. As at FY’2020, the construction of the Nairobi Expressway, which is a 108-kilometre lane-length, with an estimated construction cost of Kshs 63.8 bn was 16.6% complete while the Nairobi Western Bypass was 33.0% complete as the government continues to facilitate provision, maintenance and management of road infrastructure in support of Vision 2030 aspirations in order to provide safe, efficient, accessible and sustainable transportation services,
- The building and construction sector registered a growth of 11.8% in FY’2020 compared to a growth of 5.6% recorded in FY’2019 translating to a 6.2% points y/y growth. Cement consumption, a key input to construction activities rose significantly by 21.3% to 7.4 mn tonnes in FY’2020 from 6.1 mn tonnes in FY’2019. Loans advanced from banks to the construction sector grew by 3.4% to Kshs 119.7 bn in FY’2020 from Kshs 115.8 bn advanced in FY’2019 and were mainly channelled towards financing of real estate developments, and,
- In FY’2020, the State Department for Housing and National Housing Corporation (NHC) completed 2,332 and 338 units respectively, of public residential buildings, with construction of 2,032 housing units ongoing at a cost of Kshs 3.7 bn in an aim to boost government’s efforts to actualize its housing initiative under the Big 4 Agenda.
The real estate sector has shown resilience in the various sectors from infrastructure, construction to housing, which signifies the strong underlying factors despite the effects of the Covid-19 pandemic. Going forward, we expect growth in performance by higher margins as the country is on the path towards economic recovery.
- Residential Sector
During the week, Purple Dot International Limited, a local real estate developer, began the handing over of its Kshs 1.0 bn Marigold gated community development off Link Road in Lang’ata constituency.
The table below shows the analysis of Marigold Residency and other residential projects done by Purple Dot International Limited;
|
Purple Dot International Limited Residential Projects |
||||||
|
Project |
Location |
Land Size (Acres) |
Number of Units per Typology |
Unit Price (Kshs) |
Unit Size (SQM) |
Price per SQM (Kshs) |
|
Marigold Residency |
Link Road, Lang’ata |
3 |
42-4 Bedroom Townhouses |
31.0 mn |
246 |
126,016 |
|
Elina Housing Project |
Mandera Road, Kileleshwa |
0.7 |
66-3 Bedroom Apartments |
23.0 mn |
214 |
107,477 |
|
4-Duplex Penthouses |
55.0 mn |
390 |
141,025 |
|||
|
Serene Park Project |
Machakos-Mombasa Junction |
0.13 (for each Villa) |
90-4 Bedroom Villas |
24.0 mn |
335 |
71,642 |
Source: Cytonn Research
The Marigold Residency development broke ground in November 2020 and is currently at its final stages. Moreover, the uptake of the units is currently at 76.0% with sale price of Kshs 31.0 mn per townhouse, translating to an average price of Kshs 126,016 per SQM which is 22.8% lower than the average market price per SQM in Lang’ata at Kshs 163,120 according to Cytonn H1’2021 Markets Review Report. The choice to invest in residential real estate in Lang’ata is informed by; i) accessibility of the area being served by both Lang’ata road and Southern Bypass, ii) proximity to social amenities like international schools and malls such as Hillcrest and Galleria, respectively, and, iii) an increasing population in Lang’ata which has grown by 12.0% to 197,489 persons in 2019 from 176,314 persons in 2009 according to the Kenya National Bureau of Statistics data hence increasing the demand for housing.
In terms of performance, according to Cytonn H1'2021 Markets Review Report, detached units in Lang’ata recorded an average uptake of 92.9% which is 6.7% points higher than the average Upper Mid-End detached unit’s performance of 86.2%, highlighting the demand for detached units in the area.
The table below shows the performance of Upper Mid-End detached units in the Nairobi Metropolitan Area (NMA) in H1’2021;
(All Values in Kshs unless stated otherwise)
|
Detached Units Performance H1’2021 |
||||||||
|
Area |
Average of Price per SQM H1'2021 |
Average of Rent per SQM H1'2021 |
Average of Occupancy H1'2021 |
Average of Uptake H1'2021 |
Average of Annual Uptake H1'2021 |
Average of Rental Yield H1'2021 |
Average of Price Appreciation H1'2021 |
Average Total Returns H1'2021 |
|
Upper Mid-End |
||||||||
|
Redhill & Sigona |
97,843 |
446 |
90.9% |
90.9% |
15.4% |
5.2% |
1.3% |
6.5% |
|
Ridgeways |
152,100 |
775 |
84.5% |
86.2% |
13.4% |
5.2% |
1.2% |
6.3% |
|
Runda Mumwe |
152,949 |
635 |
85.2% |
80.1% |
14.1% |
4.3% |
2.0% |
6.3% |
|
Loresho |
148,543 |
673 |
87.8% |
82.0% |
10.7% |
4.8% |
1.5% |
6.3% |
|
South B/C |
127,298 |
537 |
94.4% |
88.7% |
14.0% |
4.8% |
1.2% |
6.0% |
|
Langata |
163,120 |
555 |
85.9% |
92.9% |
10.0% |
3.9% |
0.8% |
4.8% |
|
Lavington |
158,686 |
647 |
86.1% |
82.5% |
12.9% |
4.4% |
0.3% |
4.7% |
|
Average |
142,934 |
610 |
87.8% |
86.2% |
12.9% |
4.6% |
1.2% |
5.8% |
Source: Cytonn H1’2021 Markets Review
Additionally, Gulf African Bank Limited launched a mortgage facility that will see home buyers access mortgage loans at 11.8% p.a, 1.2% points lower than the 13.0% interest rate currently offered by the bank. The credit facility is expected to run for three months until December 2021, targeting both Muslim and non-Muslim clients with the lender aiming to expand its customer base and boosting mortgage uptake. The facility named ‘Getting You Home in 48 hours’, features mortgage takeovers from other financial institutions, outright purchases for new home buyers, diaspora mortgages and equity release facilities. Moreover, the bank will accept multiple payment vehicles such as pay slips, cash savings, pension lump sums and sale of investment property. Customers will also have their mortgage loan applications processed within 48 hours of application in addition to enjoying a repayment period of up to 20 years. The move by the lender comes barely less than a month after Stima Savings and Credit Cooperative (SACCO) Limited also launched its affordable housing mortgage scheme targeting both formal and informal sector players, a sign of the private sector’s resilience to boost mortgage accounts and increase home ownership rates within the country. The mortgage facility by Gulf African Bank is expected to boost its mortgage accounts and also subsequently increase the number of mortgage accounts in the country, currently at 26,971 as at 2020, a 3.5% decline from 27,943 accounts realized in 2019, attributable to the economic disruptions stemming from the Covid-19 pandemic which saw lenders adopt a conservative approach towards issuing loans.
The graph below shows the number of mortgage loan accounts in Kenya over the last 10 years;
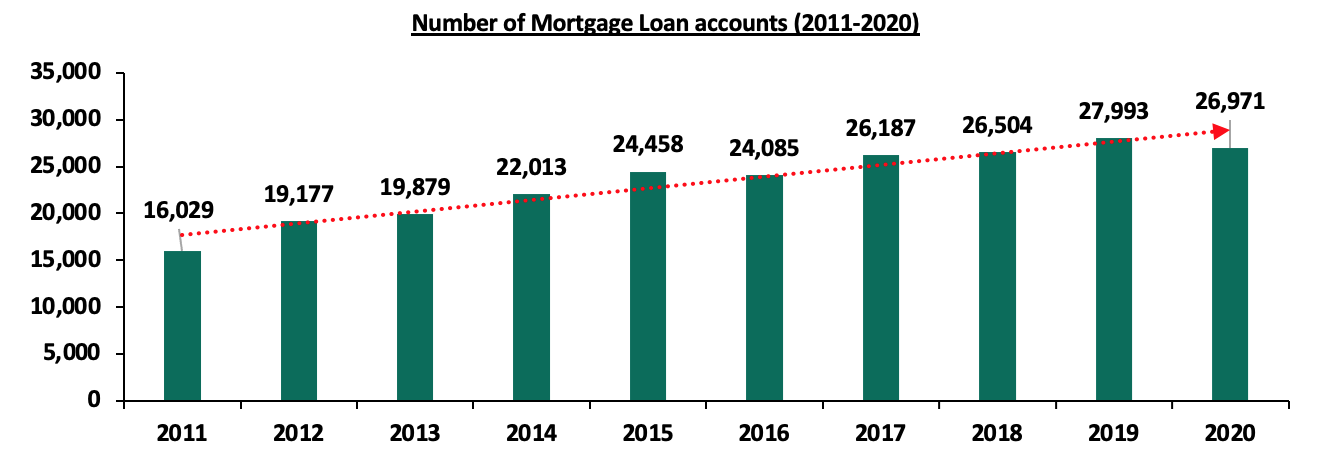
Source: Central Bank of Kenya
Kenya has continued to record slow mortgage uptake, resulting to a relatively low mortgage to GDP ratio which stands at 2.2% as at 2020, compared to other African countries such as Namibia at 18.9%. The low mortgage penetration is attributed to; i) the high interest rates and high deposit requirements, ii) soaring of property prices, iii) low-income levels making it hard to service the loans, iv) lack of credit risk information for those in the informal and self-employed sectors leading to their exclusion, v) lack of a secondary mortgage market that would improve ability of banks and other lenders to increase their lending capacity, and, vi) underdeveloped capital markets making it hard to develop pools of capital focused on mortgage finance. However, the Kenyan government, through the Kenya Mortgage and Refinance Company (KMRC), has worked on increasing the mortgage uptake through advancement of credit to mortgage lenders at a rate of 5.0% for onward lending at single digit rates. Moreover, KMRC has tripled the lending allocation for Primary Mortgage Lenders (PMLs) to Kshs 7.0 bn for the FY’2021/22, which represents a 153.5% increase from the Kshs 2.8 bn in FY’2020/21. While the increase is notable, given the average KMRC loan size at Kshs 3.5 mn, this will lead to an increase of only about 2,000 mortgages. Additionally, Gulf African Bank Limited launched a mortgage facility that will see home buyers access mortgage loans at 11.8% p.a, 1.2% points lower than the 13.0% interest rate currently offered by the bank. The credit facility is expected to run for three months until December 2021 However, it is not clear how KMRC will sustainably access funds for onward lending at the low rates, yet even the government can only access 20-year funds at a 13.3% rate.
The graph below shows the mortgage to GDP ratio for Kenya compared to other countries as at 2020;
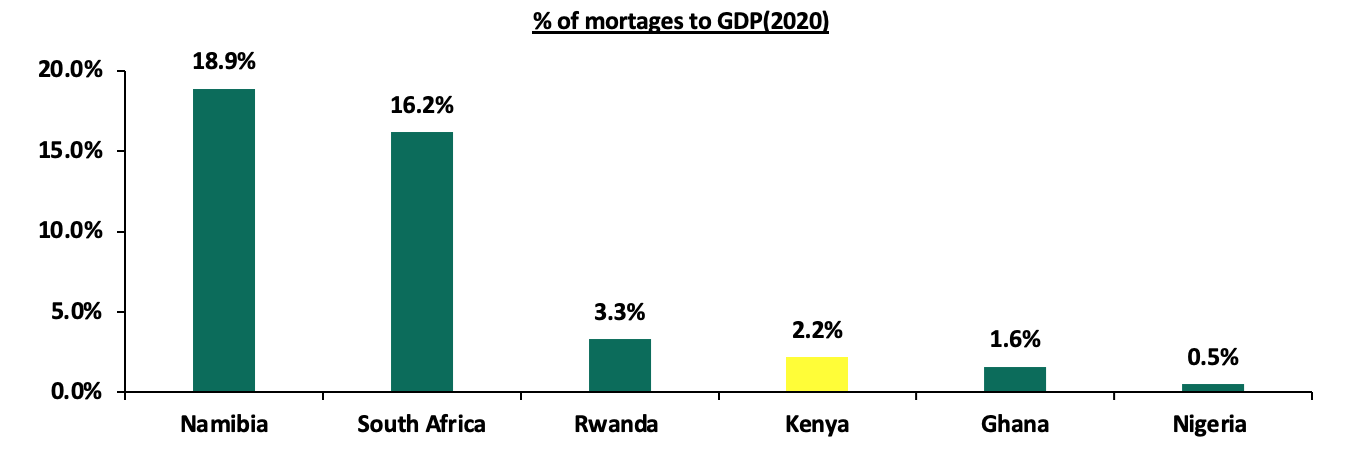
Source: Center for affordable housing
The expected increase in mortgage uptake is expected to improve the home ownership rate in Kenya which is currently low at 21.3% in the urban areas compared to other African countries such as South Africa and Ghana with 53.0% and 47.2%, respectively. The low home ownership rate is attributable to the high property prices and tough economic times reducing savings and disposable income.
The graph below shows the percentage of home ownership in different countries compared to Kenya.
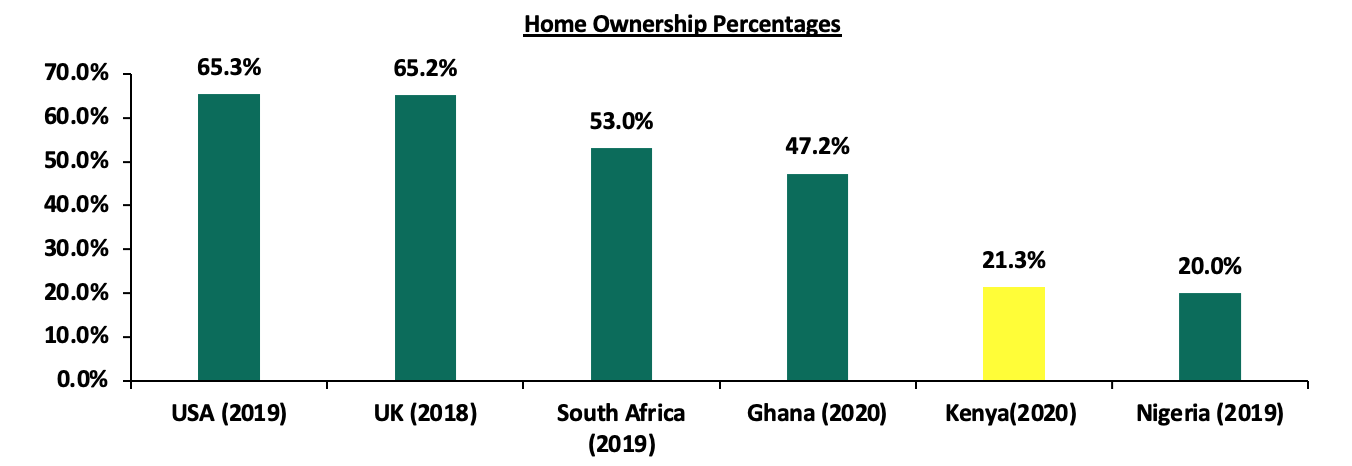
Source: Center for Affordable Housing Africa, Federal Reserve Bank
The residential sector is expected to continue recording increased activities attributed to private developer’s efforts to match demand for homes coupled with financial institutions such as the banks and SACCOs availing mortgage solutions to Kenyans with an aim to increase mortgage uptake and home ownership rates in Kenya.
- Hospitality Sector
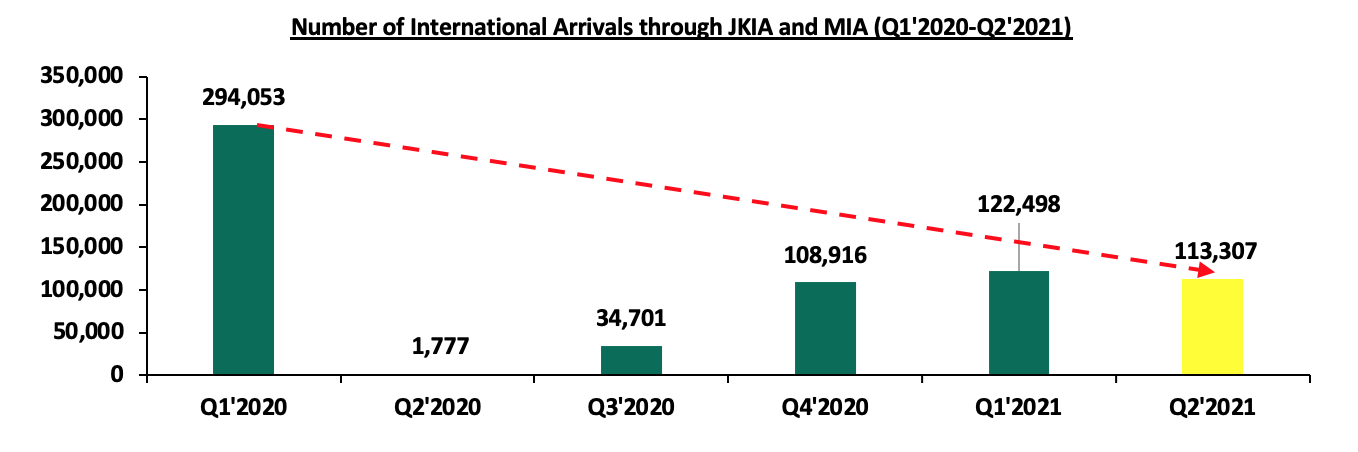
During the week, British Airways (BA), announced the resumption of operations on the Nairobi-London route after a 5-month hiatus due to the Covid-19 operatory environment guidelines. This move comes barely two months after the Ministry of Foreign Affairs lifted a ban on passenger flights between Nairobi and London in June 2021. The ban on flights had been imposed by the Ministry of Foreign Affairs in April 2021 as a retaliatory move following the United Kingdom (UK) listing Kenya on its ‘Red List’, a list of countries whose nationals were barred from entering the UK to prevent spread of Corona-virus. BA also announced that it will fly on the route once per week down from daily flights it was operating during pre-pandemic period. This move is expected to marginally increase the number of arrivals from UK despite the current fears of the Covid-19 Delta variant, low flights’ frequency and the high quarantine prices for UK nationals arriving from the Red-List countries. In terms of numbers, international arrivals through Jomo Kenyatta International Airport (JKIA) and Moi International Airport (MIA) registered an improvement from 1,177 arrivals in Q2’2020 to 113,307 arrivals in Q2’2021. However, there was a decline of 7.5% in international arrivals from 122,498 persons in Q1’2021 to 113,307 persons in Q2’2021 through the same airports. The decline in the number of international arrivals is expected to continue with Kenya currently in the Red-List of the UK and the US having raised its travel advisory from level 2 to level 3 in August 2021 since the two countries are regarded as key source markets of tourists in Kenya.
The graph below shows the number of visitor arrivals through Jomo Kenyatta International Airport (JKIA) and Moi International Arrivals (MIA) between Q1’2020 and Q1’2021;
Source: Kenya National Bureau of Statistics
The hospitality sector is expected to continue posting a low performance due to reduced activities attributable to travel bans and advisories from the top sources of visitors such as UK and USA. The Ministry of Tourism is also projecting a slower return to normalcy timeline with full normalcy to pre-pandemic levels expected in 2024. However, the Ministry of Tourism is making aggressive efforts to boost the performance of the hospitality industry such as ensuring mass vaccination against Covid-19 for industry players to boost confidence, and, aggressive marketing of the Kenyan hospitality industry through Magical Kenya platform to make it visible to the rest of the world with international promotions in countries such as the Ukraine currently underway.
The real estate sector is expected to be supported by private developer’s initiatives to provide opportunities to home buyers with competitive returns to investors, and the affordable mortgage initiatives by various banks. The percentage real estate growth and contribution to GDP is also expected to increase as the country reels on the path towards economic recovery. However, poor performance of the tourism sector from the low numbers of international arrivals is expected to hurt the performance of the hotels and serviced apartments with normalcy of performance to pre-Covid levels expected in two years.
Following the release of the H1’2021 results by Kenyan listed banks, the Cytonn Financial Services Research Team undertook an analysis on the financial performance of the listed banks and identified the key factors that shaped the performance of the sector.
Core Earnings per Share (EPS) recorded a weighted increase of 136.0% in H1’2021, from a weighted decline of 33.6% recorded in H1’2020. The significant growth in earnings is attributable to reduced provisioning levels by the listed banks following the relatively stable business operating environment during the period. The performance in H1’2021 is however skewed by the strong performance from ABSA, KCB Group, and Equity Group, which recorded core EPS growths of 846.0%, 101.9% and 97.7%, respectively.
The report is themed “Reduced Provisioning levels Spur Earnings Growth” where we assess the key factors that influenced the performance of the banking sector in H1’2021, the key trends, the challenges banks faced, and areas that will be crucial for growth and stability of the banking sector going forward. As such, we shall address the following:
- Key Themes That Shaped the Banking Sector Performance in H1’2021,
- Summary of The Performance of the Listed Banking Sector in H1’2021,
- The Focus Areas of the Banking Sector Players Going Forward, and,
- Brief Summary and Ranking of the Listed Banks based on the Outcome of Our Analysis.
Section I: Key Themes That Shaped the Banking Sector Performance in H1’2021
Below, we highlight the key themes that shaped the banking sector in H1’2021 which include; regulation, regional expansion through mergers and acquisitions, asset quality deterioration and capital raising for onward lending:
- Regulation :
- Closure of Loan restructuring Window: The loan restructuring window as per the Banking Circular No 3 of 2020 by the Central Bank of Kenya provided to commercial banks and mortgage finance companies on loan restructuring came to an end on March 2nd 2021, having seen a total of loans worth Kshs 1.7 tn restructured, representing 57.0% of the banking sector’s loan book. With this expiry, the banks are now back to normal loan risk management. However, despite the expiry of the loan restructuring window, some banks still supported their borrowers during the period with Equity Group, KCB Group and ABSA Bank Kenya cumulatively restructuring loans amounting to approximately Kshs 339.1 bn as at H1’2021;
|
No. |
Bank |
Cumulative Amount Restructured* (Kshs bn) |
% of Restructured loans to Gross loans |
Performing Restructured Loans (Kshs bn) |
% of Performing Restructured loans |
H1’2021 y/y Change in Loan loss provision |
|
1 |
Equity Group Holdings |
171.0 |
31.0% |
103.0 |
60.2% |
(63.7%) |
|
2 |
KCB Group |
106.1 |
15.9% |
95.8 |
90.3% |
(40.3%) |
|
3 |
ABSA Bank Kenya |
62.0 |
26.7% |
55.5 |
89.5% |
(63.9%) |
|
|
Total |
339.1 |
|
254.3 |
75.0% |
|
|
*Cumulative amount of loans restructured since the loan restructuring window opened in March 2020 |
||||||
- Regional Expansion through Mergers and Acquisitions: The Kenyan banks are looking at having an extensive regional reach and to this end, the following were the major M&A’s activities announced in H1’2021:
- On 3rd May 2021, I&M Group announced that it completed the 90.0% acquisition of Orient Bank Limited Uganda (OBL) share capital, after receiving all the required regulatory approvals. As highlighted in our Cytonn Weekly #50/2020, I&M Group was set to pay Kshs 3.6 bn for the deal. However, the final cost is expected to be higher after the base price was adjusted to take into account multiple factors such as appreciation of the Ugandan shilling against the US dollar, integration support, the short-term financial performance of the subsidiary and the sale of its property. I&M Group will take over 14 branches from OBL, taking its total branches to 89, from 66 branches as at the end of 2020. For more information, please see Cytonn Weekly #18/2021, and,
- On 16th May 2021, Equity Group disclosed that it had acquired an additional 7.7% stake valued at Kshs 996.0 mn in Equity bank Congo (EBC) from the German Sovereign Wealth Fund (KfW). The acquisition raised the total ownership in EBC to 94.3%, indicating that they valued the company at Kshs 14.2 bn. This follows the acquisition of 66.5% stake in Banque Commerciale Du Congo (BCDC) by Equity Group at a cost of Kshs 10.2 bn in August 2020. For more information, please see Cytonn Weekly#20/2021.
Other mergers and acquisitions activities announced after H1’2021 include;
- On 25th August 2021, KCB Group announced that it had completed the 62.1% acquisition of Banque Populaire du Rwanda Plc (BPR), after receiving all the required regulatory approvals. KCB Group and Atlas Mara Limited had signed a definitive agreement in November 2020 for KCB’s acquisition of a 62.1% stake in BPR and a 100.0% stake in Africa Banking Corporation Tanzania Limited (BancABC), subject to shareholder approval and regulatory approval in the respective countries. In May 2021, KCB Group disclosed that it made an offer to the remaining BPR shareholders to raise its acquisition stake in the bank to 100.0% from 62.1% and received shareholders’ approval for the acquisitions, with only regulatory approval pending for the finalization of the transactions. Regulatory approval is however still pending with respect to the KCB’s acquisition of BancABC from Atlas Mara. As highlighted in our Cytonn Weekly #29/2021 and Cytonn Weekly #19/2021, KCB Group agreed to purchase 62.1% stake in BPR from Atlas Mara Limited using a Price to Book Value (P/Bv) of 1.1x. According to the latest BPR financials released as of June 2021, the bank had a book value of Rwf 52.9 bn (Kshs 5.8 bn), and thus at the trading multiple of 1.1x, we expect KCB Group to have spent an estimated Kshs 6.3 bn to acquire BPR Rwanda. For BanABC’s acquisition, KCB will pay to the seller a cash consideration to be determined based on a price to book value ratio using a multiple of 0.4x of the net asset value of BancABC at completion. For more information on the acquisition, see our Cytonn Weekly #19/2021.
Even as the banks continue to expand regionally, we still expect to see more consolidation in the Kenyan banking sector as the weaker banks are merged with the big banks to form a stronger banking system. The COVID-19 pandemic exposed the weak banks in the industry which might need to be acquired by larger banks in order to boost their capital adequacy and liquidity ratios to the required minimum statutory levels.
Below is a summary of the deals in the last 7 years that have either happened, been announced or expected to be concluded:
|
Acquirer |
Bank Acquired |
Book Value at Acquisition (Kshs bn) |
Transaction Stake |
Transaction Value (Kshs bn) |
P/Bv Multiple |
Date |
|
I&M Group |
Orient Bank Limited Uganda |
3.3 |
90.0% |
3.6 |
1.1x |
April-21 |
|
KCB Group |
Banque Populaire du Rwanda, and, ABC Tanzania |
5.3 (Banque Populaire du Rwanda, only. ABC Tanzania financials unknown) |
100.0% |
6.3 |
1.1x |
Acquisition of BPR Rwanda – August 2021, Nov-20* |
|
Co-operative Bank |
Jamii Bora Bank |
3.4 |
90.0% |
1 |
0.3x |
Aug-20 |
|
Commercial International Bank |
Mayfair Bank Limited |
1 |
51.0% |
Undisclosed |
N/D |
May-20* |
|
Access Bank PLC (Nigeria) |
Transnational Bank PLC. |
1.9 |
100.0% |
1.4 |
0.7x |
Feb-20* |
|
Equity Group ** |
Banque Commerciale Du Congo |
8.9 |
66.5% |
10.3 |
1.2x |
Nov-19* |
|
KCB Group |
National Bank of Kenya |
7 |
100.0% |
6.6 |
0.9x |
Sep-19 |
|
CBA Group |
NIC Group |
33.5 |
53%:47% |
23 |
0.7x |
Sep-19 |
|
Oiko Credit |
Credit Bank |
3 |
22.8% |
1 |
1.5x |
Aug-19 |
|
CBA Group** |
Jamii Bora Bank |
3.4 |
100.0% |
1.4 |
0.4x |
Jan-19 |
|
AfricInvest Azure |
Prime Bank |
21.2 |
24.2% |
5.1 |
1.0x |
Jan-18 |
|
KCB Group |
Imperial Bank |
Unknown |
Undisclosed |
Undisclosed |
N/A |
Dec-18 |
|
SBM Bank Kenya |
Chase Bank Ltd |
Unknown |
75.0% |
Undisclosed |
N/A |
Aug-18 |
|
DTBK |
Habib Bank Kenya |
2.4 |
100.0% |
1.8 |
0.8x |
Mar-17 |
|
SBM Holdings |
Fidelity Commercial Bank |
1.8 |
100.0% |
2.8 |
1.6x |
Nov-16 |
|
M Bank |
Oriental Commercial Bank |
1.8 |
51.0% |
1.3 |
1.4x |
Jun-16 |
|
I&M Group |
Giro Commercial Bank |
3 |
100.0% |
5 |
1.7x |
Jun-16 |
|
Mwalimu SACCO |
Equatorial Commercial Bank |
1.2 |
75.0% |
2.6 |
2.3x |
Mar-15 |
|
Centum |
K-Rep Bank |
2.1 |
66.0% |
2.5 |
1.8x |
Jul-14 |
|
GT Bank |
Fina Bank Group |
3.9 |
70.0% |
8.6 |
3.2x |
Nov-13 |
|
Average |
|
|
76.7% |
|
1.3x |
|
|
* Announcement Date ** Deals that were dropped |
||||||
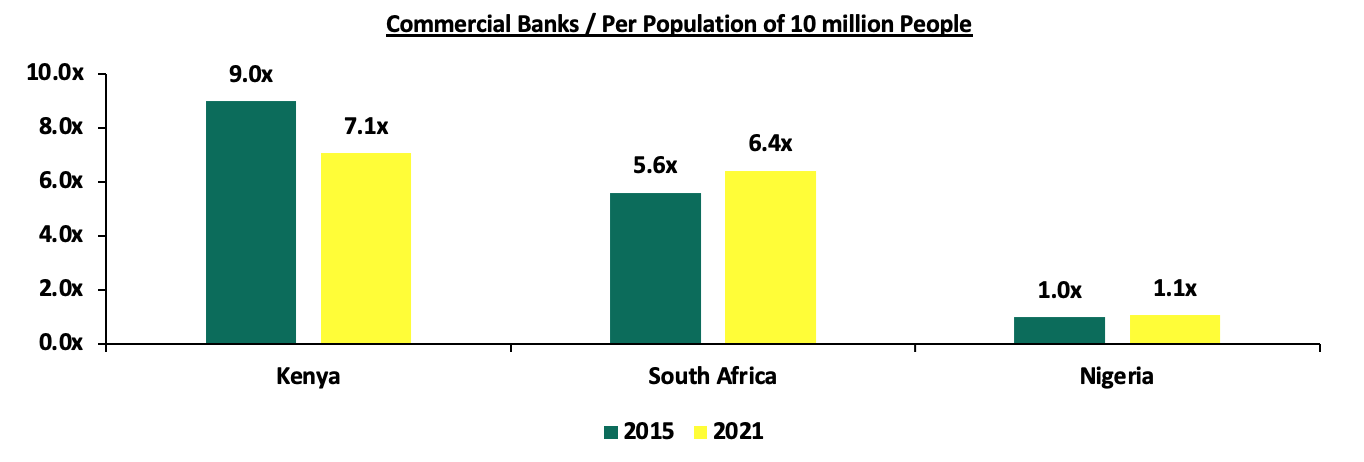
The number of commercial banks in Kenya currently stands at 38, compared to 43 banks 6-years ago. The ratio of the number of banks per 10 million population in Kenya now stands at 7.1x, which is a reduction from 9.0x 6-years ago, demonstrating continued consolidation of the banking sector. However, despite the ratio improving, Kenya still remains overbanked as the number of banks remains relatively high compared to the population. For more on this see our topical.
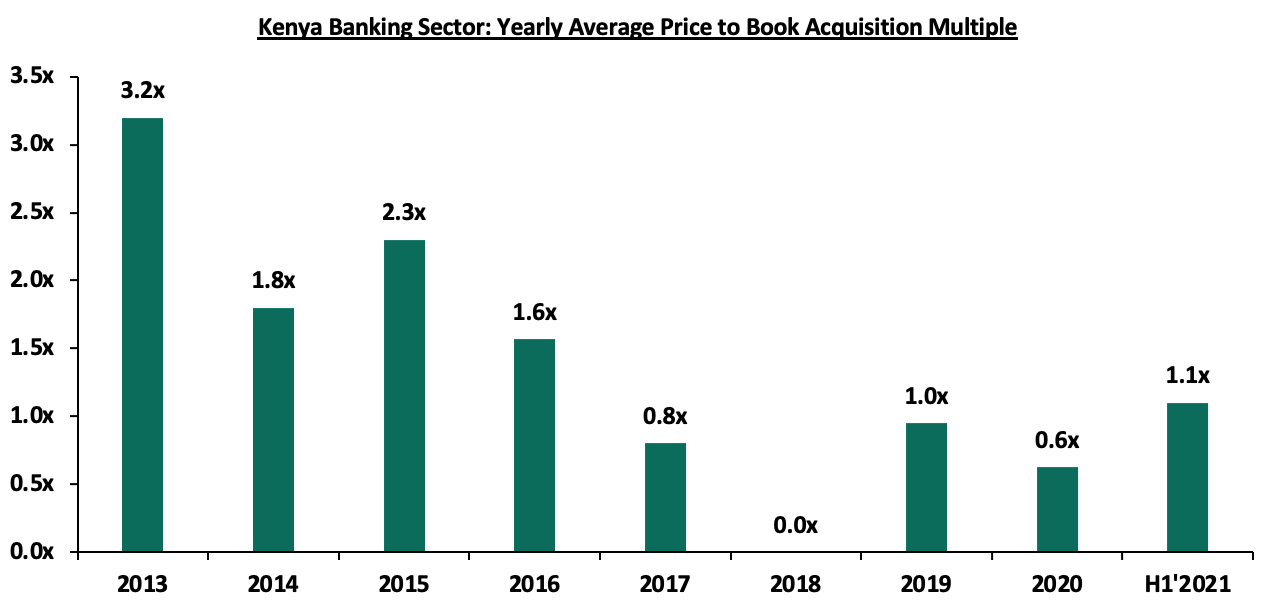
After a consistent decline in the acquisition valuation for banks, we saw an increase in the valuations from the average of 0.6x in 2020 to 1.1x so far in 2021. This however still remains low compared to historical prices paid as highlighted in the chart below;
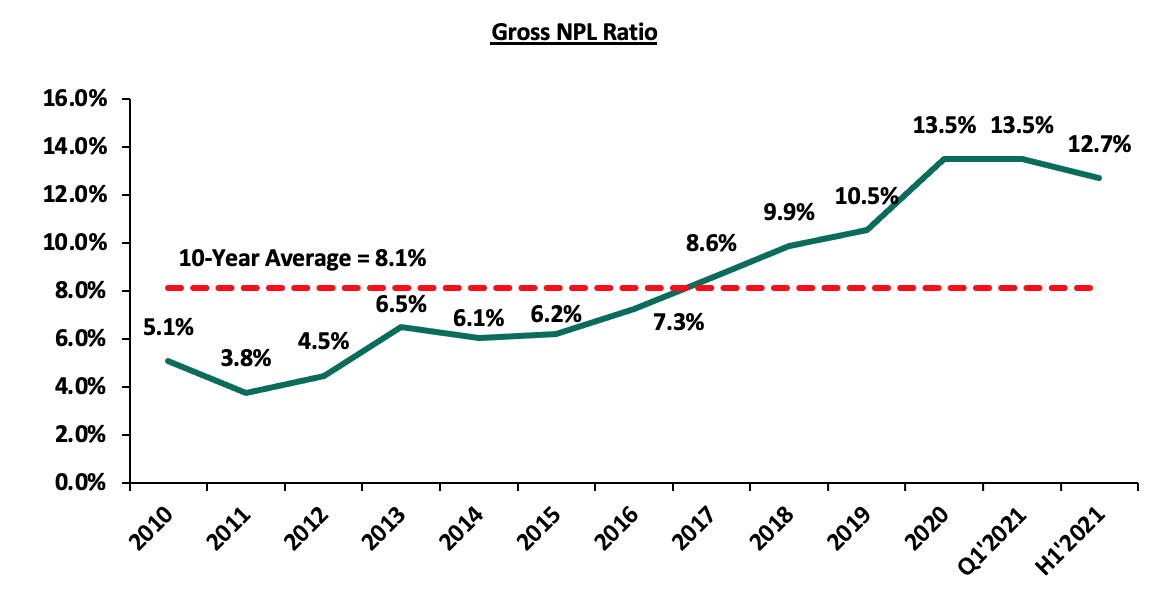
- Asset Quality Deterioration: Asset quality for listed banks deteriorated in H1’2021, with the Gross NPL ratio rising by 1.1% points to 12.7% from 11.6% in H1’2020. The deterioration in asset quality was due to the coronavirus-induced downturn in the economy, which led to an uptick in the non-performing loans. The NPL coverage rose to 64.0% in H1’2021, from 57.8% recorded in H1’2020, in accordance with IFRS 9, where banks are expected to provide both for the incurred and expected credit losses. The significantly higher provisional requirement levels coupled with the increased credit risk led to slower loan growth in H1’2021, which came in at 11.7% compared to a growth of 14.5% in H1’2020. According to the July 2021 MPC Press Release, the NPL ratio for the entire banking sector stood at 14.0% as at June 2021, an improvement from 14.2% in April 2021, signifying an improvement in asset quality for the sector in Q2’2021.
The chart below highlights the asset quality trend:
The table below highlights the asset quality for the listed banking sector:
|
|
H1'2020 NPL Ratio** |
H1'2021 NPL Ratio* |
H1'2020 NPL Coverage** |
H1'2021 NPL Coverage* |
% point change in NPL Ratio |
% point change in NPL Coverage |
|
ABSA Bank Kenya |
8.0% |
7.9% |
63.6% |
70.9% |
(0.1%) |
7.3% |
|
Stanbic Bank |
12.1% |
9.5% |
59.3% |
51.0% |
(2.6%) |
(8.3%) |
|
Diamond Trust Bank |
8.3% |
10.4% |
51.2% |
41.8% |
2.1% |
(9.4%) |
|
I&M Group |
11.1% |
10.4% |
63.1% |
67.2% |
(0.7%) |
4.1% |
|
Equity Group |
11.0% |
11.4% |
48.5% |
63.2% |
0.4% |
14.7% |
|
KCB |
13.8% |
14.4% |
56.9% |
61.6% |
0.6% |
4.7% |
|
Standard Chartered Bank Kenya |
13.9% |
15.1% |
78.2% |
80.1% |
1.2% |
1.9% |
|
Co-operative Bank of Kenya |
11.8% |
15.2% |
54.6% |
63.5% |
3.4% |
8.9% |
|
NCBA Group |
14.5% |
16.7% |
53.2% |
68.0% |
2.2% |
14.8% |
|
HF Group |
26.7% |
22.6% |
43.1% |
65.1% |
(4.1%) |
22.0% |
|
Mkt Weighted Average |
11.6% |
12.7% |
57.8% |
64.0% |
1.1% |
6.2% |
|
*Market cap weighted as at 09/09/2021 |
||||||
|
**Market cap weighted as at 28/08/2020 |
||||||
Key take-outs from the table include;
- Asset quality for the listed banks deteriorated during the period, with the weighted average NPL ratio rising by 1.1% points to a market cap weighted average of 12.7%, from an average of 11.6% for the listed banking sector in H1’2020. Key to note, the listed banks’ NPL ratio of 12.7% is a decline from the 13.5% recorded in Q1’2021, signifying improving credit performance in Q2’2021, but still remains higher than the 10-year average of 8.1%. The deterioration in asset quality y/y was as a result of increased non-performing loans due to the increased credit risk as a consequence of the subdued business environment occasioned COVID-19 pandemic. This could mean provisional requirements remain relatively high compared to similar trading periods before COVID-19,
- NPL Coverage for the listed banks increased to a market cap weighted average of 64.0% in H1’2021, from 57.8% recorded in H1’2020, as the banks increased their provisioning levels due to the difficult economic conditions caused by the pandemic. Banks are expected to continue over-provisioning in 2021, albeit at a slower pace than in 2020,
- Housing Finance (HF) Group recorded the highest improvement in its asset quality, with its NPL ratio declining by 4.1% points to 22.6%, from 26.7% in H1’2020. On the other hand, Co-operative Bank of Kenya recorded the highest increase in its NPL ratio, which increased by 3.4% points to 15.2% from 11.8% recorded in H1’2020, and,
- Notably, Diamond Trust Bank Kenya (DTB-K) reduced their NPL coverage to 41.8% from 51.2% despite the NPL ratio rising to 10.4% from 8.3% in H1’2020. Had DTB-K maintained their NPL coverage at the 51.2% recorded in H1’2020, the bank would have had an additional provisioning of Kshs 2.1 bn, which would have reduced the earnings per share from the reported Kshs 11.3 to Kshs 3.8.
- Capital Raising: In H1’2021, listed banks’ turned to borrowing from international institutions to not only strengthen their capital position but also boost their ability to lend to the perceived riskier Micro Small and Medium Sized Enterprises (MSMEs) segment in order to support the small businesses in the tough operating environment occasioned by the COVID-19 pandemic. The capital raising however slowed down in Q2’2021 after significant activity in Q1’2021. The table below highlights the disclosed loan facilities that banks have secured for capital injection and lending to the MSMEs in H1’2021:
|
Bank |
Amount Borrowed For Onward Lending (Kshs bn) |
Purpose |
|
Equity Bank |
62.9* |
MSME lending |
|
KCB Bank |
16.4 |
MSME lending |
|
Cooperative Bank |
11.0 |
MSME lending and Tier II Capital** |
|
I&M Bank |
5.4 |
MSME lending and Tier II Capital** |
|
Total |
95.7 |
|
|
*Includes a Kshs 2.6 bn grant offered by European Investment Bank (EIB) **Tier II Capital refers to a bank’s supplementary capital which includes senior debt (debt that a company must repay first before going out of business) with a tenure of not less than five years |
||
Section II: Summary of the Performance of the Listed Banking Sector in H1’2021:
The table below highlights the performance of the banking sector, showing the performance using several metrics, and the key take-outs of the performance;
|
Bank |
Core EPS Growth |
Interest Income Growth |
Interest Expense Growth |
Net Interest Income Growth |
Net Interest Margin |
Non-Funded Income Growth |
NFI to Total Operating Income |
Growth in Total Fees & Commissions |
Deposit Growth |
Growth in Government Securities |
Loan to Deposit Ratio |
Loan Growth |
Return on Average Equity |
|
ABSA |
846.0% |
(0.8%) |
(20.4%) |
6.1% |
7.0% |
6.1% |
32.8% |
10.7% |
6.1% |
(9.4%) |
82.9% |
8.4% |
19.3% |
|
KCB |
101.9% |
13.9% |
3.8% |
17.2% |
8.7% |
5.9% |
28.9% |
(2.2%) |
3.7% |
2.2% |
77.2% |
8.4% |
19.2% |
|
Equity |
97.7% |
30.3% |
42.0% |
26.5% |
7.6% |
44.2% |
40.0% |
42.5% |
50.7% |
11.8% |
61.6% |
28.9% |
21.4% |
|
NCBA |
76.9% |
8.7% |
(4.4%) |
19.7% |
0.4% |
6.2% |
44.4% |
(1.0%) |
12.0% |
12.90% |
54.8% |
(3.5%) |
9.1% |
|
SCBK |
37.5% |
(7.5%) |
(24.5%) |
(3.0%) |
6.4% |
13.5% |
35.4% |
19.8% |
8.5% |
(3.2%) |
46.80% |
(3.0%) |
13.70% |
|
Stanbic |
37.2% |
2.1% |
(9.9%) |
9.5% |
4.4% |
10.5% |
44.3% |
3.0% |
(9.4%) |
(2.7%) |
79.9% |
(11.7%) |
11.9% |
|
I&M |
32.2% |
11.6% |
(6.9%) |
28.1% |
5.7% |
(6.4%) |
30.5% |
(6.4%) |
9.6% |
43.30% |
73.9% |
10.8% |
14.5% |
|
DTBK |
20.1% |
5.7% |
5.7% |
5.7% |
5.2% |
5.5% |
25.3% |
(0.9%) |
11.9% |
19.7% |
65.1% |
1.4% |
6.4% |
|
Co-op |
2.3% |
19.0% |
20.9% |
18.3% |
8.6% |
24.3% |
35.4% |
17.8% |
6.0% |
48.7% |
73.9% |
10.7% |
12.7% |
|
HF Group |
(17.4%) |
(15.8%) |
(22.3%) |
(6.8%) |
4.2% |
13.8% |
26.1% |
34.6% |
(3.5%) |
1.9% |
93.3% |
7.5% |
(21.2%) |
|
H1'21 Mkt Weighted Average* |
136.0% |
15.0% |
10.8% |
17.6% |
7.4% |
19.2% |
35.6% |
16.6% |
18.4% |
12.4% |
68.8% |
11.7% |
16.9% |
|
H1'20 Mkt Weighted Average** |
(33.6%) |
10.4% |
10.0% |
10.9% |
7.0% |
(1.1%) |
35.2% |
(3.4%) |
18.5% |
25.9% |
71.5% |
14.5% |
15.4% |
|
*Market cap weighted as at 09/09/2021 **Market cap weighted as at 28/08/2020 |
|||||||||||||
Key takeaways from the table above include:
- For the first half of 2021, core Earnings per Share (EPS) recorded a weighted average growth of 136.0%, compared to a weighted average decline of 33.6% in H1’2020 for the listed banking sector. The performance is however largely skewed by the strong performance from ABSA, KCB and Equity Group of 0%, 101.9% and 97.7%, respectively,
- The Banks have recorded a weighted average deposit growth of 18.4%, a decline from the 18.5% recorded in H1’2020,
- Interest expense grew at a faster pace, by 10.8%, compared to the 10.0% growth in H1’2020 while cost of funds declined, coming in at a weighted average of 2.5% in H1’2021, from 2.9% in H1’2020, owing to the faster growth in average interest-bearing liabilities, an indication that the listed banks were able to mobilize cheaper deposits,
- Average loan growth came in at 11.7%, lower than the 14.5% growth recorded in H1’2020. The loan growth was also outpaced by the 12.4% growth in government securities, an indication that the banks’ are still taking a cautious approach when it comes to lending,
- Interest income grew by 15.0%, compared to a growth of 10.4% recorded in H1’2020. Notably, the weighted average Yield on Interest Earning Assets (YIEA) for the listed banks increased to 9.9%, from the 9.7% recorded in H1’2020 for the listed banking sector, an indication of the increased allocation to higher-yielding government securities by the sector during the period. Consequently, the Net Interest Margin (NIM) now stands at 7.4%, a 0.4% points increase from the 7.0% recorded in H1’2020 for the listed banking sector, and,
- Non-Funded Income grew by 19.2%, compared to the 1.1% decline recorded in H1’2020. This can be attributable to the faster growth in the fees and commission which grew by 16.6% compared to a decline of 3.4% in H1’2020, and points to the diversification of income in the banking sector.
Section III: Outlook of the banking sector:
The banking sector recorded a significant recovery in H1’2021, as evidenced by the increase in profitability, with the Core Earnings Per Share (EPS) growing by 136.0%, despite the tough prevailing operating environment occasioned by the COVID-19 pandemic. The increase in EPS is mainly attributable to the 19.2% growth in Non Funded Income (NFI), compared to a decline of 1.1% recorded in H1’2020, attributable to the expiry of the waiver on fees and commissions on loans in March 2021. Net Interest Income also recorded an increase, rising by 17.6% in H1’2021, compared to an increase of 10.9% in H1’2020. Provisioning levels for most listed banks declined during the period and we expect this reduction in provisioning levels to be a recurrent theme in 2021. However, the banking sector’s Loan Loss Provisions are expected to remain higher than the pre-COVID period and historic average and as such, banks will continue to overprovision during the period, albeit lower than in 2020. Following the expiry of the waiver on fees and commissions on loans and the loan restructuring window having closed in March 2021, we expect the banking sector’s performance to improve in the medium to long term. Based on the current operating environment, we believe the future performance of the banking sector will be shaped by the following key factors:
- Growth in Interest income: With interest income growth at 15.0% in H1’2021 outpacing the 10.4% growth recorded in H1’2020, we believe that interest income growth will remain a key industry driver going forward. The disclosure by banks that most customers that had restructured their loans are now servicing them as normal means that banks are now earning interest on loans restructured at the height of the pandemic, which coupled with increased lending is expected to lead to an increase in the overall interest income. Key to note, some banks are still supporting borrowers after the expiry of the loan restructuring window and this could slow down the recovery of interest income in the medium term,
- Revenue Diversification: In H1’2021, Non-Funded Income recorded a 19.2% weighted average growth, a significant turnaround from the 1.1% decline recorded in H1’2020, attributable to the expiry of the waiver on fees and commissions on loans and advances issued by the CBK in March 2020. The banking sector’s Non-Funded Income to Operating Income also improved, coming in at 35.6% in H1’2021, compared to 35.2% in H1’2020. With Non-Funded Income performance improving, there exists an opportunity for the sector to further increase NFI contribution to revenue going forward. The expiry of the waiver on bank charges on 2nd March 2021 is also expected to spur NFI growth in the medium-long term due to the increased adoption of digital channels, which present an avenue for an increase in fees on transactions. According to Central Bank Annual Report 2019/2020, 67.0% of banking transactions were conducted on mobile phones after the onset of the pandemic, compared to 55.0% of transactions before the pandemic. The increase in mobile-banking transactions therefore provides an opportunity for banks to increase their Non-Funded income going forward,
- Provisioning: Loan Loss Provisions recorded a weighted average decline of 24.8% in H1’2021, compared to a growth of 233.2% in FY’2020 and a growth of 5.5% in Q1’2021, signifying an improvement in business conditions and a reduction of credit risk. However, given that the success of COVID-19 inoculations is reliant on donations from foreign countries, we believe that a cautious approach is still required to manage risk in the banking sector,
- Cost Rationalization: Majority of the banks have been riding on the digital revolution wave to improve their operational efficiency and enhance reliability of outside the branch transactions. Increased adoption of alternative channels of transactions such as mobile, internet, and agency banking has led to increased transactions carried out via alternative channels, reducing branch transactions to handling high-value transactions and other services such as advisory. With the COVID-19 pandemic necessitating contactless transactions, banks reduced front-office operations, thereby cutting the number of staff required and by extension, reducing operating expenses and hence, improving operational efficiency. This has led to banks such as KCB, Equity and ABSA recording 98.0%, 96.1% and 87.0%, respectively of their transactions outside the branch as at H1’2021, and,
- Expansion and Further Consolidation: With consolidation remaining a key theme going forward, the current environment could provide opportunities for bigger banks with an adequate capital base to expand and take advantage of the low valuations in the market to further consolidate and buy out smaller banks. Consolidation will be key for most of the smaller banks that are still struggling during the recovery period, and would also benefit larger banks with the opportunity to improve their asset base. We believe that consolidation could also increase post-COVID as tier one banks resume their expansion strategies both locally and regionally as the economy improves.
Section IV: Brief Summary and Ranking of the Listed Banks:
As per our analysis on the banking sector from a franchise value and a future growth opportunity perspective, we carried out a comprehensive ranking of the listed banks. For the franchise value ranking, we included the earnings and growth metrics as well as the operating metrics shown in the table below in order to carry out a comprehensive review of the banks:
|
Bank |
Loan to Deposit Ratio |
Cost to Income (With LLP) |
Return on Average Capital Employed |
Deposits/ Branch |
Gross NPL Ratio |
NPL Coverage |
Tangible Common Ratio |
Non Funded Income/Revenue |
|
Equity Bank |
61.6% |
54.1% |
21.4% |
2.4 |
11.4% |
63.2% |
12.5% |
40.0% |
|
Absa Bank |
82.9% |
55.5% |
19.3% |
3.1 |
7.9% |
70.9% |
13.0% |
32.8% |
|
KCB Group |
77.2% |
57.2% |
19.2% |
2.2 |
14.4% |
61.6% |
14.5% |
28.9% |
|
I&M Group |
73.9% |
56.3% |
14.5% |
3.1 |
10.4% |
67.2% |
15.9% |
30.8% |
|
SCBK |
46.8% |
51.8% |
13.7% |
7.7 |
15.1% |
80.1% |
14.0% |
35.4% |
|
Coop Bank |
73.9% |
64.1% |
12.7% |
2.3 |
15.2% |
63.5% |
15.2% |
35.4% |
|
Stanbic Bank |
79.9% |
48.9% |
11.9% |
10.4 |
9.5% |
51.2% |
13.8% |
44.3% |
|
NCBA Group |
54.8% |
67.7% |
9.1% |
6.2 |
16.7% |
68.0% |
12.7% |
44.4% |
|
DTBK |
65.1% |
62.9% |
6.4% |
2.3 |
10.4% |
41.8% |
15.1% |
25.3% |
|
HF Group |
93.3% |
125.5% |
(21.2%) |
1.7 |
22.63% |
65.1% |
14.5% |
26.1% |
|
Weighted Average H1'2021 |
68.8% |
57.1% |
16.9% |
3.5 |
12.7% |
64.0% |
13.8% |
35.6% |
The overall ranking was based on a weighted average ranking of Franchise value (accounting for 60.0%) and intrinsic value (accounting for 40.0%). The Intrinsic Valuation is computed through a combination of valuation techniques, with a weighting of 40.0% on Discounted Cash-flow Methods, 35.0% on Residual Income and 25.0% on Relative Valuation, while the Franchise ranking is based on banks operating metrics, meant to assess efficiency, asset quality, diversification, and profitability, among other metrics. The overall H1’2021 ranking is as shown in the table below:
|
Bank |
Franchise Value Rank |
Intrinsic Value Rank |
Weighted Rank |
Q1'2021 |
H1'2021 |
|
I&M Group |
2 |
1 |
1.4 |
1 |
1 |
|
ABSA |
1 |
2 |
1.6 |
5 |
2 |
|
KCB Group Plc |
3 |
3 |
3.0 |
2 |
3 |
|
Equity Group Holdings Ltd |
5 |
5 |
5.0 |
3 |
4 |
|
NCBA Group Plc |
8 |
4 |
5.6 |
5 |
5 |
|
SCBK |
6 |
6 |
6.0 |
9 |
6 |
|
Stanbic Bank/Holdings |
4 |
8 |
6.4 |
4 |
7 |
|
Co-operative Bank of Kenya Ltd |
7 |
7 |
7.0 |
8 |
8 |
|
DTBK |
9 |
9 |
9.0 |
7 |
9 |
|
HF Group Plc |
10 |
10 |
10.0 |
10 |
10 |
Major Changes from the Q1’2020 Ranking are:
- ABSA Bank recorded an improvement in the overall ranking, coming in at position 2 from position 5 in Q1’2021 attributable to the bank ‘s Gross NPL ratio of 7.9%, which was the lowest among the listed banks, leading to an increase in the bank’s franchise value score, coupled with an improvement in the bank’s Cost to Income ratio, which recorded a 5.8% points decline to 55.5% from 61.3% recorded in Q1’2021,
- Standard Chartered Bank’s rank improved to position 6 from position 9 in Q1’2021, attributable to a 0.2% decline in its Cost to Income ratio, which contributed to an increase in the bank’s franchise value score, coupled with the bank’s NPL coverage of 80.1%, which was the highest in the listed banking sector, and,
- Stanbic Bank’s rank declined to Position 7 from Position 4 in Q1’2021, attributable to a 1.7% points reduction in the bank’s Net Interest Margin to 4.4% from 6.1% in Q1’2021, coupled with a 12.7% points decline in the bank’s NPL coverage to 51.2%, from 63.9% in Q1’2020.
For more information, see our Cytonn H1’2021 Listed Banking Sector Review
Disclaimer: The views expressed in this publication are those of the writers where particulars are not warranted. This publication, which is in compliance with Section 2 of the Capital Markets Authority Act Cap 485A, is meant for general information only and is not a warranty, representation, advice or solicitation of any nature. Readers are advised in all circumstances to seek the advice of a registered investment advisor.

- Talk to us
- Kenya
- P.O Box 20695 - 00200, Nairobi, Kenya
- Cell +254709101200
- Tel +254709101200
- WhatsApp +254741676635
- United States
- +254709101200
- DOWNLOAD OUR APP
-


- Kenya
- 8th Floor, Pinetree Plaza, Kaburu Drive, Ngong Road, Nairobi, Kenya
- USA
- Suite 1150, 1775 Eye Street NW, USA, Washington DC 20006, USA
- Investments
- High Yield
- Private Equity
- Real Estate
- Real Estate
- RiverRun Estates
- Cytonn Towers
- The Ridge
- Taraji Heights
- The Alma