Real Estate Investment Trusts (REITs) Progress in Kenya & Cytonn Weekly #50/2022
By Cytonn Research, Dec 18, 2022
Executive Summary
Fixed Income
During the week, T-bills were oversubscribed, with the overall subscription rate coming in at to 121.8%, up from the 97.1% recorded the previous week, partly attributable to the eased liquidity in the money market with the average interbank rate declining to 5.1% from 5.2% recorded the previous week. Investor’s preference for the shorter 91-day paper persisted as they sought to avoid duration risk, with the paper receiving bids worth Kshs 19.5 bn against the offered Kshs 4.0 bn, translating to a subscription rate of 487.7%, up from 416.3% recorded the previous week. The subscription rates for the 364-day and the 182-day papers also increased to 29.9% and 67.2% from 21.5% and 44.9% recorded the previous week, respectively. The yields on the government papers were on an upward trajectory, with the yields on the 364-day, 182-day and 91-day papers increasing by 5.4 bps, 2.5 bps and 2.9 bps to 10.3%, 9.8% and 9.4%, respectively. The Government rejected expensive bids, accepting a total of Kshs 17.4 bn worth of bids out of the Kshs 29.2 bn worth of bids received, translating to an acceptance rate of 59.6%;
In the Primary Bond Market, the government is seeking to raise an additional Kshs 20.0 bn for funding infrastructure projects in the FY’2022/2023 by offering a tap sale of the recent December Switch bond, IFB1/2022/6. The tap sale closes on 22nd December 2022, or upon attainment of the Kshs 20.0 bn quantum. The coupon rate and accepted average yield of the bond is 13.2%. Additionally, the government reopened two bonds, namely; FXD1/2020/5 and FXD1/2022/15, with effective tenors of 2.4 years and 14.3 years respectively, in a bid to raise Kshs 50.0 bn for budgetary support. The period of sale for the two bonds runs from 14th December 2022 to 10th January 2023. Our recommended bidding range is 12.4%-12.8% and 13.9%-14.3% for FXD1/2020/5 and FXD1/2022/15, respectively, according to what bonds of similar tenors are trading;
Also during the week, the Energy and Petroleum Regulatory Authority (EPRA) released their monthly statement on the maximum retail fuel prices in Kenya effective 15th December 2022 to 14th January 2023. Notably, fuel prices remained unchanged at Kshs 177.3, Kshs 162.0 and Kshs 145.9 per litres of Super Petrol, Diesel and Kerosene, respectively. Also, Fitch Ratings, a global credit rating agency, downgraded Kenya’s Long-Term Foreign-Currency Issuer Default Rating (IDR) to ‘B’ from ‘B+’. However, the agency assigned a stable outlook, from the negative outlook assigned in March 2022. Notably, this confirms the S&P ratings in August 2022 which assigned Kenya’s sovereign credit ratings at ‘B’ as both Long and Short term foreign and local currency debt issue with a stable outlook;
Additionally, the National Treasury gazetted the revenue and net expenditures for the fifth month of FY’2022/2023, ending 30th November 2022;
Equities
During the week, the equities market was on an upward trajectory, with NASI, NSE 20 and NSE 25 gaining by 1.6%, 0.4% and 1.2%, respectively, taking YTD performance to losses of 23.1%, 13.7% and 16.8% for NASI, NSE 20 and NSE 25, respectively. The equities market performance was mainly driven by gains recorded by large cap stocks such as BAT, NCBA Group, Safaricom and ABSA Bank of 4.5%, 2.8%, 2.7% and 1.3%, respectively. The gains were however weighed down by losses recorded by large cap stocks such as Standard Chartered Bank Kenya and Bamburi of 4.8% and 1.0%, respectively;
Additionally during the week, KCB Group announced that it had completed acquisition of the 85.0% stake in Trust Merchant Bank (TMB), after receiving all the regulatory approvals;
Real Estate
During the week, property developer Erdemann Limited, in conjunction with the County Government of Machakos, broke ground for the construction of the fifth phase of Great Wall Gardens project located in Mavoko municipality. In the Real Estate Investment Trusts (REITs) segment, Fahari I-REIT closed the week trading at an average price of Kshs 6.1 per share on the Nairobi Securities Exchange, an 8.4% decline from Kshs 6.6 per share recorded the previous week. On the Unquoted Securities Platform, Acorn D-REIT and I-REIT traded at Kshs 23.8 and Kshs 20.9 per unit, respectively, as at 2nd December 2022, a 19.2% and 4.4% gain for the D-REIT and I-REIT, respectively, from the Kshs 20.0 inception price;
Focus of the Week
Real Estate developments are capital intensive and as such require massive and diverse sources of funding. Unfortunately for Kenya, there has been overreliance on conventional sources of funding and the high cost of financing has proven to be a challenge towards further advancement of the Real Estate sector. This week, we cover one the ways to diversify sources of Real Estate funding, which is Real Estate Investment Trusts (REITs), which are essentially regulated collective investment vehicles that allow investors to contribute money as consideration for the acquisition of rights or interests in a trust that is divided into units with the intention of earning profits or income from Real Estate as beneficiaries of the trust. Due to their exclusivity and an alternative source of funding, they could offer a means to complement the delivery of various projects such as the affordable housing initiative that continues to gain traction in the country. In this regard, we will look at the progress of REITs in Kenya;
Investment Updates:
- Weekly Rates:
- Cytonn Money Market Fund closed the week at a yield of 10.72%. To invest, dial *809# or download the Cytonn App from Google Playstore here or from the Appstore here;
- Cytonn High Yield Fund closed the week at a yield of 13.84% p.a. To invest, email us at sales@cytonn.com and to withdraw the interest, dial *809# or download the Cytonn App from Google Playstore here or from the Appstore here;
- During the week, Cytonn Investments CEO Edwin H. Dande appeared on Spice FM, discussing access to finance in Kenya and the role of Capital Markets in the same. Watch the conversation here;
- We continue to offer Wealth Management Training every Wednesday, from 9:00 am to 11:00 am, through our Cytonn Foundation. The training aims to grow financial literacy among the general public. To register for any of our Wealth Management Trainings, click here;
- If interested in our Private Wealth Management Training for your employees or investment group, please get in touch with us through wmt@cytonn.com;
- Any CHYS and CPN investors still looking to convert are welcome to consider one of the five projects currently available for assignment, click here for the latest term sheet;
- Cytonn Insurance Agency acts as an intermediary for those looking to secure their assets and loved ones’ future through insurance namely; Motor, Medical, Life, Property, WIBA, Credit and Fire and Burglary insurance covers. For assistance, get in touch with us through insuranceagency@cytonn.com;
- Cytonnaire Savings and Credit Co-operative Society Limited (SACCO) provides a savings and investments avenue to help you in your financial planning journey. To enjoy competitive investment returns, kindly get in touch with us through clientservices@cytonn.com;
Real Estate Updates:
- For an exclusive tour of Cytonn’s real estate developments, visit: Sharp Investor's Tour, and for more information, email us at sales@cytonn.com;
- Phase 3 of The Alma is now ready for occupation and the show house is open daily. To rent please email properties@cytonn.com;
- We have 8 investment-ready projects, offering attractive development and buyer targeted returns; See further details here: Summary of Investment-ready Projects;
- For Third Party Real Estate Consultancy Services, email us at rdo@cytonn.com;
- For recent news about the group, see our news section here;
Hospitality Updates:
- We currently have promotions for Staycations. Visit cysuites.com/offers for details or email us at sales@cysuites.com;
Money Markets, T-Bills Primary Auction:
During the week, T-bills were oversubscribed, with the overall subscription rate coming in at to 121.8%, up from the 97.1% recorded the previous week, partly attributable to the eased liquidity in the money market with the average interbank rate declining to 5.1% from 5.2% recorded the previous week. Investor’s preference for the shorter 91-day paper persisted as they sought to avoid duration risk, with the paper receiving bids worth Kshs 19.5 bn against the offered Kshs 4.0 bn, translating to a subscription rate of 487.7%, up from 416.3% recorded the previous week. The subscription rates for the 364-day and the 182-day papers also increased to 29.9% and 67.2% from 21.5% and 44.9% recorded the previous week, respectively. The yields on the government papers were on an upward trajectory, with the yields on the 364-day, 182-day and 91-day papers increasing by 5.4 bps, 2.5 bps and 2.9 bps to 10.3%, 9.8% and 9.4%, respectively. The Government rejected expensive bids, accepting a total of Kshs 17.4 bn worth of bids out of the Kshs 29.2 bn worth of bids received, translating to an acceptance rate of 59.6%. Key to note, for the 91-day paper, the government only accepted Kshs 7.7 bn worth of bids out of the Kshs 19.5 bn worth of bids received, which translated to a 39.5% acceptance rate.
In the Primary Bond Market, the government is seeking to raise an additional Kshs 20.0 bn for funding infrastructure projects in the FY’2022/2023 by offering a tap sale of the recent December Switch bond, IFB1/2022/6. The tap sale period ends on 22nd December 2022, or upon attainment of the Kshs 20.0 bn quantum. The coupon rate and weighted average accepted yield of the bond is 13.2%. Although the initial switch bond received an undersubscription of 60.3%, we anticipate an oversubscription, given the tax free nature of the bond, and that, it will now allow investors who weren’t eligible in the initial switch bond. Additionally, the government re-opened two bonds, namely; FXD1/2020/05 and FXD1/2022/15, with effective tenors to maturity of 2.4 years and 14.3 years respectively, in a bid to raise Kshs 50.0 bn for budgetary support. The coupon rates for the bonds are 11.7% and 13.9% for FXD1/2020/5 and FXD1/2022/15, respectively. However, we expect the bonds to be undersubscribed, with FXD1/2020/5 receiving a higher subscription as investors avoid duration risk. The bonds are currently trading in the secondary market at yields of 12.3% and 13.9% for FXD1/2020/5 and FXD1/2022/15, respectively. As such, the recommended bidding range for the two bonds is 12.4%-12.8% for FXD1/2020/5 and 13.9%-14.3% for FXD1/2022/15. The period of the sale for the bonds runs from 14th December 2022 to 10th January 2023.
The increased activity in the primary bond market points towards the government’s high appetite for domestic borrowing driven by the challenging environment to obtain external borrowing, in order to finance the Kshs 862.5 bn fiscal deficit for the FY’2022/2023.
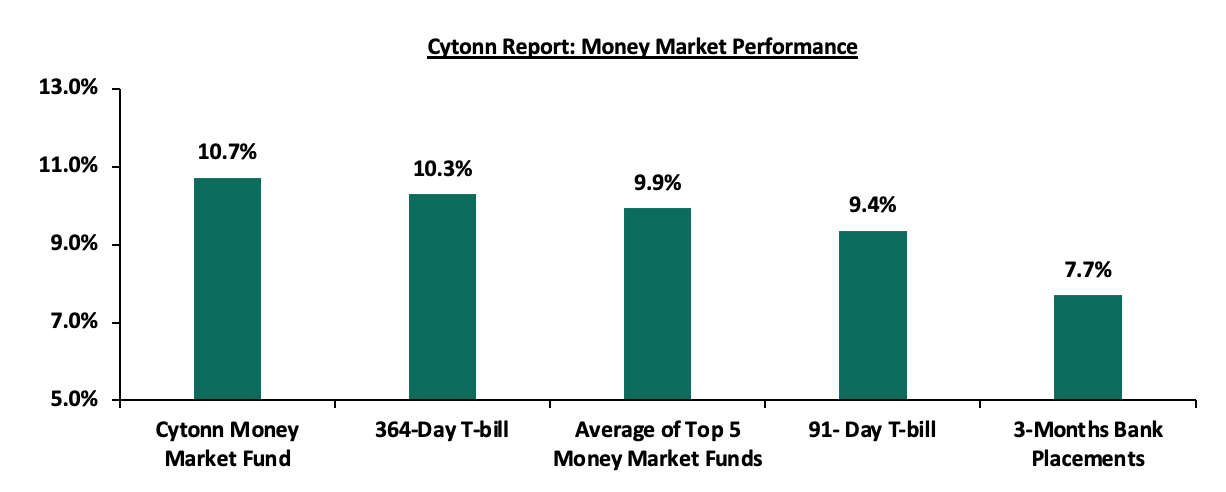
In the money markets, 3-month bank placements ended the week at 7.7% (based on what we have been offered by various banks), while the yield on the 364-day T-bill and 91-day T-bill increased by 5.4 bps and 2.9 bps to 10.3% and 9.4%, respectively. The average yield of the Top 5 Money Market Funds and Cytonn Money Market Fund remained relatively unchanged at 9.9% and 10.7%, respectively.
The table below shows the Money Market Fund Yields for Kenyan Fund Managers as published on 16th December 2022:
|
Cytonn Report: Money Market Fund Yield for Fund Managers as published on 16th December 2022 |
||
|
Rank |
Fund Manager |
Effective Annual Rate |
|
1 |
Cytonn Money Market Fund |
10.7% |
|
2 |
Zimele Money Market Fund |
9.9% |
|
3 |
GenCap Hela Imara Money Market Fund |
9.7% |
|
4 |
Madison Money Market Fund |
9.7% |
|
5 |
NCBA Money Market Fund |
9.7% |
|
6 |
Apollo Money Market Fund |
9.5% |
|
7 |
Sanlam Money Market Fund |
9.5% |
|
8 |
Nabo Africa Money Market Fund |
9.4% |
|
9 |
Dry Associates Money Market Fund |
9.3% |
|
10 |
Old Mutual Money Market Fund |
9.2% |
|
11 |
Co-op Money Market Fund |
9.2% |
|
12 |
CIC Money Market Fund |
9.1% |
|
13 |
British-American Money Market Fund |
9.0% |
|
14 |
ICEA Lion Money Market Fund |
8.6% |
|
15 |
AA Kenya Shillings Fund |
8.6% |
|
16 |
Orient Kasha Money Market Fund |
8.6% |
|
17 |
Absa Shilling Money Market Fund |
7.8% |
|
18 |
Equity Money Market Fund |
5.4% |
Source: Business Daily
Liquidity:
During the week, liquidity in the money markets eased, with the average interbank rate declining to 5.1% from 5.2% recorded the previous week, partly attributable to government payments that offset tax remittances. The average interbank volumes traded increased by 72.9% to Kshs 31.1 bn from Kshs 18.0 bn recorded the previous week.
Kenya Eurobonds:
During the week, the yields on Eurobonds recorded mixed performance with the yield on the 10-year Eurobond issued in 2014 recording the largest increase having gained by 0.3% points to 12.6% from 12.3%, recorded the previous week, partly attributable to increased market sentiments with the paper’s maturity coming up in 2024. The table below shows the summary of the performance of the Kenyan Eurobonds as of 15th December 2022;
|
Cytonn Report: Kenya Eurobonds Performance |
||||||
|
|
2014 |
2018 |
2019 |
2021 |
||
|
Date |
10-year issue |
10-year issue |
30-year issue |
7-year issue |
12-year issue |
12-year issue |
|
3-Jan-22 |
4.4% |
8.1% |
8.1% |
5.6% |
6.7% |
6.6% |
|
30-Nov-22 |
12.0% |
10.1% |
10.8% |
10.7% |
10.4% |
9.6% |
|
08-Dec-22 |
12.3% |
9.9% |
10.6% |
10.3% |
10.2% |
9.4% |
|
09-Dec-22 |
12.3% |
9.9% |
10.6% |
10.2% |
10.2% |
9.4% |
|
12-Dec-22 |
12.4% |
9.9% |
10.6% |
10.2% |
10.2% |
9.4% |
|
13-Dec-22 |
12.2% |
9.8% |
10.5% |
10.1% |
10.2% |
9.3% |
|
14-Dec-22 |
11.8% |
9.7% |
10.5% |
10.1% |
10.1% |
9.2% |
|
15-Dec-22 |
12.6% |
9.9% |
10.6% |
10.4% |
10.3% |
9.4% |
|
Weekly Change |
0.3% |
- |
- |
0.1% |
0.1% |
- |
|
MTD Change |
0.6% |
(0.1%) |
(0.2%) |
(0.3%) |
(0.1%) |
(0.1%) |
|
YTD Change |
8.2% |
1.8% |
2.5% |
4.8% |
3.6% |
2.8% |
Source: Central Bank of Kenya (CBK)
Kenya Shilling:
During the week, the Kenyan shilling depreciated by 0.2% against the US dollar to close the week at Kshs 123.0, from Kshs 122.8 recorded the previous week, partly attributable to increased dollar demand from importers, especially oil and energy sectors against a slower supply of hard currency. On a year to date basis, the shilling has depreciated by 8.7% against the dollar, higher than the 3.6% depreciation recorded in 2021. We expect the shilling to remain under pressure in 2022 as a result of:
- High global crude oil prices on the back of persistent supply chain bottlenecks coupled with high demand,
- An ever-present current account deficit estimated at 5.5% of GDP in the 12 months to October 2022, same as what was recorded in a similar period in 2021,
- The need for Government debt servicing which continues to put pressure on forex reserves given that 69.7% of Kenya’s External debt was US Dollar denominated as of September 2022, and,
- A continued hike in the USA Fed interest rates in 2022 to a range of 4.25%-4.50% in December 2022 has strengthened the dollar against other currencies following capital outflows from other global emerging markets.
The shilling is however expected to be supported by:
- Improved diaspora remittances standing at a cumulative USD 4.0 bn as of November 2022, representing a 9.7% y/y increase from USD 3.7 bn recorded over the same period in 2021, and,
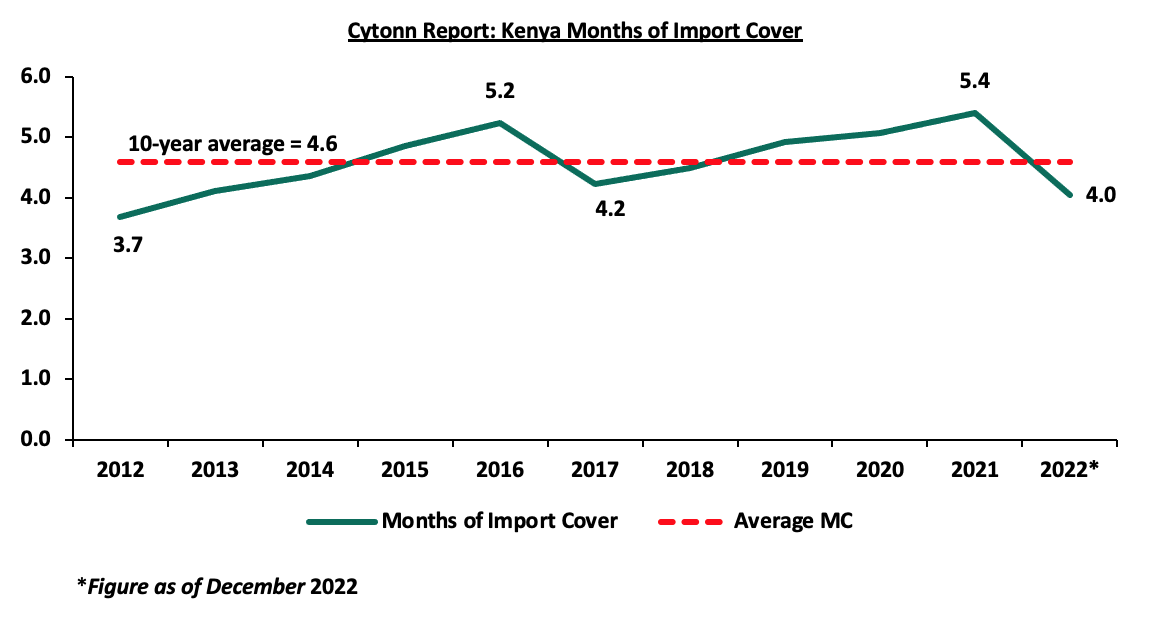
- Sufficient Forex reserves currently at USD 7.1 bn (equivalent to 4.0 months of import cover), which is at par with the statutory requirement of maintaining at least 4.0-months of import cover. However, it’s important to note that Forex reserves have dropped by 19.3% YTD from USD 8.8 bn. The chart below summarizes the evolution of Kenya months of import cover over the last 10 years;
Weekly Highlights:
- Fuel Prices
During the week, the Energy and Petroleum Regulatory Authority (EPRA) released their monthly statement on the maximum retail fuel prices in Kenya effective 15th December 2022 to 14th January 2023. Notably, fuel prices remained unchanged at Kshs 177.3, Kshs 162.0 and Kshs 145.9 per litres of Super Petrol, Diesel and Kerosene, respectively. The performance was attributable to:
- The cross subsidization of the price of Diesel with that of Super Petrol and maintaining of Kshs 25.1 subsidy per litre of Kerosene under the Petroleum Development Levy, and,
- The 5.7% decrease in the Free On Board (FOB) price in Murban crude oil to USD 92.5 per barrel in November 2022 from USD 98.1 recorded in October 2022.
The performance was despite:
- The increase in the average landed costs of Super Petrol, Diesel and Kerosene by 2.7%, 6.6% and 6.0% to USD 704.2 per cubic metre, USD 920.4 per cubic metre and USD 851.3 per cubic metre in November 2022 from USD 686.1 per cubic metre, USD 863.8 per cubic metre and USD 803.1 per cubic metre in October 2022, respectively, and,
- The continued depreciation of the Kenyan Shilling, having declined by 0.1% to Kshs 124.2 in November 2022 from Kshs 124.1 in October 2022.
Despite the elevated fuel prices in Kenya, global fuel prices have declined by 50.1% to USD 78.4 per barrel as at 14th December 2022 from the peak of USD 117.7 per barrel recorded in the beginning of June 2022, as countries take measures to insulate themselves from the price shocks caused by the Russian Invasion in Ukraine. Over the same period, from June 2022 to date, the fuel prices in Kenya have increased by 11.4%, 15.7% and 14.1% to Kshs 177.3, Kshs 162.0 and Kshs 145.9 in December 2022 from Kshs 159.1, Kshs 140.0 and Kshs 127.9 in June 2022 per litres of Super Petrol, Diesel and Kerosene, respectively. The decoupling from global fuel prices is majorly attributable to the partial removal of fuel subsidies under the Petroleum Development Levy program by the current administration in September 2022. On a YTD basis, the current prices represent a 0.7% increase from the USD 77.9 per barrel recorded on 3rd January 2022, pointing towards stabilization of the global fuel prices. On 3rd December 2022, the G7 member countries formally imposed a USD 60.0 price cap per barrel of Russian oil which took effect on 5th December. This is expected to stabilize global energy prices even further and cool down the global inflation which has been partly attributable the elevated fuel prices. Additionally, the decline in the global oil prices is driven by the global drop in demand of fuel due to the fears of global recession, following another USA Fed interest rate hike in December and the new COVID-19 lock downs in China. Notably, Kenyans have continued to be cushioned against the increase in the average landed costs of fuel due to the continued subsidies, as the Government partially removed the fuel subsidies in September 2022. However, we have maintained that the subsidy program is unsustainable since it is a burden to the country’s expenditure. As such, we expect the new administration to completely do away with the fuel subsidies and adjust the domestic fuel prices to ease the pressure on expenditure consequently reducing the need for excessive borrowing. With fuel being a major contributor to Kenya’s inflation, we also expect the cost of living to remain elevated, and therefore, the business environment is expected to remain subdued emanating from the decline in consumer spending.
- Kenya’s Fitch Ratings
During the week, Fitch Ratings, a global credit rating agency, downgraded Kenya’s Long-Term Foreign-Currency Issuer Default Rating (IDR) to ‘B’ from ‘B+’. However, the agency assigned a stable outlook, from the negative outlook in March 2022. Notably, this confirms the S&P ratings in August 2022 which assigned Kenya’s sovereign credit ratings at ‘B’ as both Long and Short term foreign and local currency debt issue with a stable outlook. According to Fitch Ratings, the downgrade in Kenya’s IDR was attributable to:
- Widened current account deficit and low currency reserves- Kenya’s current account deficit was estimated at 5.5% of GDP in the 12 months to October 2022, same as what was recorded in a similar period in 2021, with Fitch forecasting it to widen to 5.9% of GDP in 2022. Further, Fitch expects it to remain broadly at the same level in 2023 and 2024 leading to a decline the country’s foreign exchange reserves to USD 7.4 bn in the end of 2023, despite IMF and World Bank support. Kenya’s foreign exchange reserves currently stands at USD 7.1 bn which represents a 19.3% YTD decline from USD 8.8 bn recorded in January 2022, representing 4.0 months of import cover, currently at par with the statutory requirements of 4.0 months,
- High debt to revenue ratio- At 385.0% of GDP in FY’2022, Kenya’s debt to revenue ratio remains elevated, well above the current ‘B’ category median of 282.0%. Although Kenya’s debt to GDP ratio marginally declined to 67.4% in 2022 from 67.7% in the 2021, it is forecasted to remain above 60.0% of the GDP in the short term, and to the projected 2024 55.0% of GDP due to the continued fiscal consolidation, it will still remain above the IMF recommended threshold of 50.0% of GDP for developing countries,
- Increased debt servicing costs especially external debt service- Owing to the 29.5% increase in interest payments to revenue in 2023 as projected by Fitch Ratings, coupled with the USD 2.0 bn Eurobond set to mature in June 2024, debt servicing continues to weigh down the country’s revenue collection, and,
- Elevated Inflation- Despite the slight decline in the Kenya’s inflation to 9.6% in November 2022 from 9.5% in October 2022, Fitch noted that, inflation will still remain elevated at an average of 8.3% in 2023 partly due to the current adverse weather conditions which has adversely affected agricultural production and global supply chain constraints affecting fuel prices.
- The Country’s high level of corruption- According to Transparency International, the Kenya’s Corruption Perception Index, an indicator of the relative degree of corruption, came in at 30.0% in 2021, with Kenya ranked 128 out of 180 countries, pointing towards high levels of corruption in the country, that has been hampering economic growth,
- Inequality in the application of the rule of law- With Kenya being ranked 104 out of 139 countries globally by the World Justice Report (WJP) in their WJP Rule of Law Index 2022 Report, Fitch noted that Kenya has uneven application of the rule of law, and,
- Political instability during electioneering periods- Fitch noted that, Kenya, having an ESG Relevance Score (RS) of ‘5’, and a low World Bank Governance Indicators (WBGI) of 31.6% reflects a recent track record of difficult political transitions evidenced by the prolonged electioneering periods.
However, the agency assigned the country a stable outlook due to:
- Gradual fiscal consolidation- This is supported by the continued IMF support of USD 2.3 bn under the Extended Fund Facility (EFF) and the Extended Credit Facility (ECF), and, the strong revenue collection, evidenced by the Kshs 2.0 tn collection in FY’2021/2022 which represented 2.8% outperformance, has helped to narrow the fiscal deficit to 6.2% of GDP in FY’2022/2023 from 8.2% in FY2020/2021. Also, the agency commented the new administration directive to partially remove the subsidy on fuels which has been putting pressure on the country’s expenditure. As such, it projects the fiscal deficit to further decline to 6.1% of GDP, and,
- Economic Growth- Fitch forecasts that Kenya’s growth will remain steady in 2023 and 2024 driven by the post pandemic recovery, with the real GDP growth, however, declining to 5.4% in 2022 from 7.5% in 2021. Also, improving asset quality will support growth through higher private sector credit growth. However, the elevated inflation, the slower global growth and fiscal tightening poses uncertainty in the country’s growth in 2023.
Fitch further warned that Kenya’s future rating is pegged on the widened fiscal deficit due to reduced access to external financing sources, widened current account deficit that would reduce the country’s international reserves and a slower than expected GDP growth rate. Notably, Kenya’s macroeconomic environment continues to remain unfavorable, evidenced by the elevated inflation which came in at 9.5% in November 2022 higher than the CBK target range of 2.5% - 7.5%, hiked interest rates of 8.75% to anchor inflation, high public debt to GDP ratio of 62.0% as of September 2022, continued currency depreciation of 8.7% YTD and the decline in the country’s foreign reserves by 19.3% YTD to USD 7.1 bn from USD 8.8 bn in January 2022. Additionally, the fiscal tightening by the new administration to reduce government expenditure is expected to hamper economic development. As such, Kenya’s future economic outlook will be determined by how faster the global conditions settle and how well the current administration implements their development agenda. However, we expect the continued support from the IMF and the World Bank will boost the country’s reserves and help reduce the perceived risks in the country.
- Revenue and Net Exchequer for FY’2022/2023
The National Treasury gazetted the revenue and net expenditures for the fifth month of FY’2022/2023, ending 30th November 2022. Below is a summary of the performance:
|
Cytonn Report: FY'2022/2023 Budget Outturn - As at 30th November 2022 |
|||||
|
Amounts in Kshs billions unless stated otherwise |
|||||
|
Item |
12-months Original Estimates |
Actual Receipts/Release |
Percentage Achieved |
Prorated |
% achieved of prorated |
|
Opening Balance |
|
0.6 |
|
|
|
|
Tax Revenue |
2,071.9 |
758.6 |
36.6% |
863.3 |
87.9% |
|
Non-Tax Revenue |
69.7 |
30.1 |
43.2% |
29.0 |
103.7% |
|
Total Revenue |
2,141.6 |
789.3 |
36.9% |
892.3 |
88.5% |
|
External Loans & Grants |
349.3 |
116.1 |
33.2% |
145.6 |
79.8% |
|
Domestic Borrowings |
1,040.5 |
218.9 |
21.0% |
433.5 |
50.5% |
|
Other Domestic Financing |
13.2 |
15.3 |
115.8% |
5.5 |
278.0% |
|
Total Financing |
1,403.0 |
350.3 |
25.0% |
584.6 |
59.9% |
|
Recurrent Exchequer issues |
1,178.4 |
436.5 |
37.0% |
491.0 |
88.9% |
|
CFS Exchequer Issues |
1,571.8 |
489.3 |
31.1% |
654.9 |
74.7% |
|
Development Expenditure & Net Lending |
424.4 |
89.5 |
21.1% |
176.8 |
50.6% |
|
County Governments + Contingencies |
370.0 |
122.1 |
33.0% |
154.2 |
79.2% |
|
Total Expenditure |
3,544.6 |
1,137.4 |
32.1% |
1,476.9 |
77.0% |
|
Fiscal Deficit excluding Grants |
1,403.0 |
348.0 |
24.8% |
584.6 |
59.5% |
|
Total Borrowing |
1,389.8 |
335.0 |
24.1% |
579.1 |
57.9% |
The key take-outs from the release include;
- Total revenue collected as at the end of November 2022 amounted to Kshs 789.3 bn, equivalent to 36.9% of the original estimates of Kshs 2,141.6 bn for FY’2022/2023 and is 88.5% of the prorated estimates of Kshs 892.3 bn. We note that the government has not been able to meet its prorated revenue targets five months into the FY’2022/2023 partly attributable to the tough macroeconomic environment in the country as a result of elevated inflationary pressures with November 2022 coming in at 9.5%. Cumulatively, tax revenues amounted to Kshs 758.6 bn, equivalent to 36.6% of the original estimates of Kshs 2,071.9 bn and 87.9% of the prorated estimates of Kshs 863.3 bn,
- Total financing amounted to Kshs 350.3 bn, equivalent to 25.0% of the original estimates of Kshs 1,403.0 bn and is equivalent to 59.9% of the prorated estimates of Kshs 584.6 bn. Additionally, domestic borrowing amounted to Kshs 218.9 bn, equivalent to 21.0% of the original estimates of Kshs 1,040.5 bn and is 50.5% of the prorated estimates of Kshs 433.5 bn,
- The total expenditure amounted to Kshs 1,137.4 bn, equivalent to 32.1% of the original estimates of Kshs 3,544.6 bn, and is 77.0% of the prorated target expenditure estimates of Kshs 1,476.9 bn. Additionally, the net disbursements to recurrent expenditures came in at Kshs 436.5 bn, equivalent to 37.0% of the original estimates of Kshs 1,178.4 bn and 88.9% of the prorated estimates of Kshs 491.0 bn,
- Consolidated Fund Services (CFS) Exchequer issues, in which the Consolidated Fund was established in the Kenya’s constitution into which development partners deposit funds before disbursing to the Exchequer accounts for onward transfer to projects such as servicing of public debt, payment of pensions and gratuities, salaries and allowances and subscription to International Organizations came in at Kshs 489.3 bn, equivalent to 31.1% of the original estimates of Kshs 1,571.8 bn, and are 74.7% of the prorated amount of Kshs 654.9 bn. The cumulative public debt servicing cost amounted to Kshs 449.6 bn which is 32.3% of the original estimates of Kshs 1,393.1 bn, and is 77.5% of the prorated estimates of Kshs 580.5 bn. Additionally, the Kshs 449.6 bn debt servicing cost is equivalent to 57.0% of the actual revenues collected as at the end of November 2022, further emphasizing on how much public debt weighs on the country’s expenditure. Additionally, Recurrent Exchequer issues came in at Kshs 436.5 bn equivalent to 37.0% of the original estimates of Kshs 1,571.8 bn and are 88.9% of the prorated estimates of Kshs 491.0, and,
- Total Borrowings as at the end of November 2022 amounted to Kshs 335.0 bn, equivalent to 24.1% of the original estimates of Kshs 1,389.8 bn for FY’2022/2023 and are 57.9% of the prorated estimates of Kshs 463.3 bn. The cumulative domestic borrowing target of Kshs 1,040.5 bn comprises of adjusted Net domestic borrowings of Kshs 579.1 bn and Internal Debt Redemptions (Roll-overs) of Kshs 461.4 bn.
As expected, the revenue performance for the fifth month of the FY’2022/2023 reflects the economic uncertainties in the country emanating from the elevated inflation and high perceived risk in the country evidenced by downgrading of the country’s Issuer Default Rating (IDR) by Fitch ratings to ‘B’ in December 2022 from ‘B+’ in March 2022. The slow-down in economic environment is expected to persist in the short term as consumers continue to cut on spending. As such, we believe that the performance of revenue collection in the coming months will be largely determined by how soon the country’s business environment stabilizes and how fast the new regime implements its economic growth related initiatives. However, risks lie on the downside given the high global commodity prices coupled with the persistent supply bottlenecks which continue to weigh on the economy.
Rates in the Fixed Income market have remained relatively stable due to the relatively ample liquidity in the money market. The government is 11.8% ahead of its prorated borrowing target of Kshs 268.5 bn having borrowed Kshs 300.1 bn of the Kshs 581.7 bn borrowing target for the FY’2022/2023. We expect sustained gradual economic recovery as evidenced by the revenue collections of Kshs 789.3 bn in the FY’2022/2023 as at the end of November, equivalent to a 36.9% of its target of Kshs 2.1 tn. Despite the performance, we believe that the projected budget deficit of 6.2% is relatively ambitious given the downside risks and deteriorating business environment occasioned by high inflationary pressures. We however expect the support from the IMF and World Bank to ease the need for elevated borrowing and thus help maintain a stable interest rate environment since the government is not desperate for cash. Owing to this, our view is that investors should be biased towards short-term fixed-income securities to reduce duration risk.
Market Performance:
During the week, the equities market was on an upward trajectory, with NASI, NSE 20 and NSE 25 gaining by 1.6%, 0.4% and 1.2%, respectively, taking YTD performance to losses of 23.1%, 13.7% and 16.8% for NASI, NSE 20 and NSE 25, respectively. The equities market performance was mainly driven by gains recorded by large cap stocks such as BAT, NCBA Group, Safaricom and ABSA Bank of 4.5%, 2.8%, 2.7% and 1.3%, respectively. The gains were however weighed down by losses recorded by large cap stocks such as Standard Chartered Bank Kenya and Bamburi of 4.8% and 1.0%, respectively.
During the week, equities turnover declined by 15.2% to USD 7.7 mn from USD 9.1 mn recorded the previous week, taking the YTD turnover to USD 777.8 mn. Additionally, foreign investors remained net sellers, with a net selling position of USD 2.0 mn, from a net selling position of USD 3.5 mn recorded the previous week, taking the YTD net selling position to USD 197.3 mn.
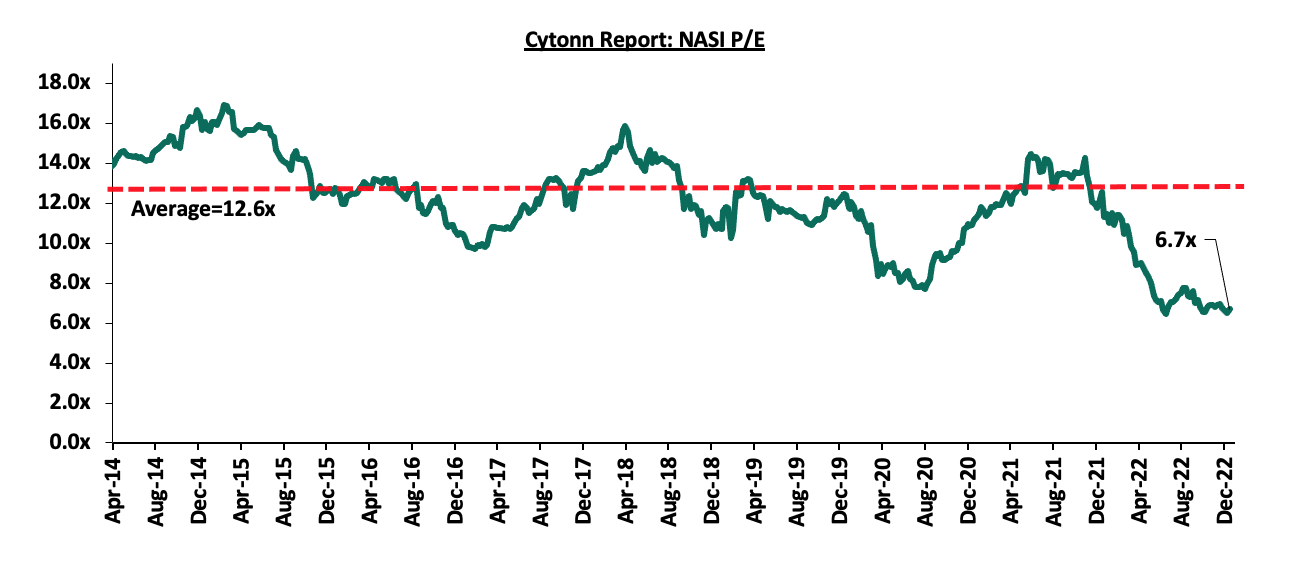
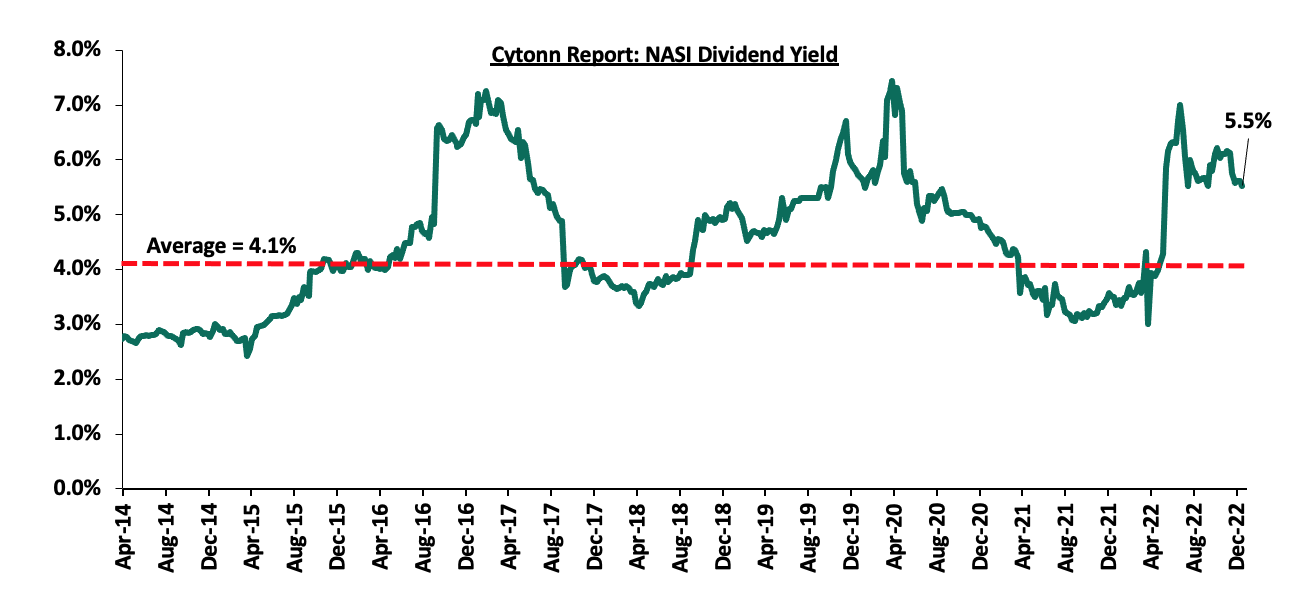
The market is currently trading at a price to earnings ratio (P/E) of 6.7x, 46.9% below the historical average of 12.6x, and a dividend yield of 5.5%, 1.4% points above the historical average of 4.1%. Key to note, NASI’s PEG ratio currently stands at 0.9x, an indication that the market is undervalued relative to its future growth. A PEG ratio greater than 1.0x indicates the market may be overvalued while a PEG ratio less than 1.0x indicates that the market is undervalued. The charts below indicate the historical P/E and dividend yields of the market;
Weekly Highlights:
- KCB Group completes acquisition of Trust Merchant Bank (TMB)
During the week, KCB Group announced that it had completed acquisition of the 85.0% stake in Trust Merchant Bank (TMB), after receiving all the regulatory approvals. This comes after KCB Group entered into a definitive agreement with the shareholders of TMB in August 2022 to acquire 85.0% of the shares in the Democratic Republic of Congo (DRC)- based lender, with an option to acquire the remaining stake after two years. This acquisition makes KCB Group the second Kenyan banking group to enter the DRC banking market after Equity Group Holdings, with KCB Group now having its presence in seven countries. For this acquisition, KCB Group has not disclosed the actual value of the deal but as highlighted in our Cytonn Weekly 31/2022, KCB Group had cited that they would pay a cash consideration based on the net asset value of TMB at completion of the proposed transaction using a Price to Book (P/B) multiple of 1.5x. As such, we estimate that KCB made a payment of around Kshs 15.7 bn at the trading multiple of 1.5x given TMB’s book value of FC 208.4 bn (Kshs 12.4 bn) as of 2020. Notably, the P/B multiple is higher than the 9-year acquisitions average P/B of 1.3x as well as the current average P/B of the listed banking stocks of 0.8x. The acquisition has seen KCB Group take over 109 branches from TMB, taking its total branch network to 607, from the current 498 branches, and take its total assets to more than Kshs 1.5 tn.
TMB’s balance sheet recorded expansion with total assets growing at a 4-year CAGR of 35.7% to Kshs 139.7 bn in 2020, from Kshs 41.2 bn in 2016. However, the Bank’s profitability declined significantly by 92.3% to Kshs 0.1 bn in 2020, from Kshs 1.4 bn in 2019, mainly due to the COVID-19 pandemic and its related impacts on the cost of risk. Consequently, Return on Equity (ROE) and Return on Assets (ROA) declined to 0.9% and 0.1% in 2020, from 13.6% and 1.3% in 2019, respectively. In light of the recent TMB’s performance, we expect this acquisition to provide an opportunity for KCB Group to extend its expertise, experience and prudence in management to help unlock the potential that TMB holds. TMB recorded a cost to income ratio of 76.0% in 2020 and could largely benefit from the larger group’s management quality, with KCB Group’s Cost to income ratio coming in at 53.0% in Q3’2022, a 2.2% improvement from 55.2% in Q3’2021. Additionally, we expect to see growing linkages between customers in the region as well as improved operational efficiencies which will deliver tangible value to shareholders.
The table below shows a summary of TMB’s performance and Key financial ratios;
|
Cytonn Report: Trust Merchant Bank (TMB) Performance and Ratios |
|||||
|
2016 |
2017 |
2018 |
2019 |
2020 |
|
|
Total Assets ( Kshs bn) |
41.2 |
61.1 |
88.1 |
105.2 |
139.7 |
|
Net Profit (Kshs bn) |
0.04 |
0.7 |
1.2 |
1.4 |
0.1 |
|
Cost to Income Ratio |
88.6% |
70.9% |
68.2% |
72.0% |
76.0% |
|
Return on Equity (ROE) |
0.9% |
10.2% |
14.5% |
13.6% |
0.9% |
|
Return on Assets (ROA) |
0.1% |
1.2% |
1.4% |
1.3% |
0.1% |
Source: TMB Bank Financial Report 2020
In our view, we expect the completed acquisition to positively contribute towards the Group’s regional presence and participation and thus provide income diversification from a geographical perspective. Notably, the Group recorded a 20.9% increase in Profit Before Tax (PBT) to Kshs 43.3 bn in Q3’2022, from Kshs 35.8 bn recorded in Q3’2021, with subsidiaries outside KCB Bank Kenya contributing 16.3% to the PBT during the period, up from 15.2% during similar period in 2021. As such, the acquisition presents an opportunity for increased profitability as the Group expects the bank to help drive business growth in the future. Additionally, we expect KCB Group to take advantage of TMB’s insurance subsidiary-Afrissur SA in diversifying its offerings in DRC’s insurance sector with the country having one of the lowest insurance penetration in African at a paltry 1.0%. Further, we expect this to contribute to KCB’s distribution networks and market share as well as accelerate its growth, given the low banking penetration which was estimated to be around 6.0% in 2019 as compared to 29.6% bank account holding in Kenya, in a similar period.
Below is a summary of the deals in the last 9 years that have either happened, been announced or expected to be concluded:
|
Cytonn Report: Banking sector Deals and Acquisitions |
||||||
|
Acquirer |
Bank Acquired |
Book Value at Acquisition (Kshs bn) |
Transaction Stake |
Transaction Value (Kshs bn) |
P/Bv Multiple |
Date |
|
KCB Group PLC |
Trust Merchant Bank (TMB) |
12.4 |
85.0% |
15.7 |
1.5x |
Dec-22 |
|
Equity Group |
Spire Bank |
Unknown |
Undisclosed |
Undisclosed |
N/A |
Sep-22* |
|
Access Bank PLC (Nigeria) |
Sidian Bank |
4.9 |
83.4% |
4.3 |
1.1x |
June-22* |
|
KCB Group |
Banque Populaire du Rwanda |
5.3 |
100.0% |
5.6 |
1.1x |
August-21 |
|
I&M Holdings PLC |
Orient Bank Limited Uganda |
3.3 |
90.0% |
3.6 |
1.1x |
April-21 |
|
KCB Group** |
ABC Tanzania |
Unknown |
100% |
0.8 |
0.4x |
Nov-20* |
|
Co-operative Bank |
Jamii Bora Bank |
3.4 |
90.0% |
1 |
0.3x |
Aug-20 |
|
Commercial International Bank |
Mayfair Bank Limited |
1.0 |
51.0% |
Undisclosed |
N/D |
May-20* |
|
Access Bank PLC (Nigeria) |
Transnational Bank PLC. |
1.9 |
100.0% |
1.4 |
0.7x |
Feb-20* |
|
Equity Group ** |
Banque Commerciale Du Congo |
8.9 |
66.5% |
10.3 |
1.2x |
Nov-19* |
|
KCB Group |
National Bank of Kenya |
7.0 |
100.0% |
6.6 |
0.9x |
Sep-19 |
|
CBA Group |
NIC Group |
33.5 |
53%:47% |
23.0 |
0.7x |
Sep-19 |
|
Oiko Credit |
Credit Bank |
3.0 |
22.8% |
1 |
1.5x |
Aug-19 |
|
CBA Group** |
Jamii Bora Bank |
3.4 |
100.0% |
1.4 |
0.4x |
Jan-19 |
|
AfricInvest Azure |
Prime Bank |
21.2 |
24.2% |
5.1 |
1.0x |
Jan-18 |
|
KCB Group |
Imperial Bank |
Unknown |
Undisclosed |
Undisclosed |
N/A |
Dec-18 |
|
SBM Bank Kenya |
Chase Bank Ltd |
Unknown |
75.0% |
Undisclosed |
N/A |
Aug-18 |
|
DTBK |
Habib Bank Kenya |
2.4 |
100.0% |
1.8 |
0.8x |
Mar-17 |
|
SBM Holdings |
Fidelity Commercial Bank |
1.8 |
100.0% |
2.8 |
1.6x |
Nov-16 |
|
M Bank |
Oriental Commercial Bank |
1.8 |
51.0% |
1.3 |
1.4x |
Jun-16 |
|
I&M Holdings |
Giro Commercial Bank |
3.0 |
100.0% |
5.0 |
1.7x |
Jun-16 |
|
Mwalimu SACCO |
Equatorial Commercial Bank |
1.2 |
75.0% |
2.6 |
2.3x |
Mar-15 |
|
Centum |
K-Rep Bank |
2.1 |
66.0% |
2.5 |
1.8x |
Jul-14 |
|
GT Bank |
Fina Bank Group |
3.9 |
70.0% |
8.6 |
3.2x |
Nov-13 |
|
Average |
74.5% |
1.3x |
||||
|
* Announcement Date ** Deals that were dropped |
||||||
Universe of coverage:
|
Company |
Price as at 09/12/2022 |
Price as at 16/12/2022 |
w/w change |
YTD Change |
Target Price* |
Dividend Yield |
Upside/ Downside** |
P/TBv Multiple |
Recommendation |
|
Jubilee Holdings |
200.0 |
200.0 |
0.0% |
(36.9%) |
305.9 |
0.5% |
53.5% |
0.4x |
Buy |
|
KCB Group*** |
36.9 |
37.3 |
0.9% |
(18.2%) |
52.5 |
2.7% |
43.6% |
0.6x |
Buy |
|
Britam |
5.0 |
5.0 |
0.0% |
(33.9%) |
7.1 |
0.0% |
42.4% |
0.8x |
Buy |
|
Kenya Reinsurance |
1.9 |
1.9 |
(1.6%) |
(18.8%) |
2.5 |
5.4% |
40.3% |
0.1x |
Buy |
|
Co-op Bank*** |
12.1 |
12.0 |
(0.8%) |
(7.7%) |
15.5 |
8.3% |
37.3% |
0.7x |
Buy |
|
Equity Group*** |
45.0 |
45.5 |
1.1% |
(13.7%) |
58.4 |
6.6% |
34.8% |
1.1x |
Buy |
|
I&M Group*** |
16.8 |
17.1 |
2.1% |
(20.1%) |
20.8 |
8.8% |
30.5% |
0.4x |
Buy |
|
ABSA Bank*** |
12.0 |
12.2 |
1.3% |
3.4% |
15.5 |
1.6% |
28.8% |
1.0x |
Buy |
|
Stanbic Holdings |
92.0 |
92.8 |
0.8% |
6.6% |
108.6 |
9.7% |
26.8% |
0.8x |
Buy |
|
NCBA*** |
35.1 |
36.1 |
2.8% |
41.8% |
43.4 |
5.5% |
25.7% |
0.8x |
Buy |
|
Sanlam |
8.9 |
9.6 |
7.9% |
(16.9%) |
11.9 |
0.0% |
24.1% |
1.0x |
Buy |
|
Diamond Trust Bank*** |
48.3 |
48.5 |
0.4% |
(18.5%) |
57.1 |
6.2% |
24.0% |
0.2x |
Buy |
|
Standard Chartered*** |
146.0 |
139.0 |
(4.8%) |
6.9% |
164.8 |
4.3% |
22.9% |
0.9x |
Buy |
|
Liberty Holdings |
4.5 |
5.7 |
27.1% |
(19.5%) |
6.8 |
0.0% |
18.8% |
0.4x |
Accumulate |
|
CIC Group |
1.9 |
2.0 |
1.0% |
(9.7%) |
2.3 |
0.0% |
18.4% |
0.7x |
Accumulate |
|
HF Group |
3.1 |
3.2 |
1.6% |
(16.1%) |
3.5 |
0.0% |
11.0% |
0.2x |
Accumulate |
|
*Target Price as per Cytonn Analyst estimates **Upside/ (Downside) is adjusted for Dividend Yield ***For Disclosure, these are stocks in which Cytonn and/or its affiliates are invested in |
|||||||||
We are “Neutral” on the Equities markets in the short term due to the current adverse operating environment and huge foreign investor outflows, and, “Bullish” in the long term due to current cheap valuations and expected global and local economic recovery.
With the market currently trading at a discount to its future growth (PEG Ratio at 0.9x), we believe that investors should reposition towards value stocks with strong earnings growth and that are trading at discounts to their intrinsic value. We expect the current high foreign investors sell-offs to continue weighing down the economic outlook in the short term.
- Residential Sector
During the week, property developer Erdemann Limited, in conjunction with the County Government of Machakos, broke ground for the construction of the fifth phase of Great Wall Gardens project located in Mavoko municipality. The Kshs 4.2 bn project will constitute 1,128, 3-bedroom master ensuite units, which upon completion will bring the total number of units completed by the developer to 7,185 since 2003. Additionally, this comes three months after the developer completed and launched the fourth phase of the project in August 2022. Other notable projects by the developer include; Greatwall Apartments Phase 1 to Phase 3 which are located in Mlolongo, Seefar Apartments situated in High Rise Estate, Windsor View Apartments in Kiambu, Kileleshwa Executive Apartments, and, Metro Fairview Towers located in Pangani. The table below gives a summary of the unit type, size and prices for the 5th phase of the project;
|
Cytonn Report: Great Wall Gardens Phase 5 Project |
|||
|
Typology |
Unit size (SQM) |
Unit Price (Kshs) |
Price per SQM(Kshs) |
|
3 beds (Master Ensuite) |
104 |
3.9 mn |
37,500 |
Source: Cytonn Research 2022
In terms of performance, Athi River apartments recorded an average selling price of Kshs 58,199 per SQM in Q3’2022. Notably, the average price per SQM for apartments at Great Wall Gardens is Kshs 37,500, which is 35.6% lower than Athi River’s market average, cementing the affordability of the development. Athi River also recorded occupancies and uptakes of 85.2% and 15.2% respectively positioning the development viable as the developer is expected to gain total returns of up to 7.0% from rental and market appreciation, this excludes the development returns. The table below shows the lower mid end satellite towns’ residential apartment’s performance during Q3’2022;
(All values in Kshs unless stated otherwise)
|
Cytonn Report: Apartments Average Performance Q3’2022 |
||||||||
|
Area |
Price per SQM Q3'2022 |
Rent per SQM Q3'2022 |
Occupancy Q3'2022 |
Uptake Q3'2022 |
Annual Uptake Q3'2022 |
Rental Yield Q3'2022 |
Price Appreciation Q3'2022 |
Total Returns |
|
Lower Mid-End Satellite Towns |
||||||||
|
Ruaka |
108,117 |
546 |
80.7% |
82.8% |
21.5% |
5.1% |
2.3% |
7.4% |
|
Ngong |
64,382 |
360 |
82.3% |
83.0% |
11.7% |
5.6% |
1.7% |
7.3% |
|
Ruiru |
89,418 |
480 |
87.4% |
86.3% |
17.8% |
5.6% |
1.5% |
7.2% |
|
Kikuyu |
81,624 |
474 |
76.6% |
85.8% |
15.7% |
5.2% |
1.9% |
7.2% |
|
Athi River |
58,199 |
329 |
85.2% |
92.8% |
15.2% |
5.6% |
1.4% |
7.0% |
|
Syokimau |
71,302 |
343 |
86.6% |
89.8% |
12.5% |
5.2% |
1.7% |
6.9% |
|
Thindigua |
101,089 |
498 |
89.9% |
80.8% |
17.7% |
5.4% |
1.2% |
6.6% |
|
Rongai |
91,597 |
316 |
89.2% |
76.4% |
12.6% |
6.1% |
(0.2%) |
5.9% |
|
Kitengela |
59,434 |
277 |
85.9% |
97.5% |
10.3% |
5.0% |
0.4% |
5.3% |
|
Average |
80,573 |
403 |
84.9% |
86.1% |
15.0% |
5.5% |
1.3% |
6.8% |
Source: Cytonn Research 2022
Once completed, the project is expected to; i) provide quality and decent housing to Mavoko residents thereby improving their living standards, ii) boost home ownership rates in the country which have remained significantly low at 21.3% in urban areas as at 2022, iii) curb the existing housing deficit which stands at 2.0 mn, and, iv) develop sustainable neighborhoods among the informal and the low income communities.
Great Wall Gardens project which aims to boost communities, private sector, and local authorities’ capacities in the supply of housing, infrastructure, and services, complements government's affordable housing initiative which continues to gain momentum with several projects in the pipeline as outlined in the table below;
|
Cytonn Report: Summary of Notable Ongoing Affordable Housing Projects in The Nairobi Metropolitan Area |
|||
|
Name |
Developer |
Location |
Number of Units |
|
Pangani Affordable Housing Program |
National Government and Tecnofin Kenya Limited |
Pangani |
1,562 |
|
River Estate Affordable Housing Program |
National Government and Erdemann Property Limited |
Ngara |
2,720 |
|
Park Road Affordable Housing Program |
National Housing Corporation |
Ngara |
1,370 |
|
Mukuru Affordable Housing Program |
National Housing Corporation |
Mukuru kwa Njenga, Enterprise Road |
15,000 |
|
Mavoko Affordable Housing Project |
National Government and Epco Builders |
Syokimau, Machakos County |
5,360 |
|
NHC Stoni Athi View (Economy Block-Rental) |
National Housing Corporation |
Athi River, Machakos County |
50 |
|
NHC Stoni Athi View |
National Housing Corporation |
Athi River, Machakos County |
120 |
|
Mariguini Informal Settlement |
National Government |
Starehe, Nairobi County |
2600 |
|
Kibera Soweto East Zone B |
National Government |
Kibera, Nairobi County |
3,000 |
|
Starehe Affordable Housing Project |
National Government and Tecnofin Kenya Limited |
Starehe, Nairobi County |
3,000 |
|
Total |
|
|
34,782 |
Source: Boma Yangu Portal
In addition to the above, there also exist several projects initiated by private developers to fast-track the delivery of housing projects through the program such as;
|
Cytonn Report: Summary of Notable Ongoing Affordable Housing Projects in The Nairobi Metropolitan Area |
|||
|
Name |
Developer |
Location |
Number of Units |
|
Great Wall Gardens Phase 5 |
Erdemann Limited |
Mavoko, Machakos County |
1,128 |
|
Samara Estate |
Skymore Pine Limited |
Ruiru |
1,824 |
|
Moke Gardens |
Moke Gardens Real Estate |
Athi River |
30,000 |
|
Habitat Heights |
Afra Holding Limited |
Mavoko |
8,888 |
|
Tsavo Apartments |
Tsavo Real Estate |
Embakasi, Riruta, Thindigua, Roysambu, and, Rongai |
3,200 |
|
Unity West |
Unity Homes |
Tatu City |
3,000 |
|
RiverView |
Karibu Homes |
Athi River |
561 |
|
Kings Serenity |
|
Ongata Rongai, Kajiado County |
734 |
|
Joinven Estate |
Joinven Investments Limited |
Syokimau, Machakos County |
440 |
|
Total |
|
|
49,775 |
Source: Boma Yangu Portal
We believe the initiative will persist supported by private developers’ engagement through various strategies such as Public Private Partnerships (PPPs), positively impacting Kenya’s housing sector’s performance while enhancing diverse resident’s living standards. Consequently, the move will help curb the current housing deficit and facilitate the delivery of affordable housing units in the country.
- Real Estate Investment Trusts (REITs)
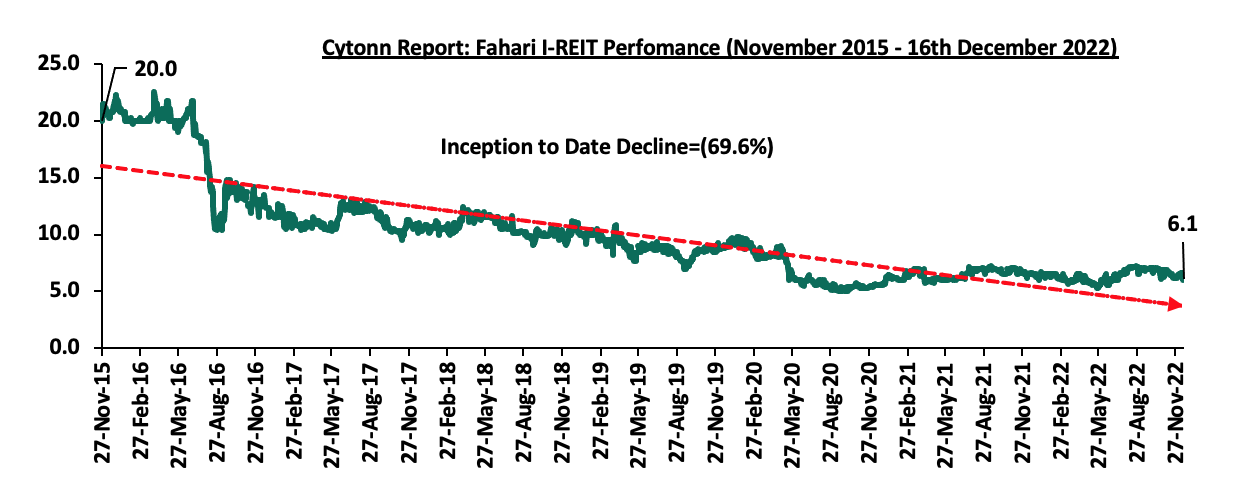
In the Nairobi Securities Exchange, ILAM Fahari I-REIT closed the week trading at an average price of Kshs 6.1 per share. The performance represented an 8.4% decline from Kshs 6.6 per share recorded the previous week, taking it to a 5.3% Year-to-Date (YTD) loss from Kshs 6.4 per share. In addition, the performance represented a 69.6% Inception-to-Date (ITD) decline from the Kshs 20.0 price. The dividend yield currently stands at 8.2%. The graph below shows Fahari I-REIT’s performance from November 2015 to 16th December 2022;
In the Unquoted Securities Platform, Acorn D-REIT and I-REIT traded at Kshs 23.8 and Kshs 20.9 per unit, respectively, as at 2nd December 2022. The performance represented a 19.2% and 4.4% gain for the D-REIT and I-REIT, respectively, from the Kshs 20.0 inception price. The volumes traded for the D-REIT and I-REIT came in at 5.5 mn and 15.1 mn shares, respectively, with a turnover of Kshs 117.0 mn and Kshs 313.1 mn, respectively, since its inception in February 2021.
Kenya’s property market continues to realize remarkable growth and development activities particularly in the housing sector. However, setbacks such as minimal investor appetite for the REIT instrument continue to pose a challenge to the optimum performance of the sector.
Kenya's Real Estate sector contribution to GDP has grown exponentially in recent years, expanding at a CAGR of 6.2% over the past five years. Some of the factors that have driven the upward performance of the Real Estate sector include; i) Rapid population growth and urbanization, ii) rapid expansion drive by both local and international retailers which boosts the performance of the retail sector, iii) reopening and expansion of the hospitality sector on the back of economic recovery, coupled with the improved investor confidence in the sector, iv) high investor appetite for Mixed Use Developments (MUDs) owing to their convenience, and, v) efforts to improve infrastructure across the country which further opening up various locations for investment.
Despite this, the sector’s performance has been weighed down by a couple of challenges over the recent years such as the onset of the COVID-19 pandemic which caused the sector to experience a slowdown in activity, with the two investment classes most negatively impacted being the hospitality and commercial office sectors. Other factors that have negatively impacted the performance of the sector include: i) an oversupply of 6.7 mn SQFT in the Nairobi Metropolitan Area (NMA) commercial office market, 3.0 mn SQFT in the NMA retail market, and 1.7 mn SQFT oversupply in the overall Kenyan retail market as at 2022, and, ii) difficulty in the access of funding. The financing challenge is fuelled by Kenya’s under developed capital markets given that there exists only one listed REIT in the country since inception of the investment regime in 2013. Due to this, most property developers rely on conventional sources of funding such as banks, compared to other developed countries. The table below shows the comparison of development funding in Kenya against developed economies;
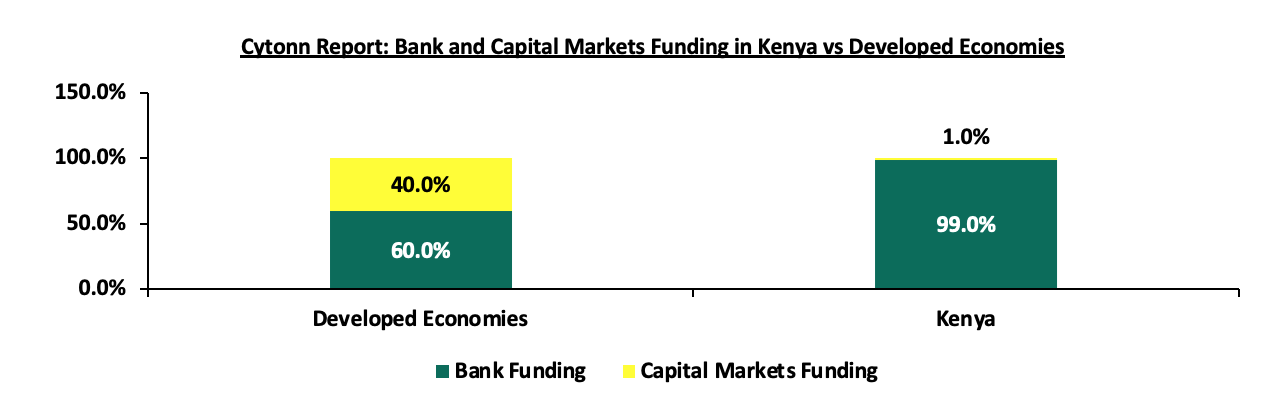
Source: World Bank
The REITs to market capitalization for Kenya remains very low compared to other jurisdictions. To curb the funding gap, Real Estate stakeholders have been focusing on exploring alternative ways of financing Real Estate Developments such as Real Estate Investment Trusts (REITs) which are regulated by the Capital Markets Authority (CMA). In 2013, CMA put in place a REITs framework and regulations that developers can utilize to raise capital. This paved the way for the authorization of four REITs in the Kenyan market, all of which are structured as closed-ended funds but with only one – ILAM Fahari I-REIT, listed and traded on the NSE’s Main Investment Market. On the other hand, Acorn I-REIT and D-REIT are not listed, but trade on the Unquoted Securities Platform (USP), an over-the-counter market segment of the NSE. In addition, LAPTrust Imara I-REIT is currently pursuing listing after it was granted approval by the CMA to list on the NSE’s Main Investment Market, under the Restricted Sub-segment. The table below highlights the REITs authorized by the CMA in Kenya;
|
Cytonn Report: Authorized REITs in Kenya |
||||||
|
Issuer |
Name |
Type of REIT |
Listing Date |
Market Segment |
Status |
|
|
1 |
ICEA Lion Asset Management (ILAM) |
Fahari |
I-REIT |
October 2015 |
Main Investment Market |
Trading |
|
2 |
Acorn Holdings Limited |
Acorn Student Accommodation (ASA) – Acorn ASA |
I-REIT |
February 2021 |
Unquoted Securities Platform (USP) |
Trading |
|
3 |
Acorn Holdings Limited |
Acorn Student Accommodation (ASA) – Acorn ASA |
D-REIT |
February 2021 |
Unquoted Securities Platform (USP) |
Trading |
|
4 |
Local Authorities Pension Trust (LAPTrust) |
Imara |
I-REIT |
November 2022 |
Main Investment Market: Restricted Sub-segment |
Restricted |
Source: Nairobi Securities Exchange, CMA
Further, according to the Capital Markets Authority (CMA)’s Q4’2020 Capital Markets Soundness Report, the financing for construction in Kenya was majorly sourced from the banking sector at 95.0% while capital markets contributed only 5.0%; further highlighting the overreliance on banks. We believe the REITS are crucial to closing the funding gap for real estate, hence the focus note on REITs.
To have a comprehensive understanding of REITs and the Kenyan REIT market, we have previously done three topicals namely; i) Real Estate Investment Trusts (REITs) as an Investment Alternative in 2019, ii) Real Estate Investment Trusts in Kenya in 2021, and, iii) Real Estate Investment Trusts Performance in Kenya in 2022. Due to their exclusivity as an investment segment allowing access to capital markets, REITs could offer a means to complement the delivery of various projects in the country such as the affordable housing initiative that has been gaining momentum in the country. However, since the adoption of REIT structures in 2013, their activity has remained low, and, hence their performance remains below optimum. This week, we update our topical by shading light on the progress of REITs in Kenya by covering what could be done to improve the uptake and performance of REITs by covering the following topics;
- Overview of REITs,
- Types of REITs,
- Benefits and challenges associated with investing in REITs,
- REITS progress and performance in Kenya,
- Case studies of REITs in other countries,
- Recommendations, and,
- Conclusion
Section I: Overview of REITs
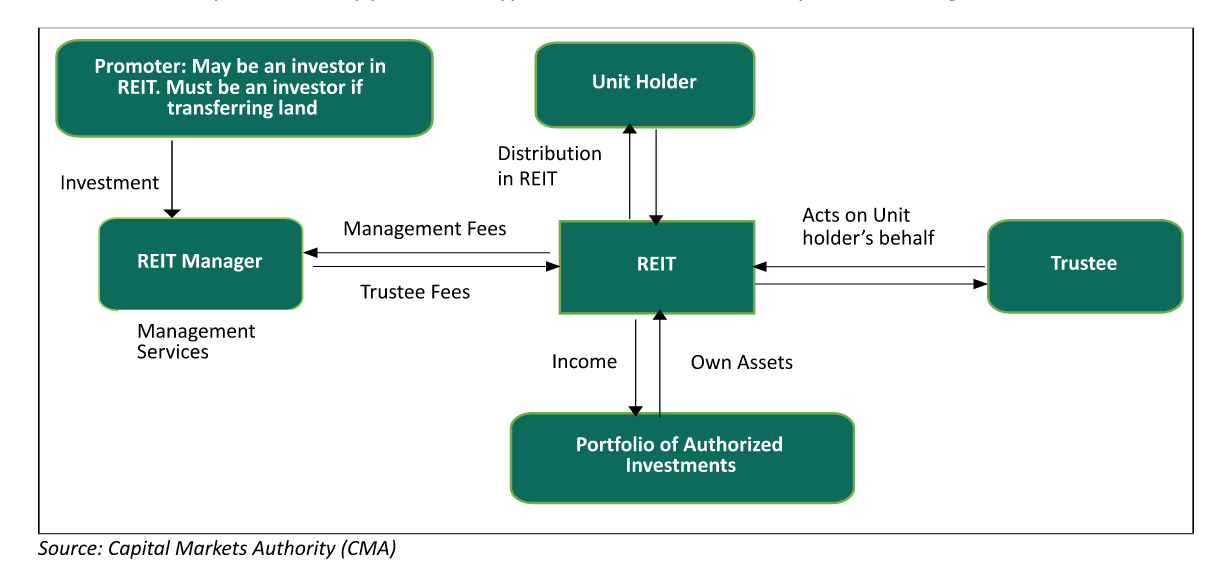
REITs are essentially regulated collective investment vehicles that allow investors to contribute money’s worth as consideration for the acquisition of rights or interests in a trust that is divided into units with the intention of earning profits or income from Real Estate as beneficiaries of the trust. Investors can purchase and sell shares of REITs on the stock market. REITs source funds to build or acquire Real Estate assets, which they sell or rent to generate income. At the end of a fiscal year, the generated income is then dispersed as returns (dividends) on investment to the shareholders. There are four important parties who collaborate to guarantee the protection of REITs interests and to help promote accountability and transparency inside the REIT structure. These parties include:
- The Promoter: This party is involved in setting up a REIT scheme. The promoter is regarded as the initial issuer of REIT securities and is involved in making submissions to the regulatory authorities to seek relevant approvals of a draft trust deed, draft prospectus or an offering memorandum. Some of the REIT promoters in Kenya include Acorn Holdings Limited and LAP Trust,
- The REIT Manager: This is a company that has been incorporated in Kenya and has been issued a license by the authority (CMA) to provide Real Estate and fund management services for a REIT scheme on behalf of investors. Currently, there are 10 REIT Managers in Kenya namely; Cytonn Asset Managers Limited (CAML), Acorn Investment Management, Stanlib Kenya Limited, Nabo Capital, ICEA Lion Asset Managers Limited, Fusion Investment Management Limited, H.F Development and Investment Limited, Sterling REIT Asset Management, Britam Asset Managers Limited, and CIC Asset Management Limited,
- The Trustee: This is a corporation or a company that has been appointed under a trust deed and is licensed by the authority (CMA) to hold the Real Estate assets on behalf of investors. The Trustee’s main role is to act on behalf of the investors in the REIT, by assessing the feasibility of the investment proposal put forward by the REIT Manager and ensuring that the assets of the scheme are invested in accordance with the Trust Deed. REIT trustees in Kenya include; Kenya Commercial Bank (KCB), Co-operative Bank (Coop) and Housing Finance Bank and,
- Project/Property Manager: The role of the project manager is to oversee the planning and delivery of the construction projects in the REITs. The property manager on the other hand plays the role of managing the completed Real Estate development that has been acquired by a REIT with his main goal being profit generation.
The relationship between key parties in a typical REITs structure is as depicted in the figure below;
Section II: Types of REITs
There are three main types of REITs in Kenya and they include;
- Income Real Estate Investment Trust (I-REITs): This’ a type of REIT in which investors pool their capital for purposes of acquiring long term income generating Real Estate including residential, commercial, and other Real Estate asset types. In I-REITs, investors gain through capital appreciation and rental income,
- Development Real Estate Investment Trusts (D-REITs): A D-REIT is a type of REIT in which investors pool together their capital together for purposes of acquiring Real Estate with a view of undertaking development and construction projects. A D-REIT can be converted into an I-REIT once development is complete where the investors can choose to sell, reinvest or lease their shares. D-REIT investors gain from sale profits once an asset is sold in a commercial arm’s length transaction, and,
- Islamic Real Estate Investment Trusts: An Islamic REIT is a unique type of REIT that invests primarily in income-producing Shari’ah-compliant Real Estate developments. A fund manager is required to conduct a compliance test before investing to ensure it is Shari’ah compliant and that non-permissible activities are not conducted in the estate and if so, then on a minimal basis.
Section III: Benefits and challenges associated with investing in REITs
- Benefits of Investing in Real Estate Investment Trusts (REITs);
- Diversification: Investing in a variety of asset classes such as REITs, fixed income securities and equities helps to reduce risk when incorporated into a single investment, as it spreads the investments across diverse locations, sectors, platforms and classes. REIT institutions typically own physical assets such as land and buildings, and frequently enter into lengthy leases with their tenants. This makes REITs some of the most dependable investments on the market. This diversification creates the opportunity for blended portfolio to earn higher returns while reducing the potential for negative or low returns,
- Stable and Consistent Income Stream: Investors who opt for I-REITs gain the benefit of regular rental income, which guarantees a dependable and consistent income source. According to the CMA regulations, I-REITs must distribute at least 80.0% of their earnings to unit holders via dividends,
- Flexible Asset Class: REITs are seen as an adaptable investment tool, allowing investors to tailor their portfolio of REITs to match the characteristics of the fund, the different segments of the Real Estate market, and their desired geographic exposure,
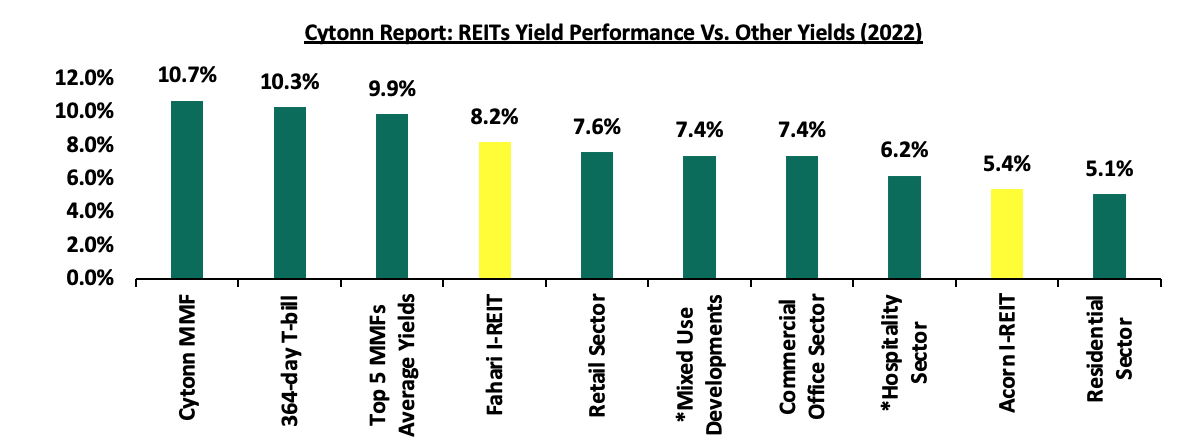
- Competitive Long-Term Returns: REITs provide robust and long-term yields. This makes them an ideal component of a successful and efficient portfolio. The chart below shows the comparison of Kenyan REIT yield performance versus other yields in 2022. It is notable that the promise of competitive yields from REITs is yet to materialize in Kenya;
- Liquidity: Selling a physical property requires investing both time and money in terms of commissions, fees, and taxes. Investing in REITs, on the other hand, offers greater liquidity, as investors can buy and sell units or shares of REITs at any time, particularly if they are publicly listed. This liquidity advantage is also applicable to Real Estate developers who are not in a hurry to completely liquidate their assets if they need some liquidity,
- Beneficial Tax Reliefs: REITs typically benefit from exemptions such as the income tax (except for withholding tax on interest income and dividends). Additionally, the transfer of properties to a REIT is exempt from stamp duty, as per the terms of Section 96A (1) (b) of the Stamp Duty Act. Furthermore, REITs’ investee companies are exempt from income tax as outlined in Section 20 of the Income Tax Act, with withholding tax constituting the final tax on that income,
- Transparency: Listing of REITs ensures that their activities are transparent; also, these REITs are registered and subjected to stringent financial reporting, corporate governance, and information disclosure guidelines by securities market authorities, and,
- Access to new capital: REITs provide a method for pooling cash for investment in capital-intensive long-term income-producing Real Estate projects, supplementing existing capital-raising routes such as debt and equity markets, and raising funds to capitalize on opportunities as they occur.
- Challenges Associated with investing in REITs
Despite the aforementioned benefits, the Kenyan REIT market has been on a dismal performance since its inception in 2013. This comes at a time when only 4 REITs have been incorporated, with only ILAM Fahari I-REIT listed in the NSE. Consequently, Kenya’s REIT Market Capitalization to GDP has remained significantly low at 0.01%, compared to other countries such as South Africa with 3.9%, as shown below;
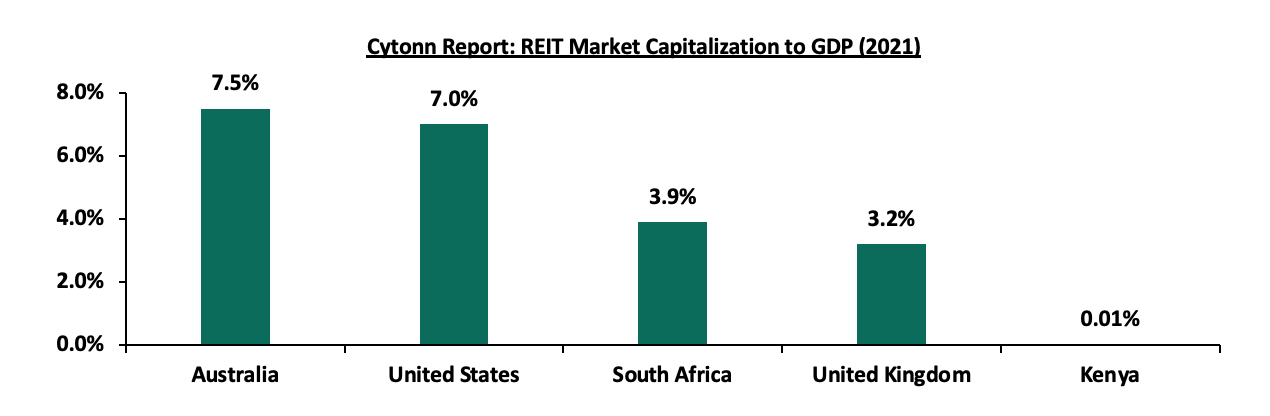
Source: European Public Real Estate Association (EPRA), World Bank
This constrained performance is attributed to various factors which include;
- High Minimum Capital Requirement for a Trustee: The minimum capital requirement for a Trustee of Kshs 100.0 mn effectively limits the eligible trustees to only banks, thus eliminating corporate trustees and other fund managers. This is 10x more than the requirement for a REIT Fund Manager and a pension scheme Corporate Trustee, which is Kshs 10.0 mn. As a consequence, the current overdependence on banks is amplified as only banking institutions can meet this criterion. To illustrate, the licensed REITs trustees in Kenya; Kenya Commercial Bank (KCB), Co-operative Bank (Coop) and Housing Finance Group,
- High Minimum Asset Size for Investment Companies: According to CMA regulations, the minimum size of initial assets for I-REITs is Kshs 300.0 mn whereas for the D-REITs is at Kshs 100.0 mn. The limits are very high for most companies in the country to achieve and manage the assets and the only easier way to achieve the initial asset requirements is via huge investments in Real Estate. This wards off medium and small startup that might want to join the REITs market hence very low uptake in the investments,
- High Minimum Investments Amounts: The current regulations set the minimum investment amount for a D-REIT at Kshs 5.0 mn, which is an overwhelming 100x higher than the gross median income of Kshs 50,000 in Kenya. This creates a situation in which many investors who need the safety that regulated structures offer for their investments, particularly in alternative portfolio classes markets, are unable to benefit from it,
- Adverse Conflicts of Interests with Trustees: Due to the large sum of minimum capital required, only three banks serve as Trustees in the REITs market. This has created severe conflicts with institutions in the market with instances where banks have requested deposits from prospective REITs in order to complete their Trustee obligations,
- Insufficient Investment Knowledge and Awareness of the REITs Market: Despite REITs having been available in the Kenyan market for 9 years, the instrument has not gained much popularity and majority of potential investors are not aware of REITS, thus contributing to the low uptake, subscription rates and poor performance,
- Subdued Performance of Select Real Estate Sectors: Despite the recovery of Kenya’s Real Estate sector, oversupply of physical space remains a challenge. As of 2022, there exists an oversupply of 6.7 mn SQFT in the Nairobi Metropolitan Area (NMA) commercial office market, 3.0 mn SQFT in the NMA retail market, and 1.7 mn SQFT oversupply in the overall Kenyan retail market. The dire situation has resulted to subdued occupancy rates and yields,
- Lengthy Licensing and Approval Processes: The licensing and approval process for REITs is laborious and time-consuming due to the need for documentations and compliance with various legal and regulatory requirements. This could put off promoters from investing in REITs, and may encourage them to seek alternative, more efficient means to raise capital, and,
- Continued Economic Slowdown: This has resulted from; i) high operating environment attributable to high interest rates against the rising inflation, depreciation Kenyan currency against the Dollar and high energy prices, ii) interruptions in global supply chains of various commodities especially in the construction sector, iii) geopolitical tensions in regards to conflicts between nations involving major economic superpowers (Russia Ukraine War, China-Taiwan proxy, and tensions in the Middle East), iv) extreme climatic and environment conditions, v) looming debt crisis of the country, and vi) increasing protectionism.
Section IV: REITs Progress and Performance in Kenya
In 2013, Kenya become the third African nation to adopt REITs as an investment vehicle, following in the footsteps of Ghana and Nigeria, who had initiated their REIT frameworks in 1994 and 2007 respectively. Subsequent to that, South Africa became the fourth African country to launch REITs in 2013 after Kenya making the investment milestone. There are currently four authorized REITs in Kenya namely; the ILAM Fahari I-REIT, Acorn Student Accommodation I-REIT, Acorn Student Accommodation D-REIT, and recently, the Local Authorities Pension Trust (LAP Trust) Imara I-REIT. However, only one REIT is listed.
ILAM Fahari I-REIT was listed and began trading in the Nairobi Securities Exchange (NSE) in November 2015. The two Acorn REITs launched in February 2021 are not listed but investors can trade their shares over the counter through NSE’s Unquoted Securities Platform (USP). The Local Authorities Pension Trust (LAP Trust) Imara I-REIT was approved for listing on the Nairobi Securities Exchange (NSE) Main Investment Market in November 2022, a process which is currently underway. However, it sought permission to restrain trade for the following three years due to difficulties in finding the minimum 7 investors in a depressed market, and desired the REIT to create a substantial track record before allowing the units to trade freely.
A total of only three REITs in Kenya is low compared to countries like South Africa which has 33 listed REITs despite REITs regulations becoming operational in 2013 and after Kenya. Below we look at the REITs industry’s performance in Kenya through different metrics; notable activities in the market, and, financial performance of the operational REITs. We will also look at the progress made regarding status of policy proposals made by the Capital Market Authority in efforts to streamline the REIT’s industry in the country an increase its uptake by investors.
Notable Activities
Some of the recent notable activities in the Kenyan REIT’s sector include;
- The REITs Association of Kenya (RAK) announced plans to initiate a 5-phase REIT incubator program during the Capital Market Conference on Real Estate Investment Trusts held at Emara Ole-Sereni on 30th November 2022. The program would be managed by RAK and help REIT promoters to progressively design and launch new REITS in the market. The main aim of the program is to launch 4 new REITs in the market in 18 months. Other objectives of the program will include;
- Provide support to emerging REITs,
- Share learnings in a peer community of REIT promoters & provide support/guidance,
- Leverage engaging and credible professionals to help with REIT strategy or/and implementation,
- Discuss service providers, documentation, processes, and other relevant items, and,
- Provide guidance between REITs in design and already operational,
- In November 2022, the Capital Markets Authority (CMA) approved the listing of the Local Authorities Pension Trust (LAP Trust) Imara I-REIT, on the Nairobi Securities Exchange (NSE) Main Investment Market under the Restricted Sub-segment. It was offered as a close-ended fund capped at Kshs 20.0 per unit, with a total of Kshs 346.2 mn units worth Kshs 6.9 bn. For more information, see our Cytonn Monthly – October 2022,
- In March 2022, Grit Real Estate Income Group invested Kshs 6.1 bn to acquire Orbits Products Africa, a warehousing complex. This came after the investment firm entered a Kshs 2.9 bn loan agreement with the International Finance Corporation (IFC) in July 2021, with an aim of acquiring and developing the warehousing and manufacturing facility. For more information, see our Cytonn Weekly #14/2022,
- In January 2022, Grit Real Estate Income group REIT acquired a 20.0% stake in Gateway Real Estate Africa Ltd (GREA) which invested Kshs 5.5 bn to build a diplomatic housing estate in Rosslyn which will be leased to the staff of the United States embassy in Nairobi for 8 years. For more information, see our Cytonn Q1’2022 Markets Review, and,
- In August 2021, Acorn launched an investment club dubbed Vuka through which retail investors can invest in the property fund with capital starting from Kshs 50,000. The Vuka platform was admitted into the Capital Markets Authority’s Sandbox (a platform for encouraging innovation in the Capital Markets). The fund managed to attract 257 members with total contributions of Kshs 6.4 mn by December 31, 2021.
With the listing of an additional REIT institution in the local market to the public, investors will have a broader opportunity to enjoy REIT benefits. The milestone will also improve investors’ confidence in the industry, create more track records in the industry and play critical roles in the achievement of government’s housing agenda as well as democratization of investment opportunities.
Section V: Case studies of REITs in other countries
In our previous topicals covering the REITs market in Kenya, we highlighted the REITs markets of several countries such as Singapore, Australia, and South Africa. This week, we now take a look at the lessons on the operational and policy framework in the REITs market that we can learn from these aforementioned countries, in addition to those from China and the United Kingdom (UK);
|
Cytonn Report: Summary of Case studies of REITs in Various Countries |
|
|
Country |
Key Take-outs |
|
Singapore |
|
|
Australia |
|
|
South Africa |
|
|
China |
|
|
United Kingdom (UK) |
|
Overall, the REIT market stakeholders of Singapore, Australia, South Africa, China and the UK create an enabling environment for REITs, through various incentives to market participants, which potentially increases their attractiveness compared to other investment instruments. Our analysis of the REITs markets in these countries indicates that we can draw various lessons that could improve REITs market in Kenya. Most of all, the successful growth of REITs in these countries can largely be attributed to the supportive regulatory frameworks and REIT structure. In addition, the REITs have become increasingly popular in these countries as investors have become more comfortable with REITs as a viable investment option.
Section VI: Recommendations
The progress of the Kenyan REIT market is underway, albeit slow, with the potential to experience growth similar to those of other countries that have seen positive REIT market outcomes. With view of this, we recommend the following measures to be taken in order to further spur the Kenyan REIT market;
- Education of Key Stakeholders and Decision Makers: All key stakeholders need to be educated on the REIT structure. For example, a recent market participant experienced difficulty getting a KRA PIN just because the agency did not understand what is a trust structure,
- Allow different legal entities for REIT formation: Just as it’s done in South Africa, different legal entities should be able to incorporate REITs. In Kenya only a trust is allowed to form a REIT. Other entities such as companies, partnerships, in addition to trusts should also be permitted,
- Introduce Hybrid REIT Vehicles: Though promising higher returns, there is a relatively high exposure to development risk for D-REIT investors brought about by the increasing costs of construction. Currently, investors have to subscribe to both of the separate REIT classes, forcing them to pay duplicate costs, due to the nature of exclusivity of the two. A hybrid REIT would provide investors integrated returns, by combining the higher return from development while reducing risk exposure through the relatively stable income component of the I-REIT. In addition, an IPO with such a hybrid REIT vehicle would eliminate the duplicated costs of running two separate REITs, thereby improving subscriptions by investors,
- Efficient approval structure: In order to streamline the approval process for Real Estate Investment Trusts (REITs), the approval structure should be combined into one agency, instead of the current two (CMA and KRA). Combining the approval structure into one approval structure would eliminate the need to go through two separate agencies for REITs approval, which would streamline the process by improving its efficiency, saving on costs, and increasing transparency and accountability,
- Reduce the amount of capital required for a REIT Trustee: Reducing the amount of capital required for a REIT Trustee from Kshs 100.0 mn to match what is required for Pension Trustee, Kshs 10.0 mn, would broaden the pool of trustees by allowing more financial institutions to become eligible to serve as trustees. There are only 3 REITs Trustees compared with 11 for Pension Funds. This would increase competition by providing more choice for REIT Sponsors, allowing them to select a trustee that is more closely aligned with their objectives.,
- Remove the high minimum of Kshs 5.0 mn for D-REITs: The high minimums locks people out of the market. The minimums for more developed markets stand at about Kshs 100,000. It is not clear why Kenya’s minimum is 50 times the amount of developed markets, and 100 times the average median income of Kshs 50,000,
- Give time before requiring that a REIT must list in the public markets: REITs should be allowed to stay private for a while before listing. Companies are not comfortable listing from day one. For example, in the UK they are given 3 years before they are required to list, and,
- Reduce the bureaucracy required for REIT formation: It can take anywhere from 1 to 2 years to form a REIT due to the bureaucracy process. The CMA should make the REIT formation process more efficient thereby reducing time spent.
Section VII: Conclusion
The REITs market in Kenya presents opportunity to boost the Real Estate sector, allowing for an alternative way to finance real estate away from scarce and expensive debt financing, while providing returns for both developers and investors. With the ongoing drive by the government to provide decent housing to Kenyans, the REIT market could go a long way to boost the Affordable Housing Initiative by increasing the supply of housing units. However, for REITS to take off, we need to consider taking prompt and decisive action to implement some of the above recommendations.
Disclaimer: The views expressed in this publication are those of the writers where particulars are not warranted. This publication, which is in compliance with Section 2 of the Capital Markets Authority Act Cap 485A, is meant for general information only and is not a warranty, representation, advice or solicitation of any nature. Readers are advised in all circumstances to seek the advice of a registered investment advisor.

- Talk to us
- Kenya
- P.O Box 20695 - 00200, Nairobi, Kenya
- Cell +254709101200
- Tel +254709101200
- WhatsApp +254741676635
- United States
- +254709101200
- DOWNLOAD OUR APP
-


- Kenya
- 8th Floor, Pinetree Plaza, Kaburu Drive, Ngong Road, Nairobi, Kenya
- USA
- Suite 1150, 1775 Eye Street NW, USA, Washington DC 20006, USA
- Investments
- High Yield
- Private Equity
- Real Estate
- Real Estate
- RiverRun Estates
- Cytonn Towers
- The Ridge
- Taraji Heights
- The Alma