Jan 2, 2022
Economic Growth:
During the first half of the year, the economy recorded an average growth of 5.4% growth, 10.1% growth recorded in Q2’2021 and the 0.7% growth recorded in Q1’2021, an increase from the 0.2% contraction recorded in H1’2020. The expansion was largely driven by growth in the transport and the accommodation and food sectors which recorded growth of 16.9% and 9.1%, respectively, in Q2’2021, compared to the contraction of 16.8% and 56.6%, recorded in Q2’2020. The growth in these sectors follow the ease of COVID-19 travel restrictions and lift of the dawn to dusk curfew that was put in place since March 2020. Notably, the agricultural sector recorded a decline of 0.9% in Q2’2021, compared to a 4.9% growth in Q2’2020 and a 0.1% contraction in Q1’2021. The contraction during the quarters is mainly attributable to unfavorable weather conditions witnessed during the period. For more information, see our Q2’2021 GDP Note.
In 2021, the Kenyan economy is projected to grow at an average of 5.8% supported by continued recovery in the accommodation and food sector. The key challenge remains the Covid 19 pandemic and the fact that Kenya is having an election in2022. The table below shows the projections by various organizations:
|
No. |
Organization |
2021 Projections |
|
1 |
International Monetary Fund |
7.6% |
|
2 |
National Treasury |
6.4% |
|
3 |
Cytonn Investments Management PLC |
5.7% |
|
4 |
World Bank |
5.0% |
|
5 |
S&P Global |
4.4% |
|
Average |
5.8% |
|
|
Median of Growth Estimates |
5.7% |
|
Source: Cytonn Research, 2021
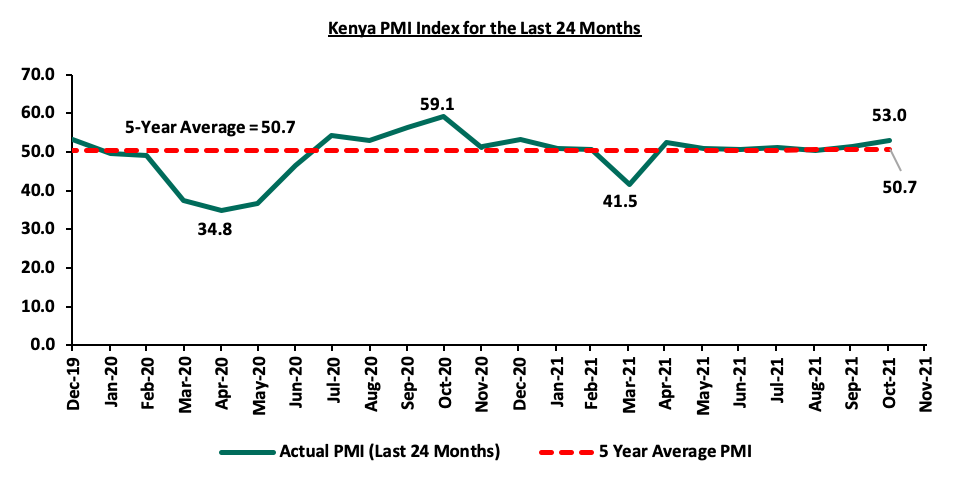
Business conditions in the Kenyan private sector recorded solid improvement during the year, with the average Stanbic Bank Monthly Purchasing Managers’ Index (PMI) for the first eleven months averaging 50.6, higher than the 48.0 recorded during a similar period in 2020. For the month of November 2021, the index increased to 53.0 from 51.4 recorded in October 2021.

The Kenya Shilling:
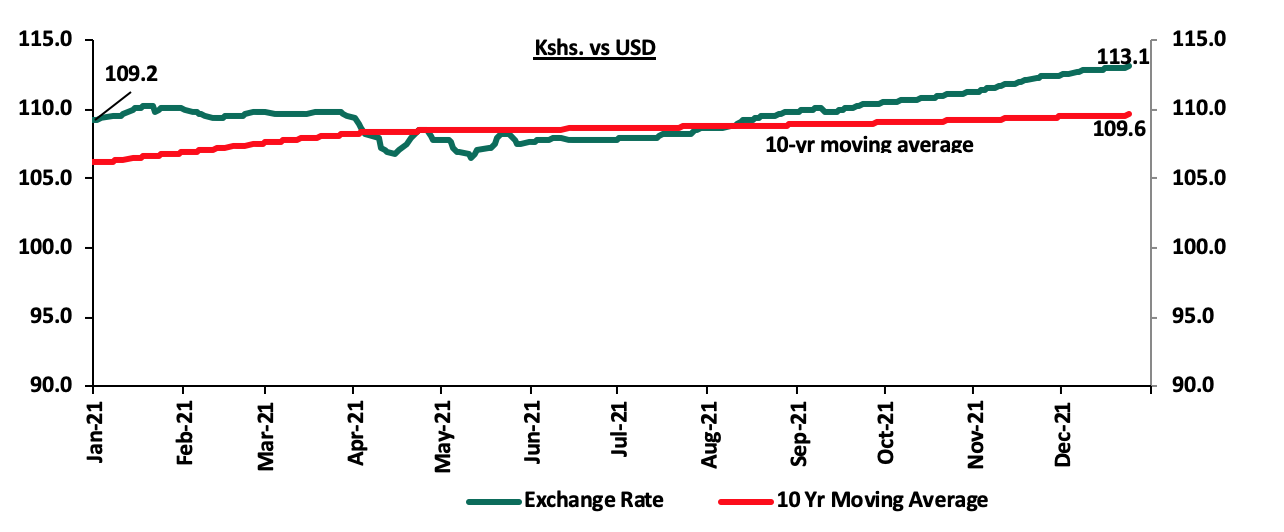
The Kenya Shilling depreciated by 3.6% against the US Dollar to close at Kshs 113.1 in 2021, compared to Kshs 109.2 at the end of 2020.

The performance of the Kenyan shilling in 2021 was driven by;
On the negative side we had
- Increased global crude oil prices that led to increased dollar demand from oil and energy importers who had to increase the amounts they pay for oil imports and hence depleting dollar supply in the market,
- Increased dollar demand as economies reopened leading to shortage of USD in the Kenyan market,
- Expansion of the current account deficit attributed to a robust increase in merchandise imports by 38.9% to Kshs 451.0 bn in Q2’2021, from Kshs 324.6 bn in Q1’2020 as compared to a 29.0% increase in merchandise exports to Kshs 179.7 bn, from Kshs 139.1 bn in Q2’2020, and,
- The aggressively growing government debt, with Kenya’s public debt having increased at a 10-year CAGR of 17.7% to Kshs 7.8 tn in July 2021, from Kshs 1.5 tn in July 2011 thus putting pressure on forex reserves to repay some of the public debt.
The shilling received some support driven by
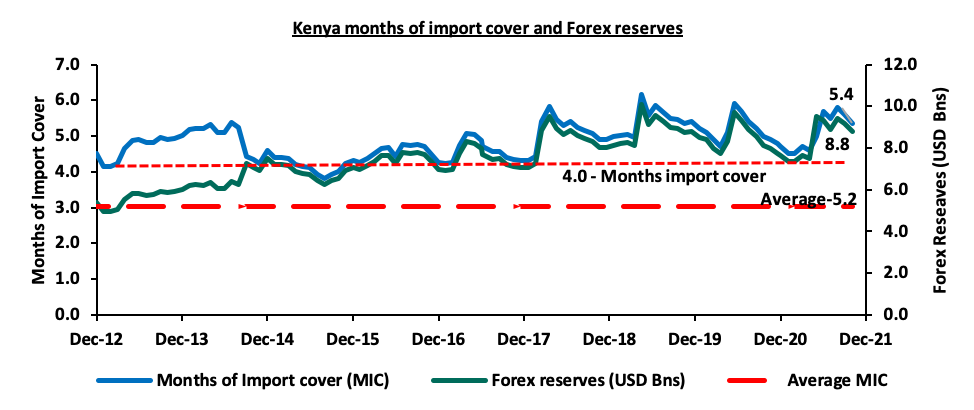
- The forex reserve remains sufficient well above the statutory requirement of maintaining at least 4.0-months of import cover, and the EAC region’s convergence criteria of 4.5-months of import cover. The following is a graph showing Kenya months of import cover and forex reserves since 2012;

- The government received USD 314.0 mn disbursement from the International Monetary Fund (IMF) earlier in April 2021 and the USD 407.0 mn approved by the IMF under the Extended Fund Facility and Extended Credit Facility in June 2021 which supported the reserves as they increased by 26.4% to Kshs 9.5 bn in June 2021 from Kshs 7.5 bn in May 2021. Additionally, in December 2021, the International Monetary Fund (IMF) completed the second review of the 38-month Extended Fund Facility (EFF) and Extended Credit Facility (ECF) allowing Kenya to access approximately USD 258.1 mn (Kshs 29.2 bn), bringing the total support from IMF to Kenya to USD 972.6 mn (Kshs 109.9 bn) in 2021. This debt relief is expected to support forex reserves,
- Diaspora remittances that has grown to USD 320.1 mn as at November 2021, compared to USD 257.7 mn recorded in the same period in 2020,
- CBK’s supportive activities in the money market, such as repurchase agreements and selling of dollars, and,
- Monetary policy support from CBK by maintaining the policy rate at the current 7.0%. Any additional rate cuts would lead to a further depreciation of the shilling.
In line with our expectations, the Kenyan shilling closed the year at Kshs 113.1. We expect the shilling to continue weakening in the medium term, within a range of Kshs 109.1 and Kshs 116.6 against the USD based on the Purchasing Power Parity (PPP) and Interest Rate Parity (IRP) approach. Read on our Review of Performance of Kenya Currency.
Inflation:
The inflation rate remained within the government’s set range of 2.5% - 7.5% but higher than the mid-range of 5.0% in 2021 with the average monthly inflation rate coming in at 6.1%. The relatively high inflation can be attributed to the high fuel prices experienced through most of the year, coupled with the erratic weather conditions experienced in the second half of the year which led to food commodity prices spiking. The December numbers were 5.7%, a decline from 5.8% recorded in November in line with our expectations of 5.7% - 6.1%, but higher than the December 2020 rate of 5.6%. On a m/m basis, the inflation rates increased by 0.9%, driven by a 1.7% increase in food & non-alcoholic beverages.
Going forward, we expect the inflation rate to remain within the government’s set range of 2.5% - 7.5% with the key risks being drought in the first quarter of the year, further depreciation of the currency and unsustainability of the fuel subsidy program by the National Treasury should the average landed costs of fuel keep rising, which could eventually lead to increase in fuel prices.
Monetary Policy:
During the year the Monetary Policy Committee(MPC) met 6 times and maintained the Central Bank Rate (CBR) at 7.00% and the Cash Reserve Ratio of 4.25% in all meetings, citing that the measures implemented since March 2020 were having the intended effect on the economy and as such, remained appropriate and effective. We expect the MPC to continue holding the rates at the same level as they try to balance between supporting the fragile economic recovery and maintain a stable price environment and at the same time protect the currency.
2021 Key Highlights:
- FY’2021/2022 Budget and Draft 2022 Budget Policy Statement;
- On 10thJune 2021, the National Treasury presented Kenya’s FY’2021/2022 National Budget to the National Assembly highlighting that the total budget estimate for the 2021/2022 fiscal year was Kshs 3.0 tn, a 4.8% increase from the Kshs 2.9 tn final FY’2020/21 budget. The government projects that total revenue will increase by 10.3% to Kshs 2.0 tn, from the Kshs 1.8 tn in FY’2020/2021, the increase largely being projected to come from ordinary revenue, which is to grow by 11.4% to Kshs 1.8 tn in FY’2021/22 from Kshs 1.6 tn in the FY’2020/21 budget. The projected revenues are mainly pegged on Kenya’s economic recovery, broadening the tax base and tax reforms. The expenditure is expected to increase by 4.8% to Kshs 3.0 tn, from Kshs 2.9 tn in the FY’2020/21 budget. For more information, see our Kenya’s FY’2021/2022 Budget Review, and,
- In the month of November, the National Treasury released the Draft 2022 Budget Policy Statement, projecting a 7.7% increase in the target Excise Duty for FY’2021/2022 to Kshs 259.6 bn, from Kshs 241.0 bn as highlighted in the original budget estimates. The increase in the Excise duty revenue collection target follows the publishing of the Legal Notice 217 of 2021, which allowed the Kenya Revenue Authority, (KRA) to adjust the specific rates of excise duty upwards by 5.0% in line with average annual inflation rate for the FY’2020/2021. For more information, see our Cytonn Weekly #46/2021.
- Credit Facilities extended to Kenya;
- In 2021, Kenya received a total of USD 130.0 mn (Kshs 14.0 bn) from the World Bank and USD 984.0 mn (Kshs 109.8 bn) from the IMF to help the country respond to the unprecedented shock of the COVID-19 pandemic as well as reduce Kenya’s debt levels. The funding from the World Bank would also enable Kenya to procure more vaccines through the African Vaccine Acquisition Task Team (Avatt) and the COVID-19 Vaccines Global Access (Covax) facilities in addition to supporting the deployment of the vaccines by boosting the country’s cold-storage capacity. For more information, see our Cytonn Weekly #26/2021, and,
- On 22nd December 2021, the Kenyan authorities and the IMF reached a staff level agreement on the second review of the 38-month Extended Fund Facility (EFF) and Extended Credit Facility (ECF) - funded program. IMF noted that subject to the completion of the review by the IMF Board, Kenya would access approximately USD 264.0 mn (Kshs 29.5 bn). For more information, see our Cytonn Weekly #07/2021, Cytonn Weekly #44/2021, and Cytonn Weekly #50/2021.
- Balance of Payments
The Kenya National Bureau of Statistics released the Q1’2021 Balance of Payments Report highlighting that Kenya’s balance of payments deteriorated in Q1’2021, coming in at a deficit of Kshs 59.4 bn, from a deficit of Kshs 47.4 bn in Q1’2020. The deterioration was due to the 16.6% increase in the Current Account deficit to Kshs 142.0 bn, from Kshs 121.7 bn in Q1’2020 due to merchandised trade deficit and lower inflows from the services sector. The current account deficit (value of goods and services imported exceeds the value of those exported) expanded by 16.6% to Kshs 142.0 bn, from Kshs 121.7 bn in Q1’2020, mainly attributable to widening of the Merchandise Trade Deficit by 26.9% to Kshs 287.3 bn from Kshs 226.4 bn recorded in Q1’2020. For more information, see our Q1’2021 BOP Note.
- Credit Ratings;
The country saw its ratings revised downwards by Standard & Poor’s, a US based ratings agency, to 'B' from 'B+’, while Fitch Rating affirmed Kenya's Long-Term Foreign-Currency Issuer Default Rating (IDR) at 'B+' with a Negative Outlook. Fitch Rating pointed out that the rating reflected a track record of strong growth, relative macroeconomic stability and a favorable government debt structure which was balanced by negatives such as rising public debt levels and high net external indebtedness. On the other hand, the Negative Outlook on the ratings reflected the underlying weaknesses of the public finances and the uncertain pace of planned fiscal consolidation. For more information, see our Cytonn Q1’2021 Market Review. Below is a summary of the credit rating on Kenya so far:
|
Rating Agency |
Previous Rating |
Current Rating |
Current Outlook |
Date Released |
|
S&P Global |
B+ |
B |
Stable |
5th March 2021 |
|
Moody’s |
B1 |
B2 |
Negative |
19th June 2020 |
|
Fitch Ratings |
B+ |
B+ |
Negative |
26th March 2021 |
2021 returns by various Asset Classes
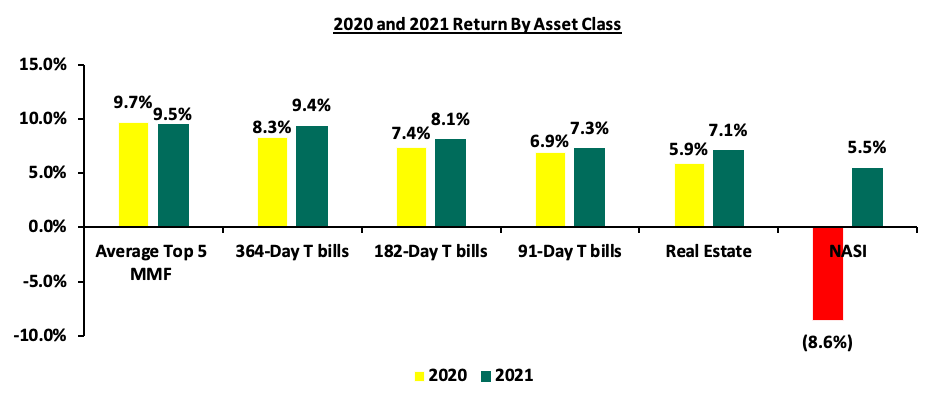
The returns by the various asset classes improved in 2021, with the 364-day, 182-day and 91-day Government papers recording yields of 9.4%, 8.1% and 7.3%, respectively, while Real estate yield and NASI recorded returns of 7.1% and 5.5% respectively. However, average returns of top five money market funds recorded a 0.2% points decline to 9.5% in December 2021, from 9.7% recorded in December 2020. The graph below shows the summary of returns by various asset classes (Average top 5 MMF, Fixed Income, Real Estate and Equities).

The table below shows the macro-economic indicators that we track, indicating our expectations for each variable at the beginning of 2021 versus the experience;
|
Macroeconomic Indicators 2021 Review |
||||
|
Macro-Economic Indicators |
2021 Expectations at Beginning of Year |
Outlook - Beginning of Year |
2021 Experience |
Effect |
|
Government Borrowing |
|
Negative |
|
Negative |
|
Exchange Rate |
|
Neutral |
|
Negative |
|
Interest Rates |
|
Neutral |
|
Neutral |
|
Inflation |
|
Positive |
|
Neutral |
|
GDP |
|
Neutral |
|
Neutral |
|
Investor Sentiment |
|
Positive |
|
Positive |
|
Security |
|
Neutral |
|
Neutral |
Since the beginning of the year, the notable changes we have seen out of the seven metrics that we track, fall under Exchange rates and Inflation. Exchange rates changed from neutral to negative while Inflation rate changed from positive to neutral. In conclusion, macroeconomic fundamentals showed mixed performances during the year but we expect a continued recovery in 2022 supported by the improving business conditions in the country. This will, however, be highly dependent on how well the government can handle the emerging COVID-19 Omicron variant and the upcoming national elections

