Jan 2, 2023
Economic Growth
The Kenyan economy recorded an average growth of 5.6% in the period between January to September 2022, with Q3’2022 GDP coming in at 4.7%, adding to the 5.2% and 6.8% growth recorded in Q2’2022 and Q1’2022, respectively. The average GDP growth of 5.6% marked a decline from the 7.7% average growth recorded in a similar period in 2021. The growth in Q3’2022 was largely driven by the non-agricultural sectors, with accommodation and food, wholesale and retail trade, professional administrative and support, and finance and insurance sectors recording growths of 22.9%, 9.1%, 8.7%, and 5.3%, respectively, in Q3’2022, albeit slower than growth of 127.5%, 6.4%, 13.4%, and 11.8%, respectively recorded in Q3’2021. The growths in these sectors were supported by continued post COVID-19 economy recovery due to lifting of travel restrictions and ease in cross border transactions. However, the sectoral growths remained subdued due to uncertainties of the electioneering period and the adverse macroeconomic conditions in the country. Notably, the agricultural sector recorded a 0.6% contraction in Q3’2022, compared to a corresponding expansion of 0.6% growth in Q3’2021 but an improvement from preceding contractions of 2.1% and 0.7% recorded in Q2’2022 and Q1’2022, respectively. The contraction during the quarters is mainly attributable to unfavorable weather conditions witnessed during the period, as well as increased costs of agricultural inputs such as fertilizer;
In 2022, the Kenyan economy is projected to grow at an average of 5.1%, lower than the 7.5% growth recorded in 2021. The slower growth is mainly attributable to a deteriorated business environment for majority of the year brought about by the uncertainties preceding the August 2022 general elections and elevated inflationary pressures driven by the high global fuel prices and the pre-existing supply chain constraints worsened by the Russia-Ukraine conflict. Notably, the unfavorable weather conditions experienced during the period under review has subdued agricultural production, with the sector being the largest contributor to Kenya’s GDP. The table below shows the projections of Kenya’s 2022 GDP by various organizations:
|
Cytonn Report: 2022 GDP Projections |
||
|
No. |
Organization |
2022 Projections |
|
1 |
International Monetary Fund |
5.3% |
|
2 |
National Treasury |
6.0% |
|
3 |
Cytonn Investments Management PLC |
4.5% |
|
4 |
World Bank |
5.5% |
|
5 |
S&P Global |
4.4% |
|
Average |
5.1% |
|
|
Median of Growth Estimates |
5.3% |
|
Source: Cytonn Research, 2022
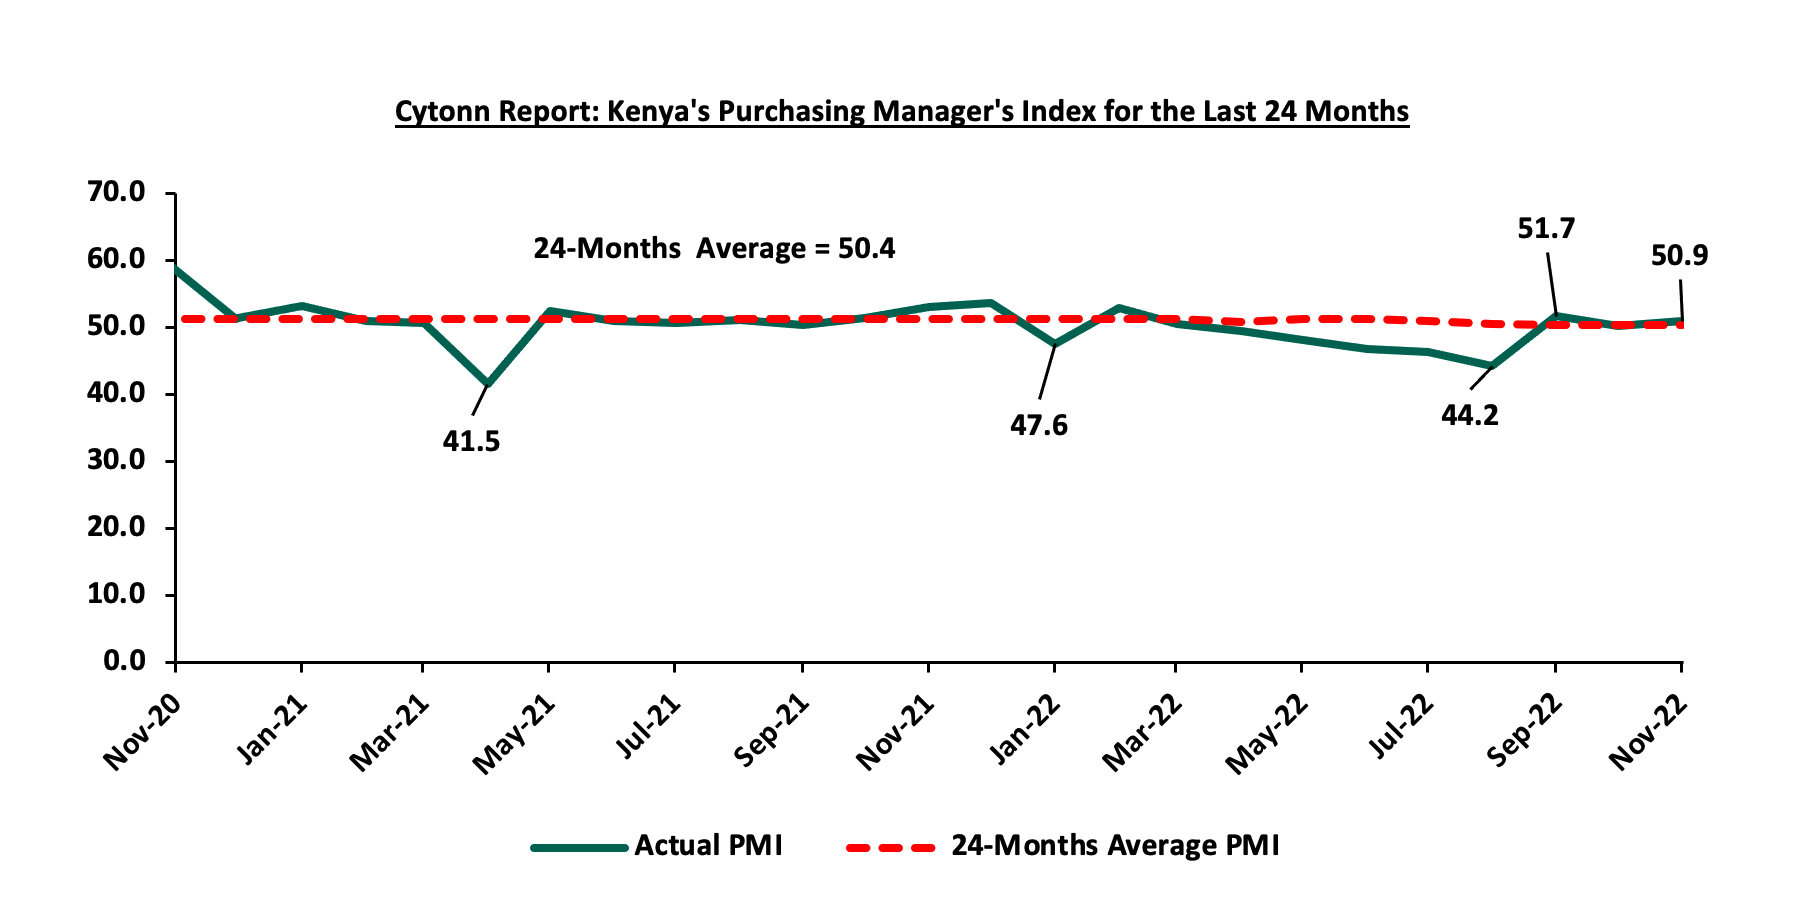
Business conditions in the Kenyan private sector remained subdued during the year, with the average Stanbic Bank Monthly Purchasing Managers’ Index (PMI) for the first eleven months averaging at 49.0, 1.6 points lower than the average of 50.6 recorded during a similar period in 2021 indicating a deterioration of the country’s business environment in 2022 compared to 2021. However, for the month of November 2022, the index improved to 50.9 from 50.2 recorded in October 2022. The chart below shows the trend of Kenya’s Purchasing Managers index for the last 24 months;
Kenyan Shilling
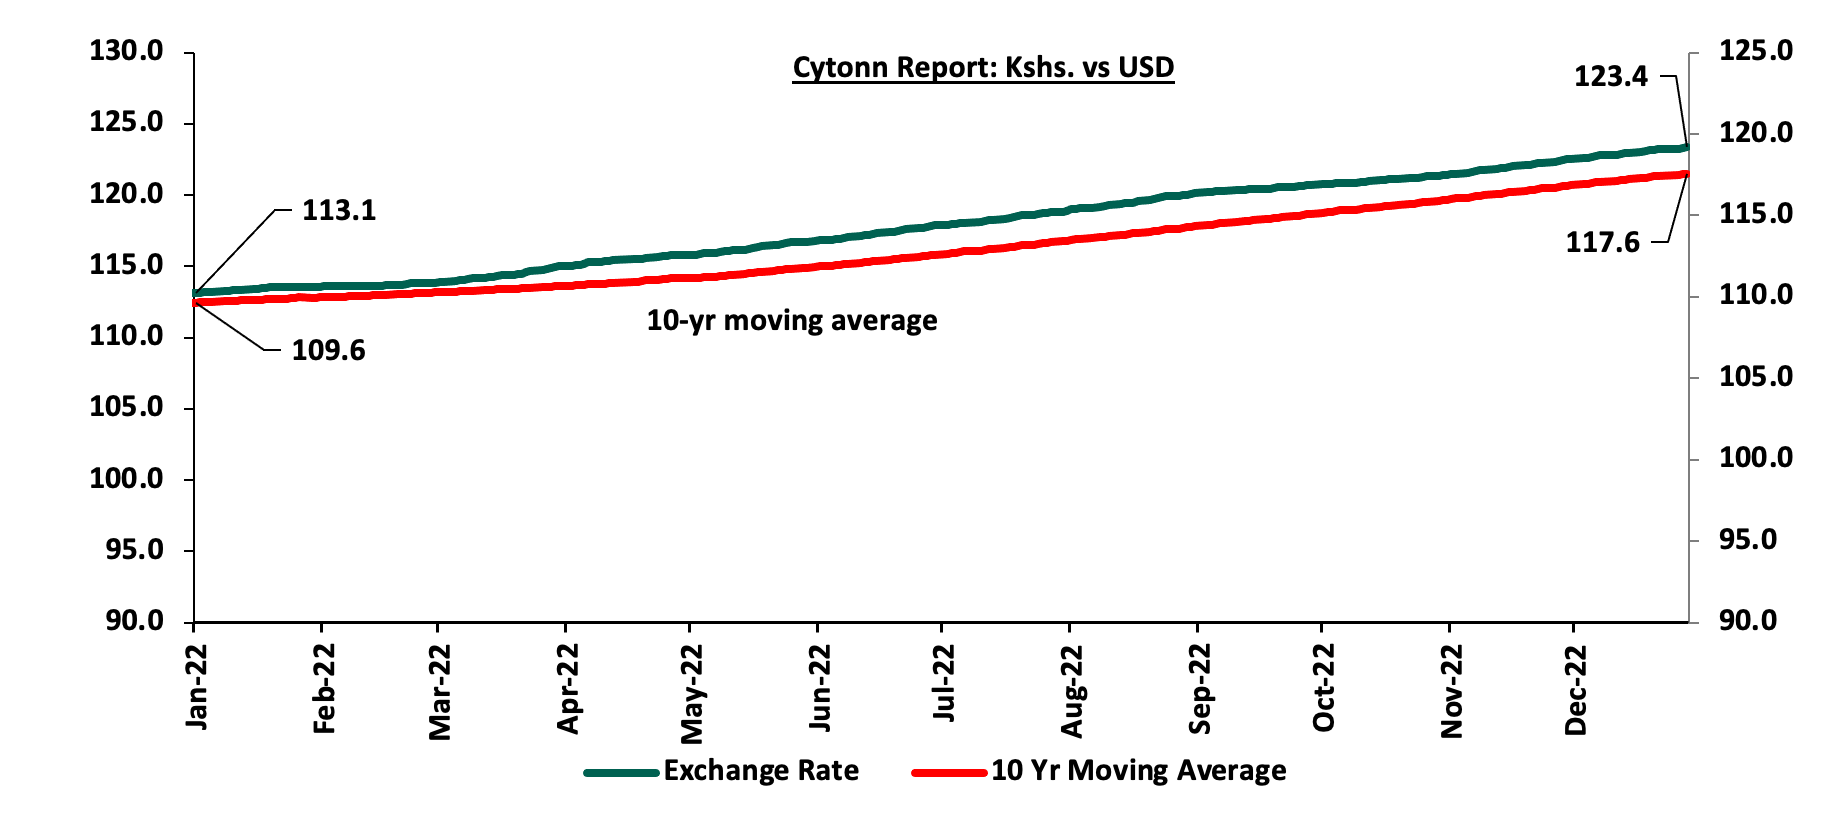
The Kenya Shilling depreciated by 9.0% against the US Dollar to close at Kshs 123.4 in 2022, compared to Kshs 113.1 at the end of 2021, equivalent to a 3.6% depreciation. The chart below highlights the performance of the Kenyan Shilling against the US Dollar in 2022;
The depreciation of the Kenyan shilling in 2022 was driven by;
- High global crude oil prices attributable to the persistent supply chain constraints and high demand with fuel being an integral input in most sectors,
- Increased dollar demand by importers especially in the oil and energy sector, as well as, manufacturers against a low supply of dollar currency leading to shortage of USD in the Kenyan market,
- Existence of an ever-present current account deficit estimated at 5.5% of GDP in the 12 months to October 2022, same to what was recorded in a similar period in 2021. Key to note, the current account deficit was driven by a 15.8% deterioration in trade imbalance to Kshs 373.1 bn, from Kshs 322.0 bn in Q3’2021. This is despite merchandise exports increasing by a faster 29.7% to Kshs 228.2 bn in Q3’2022 from 175.9 bn recorded in Q3’2021 relative to a 20.8% increase in merchandise imports to Kshs 601.2 bn in Q3’2022 from Kshs 498.0 bn recorded in a similar period in 2021,
- The need for Government debt servicing which continues to put pressure on forex reserves given that 69.3% of Kenya’s External debt was US Dollar denominated as of October 2022, and,
- A continued hike in the USA Fed interest rates in 2022 to a range of 4.25%-4.50% in December 2022 to curb inflation has strengthened the dollar against other currencies resulting in capital outflows from emerging and developing markets such as Kenya.
The shilling received some support driven by:
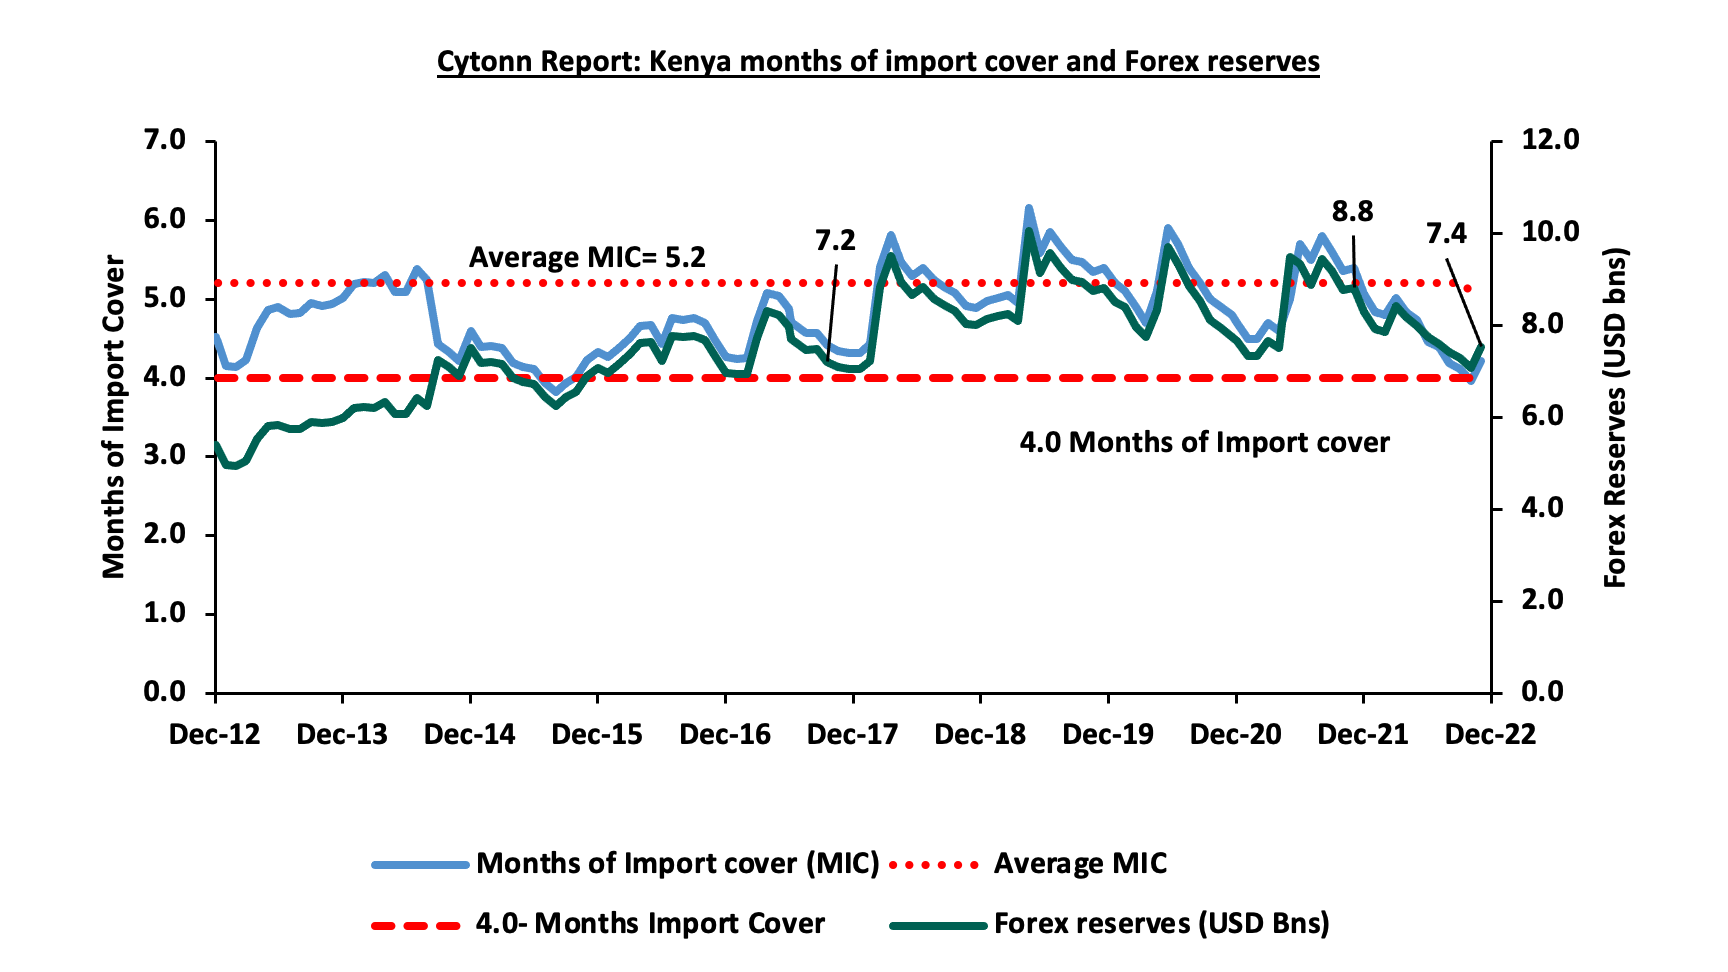
- Sufficient Forex reserves closing the year at USD 7.4 bn (equivalent to 4.2 months of import cover), which is slightly above the statutory requirement of maintaining at least 4.0-months of import cover. However, despite the Forex reserves being adequate, they have dropped by 15.1% YTD from USD 8.8 bn recorded in January 2022. The following is a graph showing Kenya months of import cover and forex reserves for the last 10 years;

- Improved diaspora remittances standing at a cumulative USD 4.0 bn as at November 2022, representing a 9.7% y/y increase from USD 3.7 bn recorded over the same period in 2021,
- The government received USD 750.0 mn World Bank loan facility in March 2022, as well, USD 235.6 mn and USD 447.4 mn funding from the International Monetary Fund (IMF) disbursed under the fourth and fifth tranches of the 38-month Extended Fund Facility (EFF) and Extended Credit Facility (ECF) in July and December 2022. Additionally, through the Special Drawing Rights, IMF disbursed an additional USD 14.6 mn (Kshs 26.6 bn) as buffer from the drought effects, which supported the reserves despite the continued depreciation of the Kenyan currency. The latter loan disbursement is expected to further support the Kenyan Shilling in 2023 evidenced by forex reserves increasing to USD 7.5 bn in December 2022, from USD 7.0 bn recorded in November 2022, and,
- CBK’s supportive activities in the money market, such as repurchase agreements and selling of dollars.
Against our expectations, the Kenyan shilling closed the year at Kshs 123.4. We expected the Kenyan shilling to remain within a range of Kshs 115.1 and Kshs 119.1 against the USD in the medium term based on the Purchasing Power Parity (PPP) and Interest Rate Parity (IRP) approach respectively, with a bias of a 4.7% depreciation. Read on our outlook on Performance of Kenya Currency.
Inflation
The inflation rate for the year 2022 averaged at 7.6%, 1.5% points higher than average inflation rate of 6.1% recorded in 2021. Notably on a m/m basis, Kenya’s inflation rate declined by 0.4% points to 9.1% in December 2022, from 9.5% recorded in November 2022, but remained above the government’s target range of 2.5% - 7.5%. The relatively high inflation can be attributed to increase in prices of major commodity indices with food and non-alcoholic index and transport index, registering the highest year-on-year (y/y) increases of 13.8% and 13.0%, respectively. This is mainly attributable to the high fuel prices experienced in 2022 as a result of persistent supply chain constraints, as well as, the erratic weather conditions experienced in the first half of the year and increased costs of agricultural inputs which affected agricultural production.
Going forward, we expect the inflation rate to remain elevated in the short-term and above the government’s set range of 2.5% - 7.5% driven by the high global fuel prices coupled with the expected complete removal of the fuel subsidy program at the end of the year which could have spillover effects on production given that fuel is an integral input in production of core commodities. Food prices will also remain elevated in the short run due to erratic weather patterns experienced during the year that adversely affected agricultural production. However, with the several parts of the country have experienced rains in December, coupled with the fertilizer subsidy program introduced by the current administration to reduce agricultural input costs, we expect that food inflation will ease in the medium term on the back of improved productivity.
Monetary Policy:
During the year the Monetary Policy Committee (MPC) met 6 times where they maintained the Central Bank Rate (CBR) at 7.00% and the Cash Reserve Ratio of 4.25% in the first two of the meetings of January and March 2022. However, the MPC raised the CBR rate by 50.0 and 75.0 basis points (bps) to 7.50% and 8.25% in May 2022 and September 2022, respectively. Further, the MPC hiked the CBR by an additional 50.0 bps to 8.75% in latest meeting in November 2022 in a bid to anchor inflation which is currently above the government’s target range of 2.5% - 7.5%. We expect the MPC to continue raising the CBR rates in a bid to stabilize inflation within the government’s target range and also anchor the Kenyan shilling that has suffered a 9.0% YTD depreciation against the US Dollar.
2022 Key Highlights:
- FY’2022/2023 Budget Policy Statement;
On 7thApril 2022, the National Treasury presented Kenya’s FY’2022/2023 National Budget to the National Assembly highlighting that the total budget estimate for the 2022/2023 fiscal year was Kshs 3.3 tn, a 10.3% increase from the Kshs 3.0 tn final FY’2020/21 budget. The government projects that total revenue will increase by 20.3% to Kshs 2.4 tn, from the Kshs 2.0 tn in FY’2022/2023, the increase largely being projected to come from ordinary revenue, which is to grow by 25.4% to Kshs 2.1 tn in FY’2022/23 from Kshs 1.8 tn in the FY’2021/22 budget. The projected revenues are mainly pegged on Kenya’s economic recovery from COVID-19 effects, broadening the tax base and tax reforms, as well as reduction of the fiscal deficit to 6.2% of the GDP. The expenditure is expected to increase by 10.3% to Kshs 3.3 tn in FY’2022/23, from Kshs 3.0 tn in the FY’2021/22 budget. For more information, see our Kenya’s FY’2022/2023 Budget Review.
- Credit Facilities extended to Kenya;
- In 2022, Kenya received a total of USD 750 mn (Kshs 80.9 bn) under the Development Policy Operation (DPO) from the World Bank and a total of USD 683.0 (Kshs 83.8 bn) from the IMF under the Extended Credit Facility arrangement (EFF/ECF) for budgetary support by providing low-cost budget financing to support key policies and institutional reforms. Additionally, the funding from the World Bank would also boost Kenya’s post-COVID-19 recovery. For more information, see our Cytonn Weekly #11/2022, and,
- On 18th July and 20th December 2022, the Kenyan authorities and the IMF reached a staff level agreement on the fourth and fifth tranches of the 38-month Extended Fund Facility (EFF) and Extended Credit Facility (ECF) - funded program. Per the agreements, Kenya would access USD 236.5 (Kshs 28.7 bn) and USD 447.4 mn (Kshs 55.1 bn) as the fourth and fifth tranches respectively to support the country’s economic growth and achieve the medium term debt strategy objectives. For more information, see our Cytonn Monthly April 2022, Cytonn Weekly #29/2022, Cytonn Weekly #45/2022 and Cytonn Weekly #51/2022.
- FY’2021/2022 KRA Revenue Performance;
On 7th July 2022, The Kenya Revenue Authority (KRA) released the annual revenue performance for the FY’2021/2022, highlighting that the total revenue collected amounted to Kshs 2.03 tn against the revised target of Kshs 1.98 tn, translating to a 2.8% over performance. Notably revenue collection grew by 21.7% to Kshs 2.0 tn in FY’2021/22, from Kshs 1.7 tn in FY’2020/21 due to the enhanced tax compliance efforts and the implementation of new tax measures. For more information, see our Cytonn Weekly #27/2022.
- Balance of Payments
The Kenya National Bureau of Statistics released the Q3’2022 Balance of Payments Report highlighting that Kenya’s balance of payments deteriorated by 283.9% in Q3’2022, coming in at a deficit of Kshs 112.7 bn, from a deficit of Kshs 29.3 bn in Q3’2021. The deterioration was brought by a 5.5% widening of the Current Account deficit to Kshs 193.4 bn, from Kshs 183.4 bn in Q3’2021, driven by a 15.8% deterioration in trade imbalance to Kshs 373.1 bn, from Kshs 322.0 bn in Q3’2021. This is despite merchandise exports increasing by a faster 29.7% to Kshs 228.2 bn in Q3’2022 from 175.9 bn recorded in Q3’2021 relative to a 20.8% increase in merchandise imports to Kshs 601.2 bn in Q3’2022 from Kshs 498.0 bn recorded in a similar period in 2021,
- Credit Ratings;
In 2022, Fitch Ratings, a global rating agency, revised Kenya's Long-Term Foreign-Currency Issuer Default Rating (IDR) downwards to ‘B’ from ‘B+’, but with a stable outlook. The rating is similar to Standard & Poor’s affirmation of the country’s long and short-term foreign and local currency sovereign credit ratings at 'B' with a Stable Outlook in August 2022. Fitch Rating pointed out that the downgrade was attributable to the widened current account deficit coming in at 5.5% of the GDP in October 2022 against low currency reserves at USD 7.4 bn having registered a 19.3% YTD decline from the USD 8.8 bn recorded in January 2022, coupled with a high debt to GDP ratio at 385.0% of the GDP surpassing the recommended 282.0% ratio mark. On the other hand, the Stable Outlook on the ratings reflected the gradual fiscal consolidation and the steady economic growth. For more information, see our Cytonn Weekly #50/2022. Below is a summary of the credit rating on Kenya by various rating agencies;
|
Cytonn Report: Kenya Credit Rating Agencies Ratings |
||||
|
Rating Agency |
Previous Rating |
Current Rating |
Current Outlook |
Date Released |
|
Fitch Ratings |
B+ |
B |
Stable |
14th December 2022 |
|
S&P Global |
B |
B |
Stable |
30th August 2022 |
Source: Fitch Ratings, S&P Global
2022 returns by various Asset Classes
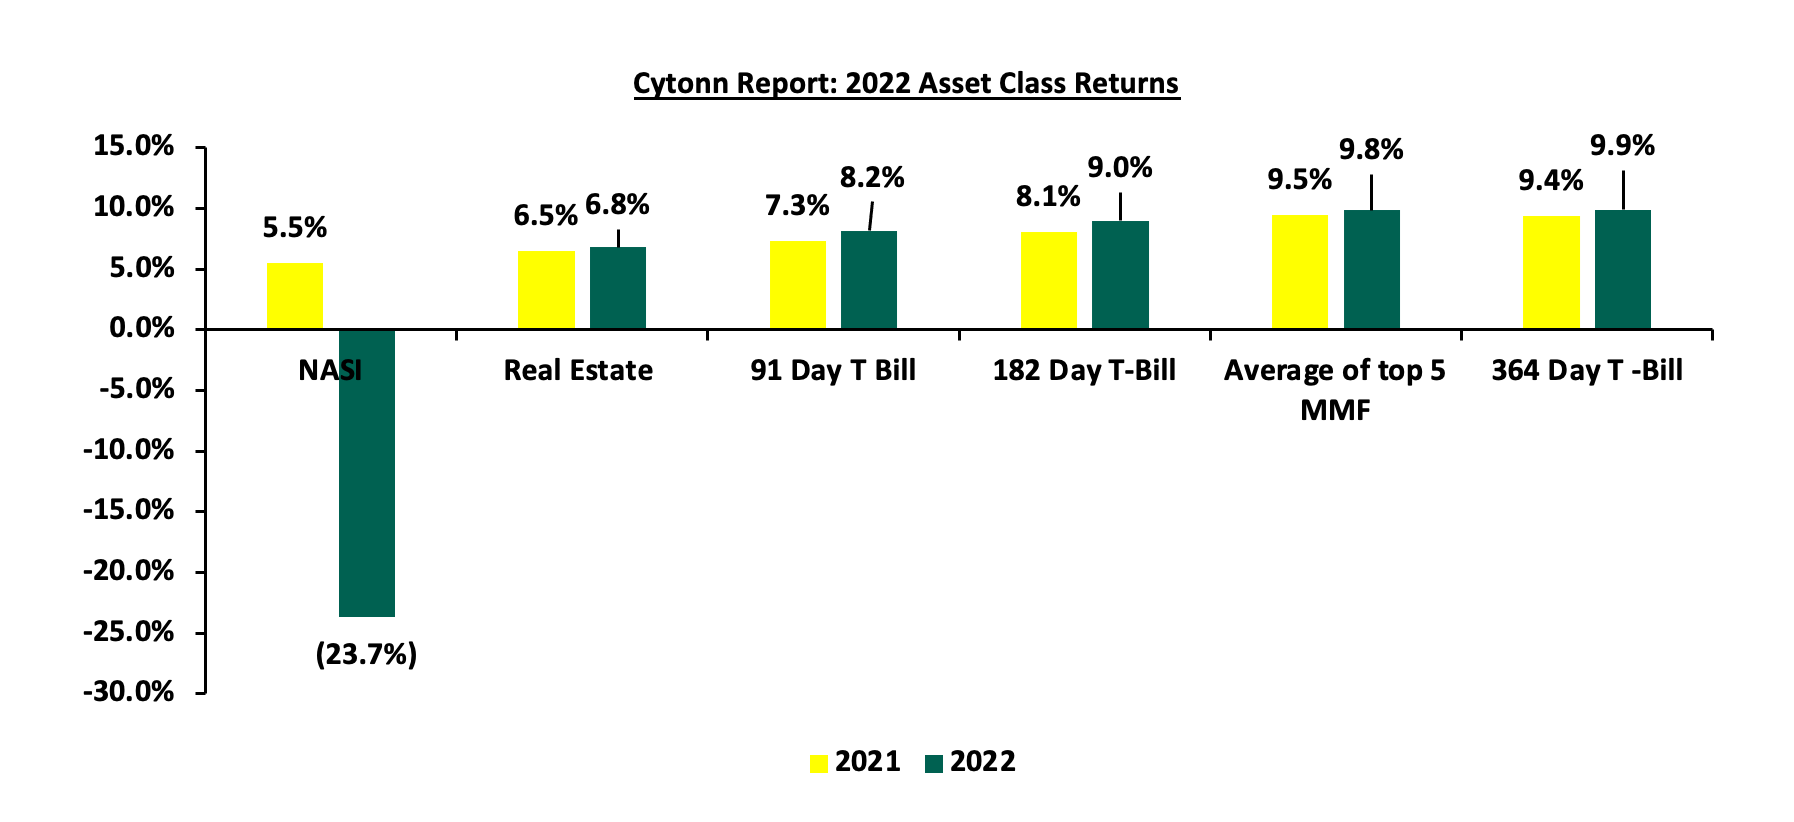
The returns by the various asset classes improved in 2022, with the average of the top five money market funds (MMFs), Real Estate yield and government papers being on upward trajectories. The average of top 5 MMF recorded a yield of 9.8%, 0.3% points increase from 9.5% recorded in 2021 as the average Real Estate yield also increased by 0.3% points to 6.8% in 2022, from 6.5% recorded in 2021. Similarly, the 364-day, 182-day and 91-day Government papers recorded average yields of 9.9%, 9.0% and 8.2%, respectively. However, for the equities class, NASI registered a 23.7% loss in 2022 from a 5.5% gain recorded in 2021. The graph below shows the summary of returns by various asset classes (Average top 5 MMF, Fixed Income, Real Estate and Equities).
The table below shows the macro-economic indicators that we track, indicating our expectations for each variable at the beginning of 2022 versus the experience;
|
Cytonn Report: Macro-Economic & Business Environment Outlook |
||||
|
Macro-Economic Indicators |
2022 Outlook |
Effect |
2022 Experience |
Effect |
|
Government Borrowing |
|
Negative |
|
Negative |
|
Exchange Rate |
|
Neutral |
|
Negative |
|
Interest Rates |
|
Neutral |
|
Negative |
|
Inflation |
|
Neutral |
|
Negative |
|
GDP |
|
Neutral |
|
Neutral |
|
Investor Sentiment |
|
Negative |
|
Negative |
|
Security |
|
Neutral |
|
Positive |
Since the beginning of the year, the notable changes we have seen out of the seven metrics that we track, fall under four metrics, namely; Interest rates, Inflation, Exchange rates, and Security. Key to note, Security changed from neutral to positive while Interest rates, Inflation, and Exchange rate changed from neutral to negative. In conclusion, macroeconomic fundamentals showed mixed performance during the year with most metrics on downward trajectories. We expect a slight recovery in 2023 supported by the improving business conditions in the country evidenced by the November PMI coming in at 50.9, an improvement from 50.2 in October. However, improvement of the business conditions in the country, are largely pegged on how fast global fuel prices stabilize, decline in inflation rates and stabilization of the Kenyan currency. This is because, Kenya, as a net fuel importer suffers from imported inflation levels.

