Cytonn Q1’2018 Markets Review
By Cytonn Investments Team, Apr 1, 2018
Executive Summary
Global Markets Review
The Global economy is expected to remain strong with the IMF projecting 2018 growth to come in at 3.9% up from the 3.7% in 2017 supported by continued growth in the US, Africa and India. The key risk to global growth remains the rising trade wars that have started between the US and China and which could easily spread to other economies if not managed. In March 2018, the US Fed increased the Federal Funds Rate to a range of 1.50% - 1.75% from 1.25% to 1.50% due to the strong economic growth projection despite the US inflation rate being below the 2.0% target, at 1.9%;
Sub-Saharan Africa Region Review
During the quarter, the International Monetary Fund (IMF) projected Sub-Saharan Africa (SSA) GDP to grow by 3.3% in 2018, and 3.5% in 2019, up from an expected growth of 2.7% in 2017. Most of the regional currencies appreciated against the dollar during the quarter on account of expected improved macroeconomic conditions in the region and the weakening of the USD in the global markets. Yields on the various sovereign bonds in the region have been declining, reflecting improving investor sentiment. The various regional stock markets showed bullish trends with the Ghana, Malawi and Kenya stock exchanges gaining 33.8%, 17.1% and 14.1% on a YTD basis;
Kenya Macroeconomic Review
Kenya’s economy is projected to grow by 5.5% on average in 2018, according to GDP projections from various research houses, global agencies, and government organizations that we tracked during the quarter. Inflation declined to 4.2% in March 2018 from 4.5% in December 2017, in line with our expectations. The Monetary Policy Committee (MPC) met during the quarter and reduced the Central Bank Rate (CBR) by 50 basis point to 9.5% from 10.0% in a bid to support economic activity in the country, and given the low inflation;
Fixed Income
During the first quarter of 2018, T-bills were oversubscribed, with the overall subscription rate coming in at 115.4% up from 72.5% in Q4’2017. Overall subscription rates for the 91, 182, and 364-day papers in came in at 94.5%, 109.2% and 130.0% from 84.9%, 61.5% and 78.6% in Q4`2017, respectively. Yields on the 91-day and 364-day T-bills declined by 10 bps each to 8.0% and 11.1% at the end March 2018, from 8.1% and 11.2% in December 2017, respectively. The yield on the 182-day paper declined by 20 bps to end the quarter at 10.4% from 10.6% at the end of the previous quarter;
Equities
During the quarter, the Kenyan equities market was on an upward trend, with NASI, NSE 20 and NSE 25 rising by 11.7%, 3.6%, and 9.6%, respectively. All listed Kenyan banks released their FY’2017 results, registering an average decline of 0.8% in their core EPS growth compared to a 4.4% growth in FY’2016;
Private Equity
During the first quarter, there was heightened private equity activity in the sectors that we cover, with transactions being witnessed in the financial services, hospitality, real estate and education sectors. Some of the key deals undertaken in Q1’2018 include Centum’s sale of its 25% stake in in regional micro-financier Platinum Credit, and the sale of its 73.4% stake in asset manager GenAfrica to New York-based equity fund Kuramo Capital. During the week, Centum was involved in yet another deal after it injected Kshs 1.1 bn into its banking subsidiary Sidian Bank through the ongoing rights issue;
Real Estate
The real estate sector continues to show signs of recovery following the end of the extended electioneering period. In Q1’2018, the sector experienced increased activity in the residential, retail, hospitality and commercial themes. However, the sector still faces challenges such as: (i) oversupply in some themes such as commercial office that had an oversupply of 4.7mn SQFT in 2017 and is expected to increase by 12.8% to 5.2mn SQFT in 2018, and (ii) low access to finance by real estate developers following the enactment of the rate caps.
- Our Senior Manager, Regional Markets, Johnson Denge, discussed financing affordable housing as part of the Governments Big Four Agenda. Watch Johnson on KBC here and on AM Live on NTV here
- Our Investments Analyst, Caleb Mugendi, discussed the FY’2017 results for Housing Finance, National Bank and Stanlib Fahari I-reit. Watch Caleb on CNBC here
- On Tuesday 29th March 2018, Cytonn Real Estate (CRE) hosted Project Management students from Mt Kenya University at one of their development projects in Ruaka, The Alma, a Kshs 4.0 bn development project that caters to the housing needs in Kiambu County. Read Event Note here
- We continue to see very strong interest in our weekly Private Wealth Management Training (largely covering financial planning and structured products). The training is at no cost and is open only to pre-screened participants. We also continue to see institutions and investment groups interested in the trainings for their teams. The Wealth Management Trainings are run by the Cytonn Foundation under its financial literacy pillar. If interested in our Private Wealth Management Training for your employees or investment group, please get in touch with us through wmt@cytonn.com or book through this link Wealth Management Training. To view the Wealth Management Training topics, click here
- We continue to hold weekly workshops and site visits on how to build wealth through real estate investments. The weekly workshops and site visits target both investors looking to invest in real estate directly and those interested in high yield investment products to familiarize themselves with how we support our high yields. Watch progress videos and pictures of The Alma, Amara Ridge, The Ridge, and Taraji Heights. Key to note is that our cost of capital is priced off the loan markets, where all-in pricing ranges from 16.0% to 20.0%, and our yield on real estate developments ranges from 23.0% to 25.0%, hence our top-line gross spread is about 6.0%. If interested in attending the site visits, kindly register here
- For recent news about the company, see our news section here
- We have 10 investment-ready projects, offering attractive development and buyer targeted returns of around 23.0% to 25.0% p.a. See further details here: Summary of Investment-Ready Projects
- We continue to beef up the team with ongoing hires for: Risk & Compliance Associate, Financial Advisors and Unit Managers, among others. Visit the Careers section at Cytonn’s Website to apply
Introduction
The global economy has been on a recovery path, and according to the International Monetary Fund (IMF), the global economy is expected to have grown by 3.7% in 2017, higher than the 3.6% initially projected. This resurgence in the global economy comes on the backdrop of growth upsides in Europe and Asia, driven by private consumption and investment. The IMF is projecting a 3.9% global economic growth for 2018 and 2019 due to the increased global growth momentum in some countries like the US and the expected positive impact of the revised US tax policy on the reduction of corporate tax.
Below is a table showing the World GDP growth rates projections by IMF.
|
World GDP Growth Rates |
|||
|
Region |
2017e |
2018f |
|
|
1. |
India |
6.7% |
7.4% |
|
2. |
China |
6.8% |
6.6% |
|
3. |
Middle East, North Africa |
2.5% |
3.6% |
|
4. |
Sub-Saharan Africa |
2.7% |
3.3% |
|
5. |
United States |
2.3% |
2.7% |
|
6. |
Euro Area |
2.4% |
2.2% |
|
7. |
Brazil |
1.1% |
1.9% |
|
8. |
United Kingdom |
1.7% |
1.5% |
|
9. |
Japan |
1.8% |
1.2% |
|
10. |
South Africa (SA) |
0.9% |
0.9% |
|
|
Global Growth Rate |
3.7% |
3.9% |
Oil prices have been on the rise supported by the extension of the OPEC agreement limiting oil supplies and the geopolitical tensions in the Middle East. Brent prices rose to USD 69.3 per barrel at the end of March, and have increased by 28.1% YTD from USD 54.1 per barrel.
United States:
The US economy grew by 2.3% in 2017 and is expected to grow by 2.7% and 2.4% in 2018 and 2019, respectively, according to the Fed. In March, the Fed increased the Federal Funds Rate to a range of 1.50% - 1.75% from 1.25% to 1.50% sighting (i) expected increase in inflation despite being below the 2% target now, (ii) the low unemployment rate currently at 4.1% and is expected to decline to 3.8% in 2018 and further to 3.6% in 2019, which is below the Non Accelerating Inflation Rate of Unemployment (NAIRU) of 4.6%, and (iii) strong economic growth rate.
The stock market had been on an upward trend in January before slowing down in February and March with the S&P 500 falling by 2.4% during the first quarter of 2018. The decline was due to recent trade tensions between the US and China over the aluminum and steel tariffs imposed by the Trump Administration and the dispute over the US trade deficit with China. US valuations are still higher than their long-term historical average with the Shiller Cyclically Adjusted P/E (CAPE) multiple at 32.0x, which is higher than the historical mean of 16.7x. US 10-year Treasury yields remained stable at 2.8% during the quarter.
The US Dollar also lost ground as the Dollar Index declined by 2.2% as the Euro and the Sterling Pound continue to strengthen against the USD with the continued recovery of the Eurozone.
Eurozone:
According to the European Central Bank (ECB), the Eurozone is expected to grow at rate of 2.3%, slightly lower than the 2.5% growth 2017 which was the fastest growth witnessed over the last decade. The continued growth can be attributed to a pick-up in external demand combined with a healthy domestic economy. The labor market stagnated, with the unemployment rate remaining at 8.6% in January 2018. The ECB maintained the base lending rate at 0.0%, and the rates on the marginal lending facility and deposit facility at 0.25% and (0.40%), respectively. The current negative deposit rates are expected to persist in 2018 and influence growth positively by spurring consumption. However, inflation decreased to 1.1% in February 2018, from 1.3% in January 2018, against a target inflation rate of 2.0%. This development has raised concerns over the effectiveness of the quantitative easing (QE) program in flowing into the real economy and spurring a pickup in prices. The QE program of the Eurozone is set to end in September 2018, following the reduction in asset purchases to EUR 30.0 bn from EUR 60.0 bn per month in January 2018.
The Stoxx 600 index fell by 4.1% for the first quarter of 2018 driven primarily by (i) the political risks that have faced Europe, some of them being the steel and aluminum tariffs proposed by the Trump Administration, with the Eurozone however still exempt until May 2018, and (ii) the deliberations over Brexit between the European Union (EU) and the UK. Going forward, the EU market outlook is stable, driven by strong macro-economic fundamentals, loose monetary policy, robust corporate earnings growth and sustained growth in the manufacturing sector with the Eurozone’s Flash Purchasing Managers Index (PMI) coming in at 58.6 in February 2018, which indicates expansion as anything above 50 is positive.
China:
The Chinese economy grew by 6.9% in FY’2017, driven by (i) a pick-up in the pace of industrial production, (ii) an increase in private consumption, and (iii) increased investment in infrastructure. The IMF expects the economic growth to slow down to 6.4% in 2018, from 6.9% in 2017, due to reforms expected to be carried out during the year, with the aim of dealing with the country’s huge debt build-up, which is currently at 256% of GDP and the effects of the government’s program to restructure the economy. The emergent issues of concern are the growing political risks occasioned by the recent tariffs put in place by the Trump Administration on steel and aluminum imports, of which China is among the major suppliers, and the Trump’s concerns over the unbalanced trade between China and the US that has resulted in a USD 330.0 bn trade surplus on the side of China.
The Shanghai Composite declined by 5.6% in Q1’2018, driven by the developing trade tensions between China and the US with regard to the aluminum and steel tariffs that led to a decline in manufacturing companies and metal exporters listed on the exchange.
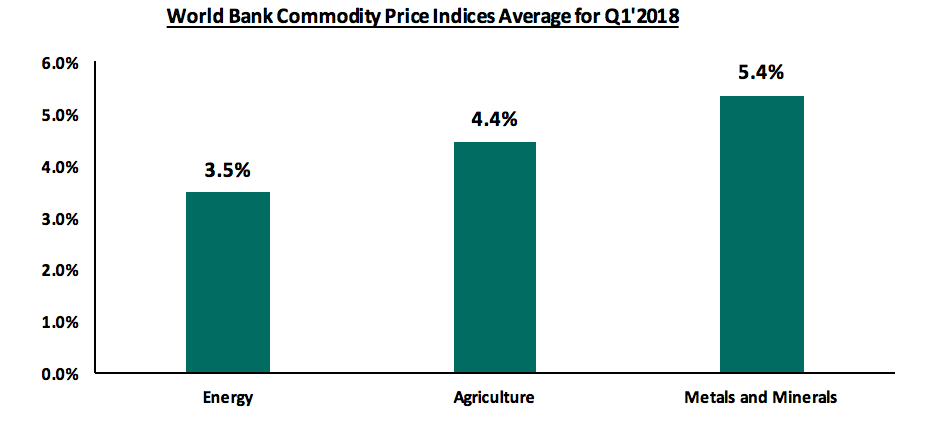
Commodity Prices:
Global commodity prices were generally on a recovery trend in Q1’2018. The energy and agriculture segments gained 3.5% and 4.4%, respectively, during the quarter and the metals and minerals experienced a gain of 5.4%, according to the World Bank Commodity Prices Index. The gains in energy were majorly driven by the recovery in oil prices, owing to disruptions in the production of oil in some oil producing areas due to conflict and the extension of the OPEC agreement to cut oil supply. Brent prices rose to USD 69.3 per barrel at the end of March, and have increased by 28.1% YTD from USD 54.1 per barrel. Below is a chart showing the performance of select commodity prices average for quarter one 2018.
During Q1’2018, the International Monetary Fund (IMF) released the World Economic Outlook Update for January 2018, projecting Sub-Saharan Africa (SSA) GDP to grow by 3.3% in 2018, and 3.5% in 2019, from an expected 2.7% in 2017. Improved growth in 2018 is expected to be driven by (i) continually increasing infrastructure expenditure by various regional governments, (ii) strengthening of the commodities market and a price rally of global crude prices that is expected to boost growth in major oil producing countries across SSA, including some of the largest economies in the region such as Nigeria and Angola, and (iii) an improving macroeconomic and political environment. The largest economy in SSA, Nigeria, is expected to experience improved GDP growth in 2018 with the IMF revising this upwards by 20 bps to 2.1% from 1.9% previously supported by continued improving of global oil prices and the increased production in the agriculture sector. However, GDP in South Africa for 2018 was revised downwards to 0.9% from 1.1% previously mainly due to political uncertainties and continued corruption allegations against government officials, which has dented investor sentiment.
More than 40 African countries signed the African Continental Free Trade Area (AfCFTA) Agreement during the quarter, aimed at encouraging regional trade by reducing the existing trade barriers such as import duties and non-tariff barriers. Among the most notable countries to refuse signing the agreement was Nigeria, citing perceived threats to their locally manufactured goods and possible dumping of finished goods in the Nigerian market, and requested for more time to review the agreement and report back to the Union with a decision to sign or not. The agreement, if ratified by at least 22 individual governments that signed the accords, will lead to increased trade amongst African countries, which currently stands at approx. 16.0% of total trade in the continent, promote the manufacturing sector in Africa and uphold the support of “Made in Africa” goods by Africans.
Currency Performance
Regional currencies generally appreciated during the quarter driven by an improved macroeconomic environment as most economies experienced; (i) recovery from economic shocks occasioned by political uncertainty, (ii) improved weather conditions and, (iii) commodity exports fetching better prices in the global commodities markets. The stability in currencies against the USD was further supported by the general weakening of the dollar in the global markets as indicated by the dollar index, which has shed 2.2% YTD. The table below shows the performance of the various currencies:
|
Select Sub-Saharan Regional Currency Performance vs USD |
|||||
|
Currency |
Mar-17 |
Dec-17 |
Mar-18 |
Last 12 months Change (%) |
YTD Change (%) |
|
South African Rand |
13.4 |
12.4 |
11.9 |
12.9% |
4.2% |
|
Botswana Pula |
10.4 |
9.8 |
9.5 |
9.7% |
3.7% |
|
Zambian Kwacha |
9,665.0 |
9,976.0 |
9,688.0 |
(0.2%) |
3.0% |
|
Ghanaian Cedi |
4.3 |
4.5 |
4.4 |
(2.6%) |
2.5% |
|
Kenyan Shilling |
103.0 |
103.2 |
101.1 |
1.8% |
2.0% |
|
Nigerian Naira |
314.3 |
360.0 |
360.0 |
(12.7%) |
(0.0%) |
|
Malawian Kwacha |
725.2 |
725.5 |
725.7 |
(0.1%) |
(0.0%) |
|
Mauritius Rupee |
35.8 |
33.6 |
33.6 |
6.5% |
(0.2%) |
|
Tanzania Shilling |
2,230.9 |
2,234.6 |
2,257.2 |
(1.2%) |
(1.0%) |
|
Ugandan Shilling |
3,615.4 |
3,643.3 |
3,691.2 |
(2.1%) |
(1.3%) |
African Eurobonds
Yields on African Eurobonds have continued to decline, highlighting the improved investor sentiment regarding the future economic growth prospects of African countries. During the quarter, there were two Eurobond issues as follows:
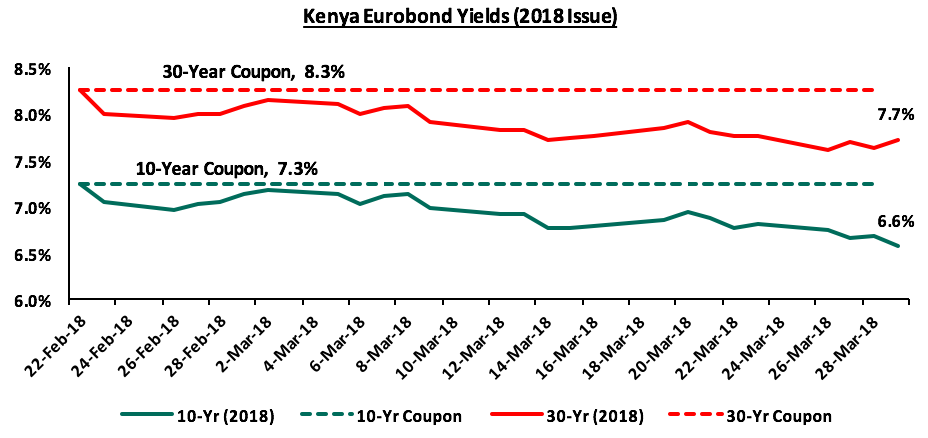
- Kenya: On 23rd February 2018, Kenya issued its second set of Eurobonds, a 10-year, and 30-year Eurobonds at yields of 7.3% and 8.3%. The issue was 7.0x subscribed with bids received at USD 14.0 bn as compared to the USD 2.0 bn target, and
- Senegal: Senegal issued two Eurobonds, a 9-year and 29-year, at yields of 4.8% and 6.8%: 2.5% points and 1.5% points lower than Kenya’s February 2018 issue with nearly similar tenures, respectively. We believe that Senegal managed to issue its Eurobonds at lower yields than similar tenure issues in the continent as (a) recent offshore oil & gas discoveries has enabled the country to bring more investors on board, (b) the country enjoys strong political stability with no sign of any upheaval in the future as well, unlike other issuer countries like Kenya, Nigeria, Egypt and South Africa, and (c) Senegal’s 2017 GDP growth is estimated at 6.8% and the economy is projected to grow by 7.0% in 2018, one of the fastest growing economies in SSA. The issue was 4.5x subscribed with bids received worth USD 10.0 bn, against a target of USD 2.2 bn.
Below is a graph showing the Eurobond secondary market performance of select 10-year Eurobonds issued by the respective countries:
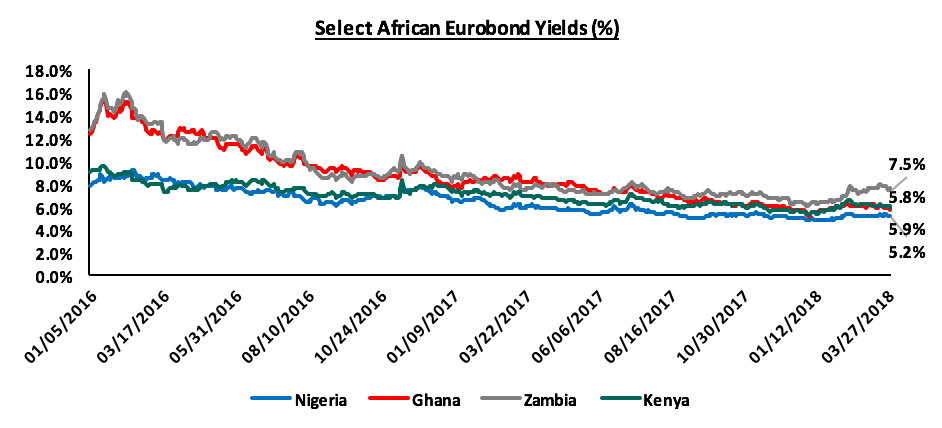
Source: Bloomberg
Equities Market Performance
Most SSA stock markets recorded positive returns during the quarter. This can be attributed to (i) prospects of improving economic performance in 2018, and (ii) renewed investor confidence and sentiment in the markets, with investors opting to take advantage of attractively priced counters in the respective markets. Below is a summary of various stock market performances:
|
Select Sub-Saharan Regional Equities Performance (dollarized) |
|||||
|
Stock Exchange |
17-Mar |
17-Dec |
18-Mar |
LTM |
YTD Change (%) |
|
Ghanaian |
432.5 |
569.7 |
762.2 |
76.2% |
33.8% |
|
Malawi |
20.1 |
29.8 |
34.9 |
73.4% |
17.1% |
|
Kenyan |
1.3 |
1.7 |
1.9 |
49.5% |
14.1% |
|
Nigerian |
83.4 |
106.2 |
115.3 |
38.3% |
8.5% |
|
Ugandan |
0.4 |
0.6 |
0.6 |
38.5% |
8.0% |
|
Zambian |
457.5 |
532.1 |
572.6 |
25.2% |
7.6% |
|
Mauritius |
54.9 |
65.1 |
69.1 |
25.8% |
6.1% |
|
BRVM |
0.5 |
0.4 |
0.4 |
(3.2%) |
0.6% |
|
Tanzania |
1.0 |
1.1 |
1.1 |
3.3% |
(0.4%) |
|
South Africa |
3,883.7 |
4,802.6 |
4,690.5 |
20.8% |
(2.3%) |
*please note these indices are dollarized and may differ from the equities section which is in Kshs
We are of the view that increased government spending on infrastructure development, improving commodity prices in the global markets, better weather conditions and relative political stability will be the key drivers for Sub-Sahara Africa growth in 2018.
During the quarter, we tracked Kenya GDP growth projections for 2018 released by 13 organizations, that comprised of research houses, global agencies, and government organizations. The average, including our projection of 5.4%, came to 5.5%. The common view was that GDP growth would improve in 2018, from a Treasury estimate of 4.8% in 2017, generally due to (i) recovery in the agriculture sector on the back of improved weather conditions, and (ii) recovery in the business environment following easing of political risk caused by the prolonged political impasse over the 2017 presidential elections.
The rise of the Stanbic Bank Monthly Purchasing Manager’s Index (PMI) to 54.7 in February, up from 52.9 in January and 53.0 in December 2017, indicates that the business operating environment in the country improved during the quarter. Below is a table showing average projected GDP growth for Kenya in 2018; noteworthy being that the highest projection is by the CBK at 6.2%, followed by the National Treasury at 5.8%. We shall be updating this table should projections change and shall highlight who had the most accurate projection at the end of the year.
|
Kenya 2018 GDP Growth Outlook |
||
|
No. |
Organization |
Q1'2018 |
|
1. |
Central Bank of Kenya |
6.2% |
|
2. |
Kenya National Treasury |
5.8% |
|
3. |
Oxford Economics |
5.7% |
|
4. |
African Development Bank (AfDB) |
5.6% |
|
5. |
Stanbic Bank |
5.6% |
|
6. |
Citibank |
5.6% |
|
7. |
International Monetary Fund (IMF) |
5.5% |
|
8. |
World Bank |
5.5% |
|
9. |
Fitch Ratings |
5.5% |
|
10. |
Barclays Africa Group Limited |
5.5% |
|
11. |
Cytonn Investments Management Plc |
5.4% |
|
12. |
Focus Economics |
5.3% |
|
13. |
BMI Research |
5.3% |
|
14. |
Standard Chartered |
4.6% |
|
Average |
5.5% |
|
The 2018 Budget Policy Statement (BPS) was passed in February, with key changes to the budget from the 2017 Budget Review and Outlook Paper (BROP) for the fiscal year 2017/18 as follows:
- The government’s domestic borrowing target was reduced by 27.5% to Kshs 297.6 bn from Kshs 410.2 bn as per the 2017 BROP, which effectively took the government ahead of their target, currently having borrowed Kshs 267.4 bn against a pro-rated target of Kshs 223.2 bn, and
- The downward adjustment of the domestic borrowing target was most likely made to accommodate plans of a Kshs 202.0 bn Eurobond issue by the government as the foreign borrowing target increased by 16.6% to Kshs 323.2 bn from Kshs 277.3 bn as per the 2017 BROP. The government has currently borrowed 72.9% of its foreign borrowing target, following the signing of the Kshs 9.5 bn loan from the Japan International Cooperation Agency (JICA) for the rehabilitation of the Olkaria 1, 2 and 3 Geothermal Power Projects last week. On a pro-rated basis however, they are behind target, having borrowed 97.2% of their pro-rated foreign borrowing target.
The National Treasury released the Quarterly Economic and Budgetary Review for the first half of the fiscal year 2017/18, during the quarter. Key highlights from the report included:
- The KRA met 91.2% of their half year target, having collected Kshs 709.4 bn against a target of Kshs 777.7 bn. Overall revenue and grants were at 89.3% of the target. This figure differs slightly with KRA’s H1’2017/18 Performance Review and Prospects, also released during the quarter, according to which the government had collected Kshs 712.2 bn during the same period, 92.0% of their target and 87.0% of the pro-rated target,
- Recurrent expenditure was above target at 105.0% while development expenditure was below target at 67.3%. Of recurrent expenditure, Kshs 154.8 bn was foreign and domestic interest payments, which comes to 21.8% of revenue. Total budget absorption was at 88.5% of the target,
- The government collected 39.2% of the net foreign borrowing target and 112.3% of the domestic borrowing target, having collected Kshs 24.1 bn and Kshs 183.6 bn from the foreign and domestic markets, respectively,
- In December 2017, Kenya’s external debt was composed of 33.3% bilateral, 35.8% multilateral and 30.1% commercial debt, as compared to 33.8%, 41.2% and 24.2% in December 2016, respectively. As stated in our recent focus note on Kenya’s Public Debt, multilateral debt is mostly concessional hence cheaper, accounting for 16.0% of external debt service, while commercial loans are largely non-concessional and more expensive, accounting for 50.0% of external debt service,
- China remains the largest bilateral lender to Kenya at USD 5.2 bn as at December 2017, followed by Japan at USD 824.8 mn and France at USD 622.5 mn,
- Money Supply (M3) growth was at 8.4% in November 2017, up from 6.2% in November 2016. This is however still below the 5-year historical average of 12.7% growth, and
- Kenya’s BOP position improved to a surplus of 1.2% of GDP in November 2017 from a deficit of 1.3% of GDP in November 2016 supported by a capital & financial account balance surplus of 8.2% of GDP, despite a current account deficit of 7.0% of GDP.
In our view, the report pointed to a more positive outlook on government borrowing, with the government now on track towards meeting both their domestic and foreign borrowing target, though concerns still remain around the rising non-concessional debt burden.
The Kenya Shilling appreciated by 2.3% against the US Dollar, during the quarter, to close at Kshs 100.8, from Kshs 103.2 as at the end of December 2017, mainly driven by positive sentiments strengthened by receding political risk and increased hard currency inflows. During the week, the Shilling appreciated by 0.1% from Kshs 101.0, the previous week, due to a weak demand for dollars coupled with healthy inflows from investors. In our view, the shilling should remain relatively stable against the dollar in the short term, supported by:
- Weakening of the USD in the global markets as indicated by the US Dollar Index, which shed 9.9% in 2017, and has shed 2.2% YTD, as the Euro and the Sterling Pound continue to strengthen against the USD with the continued recovery of the Eurozone,
- Improving diaspora remittances, which increased by 26.6% to USD 203.8 mn in December 2017 from USD 160.9 mn in December 2016, driven by a 39.2% and 30.9% increase in remittances from North America and Europe, respectively, and,

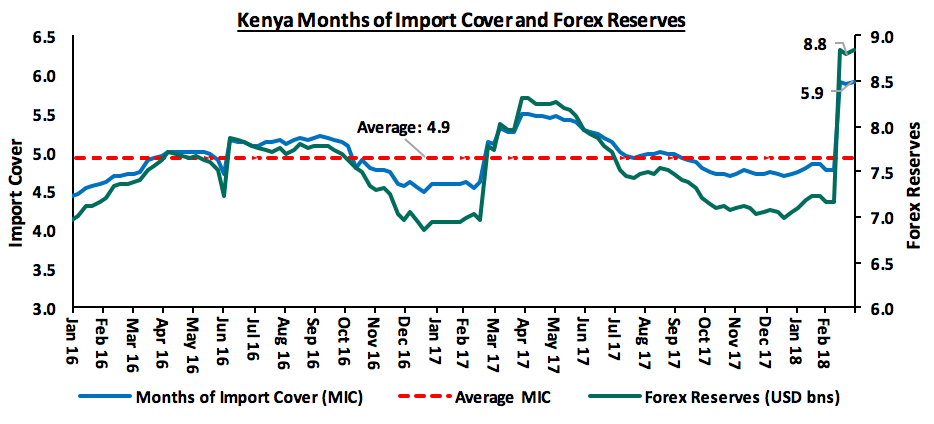
- CBK’s intervention activities, as they have sufficient forex reserves, currently at USD 8.8 bn (equivalent to 5.9 months of import cover), an increase from USD 7.1 bn at the end of December 2017, following the receipt of proceeds from the recently issued Eurobonds, and the USD 1.5 bn (equivalent to approx. 1 month of import cover) stand-by credit and precautionary facility by the IMF, still available until September 2018, after which a new facility will be discussed. This facility had been withdrawn during the quarter, but following a request to extend by the government, the IMF agreed to an extension.
The average inflation rate for Q1’2018 decreased to 4.5% from 5.0% in Q4’2017, with March inflation having declined to 4.2% from 4.5% in December 2017. This was in line with our projections of between 4.1% - 4.3% for the month of March. Y/Y inflation declined mainly due to the base effect given an average inflation rate of 8.8% in Q1’2017, above the government upper limit target of 7.5%. However, m/m inflation increased by 1.4% in March due to (i) a 3.8% rise in the housing, water, electricity, gas and other fuels index, driven by a rise in prices of cooking fuels and electricity, and (ii) a 1.5% increase in the food & non-alcoholic beverages index, driven by a rise in prices of select food basket items. We expect relatively lower inflation during the first half of the year, mainly due to the base effect, with rising prices only beginning to reflect well on the inflation rate in the second half of the year, hence, going forward, we expect inflation to average 7.0% in 2018, down from our previous projection of 7.5%, compared to 8.0% in 2017, which is within the government target range of 2.5% - 7.5%.
The Monetary Policy Committee (MPC) met twice during the quarter; on 22nd January and 19th March. In their second meeting, they reduced the Central Bank Rate (CBR) by 50 basis point to 9.5% from 10.0% noting that there was room for monetary policy easing to further support economic activity, as evidenced by easing inflation and increased private sector optimism as per the MPC Private Sector Market Perception Survey conducted in March. This decision was not in line with our expectation to maintain the rate at 10.0% as we believed that the MPC would have adopted a wait and see approach given (i) the stability in the macroeconomic environment, and (ii) the fact that lowering the CBR would effectively lower lending rates, thus making credit access by the private sector even harder due to the interest rate cap, given the further decline in private sector credit growth to 2.1% in February 2018 from 2.4% in December 2017.
Macroeconomic Indicators Table
The table below summarizes the 7 macroeconomic indicators that we track, the expectation at the beginning of 2017, the actual 2017 experience YTD, and the impact of the same, and our expectations going forward:
|
Macro-Economic & Business Environment Outlook |
|||||
|
Macro-Economic Indicators |
2018 Expectations at Beginning of Year |
YTD 2018 Experience |
Going Forward |
Outlook - Beginning of Year |
Current Outlook |
|
Government Borrowing |
Government to come under pressure to borrow as it is well behind both domestic and foreign borrowing targets for FY 2017/18, and KRA is unlikely to meet its collection target due to expected suppressed corporate earnings in 2017 |
The domestic borrowing target was revised downwards to Kshs 297.6 bn from Kshs 410.2 bn, taking the government ahead of their domestic borrowing target, having borrowed Kshs 267.4 bn against a pro-rated target of Kshs 223.2 bn |
The Government to be under no pressure to borrow as it is ahead of its domestic target, has borrowed 72.9% of its full year foreign borrowing target of Kshs 323.2 bn, However, with the petition by the Treasury to amend the Division of Revenue Act 2017 and reduce expenditure by counties and an expected improvement in revenue collections, the borrowing targets for the next fiscal year might be lower |
Negative |
Positive |
|
Exchange Rate |
Currency projected to range between Kshs 102.0 and Kshs 107.0 against the USD in 2018. With the possible widening of the current account deficit being a possible point of concern, we expect the CBK to continue to support the Shilling in the short term through its sufficient reserves of USD 7.1 bn ( equivalent to 4.7 months of import cover) |
The Shilling has appreciated by 2.3% against the USD YTD to Kshs 100.8 from Kshs 103.2 at the end of December 2017, hitting a high of Kshs 100.8 due to increased flower exports to the Eurozone in mid-February. Forex reserves hit a high of Kshs 8.8 bn (equivalent to 5.9 months of import cover) upon receipt of proceeds from the March Eurobond issue. The IMF extended the USD 1.5 bn standby and precautionary facility by 6 months to September 2018 |
We expect the currency to remain relatively stable against the dollar due to a weaker USD in the global markets, ranging between Kshs 100.0 and Kshs 107.0 to the USD. We expect the CBK to continue supporting the shilling given the level of reserves and the IMF standby facility. However, a worsening current account deficit, which worsened to 7.0% of GDP in Q3’2017, as compared to 6.0% of GDP in a similar period last year, may have a negative effect |
Neutral |
Neutral |
|
Interest Rates |
Upward pressure expected on interest rates, especially in the first half of the year, as the government falls behind its borrowing targets for the fiscal year. However, with the Banking (Amendment) Act, 2015, the MPC might be unable to do much with the CBR which has remained at 10.0% throughout 2017 |
The MPC met on 19th March 2018 and decided to reduce the CBR to 9.5% from 10.0%, for the first time since July 2016, noting that there was room for monetary policy easing to further support economic activity. Interest rates have remained stable, with the yields on the T-bills remaining unchanged since the end of the previous quarter |
No upward pressure on interest rates, with the government ahead of its pro-rated borrowing targets for the fiscal year. However, with calls to repeal or revise the Banking (Amendment) Act, 2015, the CBK might not be able to maintain low interest rates by rejecting bids deemed expensive in primary bond auctions, during the second half of the year and the beginning of a new borrowing cycle by the government |
Neutral |
Neutral |
|
Inflation |
Inflation expected to average 7.5% compared to 8.0% last year |
Inflation in January, February and March 2018 came in at 4.8%, 4.5% and 4.2% with y/y inflation remaining low mainly due to the base effect but m/m inflation rising due to increasing food, fuel, electricity and transport prices |
Inflation to average 7.0% in 2018, down from 8.0% in 2017 and within the government target range of 2.5% - 7.5% |
Positive |
Positive |
|
GDP |
GDP growth projected to come in at between 5.3% - 5.5% |
Various research houses, global agencies, and government organizations released their Kenya 2018 GDP projections, with the average coming to 5.5%, inclusive of our projection. The common view was that GDP growth would improve in 2018, from a Treasury estimate of 4.8% in 2017, generally due to (i) recovery in the agriculture sector after the end of the drought, and (ii) recovery in the business environment following easing of political risk arising from the prolonged political impasse over the 2017 presidential elections |
We maintain our GDP growth projection for 2018 at between 5.3% - 5.5%, higher than the expected growth rate of 4.7% in 2017, and in line with the 5-year historical average of 5.4% |
Positive |
Positive |
|
Investor Sentiment |
Investor sentiment expected to improve in 2018 given the now settling operating environment after conclusion of the 2017 elections |
The Kenya Eurobond was 7.0x oversubscribed partly showing the appetite for Kenyan securities by the foreign community, and investor confidence in Kenya’s stable and relatively diversified economy |
Given (i) the now settling operating environment following the elections in Q3’2017, (ii) the expectation that long term investors will enter the market seeking to take advantage of the valuations which are still historically low, and (iii) expectations of a relatively stable shilling, we still expect investor sentiment to improve in 2018 |
Positive |
Positive |
|
Security |
Security expected to be maintained in 2018, especially given that the elections were concluded and the USA lifted its travel warning for Kenya, placing it in the 2nd highest tier of its new 4-level advisory program, indicating positive sentiments on security from the international community |
The political climate in the country has eased, compared to Q3’2017 with security maintained and business picking up. Kenya now has direct flights to and from the USA, a possible signal of improving security in the country |
We expect security to be maintained in 2018, especially given that the elections are now concluded, the government has settling into office, and the country's two principals are discussing working towards growing the economy |
Positive |
Positive |
Of the 7 indicators we track, 5 are positive and 2 are neutral, with government borrowing being the only indicator whose outlook has changed, to positive from negative. This is a positive change from the last quarter where we had 4 positives, 1 negative and 3 neutrals. From this, we maintain our positive outlook on the 2018 macroeconomic environment.
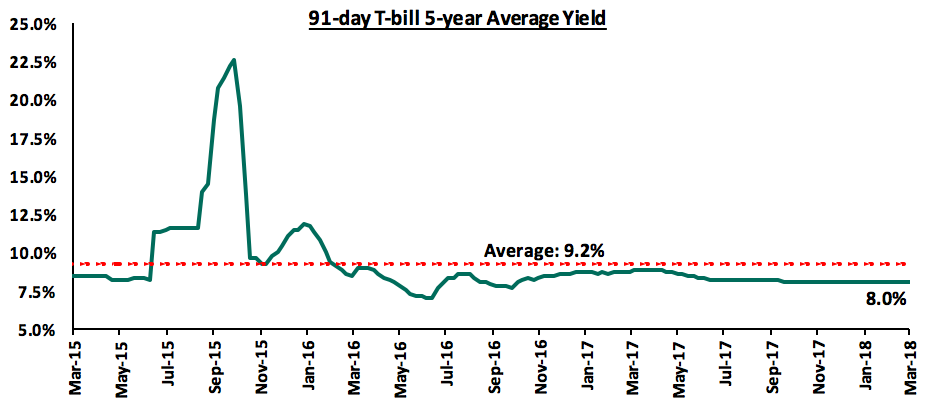
During the first quarter of 2018, T-bills were oversubscribed, with the overall subscription rate coming in at 115.4% up from 72.5% in Q4’2017. Overall subscriptions for the 91, 182, and 364-day papers in Q1`2018 came in at 94.5%, 109.2% and 130.0% from 84.9%, 61.5% and 78.6% in Q4`2017, respectively. Yields on the 91-day and 364-day T-bills declined by 10 bps each to 8.0% and 11.1% at the end March 2018, from 8.1% and 11.2% as at December 2017, respectively. The yield on the 182-day paper declined by 20 bps to end the quarter at 10.4% from 10.6% at the end of the previous quarter. The average acceptance rate for the quarter came in at 87.7%, down from 92.0% recorded in Q4’2017, with the government accepting a total of Kshs 310.2 bn of the total bids received during the quarter of Kshs 355.8 bn.
This week, T-bills were undersubscribed, with overall subscription coming in at 52.8%, down from 114.0% recorded the previous week, as investors focused on the tap sale that registered a subscription rate of 182.5%. Subscription rates for the 91, 182, and 364-day papers came in at 44.1%, 37.5%, and 71.5% from 54.6%, 78.2%, 173.6%, the previous week, respectively. Yields on the 91, 182 and 364-day T-bills remained unchanged during the week at 8.0%, 10.4%, and 11.1%, respectively. The overall acceptance rate increased to 92.9% compared to 83.8% the previous week, with the government accepting a total of Kshs 11.8 bn of the Kshs 12.7 bn worth of bids received, against the Kshs 24.0 bn on offer. The government is currently 19.8% ahead of its domestic borrowing target for the current fiscal year, having borrowed Kshs 267.4 bn, against a target of Kshs 223.2 bn (assuming a pro-rated borrowing target throughout the financial year of Kshs 297.6 bn).
The 91-day T-bill is currently trading at 8.0%, 1.2% points below its 5-year average of 9.2% as seen in the chart below:
During Q1’2018, the Kenyan Government had 3 Treasury Bond primary issues, one in each month, with the details in the table below:
|
No. |
Date |
Bond Auctioned |
Effective Tenor to Maturity (Years) |
Coupon |
Amount to be Raised (Kshs bn) |
Actual Amount Raised (Kshs bn) |
Average Accepted Yield |
Subscription Rate |
Acceptance Rate |
|
1 |
16/01/2018 |
IFB 1/2018/15 |
15.0 |
12.5% |
40.0 |
5.0 |
12.5% |
139.4% |
9.0% |
|
30/01/2018 |
IFB 1/2018/15 (tap sale) |
35.0 |
36.2 |
103.5% |
|||||
|
2 |
12/02/2018 |
FXD/1/2010/15(re-open) |
7.1 |
10.3% |
40.0 |
4.4 |
12.7% |
60.4% |
54.7% |
|
FXD2/2013/15(re-open) |
10.2 |
12.0% |
8.8 |
12.9% |
|||||
|
27/02/2018 |
FXD1/2010/15 (tap sale) |
7.1 |
10.3% |
27.0 |
3.8 |
14.1% |
|||
|
FXD2/2013/15(tap sale) |
10.2 |
12.0% |
|||||||
|
3 |
09/03/2018 |
FXD 1/2018/5 |
5.0 |
12.3% |
40.0 |
23.1 |
12.3% |
128.5% |
61.4% |
|
FXD 1/2018/20 |
20.0 |
13.2% |
8.5 |
13.3% |
|||||
|
27/03/2018 |
FXD 1/2018/5(tap sale) |
5.0 |
12.3% |
8.5 |
15.5 |
182.5% |
|||
|
FXD 1/2018/20(tap sale) |
20.0 |
13.0% |
Primary T-bond auctions in Q1’2018 were oversubscribed, except for the February auction, with the subscription rate averaging 104.7% for the quarter, higher than the average subscription rate for Q4’2017, which came in at 75.2%. The average acceptance rate for the quarter came in at 41.7%, as the CBK continued to reject bids deemed expensive in order to maintain the rates at low levels, with tap sales still being used as a tool to plug in any deficits from primary auction bids. Tap sales were better received by the market during the quarter, with the average subscription rate for tap sales at 100.0%, higher than 41.5% in Q4’2017.
The NSE FTSE Bond Index gained 4.0% during the quarter while secondary market bond turnover increased by 89.9% to Kshs 147.1 bn in Q1’2018 from Kshs 77.5 bn in Q4’2017.
Liquidity levels remained stable and well distributed in the market as indicated by the 36.4% decline in the average volumes traded in the interbank market to Kshs 15.1 bn from Kshs 23.7 bn, recorded in Q4’2017 and the subsequent decline in the interbank rate to 5.4% from 7.9% the previous quarter. During the week, liquidity tightened with the average interbank rate rising to 5.8% from 4.6% recorded the previous week. There was a decrease in the average volumes traded in the interbank market by 2.7% to Kshs 14.8 bn, from Kshs 15.2 bn the previous week.
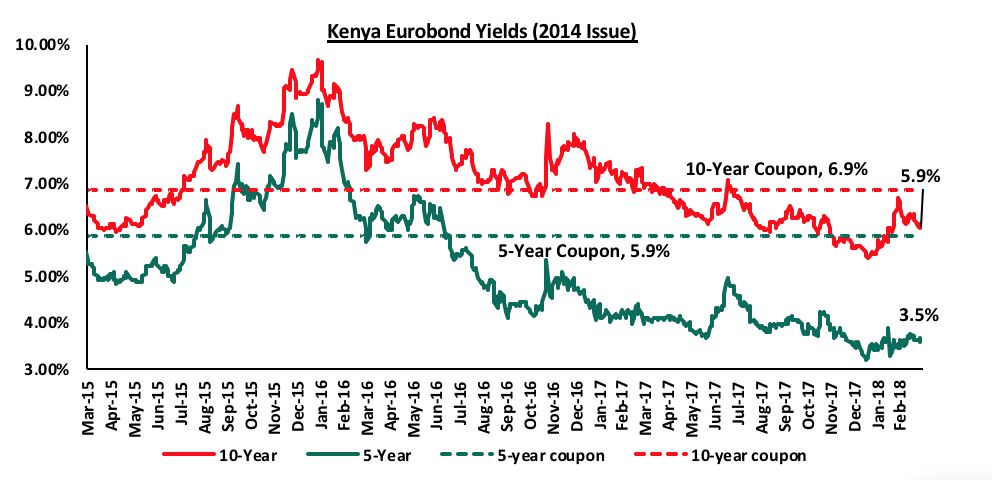
According to Bloomberg, since the mid-January 2016 peak, yields on the 5-year and 10-year Eurobonds issued in 2014 declined by 5.3% and 3.7% points, respectively, indicating foreign investor confidence in Kenya’s macro-economic prospects. During the week, the yields on the 5-year and 10-year Eurobonds declined by 20 bps and 30 bps to 5.9% and 6.2% from 3.5% and 3.7%, the previous week.
The government issued two Eurobonds during the quarter. Since the issue date in February 2018, yields on the 10-year and 30-year Eurobonds have declined by 0.7% and 0.6% points, respectively. During the week, the yields on the 10-year and 30-year Eurobonds declined by 20 bps and 10 bps to 6.6% and 7.7% from 6.8% and 7.8%, the previous week.
Fitch Ratings, S&P Global Ratings and Moody’s affirmed Kenya’s outlook as “stable”, with Moody’s downgrading the government’s issuer rating to “B2” from “B1” during the quarter. The table below tracks sovereign credit ratings for the Kenyan Government by various global rating agencies:
|
Kenya Sovereign Credit Rating |
|||||
|
No. |
Credit Rating Agency |
Long-term External & Internal Rating |
Short-term External & Internal Rating |
Overall Issuer Rating |
Outlook |
|
1 |
Fitch Ratings |
B+ |
B |
- |
Stable |
|
2 |
S&P Global Ratings |
B+ |
B |
- |
Stable |
|
3 |
Moody's |
- |
- |
B2 |
Stable |
In a bid to attract investments in sustainable development initiatives, and promote the green economy development agenda, the government plans to issue Kenya’s first green bond in the fiscal year 2018/19. In our view, the issuance of a green bond will serve to attract more investors into the renewable energy space, diversifying energy sources and increasing foreign direct investment volumes into the country from foreign social investment entities that support green living. However, while we commend innovation, the M-Akiba Bond introduced in Q1’2017 as a way of providing an avenue for smaller retail investors to invest in government securities and encouraging a savings & investment culture in Kenyans, might not have met its purpose. The pilot issue managed to raise Kshs 150.0 mn, 100.0% of its target but the 2nd round that had a target of Kshs 1.0 bn only managed 12.8% of this. As mentioned in our Cytonn Weekly #6/2018, prior to issuing the green bond, the government should identify viable projects that fit into the green bond objectives and educate investors, in order to appeal to the target market, for the bond to be successful in achieving its purpose.
We recently reviewed our fixed income outlook following changes made to government borrowing targets following the approval of the 2018 Budget Policy Statement (BPS). For the detailed review, see our Cytonn Weekly #10/2018.
Rates in the fixed income market have remained stable as the government rejects expensive bids. The MPC met on 19th March 2018 and lowered the CBR by 0.5% to 9.5% from 10.0%. With the government under no pressure to borrow for this fiscal year as (i) they are currently ahead of their domestic borrowing target by 19.8%, (ii) have met 72.9% of their total foreign borrowing target for the current fiscal year, and (iii) the KRA is not significantly behind target in revenue collection, we expect interest rates to remain stable. With the expectation of a relatively stable interest rate environment, our view is that investors should be biased towards medium to long-term fixed income instruments.
During Q1’2018, the Kenyan equities market was on an upward trend, with NASI, NSE 20 and NSE 25 gaining by 11.7%, 3.6% and 9.6%, respectively, as a result of gains in prices of large cap stocks. Top gainers for the quarter were Equity Group, Barclays, KCB Group, Cooperative Bank and Safaricom, which were up by 38.4%, 31.8%, 24.0%, 22.5% and 15.0%, respectively. NASI, NSE 20 and NSE 25 gained by 46.5%, 23.5% and 35.4%, over the last 12 months (LTM) respectively. During the week, the market had mixed performance, as NASI declined by 0.5%, NSE 20 was flat, while NSE 25 gained by 0.2%, with the decline in NASI due to a 2.4% decline in Safaricom.
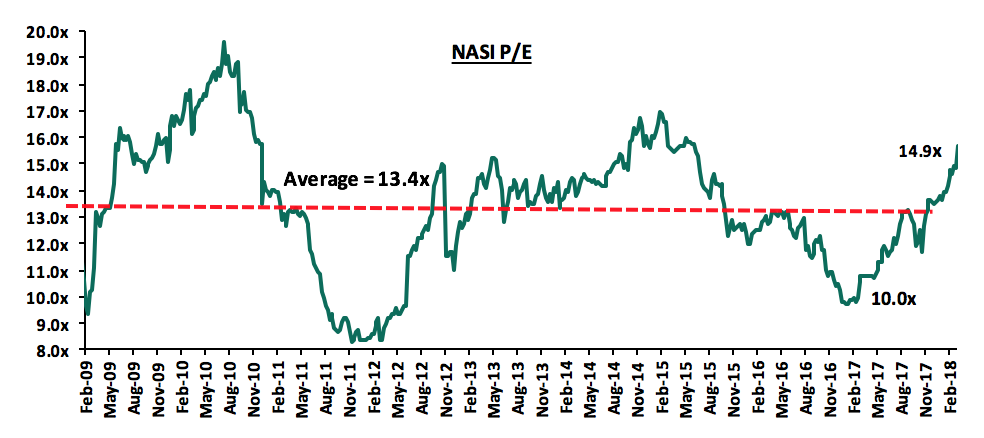
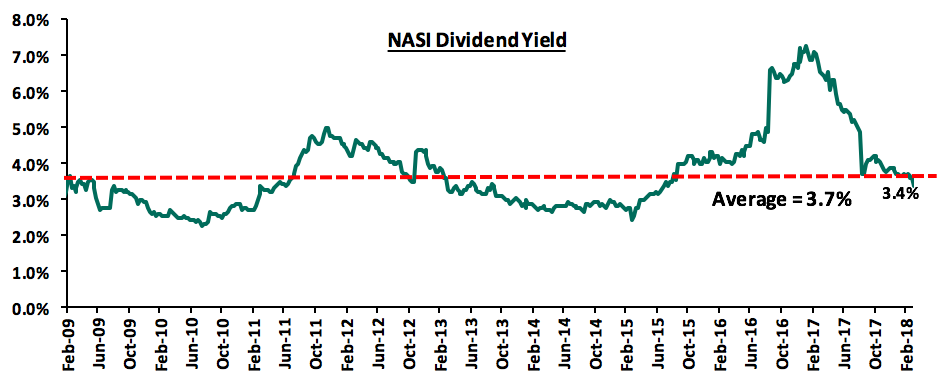
Equity turnover during Q1’2018 rose by 73% to USD 600.0 mn from USD 347.2 mn in Q4’2017. This can be attributed to improved investor sentiment, as a result of improved political stability after the election period, which saw investors take profit following a rally in the stock market. The market is currently trading at a price to earnings ratio (P/E) of 14.9x, versus a historical average of 13.4x, and a dividend yield of 3.4%, compared to a historical average of 3.7%. The valuation is above the historical average but we believe there still exist pockets of value in the market, with the current P/E valuation being 7.1% below the most recent peak in February 2015. The current P/E valuation of 14.9x is 54% above the most recent trough valuation of 9.7x experienced in the first week of February 2017, and 80% above the previous trough valuation of 8.3x experienced in December 2011. The charts below indicate the historical P/E and dividend yields of the market.
During the quarter, the Treasury issued a gazette notice authorizing stock lending and short selling (Securities Lending, Borrowing and Short-Selling) Regulations, 2017 as highlighted in our Cytonn Weekly #03/2018. This is set to enhance liquidity in the capital markets since bulk of the shares are held by pension funds who do not trade as often, thus reducing the levels of activity and liquidity in the market. Short selling provides an opportunity for investors to gain from a stock they do not own by borrowing it with an agreement of buying it back driven by the conviction that the stock’s price will drop in future. The CMA has set up some of these measures in a bid to minimize risks associated with short selling:
- Short selling will be limited to a number of listed securities which is yet to be determined,
- Market intermediaries involved with short selling will also be required to submit a report of the transactions they have conducted once every month or in any other determined frequency by CMA, and,
- The stock borrower will also be required to submit collateral in cash or Government paper to the lender that covers at least 100% the value of the stocks borrowed.
During the quarter, 3 of the largest Kenyan Banks by market cap- Equity Bank, Cooperative Bank and KCB group were downgraded by the Moody’s investor service to “B2” from “B1” previously. This was driven by the weakening credit rating of the Kenyan Government to B2 from B1 previously following the rising debt levels. The 3 Banks credit rating was linked to the Government rating due to their high sovereign exposure in form of Government securities held as part of liquid assets in their Balance sheets. A downgrade in the credit rating for a corporate might make it difficult for it to negotiate for lower rates on corporate debt financing. We maintain our view that the 3 banks are still fundamentally strong with their capital adequacy ratios currently above the minimum statutory requirements.
A number of Banks released results during the week:
- Diamond Trust Bank released FY’2017 results, registering a decline in its core earnings per share (EPS) by 10.3% to Kshs 24.8 from Kshs 27.6 in FY’2016, lower than our expectations for an EPS of Kshs 26.8. The decline in performance was driven by a 10.4% increase in operating expenses, despite operating income increasing by 2.0%. For more information, see our DTBK FY’2017 Earnings Note
- I&M Holdings Limited released FY’2017 results, registering a decline in core earnings per share by 7.1% to Kshs 16.5 from Kshs 17.7 in FY’2016, higher than our expectations for an EPS of Kshs 16.0. The decline in performance was driven by a 15.9% increase in operating expenses, despite operating income increasing by 4.0%. For more information, see our I&M Holdings FY’2017 Earnings Note.
- HF Group released FY’2017 results, registering a decline in its core earnings per share by 86.1% to Kshs 0.4 from Kshs 2.5 in FY’2016, lower than our expectations for an EPS of Kshs 0.5. The decline in performance was driven by a 19.3% increase in operating expenses, coupled with a 7.8% decline in operating income. For more information, see our HF Group FY’2017 Earnings Note
- NBK released FY’2017 results, registering an increase in its core earnings per share by 479.0% to Kshs 1.2 from Kshs 0.2 in FY’2016, higher than our expectations for an EPS of Kshs 0.3. The improvement in performance was driven by a 20.8% decline in operating expenses, despite operating income also declining by 14.0%. For more information, see our NBK FY’2017 Earnings Note
During the quarter, listed banks released their 2017 full year results, recording an average decline in core earnings per share of 0.8% compared to a 4.4% gain in 2016, weighed down by the enactment of the Banking Act (Amendment) 2015, which placed regulations on banks’ loan and deposit pricing framework. Below is a summary of some of the metrics that we track:
|
Listed Banks FY'2017 Earnings and Growth Metrics |
|||||||||||
|
Bank |
Core EPS Growth (%) |
Interest Income Growth (%) |
Interest Expense Growth (%) |
Net Interest Income Growth (%) |
Net Interest Margin (%) |
Non-Funded Income (NFI) Growth (%) |
NFI to Total Operating Income (%) |
Growth in Total Fees& Commissions (%) |
Deposit Growth (%) |
Loan Growth (%) |
Growth in Govt. Securities (%) |
|
NBK |
479.0 |
(17.7) |
(24.9) |
(13.7) |
7.4 |
(15.0) |
26.5 |
(1.2) |
91.4 |
0.4 |
(4.8) |
|
Equity Group |
14.0 |
(6.6) |
8.1 |
(10.2) |
9.0 |
24.2 |
42.0 |
22.0 |
10.7 |
4.9 |
27.3 |
|
KCB Group |
(0.1) |
1.4 |
(3.1) |
2.9 |
8.7 |
2.5 |
32.2 |
16.4 |
11.5 |
9.6 |
7.4 |
|
Stanbic |
(2.5) |
(3.0) |
(5.3) |
(2.0) |
5.2 |
10.0 |
44.2 |
38.6 |
24.1 |
8.1 |
42.6 |
|
NIC Group |
(4.3) |
(3.2) |
11.5 |
(11.5) |
6.3 |
3.6 |
27.9 |
14.2 |
24.2 |
4.6 |
77.9 |
|
Barclays Bank |
(6.4) |
(3.4) |
(7.2) |
(2.4) |
9.7 |
(9.5) |
27.9 |
8.6 |
12.5 |
(0.7) |
20.1 |
|
I&M Holdings |
(7.1) |
(0.1) |
0.0 |
0.6 |
7.8 |
15.9 |
27.0 |
22.0 |
15.5 |
13.6 |
10.9 |
|
Co-op Bank |
(10.0) |
(4.5) |
(3.9) |
(4.7) |
9.2 |
5.6 |
32.4 |
0.3 |
9.2 |
7.1 |
19.7 |
|
DTBK |
(10.3) |
2.4 |
3.6 |
1.5 |
6.5 |
4.1 |
21.1 |
5.3 |
11.8 |
5.2 |
23.3 |
|
Stanchart |
(24.0) |
1.9 |
20.3 |
(4.1) |
8.4 |
2.3 |
32.1 |
(0.4) |
14.3 |
2.9 |
26.7 |
|
HF Group |
(86.1) |
(17.1) |
(11.1) |
(24.3) |
5.2 |
78.2 |
31.1 |
(37.6) |
(3.7) |
(8.9) |
(44.0) |
|
Weighted Average** |
(0.8%) |
(2.4%) |
2.5% |
(3.8%) |
8.4% |
9.0% |
33.6% |
13.3% |
12.5% |
6.1% |
22.2% |
|
Weighted 2016 Average |
4.4% |
15.5% |
6.2% |
20.3% |
9.2% |
2.4% |
31.0% |
12.6% |
6.4% |
6.3% |
45.8% |
**- Market cap weighted as at 29th March, 2018
Key take-outs from the Kenya Listed Banks performance in 2017 include:
- The listed banks recorded a 0.8% decline in core EPS, compared to a growth of 4.4% in 2016. Only National Bank and Equity Group recorded a growth in core EPS, registering at 457%, and 14% growth in earnings, respectively. National Bank restated their 2016 results, and benefitted from a decline in loan loss provisioning, while Equity Group gained on the back of a 24.3% growth in Non-Funded income (NFI). HF Group recorded the biggest decline at 86.1%, on the back of a 24.3% decline in Net Interest Income (NII),
- Average deposit growth came in at 12.5%. However, despite the average deposits having grown, the interest expense paid on deposits recorded a slower growth of 2.5% on average, indicating that banks are growing deposits but opening less interest earning accounts and possibly transferring some existing interest earning accounts to transaction accounts,
- Average loan growth has been recorded at 6.1%, however interest income has decreased by 2.4%, showing the effects of the rate cap,
- Investment in government securities has grown by 22.2%, outpacing loan growth of 6.1%, showing increased lending to the government by banks as they avoid the risky borrowers,
- The average Net Interest Margin in the banking sector currently stands at 8.4%, and
- Non-funded income has grown by 9.0%, which included a Fee and Commissions growth of 13.3%. This shows that banks are charging more fee income to improve their income on loans above the rate cap maximum.
Below is our Equities Universe of Coverage:
|
all prices in Kshs unless stated otherwise |
||||||||||||
|
No. |
Company |
Price as at 23/03/18 |
Price as at 29/03/18 |
w/w Change |
YTD/Q/Q Change |
LTM Change |
Target Price* |
Dividend Yield |
Upside/ (Downside)** |
P/TBv Multiple |
||
|
1. |
NIC Bank*** |
41.3 |
41.3 |
0.0% |
22.2% |
66.7% |
61.4 |
3.0% |
51.9% |
0.8x |
||
|
2. |
Ghana Commercial |
6.0 |
6.1 |
1.3% |
20.6% |
19.6% |
7.7 |
6.2% |
33.0% |
1.7x |
||
|
3. |
Diamond Trust Bank |
218.0 |
219.0 |
0.5% |
14.1% |
76.6% |
281.7 |
1.2% |
29.8% |
1.2x |
||
|
4. |
CRDB |
170.0 |
170.0 |
0.0% |
6.3% |
(8.1%) |
207.7 |
5.6% |
27.7% |
0.7x |
||
|
5. |
Zenith Bank |
30.2 |
29.3 |
(3.0%) |
14.3% |
109.3% |
33.3 |
10.1% |
23.8% |
1.4x |
||
|
6. |
I&M Holdings |
125.0 |
125.0 |
0.0% |
(1.6%) |
35.1% |
150.4 |
2.8% |
23.1% |
1.4x |
||
|
7. |
Union Bank Plc |
6.7 |
6.7 |
0.0% |
(14.1%) |
54.4% |
8.2 |
0.0% |
21.6% |
0.7x |
||
|
8. |
Stanbic Bank Uganda |
30.0 |
30.0 |
0.0% |
10.1% |
15.4% |
36.3 |
0.0% |
20.9% |
2.0x |
||
|
9. |
KCB Group |
51.5 |
52.0 |
1.0% |
21.6% |
57.6% |
59.7 |
5.8% |
20.6% |
1.6x |
||
|
10. |
Barclays |
12.7 |
12.6 |
(0.8%) |
30.7% |
40.2% |
12.8 |
8.0% |
10.0% |
1.6x |
||
|
11. |
Bank of Baroda |
120.0 |
120.0 |
0.0% |
6.2% |
9.1% |
130.6 |
0.0% |
8.8% |
1.1x |
||
|
12. |
Bank of Kigali |
295.0 |
290.0 |
(1.7%) |
(3.3%) |
18.9% |
299.9 |
4.2% |
7.7% |
1.7x |
||
|
13. |
Ecobank |
11.2 |
11.2 |
(0.4%) |
46.7% |
52.7% |
10.7 |
7.4% |
3.6% |
4.0x |
||
|
14. |
HF Group*** |
10.8 |
11.7 |
8.4% |
12.0% |
14.8% |
11.7 |
3.0% |
3.4% |
0.4x |
||
|
15. |
Co-operative Bank |
19.5 |
19.6 |
0.5% |
22.5% |
71.1% |
18.6 |
4.1% |
(1.0%) |
1.7x |
||
|
16. |
UBA Bank |
11.5 |
11.8 |
2.2% |
14.1% |
104.0% |
10.7 |
7.2% |
(1.7%) |
1.0x |
||
|
17. |
Standard Chartered KE |
234.0 |
228.0 |
(2.6%) |
9.6% |
3.2% |
201.1 |
7.5% |
(4.3%) |
1.8x |
||
|
18. |
Access Bank |
11.3 |
11.1 |
(2.2%) |
5.7% |
78.2% |
9.5 |
5.9% |
(8.1%) |
0.8x |
||
|
19. |
CAL Bank |
1.3 |
1.5 |
16.8% |
41.7% |
212.2% |
1.4 |
0.0% |
(8.5%) |
1.2x |
||
|
20. |
Stanbic Holdings |
91.5 |
92.5 |
1.1% |
14.2% |
46.8% |
79.0 |
5.7% |
(8.9%) |
1.2x |
||
|
21. |
SBM Holdings |
7.6 |
7.7 |
0.5% |
2.4% |
8.2% |
6.6 |
5.2% |
(9.4%) |
0.9x |
||
|
22. |
Guaranty Trust Bank |
46.9 |
44.7 |
(4.7%) |
9.7% |
76.3% |
37.2 |
6.0% |
(10.7%) |
2.7x |
||
|
23. |
Equity Group |
52.5 |
54.0 |
2.9% |
35.8% |
66.2% |
42.3 |
3.7% |
(18.0%) |
2.4x |
||
|
24. |
Stanbic IBTC Holdings |
45.7 |
48.5 |
6.2% |
13.3% |
169.4% |
37.0 |
1.0% |
(22.7%) |
2.9x |
||
|
25. |
National Bank |
8.5 |
9.2 |
7.6% |
(2.1%) |
52.5% |
5.6 |
0.0% |
(38.8%) |
0.5x |
||
|
26. |
Ecobank Transnational |
17.8 |
16.4 |
(8.1%) |
(3.8%) |
87.9% |
9.3 |
3.7% |
(39.5%) |
0.9x |
||
|
27. |
Standard Chartered GH |
34.8 |
35.1 |
1.0% |
39.0% |
127.2% |
19.5 |
3.2% |
(41.4%) |
5.0x |
||
|
28. |
FBN Holdings |
12.3 |
12.5 |
2.0% |
42.0% |
311.2% |
6.6 |
1.6% |
(45.4%) |
0.7x |
||
|
*Target Price as per Cytonn Analyst estimates |
||||||||||||
|
**Upside / (Downside) is adjusted for Dividend Yield |
||||||||||||
|
***Banks in which Cytonn and/or its affiliates holds a stake. For full disclosure, Cytonn and/or its affiliates holds a significant stake in NIC Bank, ranking as the 5th largest shareholder |
||||||||||||
We are “NEUTRAL” on equities for investors with a short-term investment horizon since the market has rallied and brought the market P/E slightly above its’ historical average. However, pockets of value still exist, with a number of undervalued sectors like Financial Services, which provide an attractive entry point for long-term investors, and with expectations of higher corporate earnings this year, we are “POSITIVE” for investors with a long-term investment horizon.
Financial Services Sector
- Centum Investments, an investment company based in Kenya, has injected Kshs 1.1 bn into its banking subsidiary Sidian Bank, through a rights issue meant to fund lender’s growth initiatives. Centum holds a 72.9% stake in Sidian Bank through a non-operating holding company dubbed Bakki Holdco Ltd. The additional sum means that it has defended its entire stake in the rights issue, with shareholders approving a total of Kshs 1.5 bn rights issue in March 2018. The additional capital will support the Bank’s growth plans, including further investments in its trade finance business, which saw a growth in portfolio from Kshs 896.0 mn in 2016 to Kshs.6.6 bn by close of 2017. This is the second time in 2-years that Centum has put money into Sidian through a rights issue. In 2016, the investment firm put in Kshs 1.2 bn into the bank, earning it an additional stake. This pushed its shareholding from 65.9% (after the initial investment of Kshs 2.5 bn) to 72.9%. The investment firm managed to increase its stake in the bank after some of the minority owners failed to take up their rights in the 2016 transaction. Centum’s latest decision to inject additional money into Sidian comes at a time when the investment firm has been divesting from some of its investments in companies such as asset manager GenAfrica, where it sold a 73.4% stake to New York-based equity fund Kuramo Capital and the sale of its stake in micro-financier Platinum Credit.
- Atlas Mara Limited, a financial services holding company, increased its strategic stake in Union Bank Nigeria (UBN) through a Naira 26.3 bn (USD 75.0 mn) investment in UBN’s rights issue. UBN completed a Naira 49.7 bn (USD 138.2 mn) rights offering on the Nigerian Stock Exchange at a price of Naira 4.1 per share and registered a 120.0% subscription rate. Atlas Mara’s investment of USD 75.0 mn translated to around 6.6 bn shares. Atlas Mara previously owned 44.5% of UBN’s issued share capital at the time, translating to 7.6 bn shares. With the acquisition, Atlas will have 14.1 bn shares in total, of the 29.1 bn shares issued translating to a 48.6% ownership in UBN, having fully subscribed to the rights related to its pre-existing 44.5% shareholding, and acquired shares representing a 3.1% shareholding through application for additional shares during the rights issue. The transaction was valued at a P/B of 0.3x, which is a 84.2% discount to the average P/Bv multiple of 1.9x for select listed Banks in Nigeria. For more information, see our Cytonn Weekly #3/2018
- Kuramo Capital, a New-York based private equity firm completed a transaction to acquire a minority stake in Kenyan investment bank Sterling Capital for an undisclosed amount. The acquisition came after the reinstatement of Sterling’s investment banking license in October 2017, after it was downgraded to stockbroker level in 2011, for failing to meet CMA’s revised minimum capital limit that required investment banks to raise their minimum capital to Kshs 250.0 mn from Kshs 30.0 mn, while stockbrokers were required to increase their capital to Kshs 50.0 mn, up from Kshs 5.0 mn. For more information, see our Cytonn Weekly #4/2018
- Fonds Européen de Financement Solidaire (Fefisol), a Luxembourg-based private equity (PE) firm, invested Kshs 100.0 mn in Kenya’s Musoni Microfinance Limited for an undisclosed stake. The investment by Fefisol will be used to grow their loan book, which stood at Kshs 1.2 bn as at January 2018. The investment by Fefisol will support Musoni’s objective of achieving competitive low-cost lending in the country at a time where bank funding continues to be relatively expensive. For more information, see our Cytonn Weekly #7/2018
We expect that Investors will continue to show interest in the financial service sector, motivated by attractive valuations, growth of financial inclusion and regulation that requires institutions to increase their capital requirements across the sector.
Hospitality Sector
- South-African based private equity fund Uqalo invested Kshs 404.0 mn (USD 4.0 mn) to acquire an undisclosed stake in Kenyan fast food chain Big Square. The investment is beneficial for both parties as it will (i) finance Big Squares expansion plan, as the outlet targets to expand Big Squares footprint from the current 9 branches to 30 branches over the next four-years, and (ii) expand Uqalo’s footprint and portfolio in Kenya. Uqalo has previously invested in Kenya’s Twiga Foods, where it owns a 5.0% stake in the business-to-business food supplier. For more information, see our Cytonn Weekly #10/2018
The interest by investors in the hospitality sector in the country indicates a positive outlook in the performance of the sector, which is supported by (i) the growing middle class with increasing disposable income, and (ii) the continued growth of the sector in the country in the past years. The food and services sector produced a total of Kshs 16.2 bn in Gross Income in 2016, a 4.5% increase from Kshs 15.5 bn recorded in 2015.
Education Sector
- Dubai Investments, a private equity company listed on the Dubai Financial Market stock exchange, is set to invest USD 20 mn (Kshs 2.0 bn) in the consortium set to build a chain of Sabis-branded private schools in Africa. The consortium was previously made up of Centum Investment Company, Investbridge Capital, and Sabis Education Network. Prior to the investment, 40.0% of the consortium was owned by Centum, 40% by Investbridge and 20.0% by Sabis. The value of the investment by each party and the new shareholding after the investment by Dubai Investments is undisclosed. The consortium, which is investing through the holding company Africa Crest Education (ACE). For more information, see our Cytonn Weekly #7/2018
- Schole Limited, a London based education provider has acquired 100% stake of Makini Schools for an undisclosed amount. Schole operates 3 institutions across Africa, (i) Crested Crane Academy, Zambia, (ii) Pestallozi Education Centre in Zambia, and (iii) Kisun High School in Uganda.
The acquisition indicates the rising interest increase in investment in the education sector in Sub-Saharan Africa. Other investors who are setting up institutions in Kenya include:
- Johannesburg Stock Exchange listed firm, Advtech, who is set to open a school in Tatu City under its Crawford Schools brand, offering the THRASS (Teaching, Handwriting, Reading, and Spelling Skills) education system which focuses on pre-primary education,
- South Africa based Nova Pioneer, who have set up a Primary and Secondary School in Tatu City offering the 8-4-4 curriculum, and
- Cytonn Investments, through its education affiliate Cytonn Education Services (CES), who are looking to provide education for all levels, from the Early Childhood Development Education (ECDE) to Tertiary Education, beginning with a Technical College branded, Cytonn College of Innovation and Entrepreneurship
We expect to see an increase in investment in the education sector in Sub-Saharan Africa, as investors are driven by (i) increasing demand for quality and affordable education, and (ii) support, such as ease of approvals, offered to investors in the education sector by governments looking to meet Sustainable Development Goals (SDGs) targets of universal access to tertiary education.
Real Estate Sector
- UK headquartered construction and management consultant, Turner and Townsend, acquired a 79.5% majority stake in Kenyan based Mentor Management Limited, MML, a project management company from private Equity firm Actis for an undisclosed amount. The management team of MML will retain the minority stake. For more information, see our Cytonn Weekly #6/2018
We expect that Investors will continue to show interest in Kenya’s real estate and construction industry, which is on the rise driven by (i) a high urbanization rate of 4.4% against the global average of 2.1%, leading to a rise in demand for housing, (ii) expanding middle class with increased disposable income, with the country’s disposable income having increased to Kshs 7.4 tn in 2016 from Kshs 6.5 tn in 2015 as per Kenya National Bureau of Statistic’s Economic Survey 2017, (iii) Kenya’s housing deficit of approximately 2.0 mn units with an increasing annual shortfall of 200,000 units, and (iv) better operating environment for developers, characterized by tax relief of 15.0% for developers developing more than 100 affordable housing units per annum
Fundraising
- Catalyst Principal Partners, a Nairobi Based Private Equity firm, secured a USD 15.0 mn investment from the African Development Bank (AfDB) for their Catalyst Fund II. The fund, targeting a close of USD 175.0 mn, will be deployed in the local mid-market segment across FMCG, financial services, and healthcare. AfDB being the anchor investor in Catalyst Fund I, targets a participation of 8.6% in Catalyst Fund II, while still maintaining a governance role in the fund. For more information, see our Cytonn Weekly #01/2018
Private equity investments in Africa remains robust as evidenced by the increasing investor interest, which is attributed to; (i) rapid urbanization, a resilient and adapting middle class and increased consumerism, (ii) the attractive valuations in Sub Saharan Africa’s private markets compared to its public markets, (iii) the attractive valuations in Sub Saharan Africa’s markets compared to global markets, and (iv) better economic projections in Sub Sahara Africa compared to global markets. We remain bullish on PE as an asset class in Sub-Sahara Africa. Going forward, the increasing investor interest and stable macro-economic environment will continue to boost deal flow into African markets.
The Real estate sector continues to exude signs of recovery following the end of the protracted electioneering period that saw investors adopt a wait and see attitude. In Q1’2018, the sector recorded increased activities especially across all the themes. These included; i) the 8.0% increase in cement consumption from 450,960 Metric Tonnes in December 2017 to 486,964 Metric Tonnes (MT) in January 2018 indicating an increase in construction activities, ii) Launching of new developments such as the 88 condominium in Upperhill by Lordship Africa and a Kshs 2.8 bn residential and commercial development in Kiambu County by CIC Group iii) expansion of both local and international retailers who seek to tap into the growing retail market in Kenya, with Naivas set to open its 44th outlet at Freedom Height Mall in Lang’ata and Botswanan Choppies opening its 12th Outlet in Southfield mall along Airport North Road and, iv) opening of new hotel brands such as the Hilton Garden Inn by Hilton Group near the Jomo Kenyatta International Airport in Nairobi and the announcement by DoubleTree, a brand by Global chain Hilton Group to rebrand and reopen a 109-room 4-star Hotel along Ngong’ Road,
However, the sector faces challenges such as;
- Oversupply - in some themes such as the commercial office that had an oversupply of 4.7mn SQFT in 2017, the oversupply is expected to grow by 12.8% to 5.3mn SQFT in 2018,
- Difficulty in Fundraising for Developments – following the implementation of the Banking Amendment Act, 2015 that led to a decline in private sector credit growth to an average of 2.1% as at February of 2018, from a 5- year average of 14.4%. This led to a decline in mortgages by 1.5% to 24,085 as at December of 2017,and
- High Costs of Land and Construction - The inadequate supply of land at effective prices has led to an increase in development costs making it expensive for investors to venture into the sector. On average land prices maintain a 6-year CAGR of 17.4%.
This notwithstanding we remain cautiously optimistic of positive performance of the real estate sector in the coming months. The performance of the various themes in the quarter is as explained below;
- Residential Sector
The residential sector picked up in terms of activities during Q1’2017 with the value of buildings approved at the Nairobi City Council increasing by 14.7% to Kshs 18.8 bn in December 2017 from Kshs 16.4 bn in November 2017, compared to 6.3% decrease during the same period in 2016. Out of this, 68.9% were residential developments while 31.1% were non-residential. We attribute the hike in activities to the delayed investments prior to the elections as investors adopted a wait-and-see approach then bounced back after the conclusion of the elections. We have therefore seen various developers announcing plans to undertake development during Q1’2017 including;
- Lordship Africa launched a 44-floor apartment complex, named the 88 Nairobi Condominium along Bishop Rd in Upperhill,
- CIC Group announced plans to put up a Kshs 2.8 bn housing project on a 200-acre parcel of land near Tatu City, and
- The National Government announced plans to spend over Kshs 1.0 bn to construct 744 houses for security officers.
During the quarter, there were more developments towards the agenda of low-cost and affordable housing in line with the Jubilee Government’s Affordable Housing Initiative, which is part of the Big 4 Agenda;
- Shelter Afrique announced the Top 3 winners for the “5,000 for 5,000 Housing Competition” design competition in its plan to construct 5,000 low-cost units across countries in Africa including Kenya. For more information, please see Cytonn Weekly #12/2018
- The County Government of Nairobi requested prospective partners to submit letters of interest, innovative designs and proposals for redevelopment of at least 26 slums in Nairobi, For more information, please see Cytonn Weekly #11/2018
In terms of returns performance, the sector improved marginally recording average total returns to investors of 11.0%, 0.7% points higher compared to Q4’2017 when the sector closed the year with average total returns of 10.3%. This is as the market recovered from the effect that the electioneering period had on last year’s performance. Overall, the average y/y price appreciation came in at 6.4%, 1.3% points higher compared to 5.1% recorded in Q4’2017. However, the rental yields remained fairly flat with a marginal increase of 0.3% points. The performance summary is as shown below by different classifications:
(All figures in Kshs unless stated otherwise)
|
Residential performance Summary Q1 2018 |
|||||||||||
|
Type |
Rent per SQM Q1 2017 |
Rent per SQM Q1 2018 |
Price per SQM Q1 2017 |
Price Per SQM Q1 2018 |
Occupancy Q1 2017 |
Occupancy Q1 2018 |
Rental Yield Q1 2017 |
Rental Yield Q1 2018 |
Y/Y Price Per SQM Change |
Total Returns |
Y/Y Change in Rental Yield (% Points) |
|
Detached |
578 |
602 |
135,648 |
142,013 |
78.9% |
79.0% |
3.8% |
4.2% |
4.0% |
8.2% |
0.5% |
|
Apartments |
484 |
512 |
92,750 |
100,956 |
80.8% |
82.2% |
5.0% |
5.0% |
8.9% |
13.8% |
0.0% |
|
Average |
531 |
557 |
114,199 |
121,485 |
79.8% |
80.6% |
4.4% |
4.6% |
6.4% |
11.0% |
0.3% |
|
· The market recorded a 1.3% points increase in q/q growth in price per SQM indicating a positive recovery of the market · Rental yields remained fairly flat increasing by an average of 0.3% points · Total returns came in at 11.0%, a 1.3% points increase from the 10.3% recorded during the same period in 2017 attributable to a y/y price appreciation of 6.4% as investors come back to the market after last year’s wait and see approach · Apartments performed best during the quarter with a y/y price appreciation of 8.9%, hence average returns coming in at 13.8%, compared to the market average of 6.4% |
|||||||||||
Source: Cytonn Research
- Detached Performance Summary
For our analysis, we have categorized areas into the following sub-sectors;
- High-End: This comprises of areas such as Karen, Kitisuru and Runda
- Lower-Middle: This comprises of areas such as Athi River, Donholm, Kitengela, Ngong, Juja, Ruai and Ruiru
- Upper-Middle: This comprises of areas such as Loresho, Redhill, South C, Langata and Kerarapon
(All figures in Kshs unless stated otherwise)
|
Performance Summary: Detached |
|||||||||||
|
Zone |
Price per SQM Q1 2017 |
Price Per SQM Q1 2018 |
Rent per SQM Q1 2017 |
Rent per SQM Q1 2018 |
Occupancy Q1 2017 |
Occupancy Q1 2018 |
Rental Yield Q1 2017 |
Rental Yield Q1 2018 |
Y/Y Price Per SQM Change |
Total Returns |
Change in Rental Yield Y/Y (% Points) |
|
High-End |
231,135 |
244,247 |
887 |
925 |
83.0% |
88.5% |
3.8% |
4.0% |
5.7% |
9.7% |
0.2% |
|
Upper Middle |
104,367 |
109,295 |
434 |
536 |
79.0% |
77.3% |
3.9% |
4.6% |
4.7% |
9.3% |
0.6% |
|
Lower-Middle |
71,442 |
72,497 |
278 |
346 |
74.7% |
71.1% |
3.5% |
4.1% |
1.5% |
5.5% |
0.6% |
|
Average |
135,648 |
142,013 |
533 |
602 |
78.9% |
79.0% |
3.8% |
4.2% |
4.0% |
8.2% |
0.5% |
|
· Upper mid end zones recorded the best performance with average rental yields of 4.6% and year-on-year price increment of 4.7% and hence total returns of 9.3% compared to a market average of 8.2%, attributable to the expanding middle class · High end areas such as Kitisuru and Karen, recorded a high price growth y/y of 5.7% compared to the market average of 4.0% as investor appetite resumes following a more peaceful political climate and a recovering macroeconomic environment · The lower middle areas which included areas like Juja, Athi River and Donholm, recorded a marginal upward price change of 1.5% as relatively affordable housing found in these areas gains traction as (i) private developers are lured by government incentives such as the 50% cut on corporate tax for those who put up 100 units and above p.a, as well as the huge housing deficit for the low income population spectrum; and (ii) clients looking for affordability |
|||||||||||
Source: Cytonn Research
- Apartments Performance Summary
For our analysis, we have categorized areas into the following sub-sectors;
- Upper-Middle: This comprises of areas such as Kilimani, Kileleshwa, Riverside, Spring Valley, Loresho and Westlands
- Lower-Middle Suburbs: This comprises of areas such as Embakasi, Donholm, Imara Daima, Kahawa Wendani, Kahawa West and South B
- Lower-Middle Satellite areas: This comprises of areas such as Athi River, Ruaka, Ruiru, Kitengela, Kikuyu, Juja, Kinoo and Uthiru
(All figures in Kshs unless stated otherwise)
|
Performance Summary: Apartments |
|||||||||||
|
Zone |
Rent per SQM Q1 2017 |
Rent per SQM Q1 2018 |
Price per SQM Q1 2017 |
Price Per SQM Q1 2018 |
Occupancy Q1 2017 |
Occupancy Q1 2018 |
Rental Yield Q1 2017 |
Rental Yield Q1 2018 |
Y/Y Price Per SQM Change |
Total Returns |
Y/Y Change in Rental Yield (% Points) |
|
Lower-Middle Suburbs |
401 |
427 |
89,900 |
94,779 |
87.1% |
84.3% |
4.7% |
4.6% |
5.4% |
10.0% |
(0.1%) |
|
Lower-Middle Satellite |
370 |
412 |
73,080 |
81,286 |
75.9% |
75.4% |
4.6% |
4.6% |
11.2% |
15.8% |
0.0% |
|
Upper-Middle |
680 |
695 |
115,270 |
126,803 |
79.3% |
86.9% |
5.6% |
5.7% |
10.0% |
15.7% |
0.1% |
|
Average |
484 |
512 |
92,750 |
100,956 |
80.8% |
82.2% |
5.0% |
5.0% |
8.9% |
13.8% |
0.0% |
|
· Satellite towns had the best performance for apartments with average returns to investor of 15.8%. This is as satellite towns such as Ruiru, Ruaka, Kikuyu and Athi River gain traction with home buyers due to affordable land prices, a serene environment and accessibility to the CBD, Westlands and Upperhill nodes where most people work · Upper middle areas had the best rental yields of 5.7% compared to the market average of 5.0% as areas like Kilimani and Westlands attract premium rents from the upper middle income population and expatriates due to (i) proximity to main commercial hubs such as Westlands, CBD and Upperhill (ii) presence of social amenities such as malls, schools and hospitals and (iii) good infrastructure such as tarmacked roads and sewer systems |
|||||||||||
Source: Cytonn Research
The market’s performance in Q1’2018 shows a positive recovery from 2017’s performance with an average price appreciation of 6.4% compared to 5.1% recorded at the end of 2017. We expect better performance to continue in 2018 given the positive fundamentals that continue to support the sector such as: (i) positive demographic trends that drive demand for housing, (ii) Increased investor appetite due to the constantly growing housing deficit and government incentives such as 50% tax cut for developers of at least 100 units annually and the slashing of statutory fees such as NEMA and NCA, and (iii) continued infrastructural development
- Commercial Sector
- Office
The performance of commercial office sector in Nairobi in 2017 softened as a result of i) an oversupply that stood at 4.7mn SQFT, a 62.1% increase from the 2.9mn SQFT recorded in 2016 ii) a decline in demand as a result of the protracted electioneering period that prompted investors to adopt a wait-and-see attitude, and (iii) low credit supply as a result of the implementation of Banking Amendment Act, 2015 that led to a decline in the private sector credit growth rate from a 5-year average of 14.4% to an average of 2.1% as at February 2018. The slowdown in performance persisted in Q1’2018 with occupancy rates reducing by 2.7% points q/q and rents declining by 1.1% q/q. The yields declined marginally by 0.04% points q/q as summarized in the table below.
(All figures in Kshs unless stated otherwise)
|
Nairobi Commercial Office Performance Summary Over Time |
|||||
|
Year |
FY’2015 |
FY’2016 |
FY’2017 |
Q1’2018 |
Q/Q ∆ 2018 |
|
Occupancy (%) |
89.0% |
88.0% |
83.2% |
80.5% |
(2.7% Points) |
|
Asking Rents (Kshs/SQFT) |
97 |
97 |
99 |
98 |
(1.1%) |
|
Average Prices (Kshs/SQFT) |
12,776 |
12,031 |
12,595 |
12,718 |
1.0% |
|
Average Rental Yields (%) |
9.3% |
9.3% |
9.2% |
9.2% |
0.0% |
|
· Occupancy rates in Q1’2018 softened by 2.7% points to average at 80.5% from 83.2% in FY 2017. The decline was as a result of the oversupply office space of 4.7mn SQFT recorded in 2017 and expected to grow by 12.8% to 5.3 mn SQFT in 2018 · The asking rents also softened slightly reducing by 1.1% points q/q resulting in a decline in yields of 0.04% points q/q · Going forward, we expect the market to soften further with yields averaging at 9.0% for 2018, and we thus expect to witness a reduction in development activity especially of purely commercial office buildings |
|||||
Source: Cytonn Research 2018
In terms of Nairobi submarket performance, for Q1’2018, as was the case in FY 2017, Parklands was the best performing submarket with average rental yields of 9.7% followed by Westlands and Karen with average rental yields of 9.6% each, the high yields are as a result of high quality office spaces and prime locations enabling developers in the submarkets to charge prime rents. The worst performing nodes were the Nairobi CBD and Mombasa Road, which recorded average rental yields of 8.7% and 8.5%, respectively. The low performance is attributable to the low quality office spaces in these nodes with most of the commercial offices being low quality Grade B and Grade C offices, and congestion, the CBD by both human and vehicular traffic and Mombasa Road by traffic snarl ups.
The table below shows the performance per submarket overtime but with an emphasis on Q1’2018:
(All figures in Kshs unless stated otherwise)
|
Nairobi Commercial Office Performance by Nodes Q1 2018 |
||||||||||||
|
Area |
Price Kshs/ SQFT Q1 2018 |
Rent Kshs/SQFT Q1 2018 |
Occupancy % Q1 2018 |
Rental Yield (%) Q1 2018 |
Price Kshs/ SQFT FY 2017 |
Rent Kshs/ SQFT 2017 |
Occupancy % 2017 |
Rental Yield % 2017 |
Q/Q ∆ in Rent |
Q/Q ∆ in Yield |
Q/Q ∆ Occupancy |
|
|
Parklands |
12,700 |
103 |
82.1% |
9.7% |
12,729 |
103 |
85.7% |
9.7% |
(0.3%) |
0.0% |
(3.6%) |
|
|
Westlands |
13,050 |
107 |
86.4% |
9.6% |
12,872 |
103 |
88.5% |
9.4% |
3.9% |
0.2% |
(2.1%) |
|
|
Karen |
13,250 |
109 |
87.3% |
9.6% |
13,167 |
113 |
89.2% |
9.5% |
(3.8%) |
0.1% |
(1.9%) |
|
|
Kilimani |
12,604 |
99 |
81.5% |
9.3% |
12,901 |
101 |
84.5% |
9.5% |
(2.0%) |
(0.2%) |
(3.0%) |
|
|
UpperHill |
13,167 |
100 |
79.8% |
9.2% |
12,995 |
99 |
82.0% |
9.0% |
0.8% |
0.2% |
(2.2%) |
|
|
Thika Road |
13,250 |
95 |
73.7% |
8.8% |
11,500 |
82 |
73.6% |
8.5% |
16.3% |
0.3% |
0.0% |
|
|
Nairobi CBD |
11,800 |
87 |
76.5% |
8.7% |
12,286 |
88 |
84.1% |
8.7% |
(1.7%) |
0.0% |
(7.6%) |
|
|
Msa Road |
11,925 |
84 |
76.8% |
8.4% |
11,641 |
82 |
74.2% |
8.5% |
2.4% |
(0.1%) |
2.6% |
|
|
Average |
12,718 |
98 |
80.5% |
9.2% |
12,679 |
99 |
83.2% |
9.2% |
(1.1%) |
(0.1%) |
(2.7%) |
|
|
· Parklands, Westlands and Karen recorded the best performance with average rental yields of 9.7% and 9.6%, respectively, and occupancy rates of 85.7%, 88.5% and 89.2%, respectively. The high returns are as a result of high quality office spaces in these areas and their prime locations enabling developers to charge prime rents · The worst performing nodes are the Nairobi CBD and Mombasa Road with average rental yields of 8.7% and 8.5%, respectively mainly due to low quality office spaces and congestion by both human and vehicular traffic |
||||||||||||
Source: Cytonn Research 2018
The main highlight in the commercial office sector in Q1’2018 was the announcement by retirement benefits fund, Zamara Umbrella Solutions (formerly Alexander Forbes) of plans to build a 16 and 30-floor, twin tower in Westlands. The Mixed Use Development will feature retail as well as commercial office space. The development which is expected to commence in H1’2018 will be situated at the junction of Peponi Rd and General Mathenge Rd.
- Retail
During Q1’2018, retailers retained a bullish outlook on the Kenyan retail market driven by high demand, which is boosted by demographics such as i) rapid population growth at 2.6% as compared to global averages of 1.2%, ii) high urbanization rate of on average 4.4% against a global average of 2.1%, iii) an expanding middle class with increased purchasing power due to higher disposable incomes that rose by 15.8% from Kshs 5.7 tn in 2015 to Kshs 6.6 tn in 2016, according to the KNBS Economic Survey 2017, that facilitates sustained demand, iv) changing tastes and preferences that incline towards quality and international brands, and (v) infrastructural development that has made it possible to invest in other areas away from Nairobi’s CBD .
This positive outlook translated in increased activity by both local and international retailers who opened new branches as they seek to tap into the sector as expounded below;
- French-based retailer, Carrefour, opened a 4th outlet at the Junction Mall on a Gross Lettable Area (GLA) of 14,000 SQFT and announced plans to open another retail store in the Sarit Centre Shopping Mall in April 2018,
- Naivas Supermarket announced plans to open its 44th outlet at Freedom Height Mall in Lang’ata occupying a GLA of 18,000 SQFT by May 2018,
- South African retailer, Shoprite, announced that it had secured space in 7 prime malls in Kenya, with lease agreements already concluded for the Westgate Mall and the Garden City Mall in Westlands and Thika Road, respectively, with the stores set to be opened in 2018,
- Choppies, the Botswanan retailer, opened its 12th outlet at Southfield mall along Airport North Road and also took up space in Nanyuki Mall, and,
- Chinese retailer, Miniso, a low-cost variety store chain that specializes in household and consumer goods including cosmetics, stationery, toys, and kitchenware, opened its first branch in Kenya at the Village Market, with plans to open another at the Thika Road Mall, in the space vacated by Woolworths.
Performance
In Q1’2018, the retail sector performance softened, with occupancy rates declining by 0.2% points q/q from 80.3% in FY 2017 to 80.1% in Q1’2018. The rents increased by 2.0% points q/q, resulting in a 0.2% point decline in rental yields from 9.6% in FY 2017 to 9.4% in Q1’2018 attributable to decline in occupancy rates due to increased retail space supply, currently growing at a 7-year CAGR of 16.9%.
(All figures in Kshs unless stated otherwise)
|
Summary of Retail Market Performance in Nairobi Over Time |
|||||
|
Item |
H1’2017 |
Q3’2017 |
FY’2017 |
Q1’2018 |
∆ Q1’2018 |
|
Asking Rents (Kshs/SQFT) |
190 |
189 |
185 |
188 |
2.0% |
|
Occupancy (%) |
83.1% |
81.4% |
80.3% |
80.1% |
(0.2) % points |
|
Average Rental Yields |
10.2% |
9.8% |
9.6% |
9.4% |
(0.2) % points |
|
· The retail sector performance softened, recording an average rental yield of 9.4%, a 0.2% point decline from 2017. The occupancy rates as well declined by 0.2% points, while the rental charges increasing by 2.0% over the quarter. · The decrease in occupancy rates is attributable to increase in mall supply in the market with entry of malls such as Southfield Mall along Airport North Road and Ciata Mall along Kiambu Road, among others. · The increase in rental charges are driven by the recovery of the market from the tough economic environment and the prolonged electioneering period in Q3’2017 and Q4’2017. |
|||||
Source: Cytonn Research
The retail sector outlook remains positive given the continued expansion of local supermarkets and the entry of foreign brands that will boost uptake of malls and other retail spaces, positive demographics that will boost demand and recovery of the market from the tough economic environment and the prolonged electioneering period in Q3’2017 and Q4’2017.
- Hospitality Sector
The hospitality sector continued to witness increased activities in Q’1 2018, following the end of the prolonged electioneering period that adversely affected the sector according to Cytonn Hospitality Report 2017, recording a 24.0% decline in Revenue per Available Room (RevPAR), which came in at Kshs 8,286.0 in 2017 compared to Kshs 10,897.2 in 2016. However, there has been restored investor confidence after the elections, as evidenced by hotel openings and acquisitions including;
- The opening of Hilton Garden Inn along Mombasa Road in February this year. The 4-star hotel, brings to the market 171-rooms,
- DoubleTree, a brand by Global chain Hilton Group, rebranded and reopened a 109-room 4-star Hotel along Ngong’ Road, previously known as Amber Hotel. This marked the brand’s third hotel chain in Nairobi, with the others being Hilton Hotel in the CBD and Hilton Garden Inn along Mombasa Road,
- Sarova Group of Hotels announced plans to take over the management of the Spirit of the Mara Lodge in a 15-year partnership agreement. The hotel located in Siana Conservancy overlooking the Mara, has 10-suites each having a lounge and sleeping area and,
- Refurbishment of Sarova Panafric Hotel, Nairobi, which first opened in 1965 and has 162 keys.
The above is a clear indication of the attractiveness of the sector and will result in; i) better accommodation and service standards, as hotels rebrand or improve their facilities where they have depreciated over time, so as to remain competitive in the wake of stiff competition from global brands such as Radisson Blu and Mariott, and ii) increased room capacity to meet the growing demand for accommodation as seen in the increase in tourist arrivals to 1.5 mn in 2017 compared to 1.3 mn in 2016, according to the Kenya National Bureau of Statistics Economic Survey Report 2017.
In addition to the increased investment in the sector, various flight operations are likely to boost the hospitality sector, such as:
- Kenya Airways announced plans to start operations between Kenya and Mauritius offering four weekly flights by June this year. The route is expected to complement Air Mauritius’ existing operations,
- Jambojet increased the frequency of its local flights per week to 39 up from 22, while Kisumu-Nairobi flights increased to 14 from the previous 8, attributed to increased demand,
- The launch of direct flights to the US from Kenya where Kenya Airways will be operating daily flights to and fro New York and Nairobi, and will see the trip time reduce by about 8 hours, to 15 hours from the previous 23 hours.
On serviced apartments, Executive Residency by Best Western Nairobi received the Best Property 21 to 70 Units Award at the Serviced Apartments Awards 2018, held at Grange Hotel Tower Bridge in London. The serviced apartment development, which is situated along Riverside Drive, came into the market in November 2016 and is currently the only internationally branded serviced apartment development in Kenya, showing the opportunity in the provision of international-grade serviced apartment facilities.
We, therefore, project further growth in the hospitality sector as a result of i) restoration of political calm, ii) the revision of negative travel advisories, warning international citizens, e.g. from the United States against visiting Kenya, iii) positive reviews from travel advisories such as Trip Advisor who ranked Nairobi as the 3rd best place to visit in 2018, only behind Ishigaki Island in Japan and Kapaa in Hawaii, and The Travel Corporation who ranked travel to Kenya as one of the top 10 transformative travel experiences in the world, iv) improved hotel standards as hotels rebrand while some embark on refurbishment and expansion, and v) improved flight operations and systems such as direct flights from the USA introduced earlier this year.
- Listed Real Estate
Stanlib Fahari I-REIT released their FY’2017 earnings, registering a 61.0% growth in earnings to Kshs 0.95 per unit from Kshs 0.59 per unit in FY’2016, attributable to a 24.8% decline in fund management expenses to Kshs 135.6 mn from Kshs 180.4 mn in FY’2016 and a 12.4% increase in rental income to Kshs 279.4 mn from Kshs 248.6 mn in FY’2016 from the 3 real estate assets they own; Greenspan Mall, Bay Holdings and Signature International Properties. The decline in expenses was because of the one-off set up and listing costs such as promotional and marketing expenses incurred in H1’2016 while the increase in revenues was a result of the additional income from 2 of the properties that were acquired mid-2016. In addition, the I-REIT had no debt in FY’2017, thus no financing costs compared to the previous period, which had Kshs 23.4 mn in financing costs. The I-REIT manager has recommended the distribution of a first and final dividend of Kshs 135.7 mn in earnings to unit holders at Kshs 0.75 per unit bringing the dividend yield to 6.5% of market price as at 29th March 2018, up from 4.3% dividend yield at Kshs 0.50 per unit at the last distribution. Despite the increase, the yield is still relatively low compared to brick and mortar assets with commercial retail and office achieving rates of 9.4% and 9.2%, respectively as shown below;
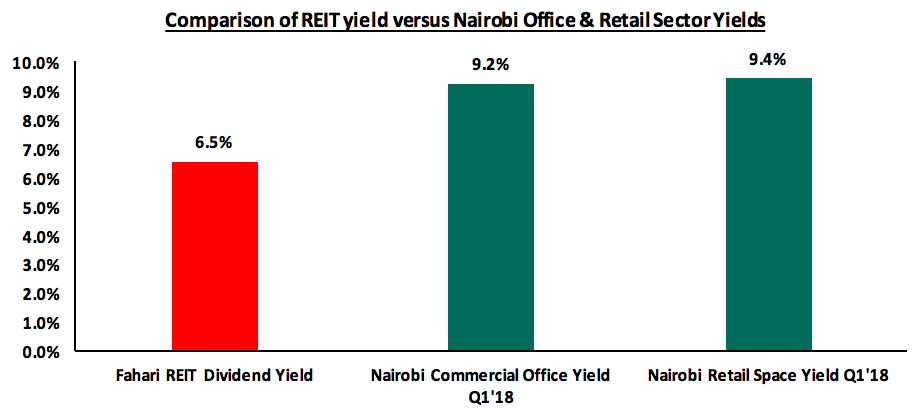
Source: Cytonn Research 2018
For a more comprehensive analysis on the REIT FY’2017 performance, see our Stanlib Fahari I-REIT Earnings Note.
On the bourse, during Q1’2018, Stanlib’s Fahari I-REIT price rose by 10.5%, closing at Kshs 11.6 from Kshs 10.5 at the beginning of the year. The share price peaked after the release of the FY’2017 report indicating a 61.0% growth in earnings and a 50.0% growth in dividends per share. Notwithstanding, the REIT traded at an average unit price of Kshs 10.5 in Q1’2018, 49.5% lower than its listing price of Kshs 20.0 in November 2015. In addition, Fahari I-REIT is trading at a 42.9% discount to its net asset value of Kshs 20.3 as per FY’2017 reporting and we attribute this to the negative market sentiments around REITs performance. Important to note is that the Fahari I-REIT was required by the Capital Markets Authority (CMA) to increase its real estate assets to reach 75.0% of its total assets, or an equivalent of Kshs 245.0 mn by 31st March 2018. With effect to this, the REIT fund-manager has recently announced plans for acquisition of 330-Gitanga Road, a Grade A low rise office in Lavington, whose developer is Acorn Group, at Kshs 850.0 mn. The ability of the developer of the office block to exit to a fund is a good indicator that there is institutional appetite for investment grade real estate. However, the purchase is subject to approval by the Capital Markets Authority and unit holders and the transaction is set to be complete in Q2’2018.
In general low performance of REITs is attributed to i) opacity of the exact returns from the underlying assets, ii) the negative sentiments currently engulfing the sector given the poor performance of Fahari and Fusion REIT (FRED), iii) inadequate investor knowledge, and iv) lack of institutional support for REITs. We expect the REIT to continue trading at low prices and in low volumes. The graph below shows the REIT’s performance in Q1’2018;
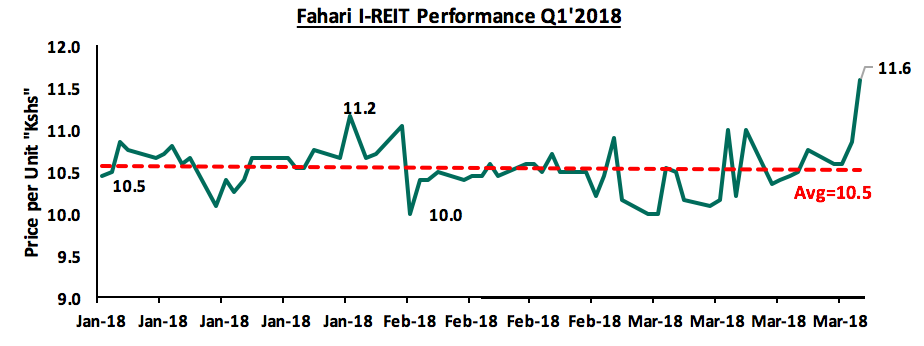
Source: Bloomberg
We remain cautiously optimistic about the positive performance of the real estate sector driven by: positive demographic trends such as: rapid urbanization that currently stands at 4.4% against a global average of 2.1%, rapid population growth rates of 2.6% against a global average of 1.2%, sustained infrastructural development, with the government set to build 10,000 kms of road networks in the next 5-years which will open up areas for real estate development and a better operating environment due to political calm after the end of the extended electioneering period.
Disclaimer: The views expressed in this publication, are those of the writers where particulars are not warranted. This publication, which is in compliance with Section 2 of the Capital Markets Authority Act Cap 485A, is meant for general information only, and is not a warranty, representation, advice or solicitation of any nature. Readers are advised in all circumstances to seek the advice of a registered investment advisor.

- Talk to us
- Kenya
- P.O Box 20695 - 00200, Nairobi, Kenya
- Cell +254709101200
- Tel +254709101200
- WhatsApp +254741676635
- United States
- +254709101200
- DOWNLOAD OUR APP
-


- Kenya
- 8th Floor, Pinetree Plaza, Kaburu Drive, Ngong Road, Nairobi, Kenya
- USA
- Suite 1150, 1775 Eye Street NW, USA, Washington DC 20006, USA
- Investments
- High Yield
- Private Equity
- Real Estate
- Real Estate
- RiverRun Estates
- Cytonn Towers
- The Ridge
- Taraji Heights
- The Alma