Cytonn Q3’2022 Markets Review
By Cytonn Research, Oct 2, 2022
Executive Summary
Global Markets Review
According to the United Nations, the global economy is projected to expand by between 2.5% and 2.8% in 2022, a substantial decline from its earlier forecast of 3.1% in May 2022. The downward revision is majorly attributable to sustained disruptions in supply chains exacerbated by the ongoing conflict in Ukraine which has greatly impacted trade. The disruptions spiked the cost of shipping goods raising consumer prices worldwide. Global price inflation has resulted in a high cost of living, with central banks in majority of economies raising interest rates in an attempt to anchor the inflation. Consequently, the rising borrowing costs and tightened monetary stances in advanced economies have brought disorder in financial markets and significant capital outflows from emerging economies as investors prefer to hold their cash or invest in fixed income securities in the developed economies;
Sub-Saharan Africa Regional Review
According to the International Monetary Fund (IMF), the Sub Saharan economy is projected to grow at a rate of 3.8% in 2022. The projection remains unchanged from the initial April projection of 3.8%, and significantly lower than the 4.6% growth rate recorded in 2021. The downward revision comes on the back of sustained supply constraints, worsened by persistent geopolitical pressures given that most countries in the Sub-Saharan Africa are net importers;
In Q3’2022, most of the selected Sub-Saharan currencies continued to depreciate against the US Dollar, maintaining the trend witnessed in H1’2022, attributable to the increased inflationary pressures in majority of the countries due to negative spillover effects of inflated prices of fuel and other commodities. Additionally, the Sub-Saharan Africa (SSA) stock markets recorded mixed performance with most markets recording negative returns due to increased selloffs, following interest rate hikes in advanced economies such as USA and Europe;
Kenya Macroeconomic Environment
The Kenyan Economy is projected to grow at an average of 5.1% in 2022 lower than the 7.5% growth recorded in 2021 amid the elevated inflationary pressures, persistent geopolitical pressures and erratic weather conditions. Notably, Q3’2022 saw increased inflationary pressures with the average inflation rate increasing to 8.7%, compared to 6.7% in Q3’2021, largely attributable to a rise in food and fuel prices stemming from persistent supply bottlenecks. This was reflected in the business environment, which deteriorated noticeably as consumers cut back on spending, with the average Stanbic Purchasing Managers Index (PMI) coming in at 45.3 in Q3’2022, compared to 50.7 recorded in the same period in 2021;
Fixed Income
During Q3’2022, T-bills remained undersubscribed with the overall subscription rate coming in at 90.8% up from 78.1% in Q2’2022, partly attributable to the tightened market liquidity, which saw the average interbank rate increase to 5.2% from 4.8% in Q2’2022. The Overall subscription for the 91-day and 182-day increased to 304.9% and 64.9% from 127.6% and 58.1% in Q2’2022, respectively, while the 364-day declined to 31.1% from 78.3% recorded in Q2’2022. The acceptance rate for the quarter declined to 87.0% from 91.9% in Q2’2022, with the government accepting a total of Kshs 246.4 bn of the Kshs 283.3 bn worth of bids received during the quarter. The yields on the government papers were on an upward trajectory during the quarter, with the yields on the 364-day, 182-day and 91-day papers increasing by 8.2 bps, 77.0 bps and 91.9 bps to 9.9%, 9.4% and 8.6%, respectively;
During the week, T-bills remained undersubscribed, with the overall subscription rate declining to 38.8%, from the 46.6% recorded the previous week. The undersubscription was partly attributable to the tightened liquidity in the money market, with the average interbank rate increasing to 5.6% from 4.5% recorded in the previous week. Investor’s preference for the shorter 91-day paper persisted, with the paper receiving bids worth Kshs 5.1 bn against the offered Kshs 4.0 bn, translating to a subscription rate of 128.2% up from 117.8% recorded the previous week. The subscription rate for the 364-day paper also increased to 11.3% from 10.4% while that of the 182-day declined to 30.5% from 54.3%, recorded the previous week. The yields on the government papers recorded mixed performance, with the yields on the 182-day and 91-day papers increasing by 0.6 bps and 0.1 bps to 9.6% and 9.0%, respectively, while the yield on the 364-day paper declined by 0.4 bps to 9.9%;
Equities
During Q3’2022, the equities market was on an upward trajectory, with NASI, NSE 20 and NSE 25 gaining by 3.2%, 6.5% and 5.0%, respectively, taking their YTD performance to losses of 23.2%, 10.3% and 17.4% for NASI, NSE 20 and NSE 25 respectively. The equities market performance during the quarter was driven by gains recorded by large cap banking stocks such as NCBA which gained by 28.4% as well as ABSA and Standard Chartered Bank (SCBK) of 9.6% each, while Co-operative Bank gained by 8.7%. The gains were however weighed down by losses recorded by other large cap stocks such as Bamburi of 0.7%. During Q3’2022, listed banks in Kenya released their H1’2022 results, recording a 34.0% weighted average growth in core Earnings per Share (EPS), compared to a weighted average increase of 136.0% in H1’2021. The performance was largely driven by the strong EPS growth from NCBA and Co-operative Bank of 66.9% and 55.7%, respectively;
Real Estate
In Q3’2022, the Real Estate industry recorded substantial improvement in activity and performance compared to a similar period last year. This was mainly driven by favorable economic environment in addition to the peaceful electioneering period which boosted investor confidence in the sector and consequently improved Real Estate transactions. The Nairobi Metropolitan Area (NMA) residential sector recorded improved performance with a 0.4% points y/y increase in average total returns to 5.9%, from 5.5% recorded in Q3’2021. In the commercial office sector, the average rental yield slightly increased by 0.1% points to 7.4% in Q3’2022, from 7.3% that was recorded in FY’2021, mainly driven by an increase in the average rental rates, while the average rental yield for retail spaces declined by 0.2% points to 7.6%, from 7.8% in FY’2021. The performance was mainly on the back of a decline in the average occupancy rate during the period under review. For land, the average selling prices recorded an overall improvement in performance with the y/y capital appreciation coming in at 1.6%;
Investment Updates:
- Weekly Rates:
- Cytonn Money Market Fund closed the week at a yield of 10.55%. To invest, dial *809# or download the Cytonn App from Google Playstore here or from the Appstore here;
- Cytonn High Yield Fund closed the week at a yield of 13.91% p.a. To invest, email us at sales@cytonn.com and to withdraw the interest, dial *809# or download the Cytonn App from Google Playstore here or from the Appstore here;
- We continue to offer Wealth Management Training every Wednesday and every third Saturday of the month, from 9:00 am to 11:00 am, through our Cytonn Foundation. The training aims to grow financial literacy among the general public. To register for any of our Wealth Management Trainings, click here;
- If interested in our Private Wealth Management Training for your employees or investment group, please get in touch with us through wmt@cytonn.com;
- Any CHYS and CPN investors still looking to convert are welcome to consider one of the five projects currently available for assignment, click here for the latest term sheet;
- Cytonn Insurance Agency acts as an intermediary for those looking to secure their assets and loved ones’ future through insurance namely; Motor, Medical, Life, Property, WIBA, Credit and Fire and Burglary insurance covers. For assistance, get in touch with us through insuranceagency@cytonn.com;
- Cytonnaire Savings and Credit Co-operative Society Limited (SACCO) provides a savings and investments avenue to help you in your financial planning journey. To enjoy competitive investment returns, kindly get in touch with us through clientservices@cytonn.com;
- For an exclusive tour of Cytonn’s real estate developments, visit: Sharp Investor's Tour, and for more information, email us at sales@cytonn.com;
- Phase 3 of The Alma is now ready for occupation and the show house is open daily. To rent please email properties@cytonn.com;
- We have 8 investment-ready projects, offering attractive development and buyer targeted returns; See further details here: Summary of Investment-ready Projects;
- For Third Party Real Estate Consultancy Services, email us at rdo@cytonn.com;
- For recent news about the group, see our news section here;
Hospitality Updates:
- We currently have promotions for Staycations. Visit cysuites.com/offers for details or email us at sales@cysuites.com;
Global Economic Growth:
According to the United Nations, the global economy is projected to expand by between 2.5% and 2.8% in 2022, a substantial decline from its earlier forecast of 3.1% in May. The downward revision is majorly attributable to;
- Pre-existing supply chain disruptions worsened by the ongoing conflict in Ukraine which have greatly impacted global food and fuel supplies,
- The persistent inflationary pressures which have seen several central banks raise their interest rates with the aim of anchoring inflation, and,
- The rising borrowing costs and worsening liquidity which has continued to worsen conditions in emerging economies at a time when more funding is needed.
As a result of the ongoing disruptions in supply chain, as well as the imminent debt crisis, emerging economies are anticipated to record subdued growth in the fourth quarter.
Global Commodities Market Performance:
Global commodity prices registered mixed performance in Q3’2022, with the energy prices increasing the most by 78.9% year on year, mainly due the persistent supply chain bottlenecks coupled with increasing demand for gas. Below is a summary performance of various commodities
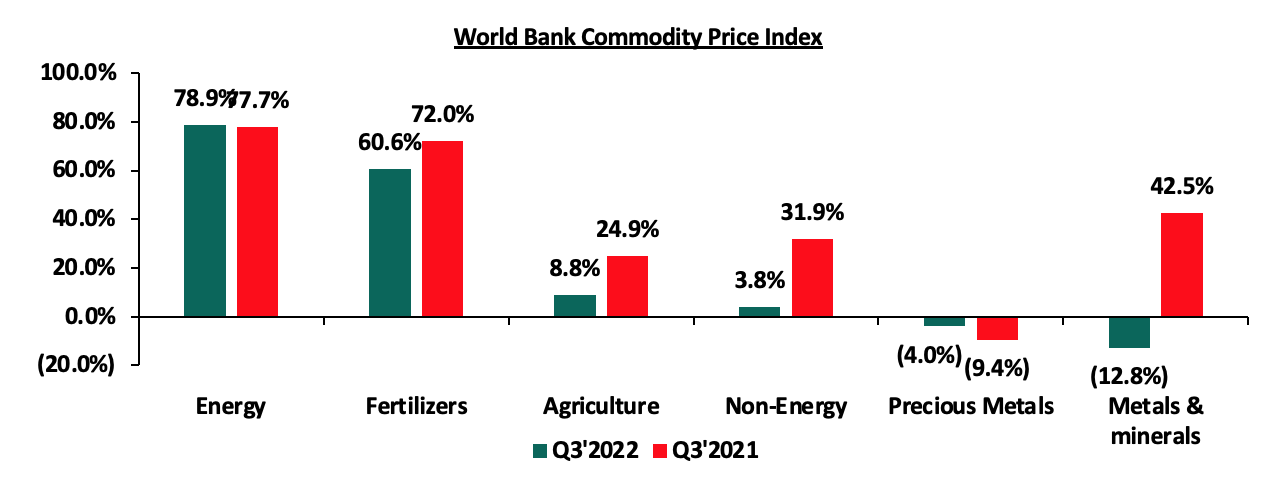
Source: World Bank
Global Equities market performance:
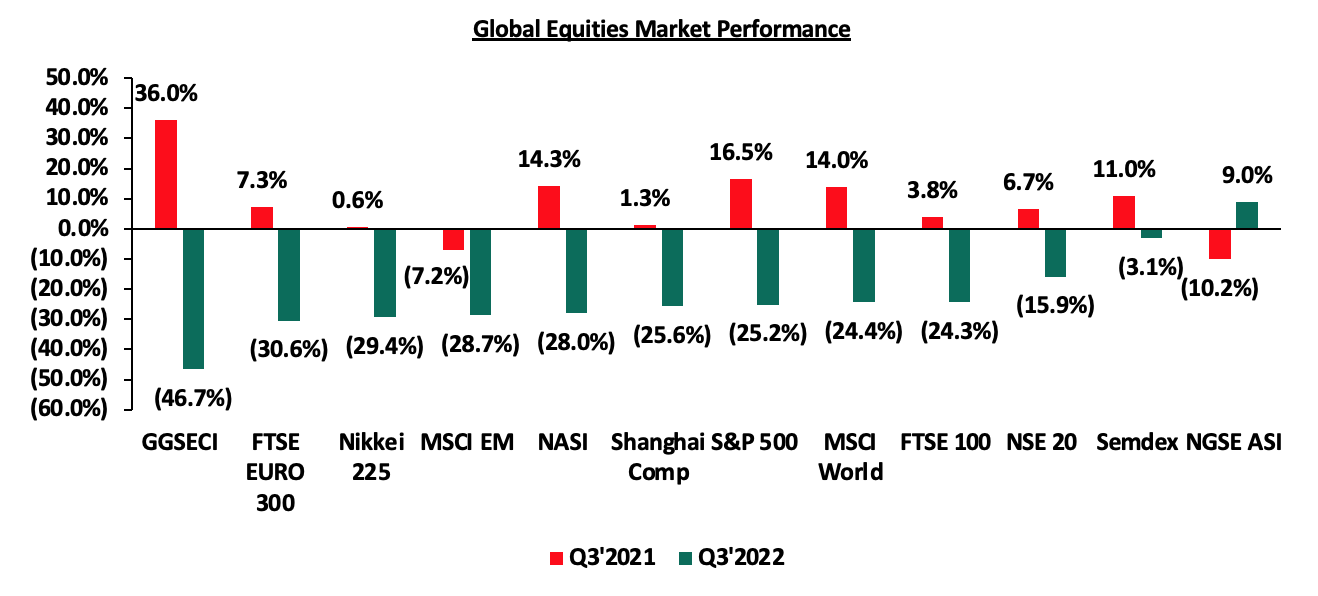
Global stock market recorded mixed performance in Q3’2022, with most indices declining, attributable to cash outflows from the equities market to the fixed income docket. The flooding in the fixed income and other investments alternatives has been driven by the elevated inflationary pressures world over which has led to an increase in interest rates. The Nigeria all share index was the only gainer, recording a 9.0% year to date gain as at 30th September 2022, largely driven by increased investor sentiments following the rallying of crude oil prices, with Nigeria being a net exporter. Ghana stock composite index was the largest decliner recording losses of 46.7% year to date, partly due to the re-imposition of capital gains tax on securities listed on the GSE, which has seen investors prefer fixed income securities. Below is a summary of the performance of key indices:
According to the International Monetary Fund (IMF), the Sub Saharan economy is projected to grow at a rate of 3.8% in 2022. The projection remains unchanged from the initial April projection of 3.8%, and significantly lower than the 4.6% growth rate recorded in 2021. The downward revision comes on the back of sustained supply constraints, worsened by persistent geopolitical pressures given that most countries in the Sub-Saharan Africa are net importers. The challenges have continued to exacerbate fiscal deficits in most countries leading to increased debt sustainability concerns in Sub-Saharan Africa as the region’s public debt to GDP ratio increased to 61.0% in 2021, from 60.0% in 2020. The public debt is expected to remain high due to increased debt serving costs coupled with continued currency depreciations and increased interest rates in developed economies.
Currency Performance
In Q3’2022, most of the selected Sub-Saharan currencies continued to depreciate against the US Dollar, mainly due to the increased inflationary pressures in majority of the countries on the back of persistent supply chain constraints. The Ghanaian Cedi was the largest decliner YTD and over the last twelve months, losing 66.1% and 67.8%, respectively, mainly as a result of a deteriorated macro-economic environment, characterized by high inflation which stood at 33.9% in August 2022, against the Ghana Central Bank target rate of 6.0 - 10.0%. Ghana also continues to face debt sustainability concerns with public debt to GDP ratio coming in at 84.6% as of July 2022, coupled with a downgrade of Ghana’s credit outlook ratings by both Moody and Fitch to negative. The Zambian kwacha was the only currency which appreciated against the US Dollar, gaining by 5.9% year to date, mainly attributable to positive investor confidence following Zambia’s improved macroeconomic performance and strong trade surplus driven by higher copper price earnings. Key to note, the Kenya Shilling depreciated by 6.7% in Q3’2022 to close at Kshs 120.7 against the US Dollar, compared to Kshs 113.2 recorded at the beginning of the year. Below is a table showing the performance of select African currencies:
|
Select Sub Saharan Africa Currency Performance vs USD |
|||||
|
Currency |
Sep-21 |
Jan-22 |
Sep-22 |
Last 12 Months change (%) |
YTD change (%) |
|
Zambian Kwacha |
16.7 |
16.7 |
15.8 |
6.0% |
5.9% |
|
Tanzanian Shilling |
2303.9 |
2,304.5 |
2,327.0 |
(1.0%) |
(1.0%) |
|
Mauritius Rupee |
42.4 |
43.6 |
45.6 |
(7.5%) |
(4.6%) |
|
Nigerian Naira |
410.2 |
412.4 |
431.9 |
(5.3%) |
(4.7%) |
|
Kenyan Shilling |
110.5 |
113.1 |
120.7 |
(9.2%) |
(6.7%) |
|
Ugandan Shilling |
3543.6 |
3,544.6 |
3,851.3 |
(8.7%) |
(8.7%) |
|
Botswana Pula |
11.3 |
11.7 |
13.3 |
(17.9%) |
(13.7%) |
|
South African Rand |
15.0 |
15.9 |
18.1 |
(20.4%) |
(13.8%) |
|
Malawian Kwacha |
815.2 |
816.8 |
1,008.8 |
(23.7%) |
(23.5%) |
|
Ghanaian Cedi |
6.0 |
6.1 |
10.1 |
(67.8%) |
(66.1%) |
Source: S&P Capital
African Eurobonds
Africa’s appetite for foreign-denominated debt has declined in recent times as no country issued a bond during Q3’2022, with most countries shying away from the Eurobonds market due to sustained high yields translating to high borrowing costs. The significant increase in yields is partly attributable to investors attaching higher risk premium on the Sub-Saharan Countries issues, driven by increased inflationary pressures, and continued depreciation of local currencies on the back of persistent supply chain constraints, as well as sustained debt unsustainability concerns. Yields on the Kenyan and Senegal Eurobonds increased in Q3’2022 by 11.3% points and 7.3% points to 15.7% and 9.7%, from 4.4% and 2.4%, respectively, recorded at the end of December 2021. Below is a 5-year graph showing the Eurobond secondary market performance of select 10-year Eurobonds issued by Kenya and Senegal:
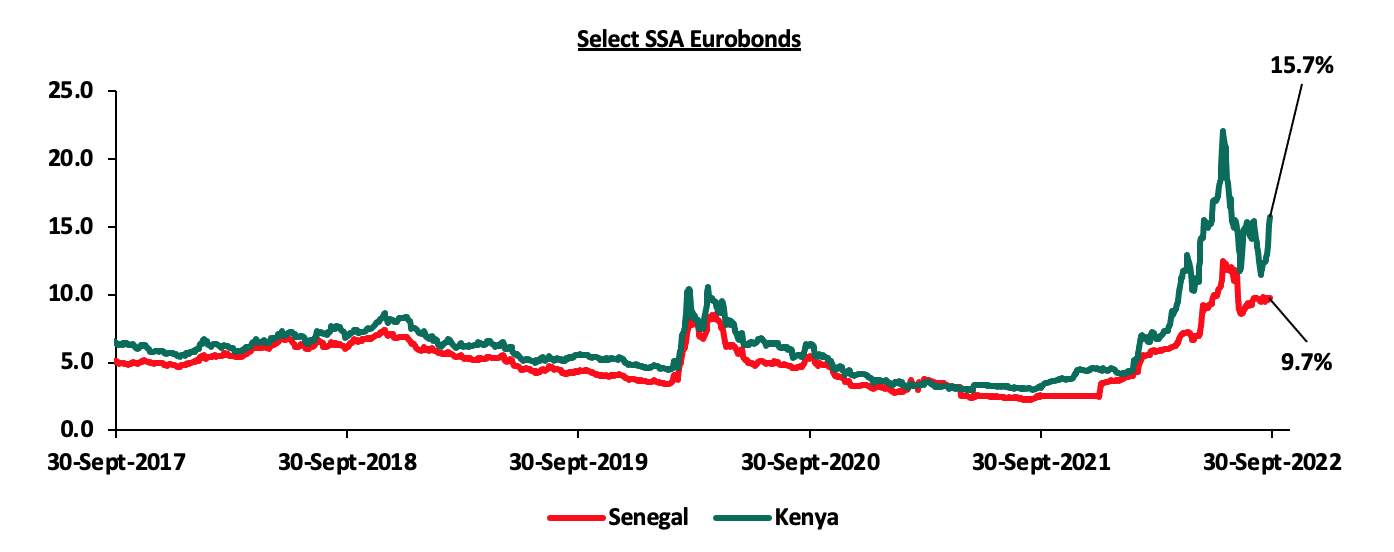
Source: S&P Capital
Equities Market Performance
Sub-Saharan Africa (SSA) stock markets recorded mixed performance in Q3’2022, with Zambia’s stock market (LASILZ) being the best performing market gaining by 28.7% YTD due to improved macroeconomic conditions that have led to favorable investor sentiments in the country. Ghana’s GGSECI was the worst-performing market with a loss of 46.7% YTD, largely driven by sell offs from investors following adverse macroeconomic conditions in Ghana driven by high inflation at 33.9% as of August 2022. Kenya’s NASI declined by 28.0% at the end of Q3’2022, mainly attributable to increased foreign investor sell offs coupled with increased uncertainties emanating from inflationary pressures as well as the heated political temperature that surrounded the August elections. Below is a summary of the performance of key indices:
|
Equities Market Performance (Dollarized*) |
||||||
|
Country |
Index |
Sep-21 |
Jan-22 |
Sep-22 |
Last 12 Months change (%) |
YTD change (%) |
|
Zambia |
LASILZ |
294.5 |
362.2 |
466.2 |
58.3% |
28.7% |
|
Nigerian |
NGSEASI |
98.1 |
104.1 |
113.5 |
15.8% |
9.0% |
|
Rwanda |
RSEASI |
0.1 |
0.1 |
0.1 |
(0.7%) |
(0.8%) |
|
Tanzanian |
DARSDEI |
0.8 |
0.6 |
0.6 |
(28.8%) |
(6.5%) |
|
Uganda |
USEASI |
0.4 |
0.4 |
0.3 |
(23.1%) |
(18.0%) |
|
South Africa |
JALSH |
4280.2 |
4,639.6 |
3,524.9 |
(17.6%) |
(24.0%) |
|
Kenya |
NASI |
1.6 |
1.5 |
1.1 |
(34.1%) |
(28.0%) |
|
Ghana |
GGSECI |
472.4 |
454.6 |
242.5 |
(48.7%) |
(46.7%) |
|
*The index values are dollarized for ease of comparison |
||||||
Source: S&P Capital
GDP growth in Sub-Saharan Africa region is expected to weaken, as debt sustainability concerns remain elevated. The region’s debt to GDP ratio increased to 61.0% of GDP in 2021, from 60.0% of GDP in 2020 making it less attractive to foreign capital. The significant weakening of the currencies has also increased the cost of servicing debt.
The Kenyan Economy is projected to grow at an average of 5.1% in 2022 lower than the 7.5% growth recorded in 2021 amid the elevated inflationary pressures, persistent geopolitical pressures and erratic weather conditions. The table below shows the projections according to various organizations:
|
No. |
Organization |
2022 GDP Projections |
|
1. |
International Monetary Fund |
5.7% |
|
2. |
National Treasury |
6.0% |
|
3. |
World Bank |
5.5% |
|
4. |
S&P Global |
4.5% |
|
5. |
Cytonn Investments Management PLC |
4.0% |
|
Average |
5.1% |
|
Source: Cytonn Research
Key to note, Kenya’s general business environment has continued to deteriorate with the average Purchasing Manager’s Index 45.3 in Q3’2022, compared to 50.7 recorded in the same period in 2021 mainly on the back of increased commodity prices which have seen reduced consumer spending.
Inflation:
The average inflation rate increased to 8.7% in Q3’2022, compared to 6.7% in Q3’2021, attributable to the increase in food and fuel prices in the period under review. Notably, the prices of super petrol, diesel and kerosene have increased by 38.2%, 49.2% and 42.9% to Kshs 179.3 per litre, Kshs 165.0 per litre and Kshs 147.9, from Kshs 129.7 per litre, Kshs 110.6 per litre and Kshs 103.5 per litre, year to date.
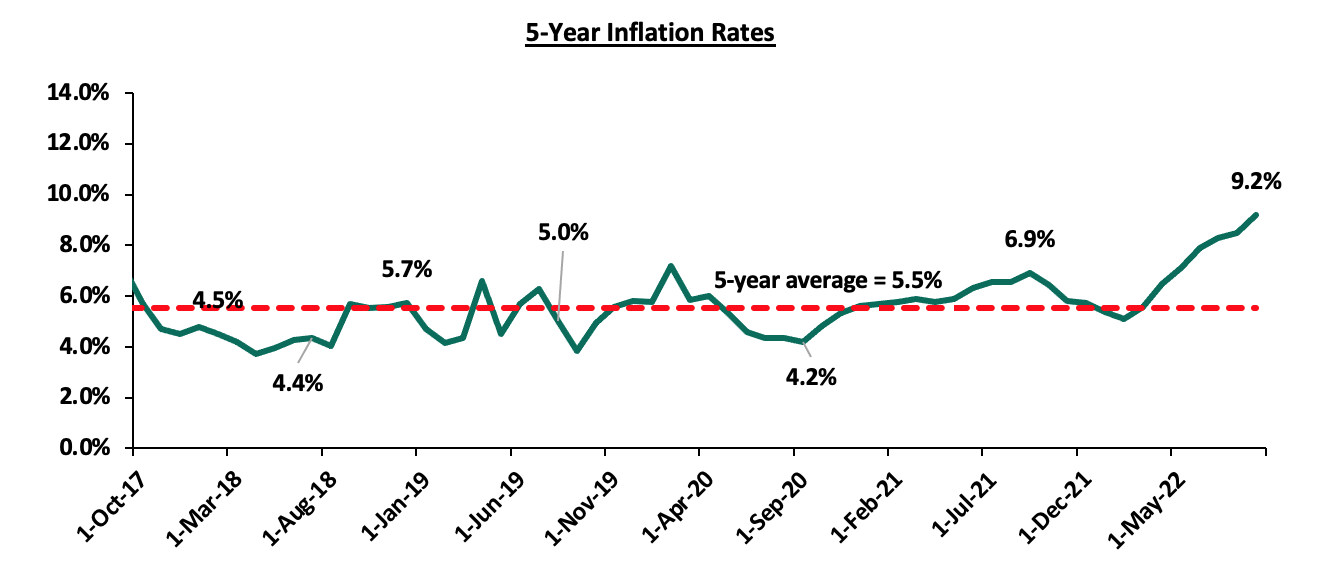
September 2022 Inflation - Inflation for the month of September 2022 came in at 9.2%, the highest since June 2017, and an increase from the 8.5% recorded in August 2022. The increase was mainly attributable to a 15.5%, 10.2% and 7.3%, increase in the food and non-alcoholic beverages index, transport as well as housing, water, electricity, gas and other fuels. Below is the chart showing the inflation trend for the last five years:
Going forward, we expect inflationary pressures to remain elevated primarily owing to the high fuel and food prices. Even as the global fuel prices decline, we do not expect the country’s prices to fall given the partial removal of the fuel subsidy which we expect to be completely eliminated in the coming months. Key to note is that the Monetary Policy Committee raised the Central Bank Rate to 8.25%, from the previous 7.50% with the aim of anchoring the inflation rate which has continued to increase over the last eight months. Despite the monetary stance, we still believe that the inflationary pressures are due to external shocks and a decline is largely pegged on how soon global supply chains stabilize.
The Kenyan Shilling:
The Kenyan Shilling depreciated against the US Dollar by 2.5% in Q3’2022, to close at Kshs 120.7, from Kshs 117.8 at the end of Q2’2022, partly attributable to increased dollar demand in the energy, oil and manufacturing sectors. Key to note, this is the lowest the Kenyan shilling has traded against the dollar. During the week, the Kenya Shilling depreciated against the US Dollar by 0.1% to close at 120.7, from 120.6 the previous week. We expect the shilling to remain under pressure in 2022 as a result of:
- High global crude oil prices on the back of persistent supply chain bottlenecks coupled with high demand as most economies gradually recover,
- An ever-present current account deficit estimated at 5.2% of GDP in the 12 months to August 2022, same as that was recorded in a similar period in 2021, and,
- The aggressively growing government debt which continues to put pressure on forex reserves given that 68.1% of Kenya’s debt is US Dollar denominated as of July 2022.
The shilling is however expected to be supported by:
- Sufficient Forex reserves currently at USD 7.4 bn (equivalent to 4.2-months of import cover), which is above the statutory requirement of maintaining at least 4.0-months of import cover, and,
- Sufficient diaspora remittances standing at a cumulative USD 3,992.0 mn as of August 2022, representing a 14.7% y/y increase from USD 3,481.0 mn recorded over the same period in 2021.
Monetary Policy:
The Monetary Policy Committee (MPC) met on September 29th 2022 to review the outcome of its previous policy decisions and recent economic developments, and to decide the direction of the Central Bank Rates (CBR). Notably, the MPC against our expectations, raised the CBR by 75.0 bps to 8.25% from 7.50% in their July 2022 sitting. Below are some of the key highlights from the meeting:
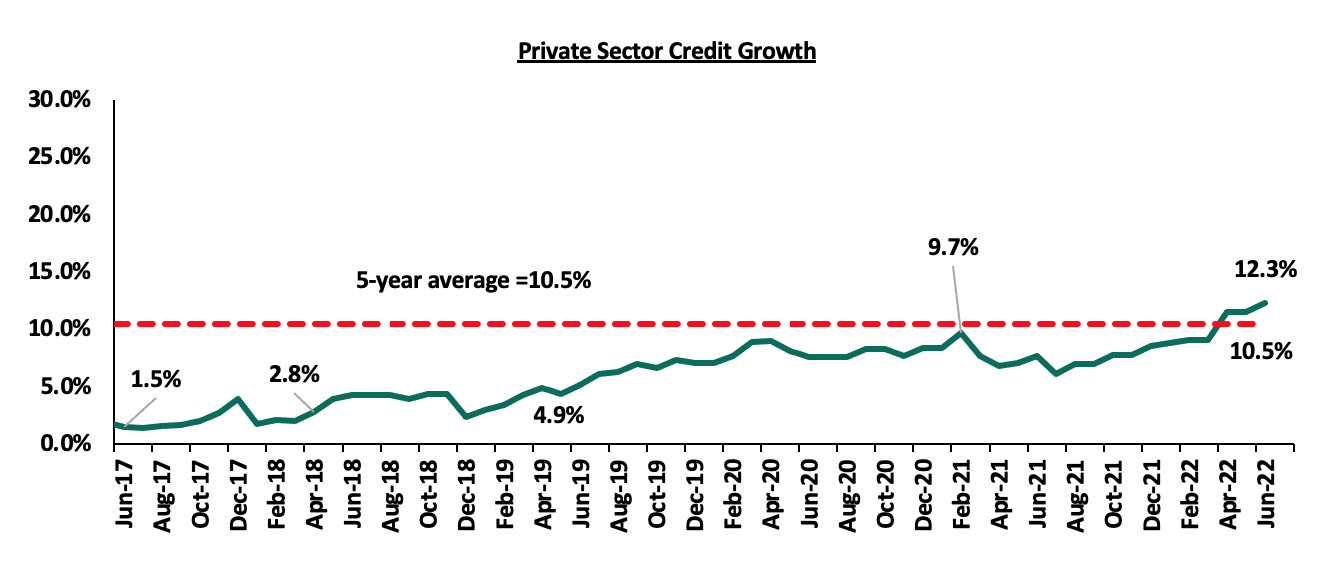
- Private sector credit growth continues to recover, having grown by 12.5% in August 2022, as compared to 7.0% over the same period in 2021. The key sectors that experienced increased lending were business services (16.1%), manufacturing (15.2%), consumer durables (14.3%) and trade (13.3%). The chart below shows the movement of the private sector credit growth of the last five years.
Source: Central Bank of Kenya
- Exports of goods have remained strong, growing by 11.0% in the 12 months to August 2022 compared to 11.5% growth in a similar period in 2021. Key to note, receipts from tea and manufactured goods exports increased by 10.9% and 20.8%, respectively, during the period reflecting improved prices attributable to demand from traditional markets. Additionally, imports of goods increased by 21.4% in the 12 months to August compared to 10.2% in the same period in 2021 mainly reflecting increased imports of oil and intermediate goods, and,
- The current account to GDP is estimated at 5.2% to the 12 months to August 2022, same as that was recorded in a similar period in 2021. Exports remained strong, growing by 11.0% in the 12 months to August 2022 compared to a similar period in 2021. Receipts from exports of manufactured goods and tea increased by 20.8% and 10.9% respectively, while horticulture exports declined by 12.0% in the period of review.
The MPC noted that the sustained inflationary pressures, the elevated global risks and their potential impact on the domestic economy and concluded that there was scope for tightening the monetary policy in order to anchor inflationary expectations. Therefore, the MPC decided to raise the CBR by 75.0 bps to 8.25% from 7.5% as they continue to monitor the impact of the policy measures, as well as developments in the global and domestic economy. The committee will meet again in November 2022, but remains ready to re-convene earlier if necessary.
During Q3’2022, T-bills remained undersubscribed with the overall subscription rate coming in at 90.8% up from 78.1% in Q2’2022, partly attributable to the tightened market liquidity, which saw the average interbank rate increase to 5.2% from 4.8% in Q2’2022. The Overall subscription for the 91-day and 182-day increased to 304.9% and 64.9% from 127.6% and 58.1% in Q2’2022, respectively, while the 364-day declined to 31.1% from 78.3% recorded in Q2’2022. The acceptance rate for the quarter declined to 87.0% from 91.9% in Q2’2022, with the government accepting a total of Kshs 246.4 bn of the Kshs 283.3 bn worth of bids received during the quarter. The yields on the government papers were on an upward trajectory during the quarter, with the yields on the 364-day, 182-day and 91-day papers increasing by 8.2 bps, 77.0 bps and 91.9 bps to 9.9%, 9.4% and 8.6%, respectively;
During the week, T-bills remained undersubscribed, with the overall subscription rate coming in at 38.8%, a decline from the 46.6% recorded the previous week. The undersubscription was partly attributable to the tightened liquidity in the money market, with the average interbank rate increasing to 5.6% from 4.5% recorded in the previous week. Investor’s preference for the shorter 91-day paper persisted, with the paper receiving bids worth Kshs 5.1 bn against the offered Kshs 4.0 bn, translating to a subscription rate of 128.2% up from 117.8% recorded in the previous week. The subscription rate for the 364-day papers also increased to 11.3% from 10.4% while that of the 182-day declined to 30.5% from 54.3%, recorded the previous week. The yields on the government papers recorded mixed performance, with the yields on the 182-day and 91-day papers increasing by 0.6 bps and 0.1 bps to 9.6% and 9.0%, respectively, while the yields on the 364-day paper declined by 0.4 bps to 9.9%. We however believe that the 91-day paper rates are not sustainable and this will likely lead to a reversal in the rates in the short term. The government continued to reject expensive bids, accepting a total of Kshs 6.7 bn worth of bids out of the Kshs 9.3 bn worth of bids received, translating to an acceptance rate of 71.4%.
Primary T-bond Auctions in Q3’2022
In Q3’2022, the government reopened seven bonds and issued one infrastructure bond on tap sale, seeking to raise Kshs 160.0 bn. The bonds were undersubscribed, receiving bids worth Kshs 112.2 bn against the offered Kshs 160.0 bn, translating to a subscription rate of 62.3%. The government was keen to maintain low rates, only accepting Kshs 93.3 bn, translating to an acceptance rate of 87.8%. The table provides more details on the bonds issued during the quarter;
|
Issue Date |
Bond Auctioned |
Effective Tenor to Maturity (Years) |
Coupon |
Amount offered (Kshs bn) |
Actual Amount Raised (Kshs bn) |
Total bids received |
Average Accepted Yield |
Subscription Rate |
Acceptance Rate |
|
7/11/2022 |
IFB1/2022/018 - Tap Sale |
18.0 |
13.7% |
20.00 |
6.4 |
6.4 |
13.7% |
32.1% |
100.0% |
|
7/25/2022 |
FXD2/2013/15-Reopened |
15.0 |
12.0% |
40.0 |
9.3 |
10.6 |
13.2% |
26.4% |
88.0% |
|
FXD2/2018/15-Reopened |
15.0 |
12.8% |
13.9% |
||||||
|
8/22/2022 |
FXD1/2022/03-Re-opened |
2.7 |
11.8% |
50.0 |
38.5 |
49.1 |
12.4% |
98.3% |
78.4% |
|
FXD2/2019/10-Re-opened |
6.7 |
12.3% |
13.9% |
||||||
|
FXD1/2021/20-Re-opened |
19.1 |
13.4% |
14.0% |
||||||
|
9/19/2022 |
FXD1/2022/10-Re-opened |
10.0 |
13.5% |
50.0 |
39.0 |
46.1 |
13.9% |
92.3% |
84.6% |
|
FXD1/2022/15-Re-opened |
15.0 |
13.9% |
14.0% |
||||||
|
Q3'2022 Average |
12.7 |
12.9% |
40.0 |
23.3 |
28.1 |
13.6% |
62.3% |
87.8% |
|
|
Q2'2022 Average |
13.6 |
13.3% |
40.0 |
33.8 |
37.1 |
13.3% |
102.6% |
92.1% |
|
Secondary Bond Market Activity:
- Bond Turnover
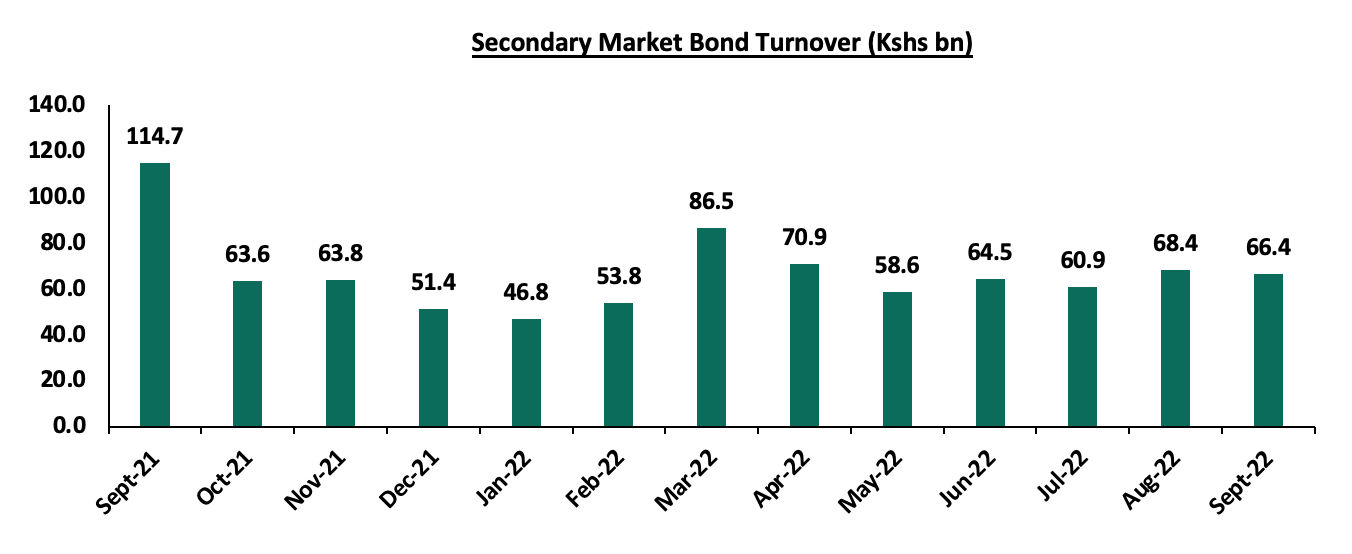
In Q3’2022, the secondary bond market recorded increased activity with the turnover increasing by 0.9% to Kshs 195.7 bn from Kshs 194.0 bn recorded in Q2’2022, partially attributable to the relative ample liquidity and increased allocation to treasury bonds by local institutional investors as they sought for higher yield in the market. The chart below shows the bonds turnover over the last one year
- Yield Curve:
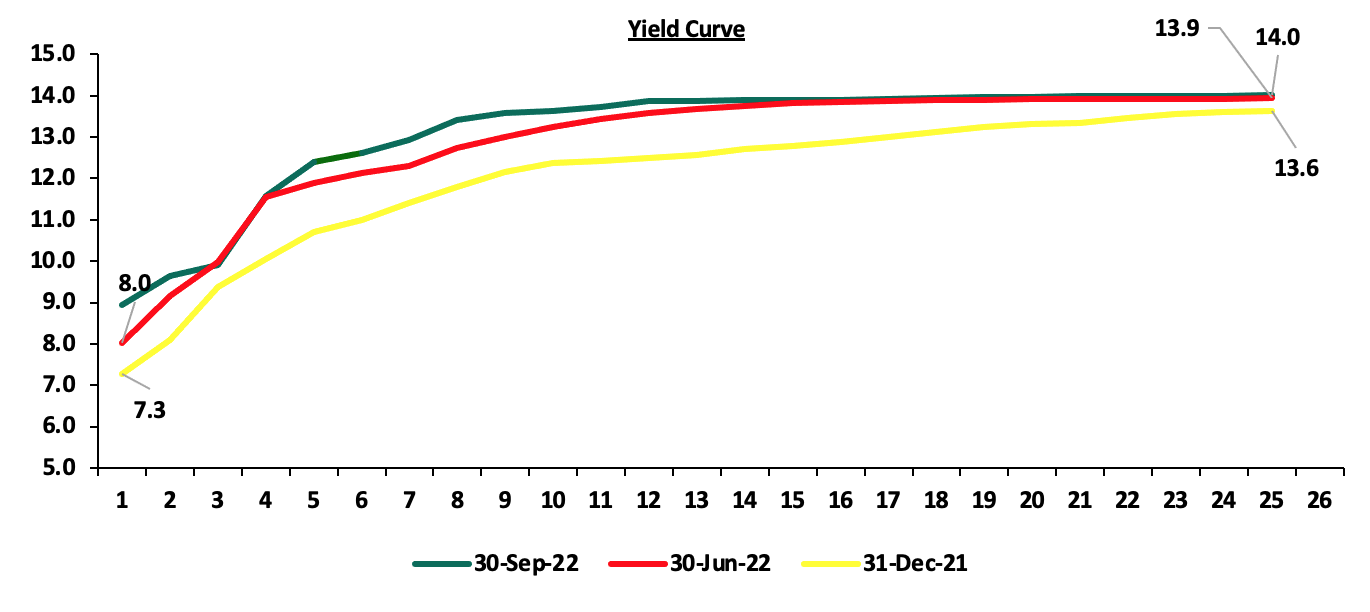
The yield curve was on an upward trajectory in Q3’2022 with a notable increase in the yields on all the bonds. The chart below shows the yield curve movement during the quarter;
Money Market Performance:
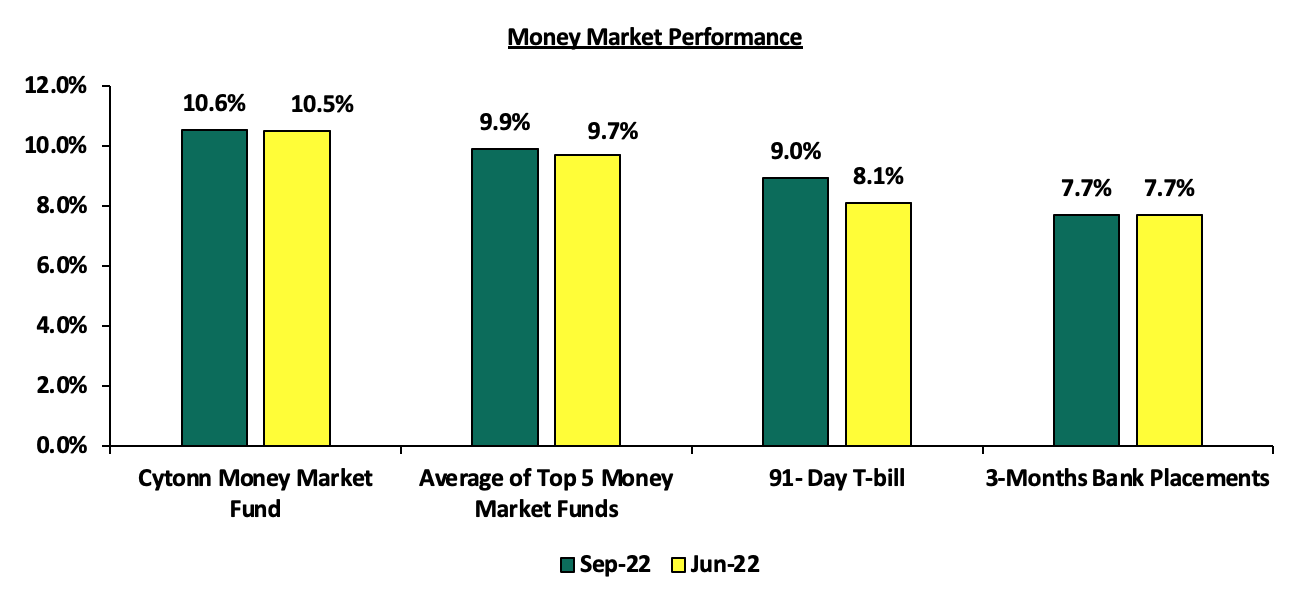
During Q3’2022, the 3-month bank placements remained unchanged at 7.7% at the end of Q3’2022, same as that was recorded at the end of Q2’2022 (based on what we have been offered by various banks). The average 91-day T-bill rate increased by 0.9% points to 9.0% in Q3’2022 from 8.1% in Q2’2022, while the average of Top 5 Money Market Funds increased by 0.2% to 9.9% from 9.7% in Q2’2022. The yield on the Cytonn Money Market Fund (CMMF) remained increased by 0.1% points to 10.6% in Q3’2022, from 10.5% recorded in Q2’2022.
During the week, the 3-month bank placements ended the week at 7.7% (based on what we have been offered by various banks), while the yield on the 91-day T-bill increased by 0.1 bps to 9.0%. The average yield of the Top 5 Money Market Funds increased by 8.0 bps to 9.9% while the Cytonn Money Market Fund remained relatively unchanged at 10.6%, as was recorded last week.
The table below shows the Money Market Fund Yields for Kenyan Fund Managers as published on 30th September 2022;
|
Money Market Fund Yield for Fund Managers as published on 30th September 2022 |
||
|
Rank |
Fund Manager |
Effective Annual Rate |
|
1 |
Cytonn Money Market Fund |
10.6% |
|
2 |
Zimele Money Market Fund |
9.9% |
|
3 |
GenCap Hela Imara Money Market Fund |
9.9% |
|
4 |
NCBA Money Market Fund |
9.7% |
|
5 |
Dry Associates Money Market Fund |
9.6% |
|
6 |
Sanlam Money Market Fund |
9.4% |
|
7 |
Nabo Africa Money Market Fund |
9.4% |
|
8 |
Madison Money Market Fund |
9.3% |
|
9 |
Old Mutual Money Market Fund |
9.3% |
|
10 |
Apollo Money Market Fund |
9.3% |
|
11 |
Co-op Money Market Fund |
9.2% |
|
12 |
CIC Money Market Fund |
9.1% |
|
13 |
Orient Kasha Money Market Fund |
8.8% |
|
14 |
AA Kenya Shillings Fund |
8.7% |
|
15 |
ICEA Lion Money Market Fund |
8.6% |
|
16 |
British-American Money Market Fund |
7.9% |
Source: Business Daily
Liquidity:
In Q3’2022, liquidity in the money market tightened, as evidenced by the increase in the interbank rate to 5.2% from 4.8% in Q2’2022, partly attributable to government payments, which offset tax remittances. Additionally, the average interbank volumes increased by 13.5% to Kshs 21.7 bn from Kshs 19.1 bn in Q2’2022.
During the week, liquidity in the money markets tightened, with the average interbank rate increasing to 5.6% from 4.5% recorded the previous week, partly attributable to government payments that offset tax remittances. The average interbank volumes traded declined by 51.2% to Kshs 11.6 bn from Kshs 24.1 bn recorded the previous week.
Kenya Eurobonds:
During Q3’2022, the yields on Eurobonds recorded a mixed performance, with 12-year Eurobond issued in 2021 being the highest gainer, increasing 0.7% points to 13.4% from 12.7% recorded in Q2’2022. The yield on the 7-year Eurobond issued in 2019 recorded the highest decline having declined 0.4% to 15.7% from 16.1% recorded in the previous quarter.
During the week, the yields on Eurobonds were on an upward trajectory with the yield on the 10-year Eurobond issued in 2014 recording the highest increase having increased by 3.8% to 17.1% from 13.3% recorded in the previous week. The table below shows the summary of the performance of the Kenyan Eurobonds as of 29th September 2022;
|
Kenya Eurobond Performance |
||||||
|
2014 |
2018 |
2019 |
2021 |
|||
|
Date |
10-year issue |
10-year issue |
30-year issue |
7-year issue |
12-year issue |
12-year issue |
|
3-Jan-22 |
10.9% |
5.7% |
8.1% |
5.6% |
6.7% |
6.6% |
|
30-Jun-22 |
17.0% |
14.7% |
13.7% |
16.1% |
13.8% |
12.7% |
|
23-Sep-22 |
13.3% |
12.8% |
12.2% |
13.2% |
12.9% |
11.4% |
|
26-Sep-22 |
14.0% |
13.2% |
12.6% |
13.8% |
13.3% |
12.1% |
|
27-Sep-22 |
15.2% |
13.6% |
12.8% |
14.3% |
13.6% |
12.4% |
|
28-Sep-22 |
16.3% |
14.2% |
13.2% |
15.8% |
14.6% |
12.8% |
|
29-Sep-22 |
17.1% |
14.7% |
14.1% |
15.7% |
14.7% |
13.4% |
|
Weekly Change |
3.8% |
1.9% |
1.9% |
2.4% |
1.8% |
2.0% |
|
q/q Change |
0.1% |
0.0% |
0.3% |
(0.4%) |
0.9% |
0.7% |
|
YTD Change |
6.2% |
9.0% |
5.9% |
10.1% |
8.0% |
6.8% |
Source: Central Bank of Kenya (CBK)
Rates in the Fixed Income market have remained relatively stable due to the relatively ample liquidity in the money market. The government is 7.5% behind its prorated borrowing target of Kshs 147.0 bn having borrowed Kshs 136.0 bn of the Kshs 581.7 bn borrowing target for the FY’2022/2023. We expect sustained gradual economic recovery as evidenced by the revenue collections of Kshs 2.0 tn in the FY’2021/2022, equivalent to a 2.8% outperformance. Despite the performance, we believe that the projected budget deficit of 6.2% is relatively ambitious given the downside risks and deteriorating business environment occasioned by high inflationary pressures. We however expect the support from the IMF and World Bank to finance some of the government projects and thus help maintain a stable interest rate environment since the government is not desperate for cash. Owing to this, our view is that investors should be biased towards short-term fixed-income securities to reduce duration risk.
Market Performance:
During Q3’2022, the equities market was on an upward trajectory, with NASI, NSE 20 and NSE 25 gaining by 3.2%, 6.5% and 5.0%, respectively, taking their YTD performance to losses of 23.2%, 10.3% and 17.4% for NASI, NSE 20 and NSE 25 respectively. The equities market performance during the quarter was driven by gains recorded by large cap banking stocks such as NCBA which gained by 28.4% as well as ABSA and Standard Chartered Bank (SCBK) of 9.6% each, while Co-operative Bank gained by 8.7%. The gains were however weighed down by losses recorded by other large cap stocks such as Bamburi of 0.7%.
During Q3’2022, equities turnover declined by 14.3% to USD 190.3 mn, from USD 222.0 mn in Q2’2022. Additionally, foreign investors remained net sellers in Q3’2022 with a net selling position of USD 58.4 mn, from a net selling position of USD 91.1 mn recorded in Q2’2022.
During the week, the equities market was on a downward trajectory with NASI, NSE 20 and NSE 25 declining by 4.8%, 1.6% and 2.8%, respectively. The equities market performance was mainly driven by losses recorded by large-cap stocks such as Safaricom, NCBA, BAT and Co-operative Bank of 8.9%, 8.2%, 2.1% and 1.7%, respectively. The losses were however mitigated by gains recorded by other large cap stocks such as KCB Group of 5.9%.
During the week, equities turnover declined by 29.1% to USD 14.4 mn from USD 20.3 mn recorded the previous week, taking the YTD turnover to USD 656.3 mn. Foreign investors remained net sellers, with a net selling position of USD 4.9 mn, from a net selling position of USD 6.8 mn recorded the previous week, taking the YTD net selling position to USD 164.2 mn.
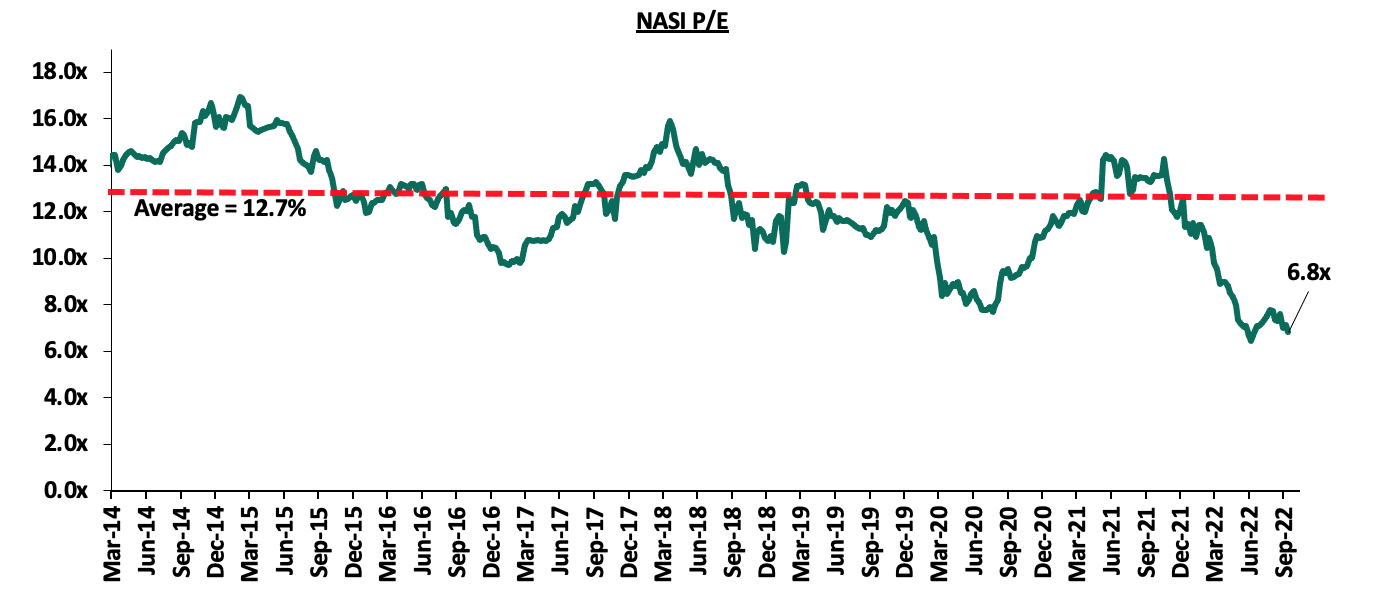
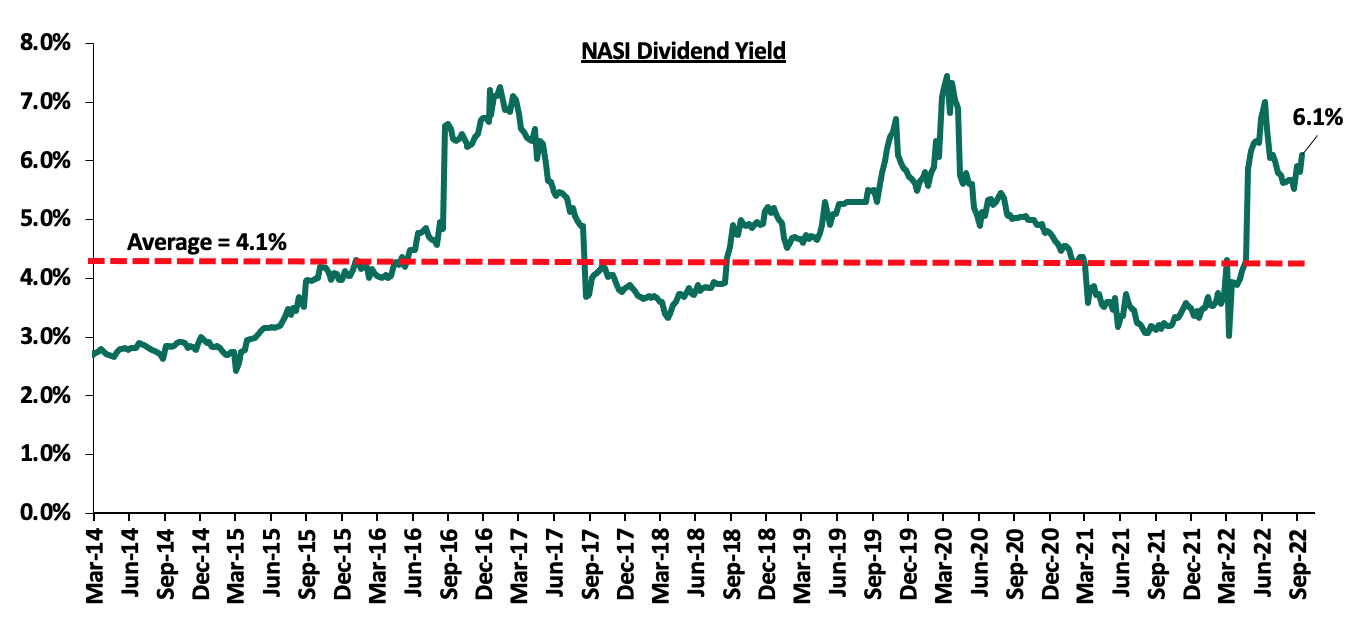
The market is currently trading at a price to earnings ratio (P/E) of 6.8x, 46.3% below the historical average of 12.7x, and a dividend yield of 6.1%, 2.0% points above the historical average of 4.1%. Key to note, NASI’s PEG ratio currently stands at 0.9x, an indication that the market is undervalued relative to its future growth. A PEG ratio greater than 1.0x indicates the market may be overvalued while a PEG ratio less than 1.0x indicates that the market is undervalued.
The charts below indicate the historical P/E and dividend yields of the market;
Listed Banks’ H1’2022 Performance
During the third quarter of 2022, the listed banking sector released their H1’2022 results, recording y/y earnings growth of 34.0% in their core EPS in H1’2022, compared to a weighted average increase of 136.0% in H1’2021. The performance was largely skewed by the strong EPS growth from NCBA and Co-operative Bank of 66.9% and 55.7%, respectively. For more information, please see our Kenya Listed Banks H1’2022 Report.
Key Q3’2022 Highlights:
During Q3’2022;
- The Insurance Regulatory Authority of Kenya (IRA) released the Quarterly Insurance Industry Report for the period ending 31st March 2022 highlighting that the industry’s gross premiums rose by 11.6% to Kshs 88.4 bn, from Kshs 79.3 bn recorded in Q1’2021, with the general insurance business contributing 61.0% of the industry’s premium income, a 0.2% points decline from the 61.2% contribution witnessed in Q1’2021. For more information, please see our Cytonn Weekly #31/2022,
- KCB Group announced that it had entered into a final agreement with shareholders of Trust Merchant Bank (TMB) to acquire an 85.0% stake in the Democratic Republic of Congo (DRC)- based lender, with an option to acquire the remaining stake after two years. For more information please see our Cytonn Weekly #31/2022,
- The International Finance Corporation (IFC) disclosed that it would extend USD 150.0 mn (Kshs 18.0 bn) to KCB Group in form of a senior unsecured loan with a maturity of 7-years and a grace period of 2-years. The credit facility was aimed at supporting the growth of the bank’s climate finance portfolio which entails clients in sectors such as manufacturing, real estate and agriculture. For more information please see our Cytonn Monthly-August 2022,
- The Central Bank of Kenya (CBK) released the Quarterly Economic Review for the period ending 30th June 2022, highlighting that the sector’s total assets increased by 2.4% to Kshs 6.2 tn in June 2022, from Kshs 6.1 tn in March 2022. The sector’s recorded a 9.3% increase in Profit before Tax (PBT) to Kshs 62.6 bn in Q2’2022, from Kshs 57.3 bn in Q1’2022. For more information please see our Cytonn Weekly #36/2022, and,
- Equity Group Holdings Plc through Equity Bank (Kenya) Limited, announced that it had entered into an Assets and Liabilities purchase agreement with Spire Bank Limited for purchase of certain assets and liabilities. In the deal which was anchored in Equity’s plan to support economic recovery post COVID-19, Equity Bank Kenya Limited would acquire approximately 20,000 deposit customers with deposits totaling Kshs 1.3 bn, and 3,700 loan customers with outstanding loan balances at Kshs 1.7 bn, with a net carrying value of Kshs 0.9 bn after adjusting for statutory loan loss provisions of Kshs 0.8 bn. For more information, please see our Cytonn Weekly #37/2022.
For notable market highlights from H1’2022, please see our Cytonn H1’2022 Markets Review
Universe of Coverage:
|
Company |
Price as at 23/09/2022 |
Price as at 30/09/2022 |
w/w change |
q/q change |
YTD Change |
Year Open 2022 |
Target Price* |
Dividend Yield |
Upside/ Downside** |
P/TBv Multiple |
Recommendation |
|
Kenya Re |
2.1 |
2.0 |
(4.3%) |
(2.9%) |
(13.5%) |
2.3 |
3.2 |
5.1% |
65.6% |
0.2x |
Buy |
|
Sanlam |
10.0 |
9.9 |
(0.6%) |
(17.2%) |
(13.9%) |
11.6 |
15.9 |
0.0% |
60.0% |
1.0x |
Buy |
|
Jubilee |
245.3 |
245.0 |
(0.1%) |
(3.9%) |
(22.7%) |
316.8 |
379.4 |
0.4% |
55.3% |
0.4x |
Buy |
|
Equity*** |
47.1 |
46.5 |
(1.4%) |
8.0% |
(11.9%) |
52.8 |
62.2 |
6.5% |
40.5% |
1.1x |
Buy |
|
Co-op *** |
12.1 |
11.9 |
(1.7%) |
7.7% |
(8.8%) |
13.0 |
15.6 |
8.4% |
40.1% |
0.7x |
Buy |
|
KCB *** |
39.2 |
41.5 |
5.9% |
6.3% |
(9.0%) |
45.6 |
53.5 |
7.2% |
36.3% |
0.7x |
Buy |
|
Liberty |
6.3 |
5.8 |
(7.9%) |
7.4% |
(17.8%) |
7.1 |
7.8 |
0.0% |
34.5% |
0.4x |
Buy |
|
ABSA *** |
11.5 |
11.5 |
0.0% |
8.0% |
(2.6%) |
11.8 |
14.9 |
1.7% |
31.9% |
1.0x |
Buy |
|
I&M *** |
16.9 |
17.0 |
0.6% |
0.0% |
(20.6%) |
21.4 |
20.5 |
8.8% |
29.6% |
0.4x |
Buy |
|
Britam |
6.3 |
6.0 |
(4.8%) |
4.6% |
(21.2%) |
7.6 |
7.7 |
0.0% |
29.2% |
1.0x |
Buy |
|
DTB-K*** |
49.8 |
50.0 |
0.4% |
0.6% |
(16.0%) |
59.5 |
59.5 |
6.0% |
25.0% |
0.2x |
Buy |
|
SCBK*** |
137.8 |
136.8 |
(0.7%) |
10.3% |
5.2% |
130.0 |
155.0 |
10.2% |
23.6% |
0.9x |
Buy |
|
NCBA*** |
33.0 |
30.3 |
(8.2%) |
27.8% |
19.1% |
25.5 |
35.2 |
6.6% |
22.6% |
0.7x |
Buy |
|
Stanbic |
100.0 |
100.0 |
0.0% |
1.0% |
14.9% |
87.0 |
99.9 |
9.0% |
8.9% |
0.8x |
Hold |
|
HF Group |
3.3 |
3.4 |
3.0% |
2.1% |
(11.1%) |
3.8 |
3.6 |
0.0% |
5.9% |
0.2x |
Hold |
|
CIC Group |
2.1 |
2.0 |
(2.9%) |
0.5% |
(7.4%) |
2.2 |
2.1 |
0.0% |
4.5% |
0.7x |
Lighten |
|
*Target Price as per Cytonn Analyst estimates **Upside/ (Downside) is adjusted for Dividend Yield ***For Disclosure, these are stocks in which Cytonn and/or its affiliates are invested in |
|||||||||||
We are “Neutral” on the Equities markets in the short term due to the current adverse operating environment and huge foreign investor outflows, and, “Bullish” in the long term due to current cheap valuations and expected global and local economic recovery.
With the market currently trading at a discount to its future growth (PEG Ratio at 0.9x), we believe that investors should reposition towards value stocks with strong earnings growth and that are trading at discounts to their intrinsic value. We expect the current high foreign investors sell-offs, the upcoming Kenyan general elections and the slow vaccine rollout to continue weighing down the economic outlook in the short term.
In Q3’2022, the Real Estate industry recorded substantial improvement in activity and performance compared to Q3’2021. This was mainly due to favorable economic environment in addition to the peaceful electioneering period which boosted investor confidence in the sector and consequently improved Real Estate transactions. Some of the key factors that have continued to shape the performance of the Real Estate sector include:
- Increased development activities in the housing market in addition to the continued focus on Affordable Housing initiative by the government and the private sector,
- Kenya Mortgage Refinance Company’s continuous efforts to provide home loans to potential buyers,
- Improved tourist arrivals in the country and activities owing to the removal of all pandemic related restrictions,
- Increased investments and expansion activities on the back of improving foreign investor confidence,
- Positive demographics evidenced by Kenya’s relatively high urbanization and population growth rates of 4.0% p.a and 2.3% p.a, respectively, against the global average of 1.8% p.a and 1.0% p.a, respectively, as at 2020, driving increased demand for developments,
- Rapid infrastructure developments opening up of areas for investment such as the recently completed Nairobi Expressway, Nairobi Western Bypass, and, berth one of the Lamu Port-South Sudan-Ethiopia Transport (LAPSSET) corridor, among many others,
- Initiation and implementation of various statutory reviews aimed at providing clear guidelines and efficient operations in the property market, and,
- Continuous entry and expansion by local and international retailers such as Naivas, Eat’N’Go, Carrefour and QuickMart.
However, there existed various challenges that hampered the performance of the sector such as;
- Increasing selling and rental prices emanating from rising costs of construction materials,
- Limited credit access partly due to the rising non-performing loans in the property sector,
- Looming uncertainties surrounding the general election which curtailed investor confidence,
- The existing oversupply of space at 6.7 mn SQFT in the NMA commercial office market, 3.0 mn SQFT in the NMA retail market, and 1.7 mn SQFT oversupply in the overall Kenyan retail market,
- Continued growth of e-commerce which affects the optimum demand and uptake of physical retail spaces, and,
- Constrained performance of the Kenyan REIT market owing to the low investor knowledge, structural and regulatory impediments to REIT market growth and appetite in the investment instrument.
Sectoral Market Performance
- Residential Sector
The table below shows the NMA residential sector performance during Q3’2022;
|
Cytonn Report: Residential Market Average Performance Summary |
|||||||||
|
Segment |
Rental Yield Q3’2022 |
Price Appreciation Q3’2022 |
Total Returns Q3’2022 |
Rental Yield Q3’2021 |
Price Appreciation Q3’2021 |
Total Returns Q3’2021 |
Change in Rental Yield |
Change in Appreciation |
Change in Total Returns |
|
Detached: |
|
|
|
|
|
|
|
|
|
|
High End |
4.3% |
1.3% |
5.6% |
3.7% |
0.2% |
3.9% |
0.6% |
1.1% |
1.7% |
|
Upper Mid-End |
4.6% |
0.8% |
5.4% |
4.5% |
0.2% |
4.7% |
0.1% |
0.6% |
0.7% |
|
Lower Mid-End |
5.1% |
0.8% |
5.8% |
4.5% |
1.5% |
6.0% |
0.6% |
(0.7%) |
(0.2%) |
|
Detached Average |
4.7% |
1.0% |
5.6% |
4.2% |
0.6% |
4.8% |
0.4% |
0.3% |
0.7% |
|
Apartments: |
|
|
|
|
|
|
|
|
|
|
Upper Mid-End |
5.4% |
0.4% |
5.7% |
5.2% |
0.9% |
6.2% |
0.2% |
(0.5%) |
(0.5%) |
|
Lower Mid-End |
5.5% |
0.3% |
5.9% |
5.3% |
0.8% |
6.1% |
0.2% |
(0.5%) |
(0.2%) |
|
Satellite Towns |
5.5% |
1.3% |
6.8% |
5.3% |
0.5% |
5.8% |
0.2% |
0.8% |
1.0% |
|
Apartments Average |
5.5% |
0.7% |
6.1% |
5.3% |
0.8% |
6.0% |
0.2% |
(0.1%) |
0.1% |
|
Market Average Q3’2022 |
5.1% |
0.8% |
5.9% |
4.8% |
0.7% |
5.5% |
0.3% |
0.1% |
0.4% |
Source: Cytonn Research 2022
The key take-outs from the table include;
- Average Total Return – The residential sector’s average total return increased by 0.4% points y/y to 5.9%, from 5.5% recorded in Q3’2021 mainly driven by an increase in property transaction volumes which translated to 0.1% points increase in the average y/y price appreciation to 0.8%, from 0.7% recorded in Q3’2021, and,
- Average rental yields – The total average rental yields increased by 0.3% points to 5.1% in Q3’2022 from 4.8% recorded in Q3’2021, on the back of the gradual economic recovery which saw landlords collect higher rents.
- Detached Units Performance
The table below shows the residential detached units performance during Q3’2022;
(All values in Kshs unless stated otherwise)
|
Cytonn Report: Detached Units Average Performance Q3’2022 |
||||||||
|
Area |
Price per SQM Q3'2022 |
Rent per SQM Q3'2022 |
Occupancy Q3'2022 |
Uptake Q3'2022 |
Annual Uptake Q3'2022 |
Rental Yield Q3'2022 |
Price Appreciation Q3'2022 |
Total Returns |
|
High-End |
||||||||
|
Kitisuru |
226,735 |
756 |
94.5% |
94.3% |
13.4% |
4.8% |
1.7% |
6.6% |
|
Rosslyn |
183,317 |
803 |
88.4% |
98.1% |
14.5% |
4.7% |
1.4% |
6.0% |
|
Runda |
212,306 |
799 |
94.7% |
96.5% |
10.0% |
4.6% |
0.7% |
5.3% |
|
Karen |
184,593 |
698 |
86.0% |
92.2% |
12.8% |
3.7% |
1.6% |
5.3% |
|
Lower Kabete |
151,914 |
477 |
95.9% |
88.4% |
12.6% |
3.6% |
1.3% |
4.9% |
|
Average |
191,773 |
707 |
91.9% |
93.9% |
12.7% |
4.3% |
1.3% |
5.6% |
|
Upper Mid-End |
||||||||
|
Ridgeways |
167,607 |
778 |
82.2% |
87.4% |
12.8% |
5.0% |
1.4% |
6.4% |
|
Redhill & Sigona |
99,723 |
464 |
89.2% |
96.6% |
14.4% |
4.7% |
1.6% |
6.3% |
|
Runda Mumwe |
151,529 |
743 |
91.9% |
92.3% |
13.5% |
5.3% |
0.9% |
6.2% |
|
Loresho |
167,689 |
705 |
80.5% |
83.1% |
13.2% |
4.9% |
1.2% |
6.1% |
|
South B/C |
111,255 |
410 |
88.3% |
86.2% |
12.5% |
4.3% |
0.6% |
4.9% |
|
Langata |
139,196 |
404 |
92.7% |
89.4% |
10.0% |
3.8% |
0.6% |
4.4% |
|
Lavington |
188,040 |
627 |
91.6% |
91.4% |
12.7% |
4.0% |
0.5% |
4.5% |
|
Average |
146,434 |
590 |
88.1% |
89.5% |
12.7% |
4.6% |
0.8% |
5.4% |
|
Lower Mid-End |
||||||||
|
Ruiru |
67,361 |
345 |
87.2% |
82.2% |
18.7% |
6.0% |
1.7% |
7.7% |
|
Ngong |
59,473 |
353 |
89.1% |
96.4% |
12.5% |
6.4% |
0.3% |
6.7% |
|
Juja |
71,572 |
305 |
86.3% |
80.9% |
16.8% |
5.5% |
1.1% |
6.6% |
|
Kitengela |
64,472 |
302 |
85.6% |
81.9% |
12.6% |
5.0% |
1.3% |
6.3% |
|
Syokimau/Mlolongo |
74,096 |
328 |
87.4% |
90.5% |
18.3% |
4.5% |
1.2% |
5.8% |
|
Athi River |
85,689 |
353 |
86.6% |
94.3% |
13.3% |
4.5% |
1.0% |
5.4% |
|
Rongai |
80,521 |
278 |
95.6% |
95.9% |
16.4% |
4.0% |
1.1% |
5.2% |
|
Thika |
62,484 |
303 |
82.4% |
86.3% |
13.5% |
5.3% |
(0.4%) |
4.9% |
|
Donholm & Komarock |
94,923 |
404 |
88.0% |
96.7% |
12.7% |
4.2% |
(0.2%) |
4.0% |
|
Average |
73,399 |
330 |
87.6% |
89.4% |
15.0% |
5.1% |
0.8% |
5.8% |
Source: Cytonn Research 2022
The key take-outs from the table include;
- Average Total Return - The average total return improved to 5.6%, from 4.8% in Q3’2021, with the y/y capital appreciation coming in at 1.0%,
- Segment Performance - The lower mid end segment was the best in performance with an average total return of 5.8% attributable to an average rental yield of 5.1% and a 0.8% y/y price appreciation compared to the high end and lower-mid end segments with average total returns at 5.6% and 5.4% respectively, and,
- Overall Performance – Overall, the best performing node was Ruiru with an average total return of 7.7% attributable to a relatively high average rental yield of 6.0%, whereas Donholm & Komarock was the least performing node with an average total return of 4.0%, driven by a decline in its overall prices and a low rental yield of 4.2%.
- Apartments Performance
The table below shows the residential apartments performance during Q3’2022;
(All values in Kshs unless stated otherwise)
|
Cytonn Report: Apartments Average Performance Q3’2022 |
||||||||
|
Area |
Price per SQM Q3'2022 |
Rent per SQM Q3'2022 |
Occupancy Q3'2022 |
Uptake Q3'2022 |
Annual Uptake Q3'2022 |
Rental Yield Q3'2022 |
Price Appreciation Q3'2022 |
Total Returns |
|
Upper Mid-End |
||||||||
|
Kilimani |
105,625 |
672 |
84.2% |
88.7% |
22.1% |
5.8% |
0.1% |
6.0% |
|
Loresho |
123,061 |
558 |
87.8% |
97.2% |
10.4% |
4.8% |
1.0% |
5.8% |
|
Westlands |
149,039 |
802 |
83.2% |
87.2% |
22.4% |
5.7% |
0.1% |
5.8% |
|
Kileleshwa |
125,554 |
682 |
84.6% |
89.0% |
15.2% |
5.5% |
0.2% |
5.8% |
|
Upperhill |
132,624 |
762 |
81.2% |
87.7% |
11.1% |
5.0% |
0.6% |
5.7% |
|
Parklands |
118,891 |
628 |
84.2% |
91.0% |
13.8% |
5.3% |
0.1% |
5.4% |
|
Average |
125,799 |
684 |
84.2% |
90.1% |
15.8% |
5.4% |
0.4% |
5.7% |
|
Lower Mid-End Suburbs |
||||||||
|
Waiyaki Way |
86,251 |
536 |
83.9% |
87.7% |
21.1% |
6.3% |
1.4% |
7.6% |
|
South C |
113,464 |
804 |
84.7% |
84.9% |
17.0% |
6.3% |
0.4% |
6.6% |
|
Dagoretti |
83,652 |
536 |
88.5% |
81.5% |
14.4% |
6.1% |
0.2% |
6.3% |
|
Imara Daima |
79,908 |
397 |
86.8% |
86.0% |
11.5% |
5.3% |
0.8% |
6.1% |
|
Donholm & Komarock |
72,884 |
379 |
94.0% |
94.3% |
12.6% |
5.9% |
0.0% |
6.0% |
|
Race Course/Lenana |
97,519 |
633 |
81.3% |
90.9% |
19.3% |
5.8% |
0.1% |
5.9% |
|
Kahawa West |
77,147 |
352 |
88.8% |
86.1% |
10.1% |
5.1% |
0.7% |
5.8% |
|
South B |
105,107 |
443 |
85.3% |
94.0% |
15.0% |
4.4% |
0.3% |
4.6% |
|
Langata |
115,010 |
502 |
81.8% |
88.0% |
13.1% |
4.5% |
(0.7%) |
3.8% |
|
Average |
92,327 |
509 |
86.1% |
88.2% |
14.9% |
5.5% |
0.3% |
5.9% |
|
Lower Mid-End Satellite Towns |
||||||||
|
Ruaka |
108,117 |
546 |
80.7% |
82.8% |
21.5% |
5.1% |
2.3% |
7.4% |
|
Ngong |
64,382 |
360 |
82.3% |
83.0% |
11.7% |
5.6% |
1.7% |
7.3% |
|
Ruiru |
89,418 |
480 |
87.4% |
86.3% |
17.8% |
5.6% |
1.5% |
7.2% |
|
Kikuyu |
81,624 |
474 |
76.6% |
85.8% |
15.7% |
5.2% |
1.9% |
7.2% |
|
Athi River |
58,199 |
329 |
85.2% |
92.8% |
15.2% |
5.6% |
1.4% |
7.0% |
|
Syokimau |
71,302 |
343 |
86.6% |
89.8% |
12.5% |
5.2% |
1.7% |
6.9% |
|
Thindigua |
101,089 |
498 |
89.9% |
80.8% |
17.7% |
5.4% |
1.2% |
6.6% |
|
Rongai |
91,597 |
316 |
89.2% |
76.4% |
12.6% |
6.1% |
(0.2%) |
5.9% |
|
Kitengela |
59,434 |
277 |
85.9% |
97.5% |
10.3% |
5.0% |
0.4% |
5.3% |
|
Average |
80,573 |
403 |
84.9% |
86.1% |
15.0% |
5.5% |
1.3% |
6.8% |
Source: Cytonn Research 2022
The key take-outs from the table include;
- Average Total Return – The average total return for apartments in the NMA slightly increased by 0.1% point to 6.1%, driven by a 0.2% points increase in the average rental yield to 5.3%,
- Segment Performance - The lower mid-end satellite towns segment was the best performing, with an average total return of 6.8% attributable to an average rental yield of 5.5% and an average y/y price appreciation of 1.3%, and,
- Overall Performance - Waiyaki Way was the best performing node with an average total return of 7.6% while Ruaka and Ngong followed with average total returns at 7.4% and 7.3%, respectively. Langata was the lowest performing node with an average total return of 3.8% attributable to an average y/y price depreciation of 0.7%.
For notable highlights during the quarter please see our Cytonn Monthly-July 2022, and Cytonn Monthly-August 2022 Reports. For the month of September;
- Gulf African Bank entered into a mortgage financing agreement with property developer Mi Vida Homes, with an aim of funding mortgages to potential home buyers of their recently completed Mi Vida Phase I project situated along Thika Road. For more information, see Cytonn Weekly #38/2022,
- Stanbic Bank Kenya partnered with three Real Estate developers namely; Superior Homes Kenya, Avic International Real Estate Ltd, and, Safaricom Staff Pension Scheme, to provide mortgages to their potential home buyers. For more information, see Cytonn Weekly #38/2022, and,
- Shelter Afrique, a Pan-African development financier based in Nairobi’s Upperhill District, approved a Kshs 2.2 bn corporate loan towards Maison Super Development (MSD) firm to finance the construction of three ongoing projects in the Democratic Republic of Congo (DRC). For more information, see Cytonn Weekly #38/2022.
Weekly Highlights;
During the week, Harambee Investment Cooperative Society (HICS), the investment subsidiary vehicle of Harambee Sacco Society Ltd, announced plans to develop housing projects in five counties namely; Nairobi, Nakuru, Kisumu, Laikipia and Mombasa. The housing projects by HICs are aimed at providing investment opportunities for its 650 members which is expected to reach 1,000 by the end of the year. In addition to this, HICs is looking to utilize the mortgage facility dubbed Harambee Home Loan by Harambee Sacco which is in partnership with the Kenya Mortgage Refinancing Company (KMRC), in order to provide a financing option to potential home buyers. By this, HICs also aims at increasing its investment footprint in the property market with its other project in the pipeline being a housing project at Kahawa Sukari, as it sells it’s 40 apartments near Jacaranda Estate, among other projects.
Additionally, during the week, Safaricom Investment Cooperative (SIC) began the construction of an affordable housing project dubbed Miran Residence in Ruaka, Kiambu County. The Kshs 750.0 mn project has a completion date of June 2024 and will comprise of 200 units in its phase I, distributed into studio apartments, studio lofts, one bedrooms, and two bedrooms, with prices ranging between Kshs 3.2 mn and Kshs 6.5 mn. This brings SIC’s number of projects undertaken so far in Kiambu County to three, with the other projects being Marina Kiambu Gardens, and, Ruaka Ridge. Other projects by SIC include Blueball Apartments in Syokimau, Kantafu Serene Homes, and, Rongai Villas. SIC’s decision to re-invest in Ruaka is mainly driven by;
- High concentration of a growing middle income population in the area which drives demand for quality homes,
- Proximity to adequate amenities such as shopping malls and international organizations,
- Improving infrastructure services backed up by Kiambu County Government’s decision to support the Miran project on the same, and,
- Remarkable returns generated in the area which recorded a 7.4% total return to investors in Q3’2022, compared to the market average of 6.8%.
Upon completion, the project is expected to provide decent and affordable homes to potential tenants, as well as further boost investor confidence in the affordable housing program which continues to gain traction in the country, as it is also part of the initiatives by the new government regime in its aim to deliver 250,000 units every year. Key to note, we shall cover a topical on the feasibility of affordable housing in the coming weeks.
Our outlook for the residential sector is NEUTRAL as we expect the sector’s performance to be driven by more development activities, availability of mortgages, and, attractive returns in select areas. However, setbacks such as the increasing construction costs, limited credit and constrained mortgage uptake, are expected to weigh the optimum performance of the sector. For apartments, the best opportunity is investment in areas such as Waiyaki Way, Ruaka, Ruiru, and Ngong driven by higher returns, appreciation as well improved infrastructure and amenities; for detached units, the best investment opportunity is in areas such as Ruiru, Kitisuru, Juja and Ngong, driven by higher uptake and total returns to investors.
- Commercial Office Sector
The table below highlights the performance of the Nairobi Metropolitan Area (NMA) Commercial Office sector since the beginning of 2021:
|
Cytonn Report: Nairobi Metropolitan Area (NMA) Commercial Office Returns Over Time |
||||||||
|
Year |
Q1'2021 |
H1'2021 |
Q3'2021 |
FY'2021 |
Q1'2022 |
H1'2022 |
Q3'2022 |
∆ FY'2021/Q3'2022 |
|
Occupancy % |
76.3% |
75.8% |
79.9% |
77.6% |
77.9% |
77.9% |
78.2% |
0.6% |
|
Asking Rents (Kshs/SQFT) |
92 |
93 |
94 |
94 |
94 |
95 |
95 |
1.7% |
|
Average Prices (Kshs/SQFT) |
12,228 |
12,224 |
12,479 |
12,106 |
12,113 |
12,142 |
12,221 |
0.3% |
|
Average Rental Yields (%) |
6.8% |
6.9% |
7.20% |
7.3% |
7.3% |
7.4% |
7.4% |
0.1% |
Source: Cytonn Research
The key take-outs from the table include;
- Average Rental Yield – the NMA commercial office sector realized a slight increase in the average rental yield of 0.1% points to 7.4% in Q3’2022, from 7.3% that was recorded in FY’2021. This was mainly driven by a 1.7% increase in the average rents per SQFT to Kshs 95, owing to the addition of prime office spaces,
- Average occupancy rate – similarly, the average occupancy slightly improved by 0.6% points to 78.2%, from 77.6% realized in FY’2021, attributed to the resumption and expansion of various firms such as CCI Group and Nairobi Garage, among others, and,
- Selling prices – The average selling prices per SQFT increased by 0.3% to Kshs 12,221, from Kshs 12,106 in FY’2021, attributed to the increasing costs of construction materials.
For the submarket performance, Gigiri, Westlands and Karen recorded the highest rental yields of 8.6% 8.2% and 8.0%, respectively, in Q3’2022 compared to the market average of 7.4%. Their performance was mainly driven by the presence of high-quality office spaces that generate prime rents. On the other hand, Mombasa Road registered the lowest rental yield of 5.1%. This was driven by the low rents that the office spaces in the area attracts, which came in at Kshs 73 per SQFT in Q3’2022, 24.0% lower than the market average of Kshs 95 per SQFT. The table below shows the Nairobi Metropolitan Area (NMA) sub-market performance:
|
Cytonn Report: Nairobi Metropolitan Area Commercial Office Submarket Performance Q3’2022 |
|||||||||
|
Area |
Price/SQFT Q3’2022 |
Rent/SQFT Q3’2022 |
Occupancy Q3’2022 |
Rental Yield Q3’2022 |
Price Kshs/ SQFT FY 2021 |
Rent Kshs/SQFT FY 2021 |
Occupancy FY 2021(%) |
Rental Yield FY 2021(%) |
∆ in Rental Yields (% points) |
|
Gigiri |
13,500 |
118 |
81.0% |
8.6% |
13,500 |
119 |
81.3% |
8.6% |
0.0% |
|
Westlands |
12,032 |
107 |
75.7% |
8.2% |
11,972 |
104 |
75.5% |
8.1% |
0.1% |
|
Karen |
13,431 |
107 |
83.0% |
8.0% |
13,325 |
106 |
83.0% |
7.7% |
0.3% |
|
Parklands |
11,662 |
91 |
81.0% |
7.6% |
11,336 |
91 |
80.1% |
7.6% |
0.0% |
|
Kilimani |
12,260 |
92 |
80.8% |
7.4% |
12,364 |
91 |
79.8% |
7.1% |
0.3% |
|
Nairobi CBD |
11,971 |
82 |
84.4% |
7.1% |
11,787 |
82 |
82.8% |
6.8% |
0.3% |
|
Upperhill |
12,586 |
96 |
75.2% |
6.9% |
12,409 |
94 |
78.0% |
7.0% |
(0.1%) |
|
Thika Road |
12,571 |
77 |
77.9% |
6.6% |
12,571 |
79 |
76.3% |
5.7% |
0.9% |
|
Mombasa Road |
11,325 |
73 |
65.5% |
5.1% |
11,250 |
73 |
64.2% |
5.1% |
0.0% |
|
Average |
12,221 |
95 |
78.2% |
7.4% |
12,106 |
94 |
77.6% |
7.3% |
0.1% |
Source: Cytonn Research 2022
During the month of September 2022;
- Nairobi Garage, an office supply firm in Kenya, opened a two-floor outlet at Nairobi’s 20th Century Plaza located along Mama Ngina Street with the new office space constituting of 12,000 SQFT, an addition to its five existing outlets in Kilimani, Karen and Westlands. For more information, see our Cytonn Weekly #36/2022.
We have a NEUTRAL outlook for the NMA commercial office sector whose optimum performance continues to be weighed down by the existing oversupply of space in the market. However, we expect the performance to be cushioned by the slow rising demand and uptake for space, coupled with the decline in the number of incoming developments in the pipeline that will allow for uptake of space for the existing developments. Investment opportunities lie in Gigiri, Westlands, and Karen which offer relatively higher returns compared to the market averages.
- Retail Sector
The table below highlights the performance of the retail sector in the Nairobi Metropolitan Area since the beginning of 2021;
|
Cytonn Report: Summary of Retail Sector Average performance |
||||||||
|
Item |
Q1'2021 |
H1'2021 |
Q3'2021 |
FY’2021 |
Q1’2022 |
H1’2022 |
Q3'2022 |
Rental Yield Change FY'2021/Q3'2022 |
|
Asking Rents (Kshs/SQFT) |
166 |
177 |
177 |
170 |
170 |
173 |
171 |
0.3% |
|
Occupancy (%) |
75.0% |
77.96% |
78.0% |
76.8% |
77.2% |
75.9% |
76.1% |
(0.7%) |
|
Rental Yields |
7.4% |
8.1% |
8.1% |
7.8% |
7.9% |
7.8% |
7.6% |
(0.2%) |
Source: Cytonn Research
The key take-outs from the table include;
- Average Rental Yield - The average rental yield for the NMA retail spaces declined by 0.2% points to 7.6% in Q3’2022, from 7.8% in FY’2021. This was mainly on the back of a 0.7% points decline in the average occupancy which came in at 76.1%, from 76.8% recorded in FY’2021, and,
- Asking Rents - The average asking rents increased by 0.3% to Kshs 171 per SQFT, from the Kshs 170 per SQFT registered in FY’2021 driven by an increase in quality retail spaces which attract high rents.
In terms of submarket performance, Kilimani, Karen, and, Westlands were the best performing nodes with average rental yields of 9.8%, 8.8% and 8.6%, respectively, compared to the overall market average of 7.6%. The remarkable performance in the three nodes was mainly driven by the presence of quality retail spaces fetching higher rents and yields, coupled with the ample quality infrastructure enhancing investments. On the other hand, Eastlands recorded the least rental yields at 5.7%, 1.9% points lower than the average market rates of 7.6%, as a result of low rental charges at Kshs 127 per SQFT against a market average of Kshs 171 Per SQFT. The table below shows the submarket performance in the Nairobi Metropolitan Area (NMA):
|
Cytonn Report: Nairobi Metropolitan Area Retail Market Performance Q3’2022 |
|||||||
|
Area |
Rent Kshs /SQFT Q3’2022 |
Occupancy% Q3’2022 |
Rental Yield Q3’2022 |
Rent Kshs /SQFT FY’2021 |
Occupancy% FY’2021 |
Rental Yield FY’2021 |
FY’ 2021 ∆ in Rental Yield (% points) |
|
Kilimani |
184 |
84.8% |
9.8% |
183 |
86.0% |
9.8% |
0.0% |
|
Karen |
205 |
78.6% |
8.8% |
202 |
84.0% |
9.8% |
(1.0%) |
|
Westlands |
214 |
73.6% |
8.6% |
213 |
78.8% |
10.0% |
(1.4%) |
|
Kiambu/Limuru road |
187 |
71.7% |
7.8% |
180 |
74.2% |
7.7% |
0.1% |
|
Ngong Road |
169 |
78.8% |
7.5% |
171 |
79.0% |
7.7% |
(0.2%) |
|
Mombasa road |
148 |
80.8% |
7.3% |
148 |
75.0% |
6.8% |
0.4% |
|
Thika Road |
158 |
73.8% |
6.7% |
161 |
74.0% |
6.7% |
0.0% |
|
Satellite towns |
138 |
72.5% |
6.1% |
142 |
69.0% |
6.2% |
(0.1%) |
|
Eastlands |
127 |
73.0% |
5.7% |
133 |
71.6% |
5.6% |
0.1% |
|
Average |
171 |
76.1% |
7.6% |
170 |
76.8% |
7.8% |
(0.2%) |
Source: Cytonn Research 2022
For notable highlights during the quarter please see our Cytonn Monthly-July 2022, and Cytonn Monthly-August 2022 Reports. For the month of September;
- Naivas Supermarket opened a new outlet at Elgon View Mall in Eldoret, bringing its total number of branches countrywide to 85. The new 39,999 SQFT outlet, is the 4th outlet opened by the retailer in Eldoret town, with the other three being located at Zion Mall, Referral, and Sokoni. For more information, see Cytonn Weekly #36/2022.
Weekly Highlight;
During the week, local eyewear Optica Limited opened a new outlet along Kilimani’s Rose Avenue, bringing its total outlets countrywide to 67. This comes barely a week after the retailer opened a new outlet at Nextgen Mall, signifying its rapid expansion drive to further reach out to its customers. The retailer has opened three other new outlets so far in 2022 at Rubis Business Block in Kitengela, and in Argwings Arcade in Kilimani in May 2022, and another in Ruiru earlier in January 2022. For more information, see Cytonn Weekly #36/2022.
We maintain a NEUTRAL outlook for NMA’s retail sector whose performance continues to be highly driven by; i) the aggressive expansion drive by both local and international retailers such as Naivas, Simbisa brands, Eat’N’Go, and QuickMart among others ii) positive demographics enhancing investments, and, iii) increasing foreign investor confidence in the Kenyan retail market which in turn promote expansion. However, factors such as the continued focus on e-commerce which weighs down the optimum demand and uptake of physical retail spaces, coupled with an existing oversupply of space, continues to hinder the optimum performance of the sector. Investment opportunity lies in Karen, Kilimani, and, Westlands which offer relatively higher returns compared to the market averages.
- Hospitality Sector
In Q3’2022, two hospitality related industry reports were released and the key-take outs were as stated below;
|
# |
Report |
Key Take-out |
|
1 |
The Q1’2022 Gross Domestic Product report by the Kenya National Bureau of Statistics (KNBS) |
|
|
2 |
The June 2022 Leading Economic Indicators (LEI), by Kenya National Bureau of Statistics |
|
Other notable highlights recorded during the quarter include;
- Global five-star hotel Fairmont Mount Kenya Safari Club located in Nanyuki, resumed activities after having been closed for more than two years, following the onset of Covid-19 pandemic that caused cashflow challenges. For more information, see our Cytonn Weekly #27/2022, and,
- Competition Authority of Kenya (CAK) approved the sale of 680 Hotel in Nairobi’s city center to Maanzoni Lodges, and Crowne Plaza Hotel in Upper Hill to Kasada Hospitality Fund. This came one month after the two hotels were acquired by the respective buyers for a total of Kshs 5.0 bn; 680 Hotel valued at Kshs 1.2 bn, and, Crowne Plaza which was valued at Kshs 4.6 bn, while its rebranding and management was to be taken over by Accor Hotels, from Intercontinental Hotels Group. For more information, see our Cytonn Weekly #34/2022.
We have a POSITIVE outlook for the hospitality sector whose performance is expected to be driven by; i) increasing investor confidence in the sector, ii) peaceful post-electioneering period that has enhanced stability in the Kenyan economy, iii) increased activities in sports, tourism, leisure, and conference activities such as the annual world rally championship program held at Naivasha, and, the world travel awards which will be held at Nairobi’s Kenyatta International Convention Centre (KICC) on October 15th 2022, among others, iv) continuous roll out of COVID-19 vaccine which in turn boost tourism confidence and arrival into the country, v) Positive accolades such as the 28th World Travel Awards winners, where Nairobi was voted as Africa’s leading business travel destination, and, vi) the aggressive marketing of Kenya’s tourism sector via the Magical Kenya Platform, and, Kenya Tourism Board.
- Mixed Use Developments
In Q3’2022;
- Local Authorities Pension Fund (LAPF) Kenya in August announced plans to construct a mixed use development facility at an estimated cost of Kshs 10.0 bn in Nakuru County. The mixed use facility will comprise of a shopping mall, a five-star hotel, a warehouse block, residential apartments, a kindergarten school, a petrol station, and, an amusement park. For more information, see Cytonn Weekly #31/2022, and,
- Property developer Mi Vida Homes completed and launched the first phase of the Mi Vida housing project worth Kshs 12.0 bn. For more information, see Cytonn Weekly #31/2022.
Our outlook on Mixed-Use Developments (MUDs) is NEUTRAL supported by the high returns on investment in comparison to single use developments. Despite offering impressive returns for investors, performance of MUDs is expected to be weighed down by existing oversupply in select Real Estate sectors.
- Land Sector
In Q3’2022, the NMA land sector performance remained resilient having recorded a 1.6% capital appreciation to Kshs 130.42 mn per acre, from Kshs 130.41 mn per acre recorded a similar period last year. The sector’s improvement in performance was driven by;
- Increased construction activities particularly in the residential and infrastructure sectors that in turn fueled the demand for land,
- Positive demographics evidenced by Kenya’s high population and urbanization growth rates, as well as the rising middle income population,
- Continued focus on the development of infrastructure such as roads, railways, water and sewer lines by the previous government regime, hence enhancing and opening up areas for investments, as well as boosting land prices, and,
- Availability of amenities such as, learning institutions, shopping malls, and organizations among others, which promote demand for land.
Overall Performance - Un-serviced land in the satellite towns of Nairobi recorded the highest YoY capital appreciation of 4.0% with the demand being supported by: i) their affordability, ii) concentration of affordable housing projects in the satellite towns thus driving demand for land, iii) scarcity and high land prices within Nairobi, and, iv) improved accessibility to the areas. Notably, commercial zones recorded a 1.1% decline owing to their high prices, coupled with some developers halting their development plans in these areas which are marred with oversupply of buildings. The table below shows the overall performance of the sector during the quarter:
|
Price in Kshs Per Acre |
|||
|
Cytonn Report: Summary of the Performance Across All regions Q3’2022 |
|||
|
Location |
Price Q3'2021 |
Price Q3'2022 |
Annualized Capital Appreciation |
|
Un-serviced land-satellite Towns |
14.4 mn |
15.2 mn |
4.0% |
|
Nairobi Suburbs- High Rise Residential Areas |
81.9 mn |
84.2 mn |
2.8% |
|
Serviced land-Satellite Towns |
15.5 mn |
15.9 mn |
1.8% |
|
Nairobi Suburbs- Low Rise Residential Areas |
133.7 mn |
134.8 mn |
0.8% |
|
Nairobi Suburbs- Commercial Areas |
406.5 mn |
402.2 mn |
(1.1%) |
|
Average |
130.41 mn |
130.42 mn |
1.6% |
Source: Cytonn Research 2022
Sub-markets Performance - For the satellite areas, Juja and Limuru were the best performing nodes both with 8.5% YoY capital appreciations owing to: i) improved infrastructure developments such as the Kshs 30.0 bn Limuru-Nyeri Mau Mau road, and, ii) high concentration of learning institutions around and within the areas. Conversely, Ruai recorded the highest capital depreciation of 6.8% indicating a decline in demand as developers shift their focus to areas with more property developments, coupled with the area being quite far from Nairobi city center. For Nairobi suburbs, Embakasi recorded the highest appreciation of 8.2% due to the increased demand for development land to cater for the rapidly growing population in the area. The table below shows NMA’s land performance by submarkets in Q3’2022;
|
Price in Kshs per Acre |
|||
|
Cytonn Report: Nairobi Metropolitan Area Land Performance By Submarkets – Q3’2022 |
|||
|
Location |
Price Q3'2021 |
Price Q3'2022 |
Capital Appreciation |
|
Satellite Towns - Unserviced Land |
|||
|
Juja |
12.0 mn |
13.0 mn |
8.5% |
|
Limuru |
20.0 mn |
21.7 mn |
8.5% |
|
Rongai |
19.0 mn |
20.3 mn |
6.8% |
|
Utawala |
16.0 mn |
16.1 mn |
1.1% |
|
Athi River |
4.9 mn |
4.7 mn |
(5.1%) |
|
Average |
14.4 mn |
15.6 mn |
4.0% |
|
Nairobi Suburbs – High Rise Areas |
|||
|
Embakasi |
70.3 mn |
76.6 mn |
8.2% |
|
Kasarani |
73.8 mn |
77.6 mn |
4.9% |
|
Dagoretti |
101.5 mn |
98.4 mn |
(3.2%) |
|
Average |
81.9 mn |
84.2 mn |
2.8% |
|
Satellite Towns - Serviced Land |
|||
|
Ruiru |
23.8 mn |
25.2 mn |
6.0% |
|
Thika |
11.0 mn |
11.6 mn |
5.6% |
|
Rongai |
17.0 mn |
17.8 mn |
4.7% |
|
Syokimau |
15.2 mn |
15.5 mn |
2.0% |
|
Athi River |
14.1 mn |
14.0 mn |
(1.0%) |
|
Ruai |
12.2 mn |
11.3 mn |
(6.8%) |
|
Average |
15.5 mn |
15.9 mn |
1.8% |
|
Nairobi High End Suburbs (Low and High Rise Areas) |
|||
|
Kitisuru |
86.9 mn |
90.4 mn |
4.0% |
|
Ridgeways |
83.0 mn |
86.0 mn |
3.6% |
|
Karen |
63.3 mn |
65.2 mn |
3.0% |
|
Runda |
81.1 mn |
82.2mn |
1.3% |
|
Spring Valley |
169.5 mn |
168.7 mn |
(0.5%) |
|
Kileleshwa |
318.5 mn |
316.2 mn |
(0.7%) |
|
Average |
133.7 mn |
134.8 mn |
0.8% |
|
Nairobi Suburbs - Commercial Zones |
|||
|
Riverside |
329.2 mn |
342.1 mn |
3.9% |
|
Kilimani |
379.1 mn |
384.7 mn |
1.5% |
|
Upperhill |
470.8 mn |
461.3 mn |
(2.0%) |
|
Westlands |
447.1 mn |
420.3 mn |
(6.0%) |
|
Average |
406.5 mn |
402.1 mn |
(1.1%) |
Source: Cytonn Research 2022
We maintain a POSITIVE outlook for the land sector in the Nairobi Metropolitan Area that continues to be a steadfast investment avenue having shown stability despite economic downtrends such as the COVID – 19 pandemic and political uncertainty, as well as devaluation of the currency among others. We expect an to be supported by; i) anticipated increase in the focus on Affordable Housing projects as well as private sector projects, ii) positive demographics driving demand for land, and, iii) government’s efforts towards ensuring efficient land transactions.
- Infrastructure
For notable highlights during the quarter please see our Cytonn Monthly-July 2022, and Cytonn Monthly-August 2022 Reports.
Weekly highlight;
- During the week, the Kenya Urban Roads Authority (KURA) through the County Government of Vihiga announced plans to upgrade and revamp eleven roads in Vihiga municipality totaling 20.5 Km at a cost of Kshs 2.5 bn. The project will be jointly implemented by the World Bank under the World Bank urbanization program, with the select areas earmarked for construction being; Mbale, Majengo, Gisambai, Mudete, and Chavakali. Upon completion, the roads are expected to; i) enhance transport services, ii) open up the areas for Real Estate investments, iii) boost property prices, and, iv) promote trade activities within the region.
We expect continued construction and rehabilitation activities in the sector, although at a slower rate given the change in government regime that might see to it a slow implementation of new and the previous government projects. Conversely, some of the initiatives that we expect the government to employ in a bid to implement infrastructure projects include; i) issuance of infrastructure bonds to raise funds for construction, ii) project partnership strategies such as Joint Ventures and Public Private Partnerships, and, iii) yearly budget allocations.
- Industrial Sector
In Q3’2022;
- Stihl Group, a German based manufacturing company announced plans to open a new subsidiary, Stihl East Africa, in Nairobi Kenya by the end of August 2022. The move would make Kenya the first East African hub by the manufacturing company and the second African country after South Africa, where the company established a subsidiary in 1996. For more information, see our Cytonn Monthly –August 2022.
We expect the Kenyan Industrial sector to continue improving driven by; i) Kenya’s recognition as a business hub in the East Africa region, ii) prioritization in fiscal budgetary allocations to the manufacturing sector, iii) growing e–commerce driving demand for storage facilities, and iv) infrastructural developments which have promoted and eased the transportation of goods.
For notable highlights during the year, as well as the statutory reviews, see our Cytonn Q1’2022 Markets Review, Cytonn H1’2022 Markets Review, Cytonn Monthly-July 2022 and Cytonn Monthly-August 2022.
- Listed Real Estate
In the Nairobi Stock Exchange, ILAM Fahari I-REIT closed the month of September trading at an average price of Kshs 7.1 per share, representing an 11.8% Year-to-Date (YTD) increase from Kshs 6.4 per share. However, on an Inception-to-Date (ITD) basis, the performance was a 64.5% decline from Kshs 20.0 per share. The graph below shows Fahari I-REIT’s performance from November 2015 to 30th September 2022:
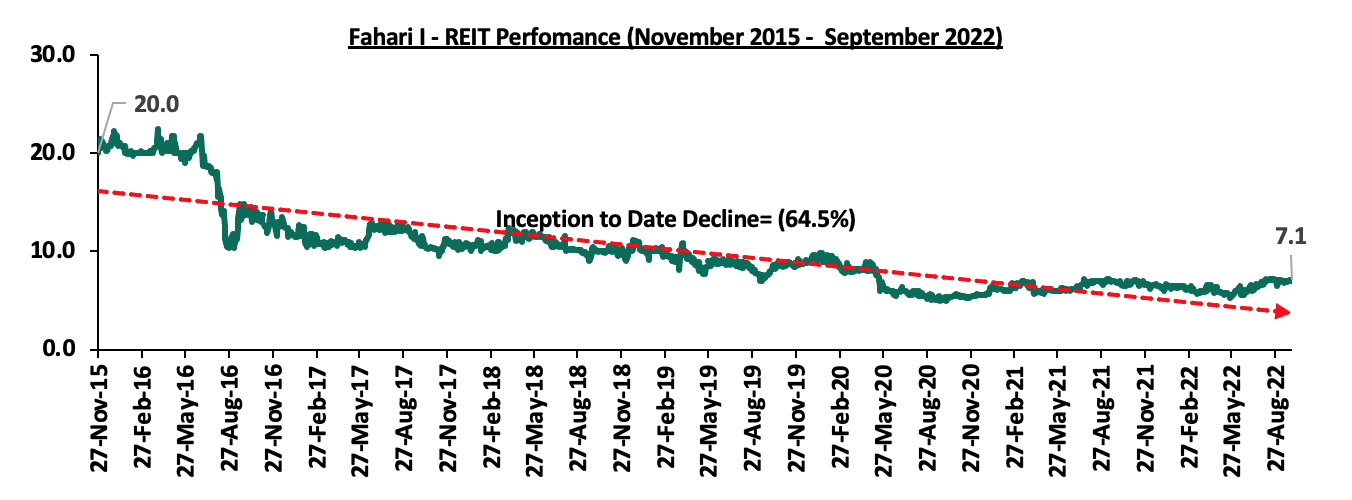
In the Unquoted Securities Platform, Acorn D-REIT and I-REIT closed the month at Kshs 23.8 and Kshs 20.8 per unit, respectively, as at 2nd September 2022. The performance represented a 19.0% and 4.0% gain for the D-REIT and I-REIT, respectively, from the Kshs 20.0 inception price. The volumes traded for the D-REIT and I-REIT came in at 5.5 mn and 14.5 mn shares, respectively, with a turnover of Kshs 117.0 mn and Kshs 300.3 mn, respectively, since its Inception in February 2021.
For notable highlights during the quarter please see our Cytonn Monthly-July 2022, and Cytonn Monthly-August 2022 Reports.
We maintain a NEUTRAL outlook for the Real Estate sector whose upward performance will be mainly driven by; i) initiation and implementation of various housing projects, ii) slow but rising expansion and uptake of space in the office market, iii) aggressive expansion in the retail sector, iv) growing foreign investor confidence in Kenya’s property market thus driving investments and expansion, v) continuous recovery of the hospitality sector, vi) enforcement of various statutory regulations to enhance smooth transaction of activities in the property market, and, vii) continued growth of the industrial sector. However, the existence of excess supply of space in the commercial office and retail sectors, slow delivery of affordable housing projects, high cost of construction materials, and, the low investor appetite for REITs is expected to hinder the optimum performance of the sector.
Disclaimer: The views expressed in this publication are those of the writers where particulars are not warranted. This publication, which is in compliance with Section 2 of the Capital Markets Authority Act Cap 485A, is meant for general information only and is not a warranty, representation, advice or solicitation of any nature. Readers are advised in all circumstances to seek the advice of a registered investment advisor

- Talk to us
- Kenya
- P.O Box 20695 - 00200, Nairobi, Kenya
- Cell +254709101200
- Tel +254709101200
- WhatsApp +254741676635
- United States
- +254709101200
- DOWNLOAD OUR APP
-


- Kenya
- 8th Floor, Pinetree Plaza, Kaburu Drive, Ngong Road, Nairobi, Kenya
- USA
- Suite 1150, 1775 Eye Street NW, USA, Washington DC 20006, USA
- Investments
- High Yield
- Private Equity
- Real Estate
- Real Estate
- RiverRun Estates
- Cytonn Towers
- The Ridge
- Taraji Heights
- The Alma