Sep 12, 2020
Following the release of the H1’2020 results by Kenyan listed banks, the Cytonn Financial Services Research Team undertook an analysis on the financial performance of the listed banks and identified the key factors that shaped the performance of the sector, and our expectations of the banking sector for the rest of the year.
Core Earnings per Share recorded a weighted decline of 33.6% in H1’2020, compared to a weighted growth of 9.0% recorded in H1’2019. As reported by most of the banks, the decline in the earnings was mainly attributable to the increased provisioning on the back of the subdued business environment. Asset quality for listed banks deteriorated in H1’2020 with the gross NPL ratio rising by 1.6% points to 11.6% from 10.0% in H1’2019. This was high compared to the 5-year average of 8.5%. The banking sector was also keen on restructuring loans in order to offer relief for its customers against the effects of COVID-19. The loan restructuring involved placing moratoriums on both interest and principal payments for three months to one year. As at the end of June 2020, the total amount of loan restructured stood at Kshs 844.0 bn representing 29.1% of the banking sector loan book.
The report is themed “Depressed earnings and deteriorating asset quality amid the COVID-19 Operating Environment” as we assess the key factors that influenced the performance of the banking sector in H1’2020, the key trends, the challenges banks faced, and areas that will be crucial for growth and stability of the banking sector going forward. As such, we shall address the following:
- Key Themes That Shaped the Banking Sector Performance in H1’2020,
- Summary of The Performance of the Listed Banking Sector in H1’2020,
- The Focus Areas of the Banking Sector Players Going Forward, and,
- Brief Summary and Ranking of the Listed Banks based on the Outcome of Our Analysis.
Section I: Key Themes That Shaped the Banking Sector Performance in H1’2020
Below, we highlight the key themes that shaped the banking sector in H1’20120 which include regulation, monetary policy, consolidation, asset quality, and capital conservation:
- Regulation :
- Guidance on Loan Restructuring: The Central Bank of Kenya on March 27th, 2020 provided commercial banks and mortgage finance companies with guidelines on loan reclassification, and provisioning of extended and restructured loans as per the Banking Circular No 3 of 2020. The key take-outs from the circular included:
-
- Central Bank stipulated that banks would be allowed to extend loan repayments for their customers for a period not more than one year,
- The cost of restructuring and extension of loans would be met by the banks and the banks would have to report any restructuring in relation to the COVID-19 pandemic to the Central Bank monthly,
- Banks would be required to keep a record of all restructured and extended loans with the details of how the pandemic has affected specific customers whose loans are restructured and monitoring measures adopted by the bank, and,
- Personal loans that have been extended or restructured by banks would not be subjected to the classification of renegotiated loans stipulated in CBK’s prudential guidelines meaning that banks would not have to classify the loans as non-performing loans.
According to data from the July 2020 Monetary Policy Committee (MPC) Meeting, this has seen a total of Kshs 844.0 bn, representing 29.1% of the total Kshs 2.9 tn banking sector loan book, being restructured as at June 2020. The table below highlights some of the major banks that have disclosed the number of loans they have restructured;
|
No. |
Bank |
Amount Restructured (Kshs bn) |
% of restructured loans to total loans |
H1’2020 y/y Change in Loan loss provision |
|
1 |
Kenya Commercial Bank |
120.2 |
21.7% |
263.8% |
|
2 |
Equity Group Holdings |
92.0 |
23.5% |
773.4% |
|
3 |
Diamond Trust Bank |
64.0 |
31.8% |
249.2% |
|
4 |
NCBA Group |
58.0 |
23.4% |
180.9% |
|
5 |
Absa Bank Kenya |
57.0 |
28.2% |
228.1% |
|
6 |
Co-operative Bank of Kenya |
39.2 |
14.4% |
57.9% |
|
7 |
Standard Chartered Bank of Kenya |
22.0 |
16.4% |
328.8% |
|
|
Total |
452.4 |
22.8% |
297.4% |
- Consolidation: Consolidation activity remained one of the highlights witnessed in H1’2020, in line with our expectations, as players in the sector were either acquired or merged, leading to the formation of relatively larger, well-capitalized, and possibly more stable entities. The following were the major M&A’s activities witnessed during the first half of 2020:
-
- On 27th January 2020, Nigerian lender, Access Bank PLC completed the acquisition of a 100% stake in Transnational Bank PLC for an undisclosed amount, with Access Bank PLC targeting to enhance its corporate and retail banking business in Kenya through the acquisition. Access Bank is Nigeria’s largest lender by assets, with an asset base of USD 16.7 bn (equivalent to Kshs 1.7 tn) as at Q1’2020. The deal will see Nigerian banks deepen their presence in Kenya with the United Bank of Africa (UBA) and Guarantee Trust Bank already in the market. For more information on the transaction, see Cytonn Weekly #03/2020,
- On 7th April 2020, the Central Bank of Kenya (CBK) approved the acquisition of a 51.0% stake in Mayfair Bank Limited by an Egyptian lender, Commercial International Bank (CIB), effective 1st May 2020 for an undisclosed amount. The Central Bank of Kenya (CBK) welcomed the transaction, citing it will diversify and strengthen the resilience of the Kenyan banking sector. Commercial International Bank, Egypt’s leading private sector bank, has an asset base of USD 24.2 bn (Kshs 2.5 tn) as of December 2019. CIB’s business model focusses on individuals, SMEs, institutions, and corporates and will be the first Egyptian bank to establish a presence in Kenya. The deal will see CIB provide Mayfair Bank Limited with the requisite skills, resources, and infrastructure to scale up its business. For more information on the transaction, see Cytonn Weekly #17/2020,
- On 4th May 2020, the Central Bank of Kenya approved the acquisition of Imperial Bank’s assets and assumption of liabilities worth Kshs 3.2 bn each by KCB Group effective 2nd June 2020. The move will see Imperial Bank depositors paid a total of Kshs 3.2 bn over a period of 4 years and will have cumulatively recovered 37.3% of the deposits since 2015 when payments commenced. Imperial Bank was put under receivership (a process that can assist creditors to recover funds in default and can help troubled companies to avoid bankruptcy) in October 2015 due to inappropriate banking practices, with the CBK transferring Imperial Bank’s management and control to the KDIC. For more information on the transaction, see Cytonn Weekly #21/2020, and,
- On 23rd June 2020, Equity Group Holdings announced it had mutually agreed with Atlas Mara to call off plans to acquire banking assets in four countries in exchange for shares in Equity Group. This follows a January announcement by the board of Equity Group announcing the extension of discussions between the Group and Atlas Mara after the expiry of the transaction period before the two parties could sign a detailed transaction agreement. Read more information on the same here.
Other mergers and acquisitions activities announced after H1’2020 include;
- On 11th August 2020, Equity Group Holdings completed the 66.5% stake acquisition of the Banque Commerciale Du Congo (BCDC) at a cost of USD 95.0 mn (Kshs 10.3 bn). The acquisition was first announced by the group on 18th November 2019 and was subject to approvals from the Central Bank of Kenya (CBK), Democratic Republic of Congo’s Central Bank, and the COMESA Competition Commission. Initially, the deal was to cost USD 105.0 mn (Kshs 11.4 bn), however factoring in the adverse effects of the COVID-19 pandemic on the two economies, the two parties agreed to reduce the amount to USD 95.0 mn (Kshs 10.3 bn). For more information on the transaction, see Cytonn Weekly #33/2020,
- On 25th August 2020, Co-operative Bank Kenya completed the 90.0% acquisition of Jamii Bora Bank and rebranded it to Kingdom Bank Limited. The Central Bank of Kenya approved the acquisition of a 90.0% stake of Jamii Bora’s shareholding by the Co-operative Bank, which was to be completed on 21st August 2020 after the deal received all regulatory approval following approval by the National Treasury on 4th August 2020. In March 2020, the Co-operative bank opened talks of a 100.0% acquisition of Jamii Bora Bank (JBB) before varying their offer to a 90.0% stake for Kshs 1.0 bn effectively valuing Jamii Bora Bank at Kshs 1.1 bn. For more information on the transaction, see Cytonn Weekly #35/2020, Cytonn Weekly #32/2020, and Cytonn Weekly #26/2020, and,
- On 20th July 2020, I&M Holdings plc issued a cautionary statement to its shareholders on its intention to acquire 90.0% of the share capital of Orient Bank Limited Uganda (OBL). Once completed, this will be the third bank acquisition in 2020 after the CBK gave a go-ahead to Nigerian lender, Access Bank PLC to acquire a 100.0% stake in Transnational Bank PLC and the 90.0% acquisition of Jamii Bora Bank by Co-operative Bank. The proposed transaction will be subject to approval from the Central Bank of Kenya, Central Bank of Uganda, the Capital Markets Authority, and the company shareholders. Read more on the same here.
Below is a summary of the deals in the last 5-years that have either happened, been announced, or expected to be concluded:
|
Acquirer |
Bank Acquired |
Book Value at Acquisition (Kshs. Bns) |
Transaction Stake |
Transaction Value |
P/Bv Multiple |
Date |
|
Co-operative Bank |
Jamii Bora Bank |
3.4 |
90.0% |
1.0 |
0.3x |
Aug-20 |
|
Commercial International Bank |
Mayfair Bank Limited |
1.0 |
51.0% |
Undisclosed |
N/D |
May-20* |
|
Access Bank PLC (Nigeria) |
Transnational Bank PLC. |
1.9 |
100.0% |
1.4 |
0.7x |
Feb-20* |
|
Equity Group |
Banque Commerciale Du Congo |
8.9 |
66.5% |
10.3 |
1.2x |
Nov-19* |
|
KCB Group |
National Bank of Kenya |
7.0 |
100.0% |
6.6 |
0.9x |
Sep-19 |
|
CBA Group |
NIC Group |
33.5 |
53%:47% |
23.0 |
0.7x |
Sep-19 |
|
Oiko Credit |
Credit Bank |
3.0 |
22.8% |
1.0 |
1.5x |
Aug-19 |
|
CBA Group** |
Jamii Bora Bank |
3.4 |
100.0% |
1.4 |
0.4x |
Jan-19 |
|
AfricInvest Azure |
Prime Bank |
21.2 |
24.2% |
5.1 |
1.0x |
Jan-19 |
|
KCB Group |
Imperial Bank |
Unknown |
Undisclosed |
Undisclosed |
N/A |
Dec-18 |
|
SBM Bank Kenya |
Chase Bank Ltd |
Unknown |
75.0% |
Undisclosed |
N/A |
Aug-18 |
|
DTBK |
Habib Bank Kenya |
2.4 |
100.0% |
1.8 |
0.8x |
Mar-17 |
|
SBM Holdings |
Fidelity Commercial Bank |
1.8 |
100.0% |
2.8 |
1.6x |
Nov-16 |
|
M Bank |
Oriental Commercial Bank |
1.8 |
51.0% |
1.3 |
1.4x |
Jun-16 |
|
I&M Holdings |
Giro Commercial Bank |
3.0 |
100.0% |
5.0 |
1.7x |
Jun-16 |
|
Mwalimu SACCO |
Equatorial Commercial Bank |
1.2 |
75.0% |
2.6 |
2.3x |
Mar-15 |
|
Centum |
K-Rep Bank |
2.1 |
66.0% |
2.5 |
1.8x |
Jul-14 |
|
GT Bank |
Fina Bank Group |
3.9 |
70.0% |
8.6 |
3.2x |
Nov-13 |
|
Average |
74.5% |
1.3x |
||||
|
* Announcement Date ** Deals that were dropped |
||||||
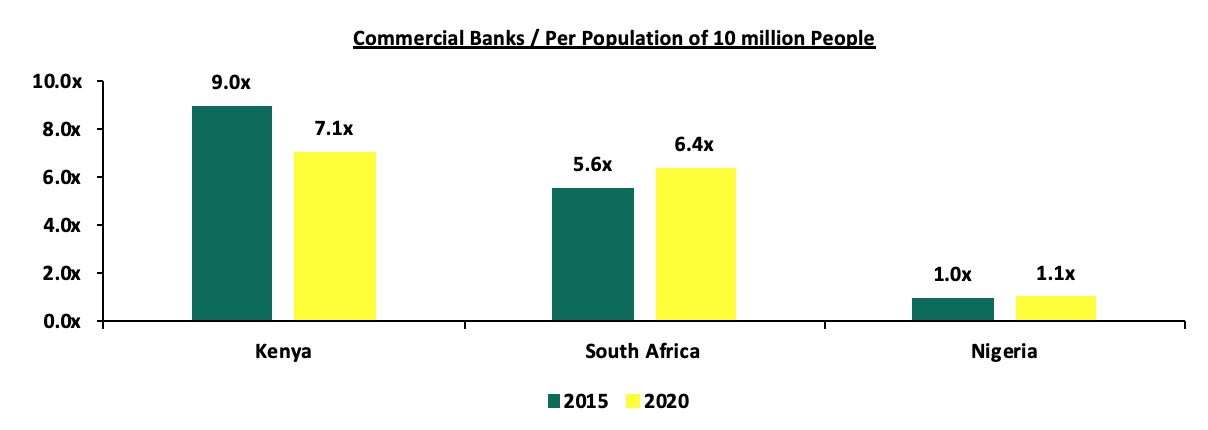
The number of commercial banks in Kenya has now reduced to 38, compared to 43 banks 5-years ago. The ratio of the number of banks per 10 million population in Kenya now stands at 7.1x, which is a reduction from 9.0x 5-years ago, demonstrating continued consolidation of the banking sector. However, despite the ratio improving, Kenya still remains overbanked as the number of banks remains relatively high compared to the population. For more on this see our topical
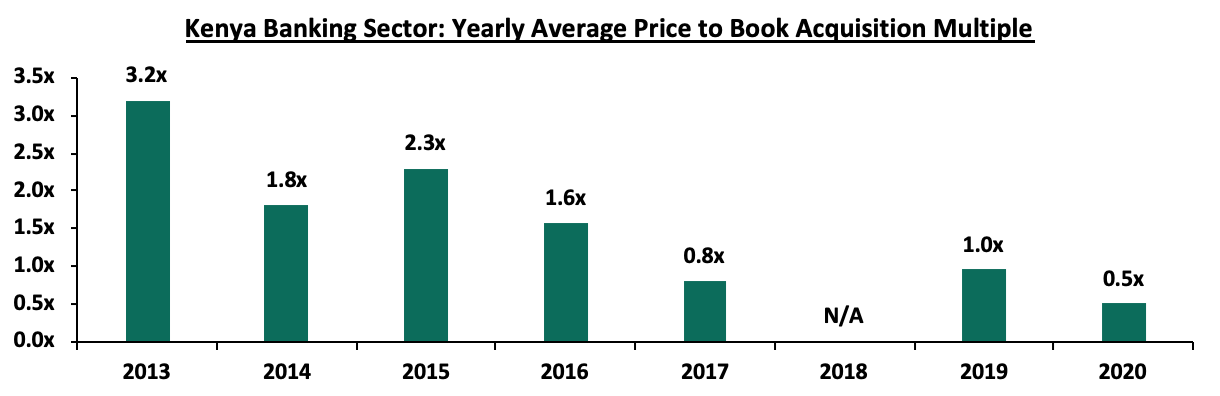
Additionally, the acquisition cost for banks has come down significantly, from an average acquisition cost of 3.2x price to book value in 2013, to 0.5x price to book value in 2020, as highlighted in the chart below;
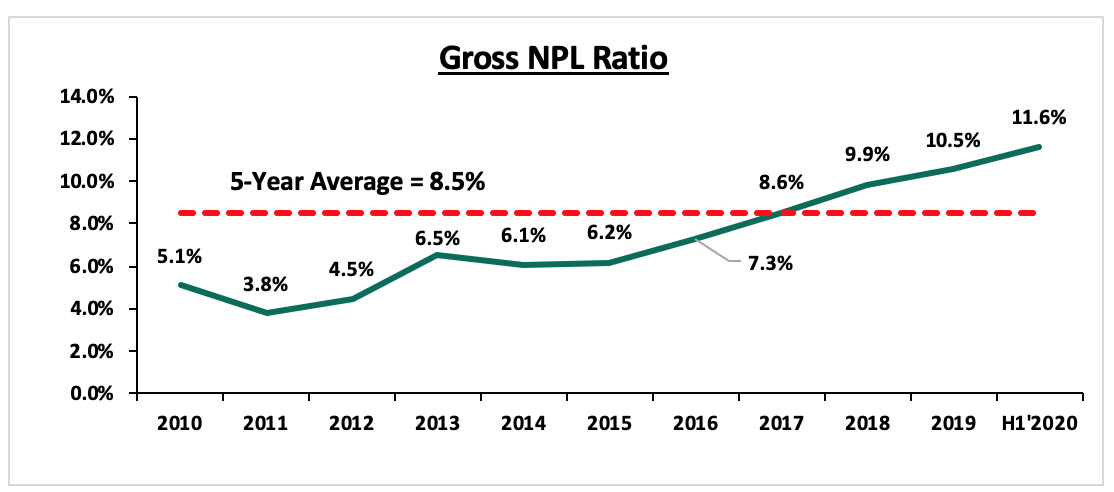
- Asset Quality - Asset quality for listed banks deteriorated in H1’2020 with the Gross NPL ratio rising by 1.6% points to 11.6% from 10.0% in H1’2019. This was high compared to the 5-year average of 8.5%. Consequently, this saw increased provisioning across the industry to proactively manage risks given the tough economic conditions. The NPL coverage has risen to 57.8% in H1’2020 from 55.9% recorded in H1’2019. In accordance with IFRS 9, banks are expected to provide both for the incurred and expected credit losses. We expect higher provisional requirements to subdue profitability during the year across the banking sector on account of the tough business environment.
The chart below highlights the asset quality trend:
- Capital Preservation: In a bid to preserve capital, the below-listed banks announced they were suspending cash dividends:
- Equity Group’s Board of Directors withdrew their recommendation to pay a first and final dividend of Kshs 2.5 per share for FY’2019. This decision was made after considering the effects of the COVID-19 pandemic and the need to conserve cash to enable the company to respond appropriately to the unfolding crisis in terms of supporting its customers through the crisis and directing cash resources to potential opportunities that may arise, and,
- NCBA Group announced it would withhold the final dividend payment of Kshs 1.5 per share, to shareholders totaling to Kshs 2.2 bn for FY’2019. NCBA’s board instead recommended the payment of a stock dividend (bonus Issue) and not a cash dividend. The bonus share issue will see shareholders receive one share for every ten held, creating 149.8 mn additional shares, given that the entity currently has 1.5 bn shares listed on the securities exchange. The additional shares were valued at Kshs 4.3 bn based on NCBA’s share price of Kshs 28.75 as at 24 April 2020. The stock dividend valued at Kshs 4.3 bn is more than what the lender would have paid in the cash dividend of Kshs 2.2 bn. For more information on this see Cytonn Weekly # 17/2020.
A similar trend has been mirrored globally by both financial and non-financial businesses frantically seeking ways to save money with several regulators encouraging companies to cease the discretionary payments of dividends to shareholders. For instance, in the United Kingdom (UK), the seven largest banks sought to cancel dividend pay-outs despite having solid capital bases, due to fears of an economic recession.
Additionally, the Central Bank of most countries has offered guidelines to the banks on dividend payments with, for instance, the Federal Reserve announcing on 25th June 2020 that it would cap dividend payments and prevent share repurchases up to the end of 2020. Closer home, on 6th April 2020, the South African Reserve Bank’s Prudential Authority advised banks not to pay out dividends this year and that the bonuses for senior executives should also be put on hold during this period as well. The authority highlighted that this directive would ensure banks conserve their capital and as such, enable the banks to fulfill their fundamental roles. Locally, the Central Bank of Kenya on 14th August 2020, directed that Banks will have to get approval before declaring dividends for the current financial year. The Central Bank has given guidance to lenders asking them to revise their ICAAP (Internal Capital Adequacy Assessment Process) based on the pandemic as highlighted in the Banking Circular No 11 of 2020. Subject to the submission of the revised Internal Capital Adequacy Assessment Process, (ICAAP), CBK will determine if it will endorse the board’s decision to pay out dividends.
Following the release of the H1’2020 results, as expected, most banks did not declare any interim dividends for H1’2020 in a bid to preserve their capital amid the subdued environment.
Section II: Summary of the Performance of the Listed Banking Sector in H1’2020:
The table below highlights the performance of the banking sector, showing the performance using several metrics, and the key take-outs of the performance.
|
Bank |
Core EPS Growth |
Interest Income Growth |
Interest Expense Growth |
Net Interest Income Growth |
Net Interest Margin |
Non-Funded Income Growth |
NFI to Total Operating Income |
Growth in Total Fees & Commissions |
Deposit Growth |
Growth in Government Securities |
Loan to Deposit Ratio |
Loan Growth |
Return on Average Equity |
|
ABSA |
(84.8%) |
0.9% |
(3.3%) |
2.5% |
7.3% |
4.2% |
32.8% |
4.1% |
8.3% |
17.4% |
81.2% |
8.2% |
15.9% |
|
KCB |
(40.4%) |
23.2% |
25.7% |
22.3% |
7.6% |
6.0% |
31.0% |
4.3% |
34.6% |
54.5% |
73.8% |
17.0% |
16.0% |
|
NCBA |
(38.3%) |
9.6% |
7.7% |
11.2% |
3.4% |
28.0% |
47.3% |
61.3% |
9.1% |
24.0% |
63.6% |
4.0% |
8.9% |
|
DTBK |
(36.5%) |
(3.3%) |
(9.0%) |
1.2% |
5.6% |
5.9% |
25.3% |
24.2% |
(0.1%) |
9.8% |
75.2% |
5.6% |
9.8% |
|
SCBK |
(31.3%) |
(6.3%) |
(12.1%) |
(4.6%) |
6.9% |
6.6% |
31.9% |
(5.2%) |
12.3% |
2.1% |
52.4% |
11.9% |
13.7% |
|
Stanbic |
(31.2%) |
(4.8%) |
(3.1%) |
(0.7%) |
4.5% |
(18.8%) |
44.0% |
(36.7%) |
20.6% |
(13.4%) |
81.9% |
32.8% |
10.9% |
|
I&M |
(29.5%) |
3.4% |
9.4% |
(1.4%) |
5.5% |
(7.1%) |
37.8% |
7.7% |
6.4% |
30.1% |
73.1% |
7.2% |
15.4% |
|
Equity |
(24.4%) |
18.5% |
23.6% |
16.9% |
8.1% |
(13.0%) |
36.9% |
(10.8%) |
18.6% |
24.2% |
72.0% |
22.0% |
17.5% |
|
Co-op |
(3.6%) |
6.8% |
(4.4%) |
11.6% |
8.4% |
(5.1%) |
34.3% |
(42.5%) |
18.9% |
28.8% |
70.8% |
5.7% |
18.6% |
|
HF Group |
N/A |
(12.7%) |
(18.20%) |
(3.9%) |
4.3% |
(68.8%) |
22.4% |
42.1% |
15.8% |
13.5% |
97.4% |
(5.8%) |
(3.0%) |
|
H1'20 Mkt Weighted Average* |
(33.6%) |
10.4% |
10.0% |
10.9% |
7.0% |
(1.1%) |
35.2% |
(3.4%) |
18.5% |
25.9% |
71.5% |
14.5% |
15.4% |
|
H1'19Mkt Weighted Average** |
9.0% |
3.7% |
5.3% |
3.8% |
7.7% |
16.5% |
37.2% |
12.7% |
8.6% |
12.1% |
73.8% |
9.8% |
19.3% |
|
*Market-cap-weighted as at 28/08/2020 |
|||||||||||||
|
**Market-cap-weighted as at 06/09/2019 |
|||||||||||||
Key takeaways from the table above include:
- For the first half of 2020, the core Earnings Per Share (EPS) declined by (33.6%) as compared to a 9.0% growth in H1’2019,
- The sector recorded a deposit growth of 18.5% up from the 8.6% growth recorded in H1’2019. Interest expense, on the other hand, grew faster by 10.0%, compared to 5.3% in H1’2019. Cost of funds, however, declined, coming in at a weighted average of 2.9% in H1’2020, from 3.0% in H1’2019, an indication that the sector was able to mobilize cheaper deposits,
- Average loan growth came in at 14.5%, which was faster than the 9.8% recorded in H1’2019, but slower than the 25.9% growth in government securities, an indication of the bank's preference of investing in Government securities compared to lending to individuals and businesses,
- Interest income rose by 10.4%, compared to a growth of 3.7% recorded in H1’2019. The faster growth in interest income may be attributable to the 16.1% growth in loans and increased allocation to government securities. Despite the rise in interest income, the Yield on Interest Earning Assets (YIEA) declined to 9.7% from the 10.4% recorded in H1’2019, an indication of the increased allocation to lower-yielding government securities by the sector. The decline in the YIEA can also be attributed to the reduced lending rates for customers by the sector, in line with the Central Bank Rate cuts. Consequently, the Net Interest Margin (NIM) now stands at 7.0%, compared to the 7.7% recorded in H1’2019 for the listed banking sector, and,
- Non-Funded Income declined by 1.1% y/y, slower than the 16.5% growth recorded in H1’2019. The performance in NFI was on the back of declined growth in fees and commission of 3.4%, which was slower than the 12.7% growth recorded in H1’2019. The low growth in fees and commission can be attributed to the recent waiver on fees on mobile transactions below Kshs 1,000 and the free bank-mobile money transfer. Banks with a large customer base who rely heavily on mobile money transactions are likely to take the biggest hit.
Section III: Outlook of the banking sector:
The banking sector showed subdued performance as evidenced by the decline in the core-earnings per share by 33.6%, as compared to a growth of 9.0% in H1’2020. This was occasioned by the increased provisioning on the expectations on the rise in the non-performing loans. Further, the waiver on mobile transactions below Kshs 1,000 and the free bank-mobile money transfer muted the growth in Non-Funded Income leading to a decline in the growth in fees and commission. However, despite the tough operating environment, the banking sector has historically shown resilient performance amid short-term and long term shocks such as the implementation of the interest rate caps.
Based on the current tough operating environment, we believe 2020 performance in the banking sector will be shaped by the following key factors
- Increased Liquidity due to lower Cash Reserve Ratio (CRR): The Monetary Policy Committee (MPC) during their 29th April 2020 meeting lowered the Cash Reserve Ratio (CRR), which is a fraction of total customer deposits that the commercial banks have to hold with the Central Bank, by 100 bps to 4.25% from 5.25%. The reduction is projected to have injected approximately Kshs. 35.2 bn in additional liquidity, to commercial banks for onward lending to distressed borrowers. The reduction was the first one since July 2009. The MPC during their July 2020 MPC Meeting highlighted that Kshs 34.1 bn, representing 89.1% of the 35.2 bn had been utilized by the banking sector to offer a reprieve to their customers as well as support lending in the sectors that have been hard hit by the pandemic such as Tourism, Manufacturing as well as Real Estate. We expect the low CRR ratio to improve the banking sector's liquidity and as such, banks with have more money to loan to businesses and individuals as well as invest in other businesses. Additionally, given that a low CRR translates to a low amount held in the CBK at no interest, we expect this to lead to a decline in the interest rates charged on loans by the sector,
- Depressed Interest Income: With the large amount of restructuring and reclassification of loans witnessed in H1’2020, we expect the bank’s core source of revenue which is interest income to be negatively affected in the short term. Given the relaxation of the loan interest payments and the borrower's preference to long term tenor extensions on their loan holiday to between 9-12 months, the bank's interest income is set to drop. Banks are also not lending aggressively due to higher credit risk. We foresee a slower growth in loans in the next quarter and thereafter if the pandemic is to persist further with banks turning to less risky investments such as government securities which rose by 25.9% faster than the 14.5% rise in loans in H1’2020,
- Lower Net Interest Margins (NIM): The accommodative stance taken by the Monetary Policy Committee (MPC), a 150 bps cut in the Central Bank Rate (CBR), YTD, has seen the deposit rates, saving rates and lending rates decline by 0.3% points, 0.2% points and 0.4% points, to 6.8%, 4.1% and 11.9% from 7.1%, 4.3%, and 12.3%, respectively, recorded in January 2020. The increased investments by banks to government securities as opposed to lending, coupled with the increased liquidity in the money market has also seen the yield curve readjust downwards. As such, we foresee the sector’s Yield on Interest Earning Assets (YIEA) continue to decline in tandem with the decline in the yields on government securities. Additionally, we foresee a continued decline in the sector’s NIMs in the coming quarter, most especially for banks reducing their lending rates for customers in line with the CBR cuts,
- Increased Provisioning- The risk of loan defaults remains elevated despite an improvement in the operating environment in line with the relaxation of Coronavirus measures. We foresee increased provisioning in the sector as compared to FY’2019, given the lagged recovery process from the pandemic. Additionally, we expect the higher provisioning requirements as per the IFRS guidelines to further subdue the profitability of the banking sector during the year,
- Cost Rationalization: Given the expectation of depressed revenues, banks are expected to continue pursuing their cost rationalization strategies. A majority of banks have been riding on the digital revolution wave to improve their operational efficiency. Increased adoption of alternative channels of transactions such as mobile, internet, and agency banking, has led to increased transactions carried out via alternative channels and out of bank branches, which have been reduced to handling high-value transactions and other services such as advisory. Thus banks reduced front-office operations, thereby cutting the number of staff required and by extension, reducing operating expenses and hence, improving operational efficiency,
- Continued Revenue Diversification - The increase in NFI growth outperformed that of interest income, thus, allowing the banks to remain profitable amid a rigid regulatory environment. However, with the new regulations put in place by the Central bank to cushion citizens against the effects of the COVID-19 pandemic, banks’ non-interest income is likely to be depressed. Some measures such as waiving all charges for balance inquiry through digital platforms will see banks record lower income from the fees they charge,
- Expansion and Further Consolidation - With the Microfinance-Bill 2019 of increasing the minimum on core capital requirements still at its pilot stage more mergers and acquisitions would enable the unprofitable and/or smaller banks to manage the requirement and be able to increase profitability through cost efficiency and deposits growth.
Section IV: Brief Summary and Ranking of the Listed Banks:
As per our analysis on the banking sector from a franchise value and a future growth opportunity perspective, we carried out a comprehensive ranking of the listed banks. For the franchise value ranking, we included the earnings and growth metrics as well as the operating metrics shown in the table below in order to carry out a comprehensive review of the banks:
|
Bank |
Loans to Deposits Ratio |
Cost to Income Ratio |
Return on Average Capital Employed |
Deposit/Branch (Kshs bns) |
Gross NPL Ratio |
NPL Coverage |
Tangible Common Ratio |
Non-Funded Income/Revenue |
|
Coop Bank |
75.6% |
60.1% |
18.6% |
2.4 |
11.8% |
54.6% |
15.1% |
34.3% |
|
KCB Group |
73.8% |
71.5% |
16.0% |
2.1 |
13.8% |
56.9% |
13.2% |
31.0% |
|
DTBK |
71.9% |
64.1% |
9.8% |
2.0 |
8.3% |
51.2% |
15.5% |
25.3% |
|
Equity Bank |
72.0% |
69.3% |
17.5% |
1.8 |
11.0% |
48.5% |
15.5% |
36.9% |
|
I&M Holdings |
73.1% |
54.4% |
16.3% |
3.8 |
11.1% |
63.1% |
15.9% |
37.8% |
|
NCBA Group |
63.6% |
79.8% |
8.9% |
4.8 |
13.1% |
53.2% |
12.5% |
47.3% |
|
Absa Bank |
81.2% |
80.6% |
15.9% |
3.0 |
8.0% |
63.6% |
10.9% |
32.8% |
|
SCBK |
52.4% |
63.0% |
13.7% |
7.1 |
13.9% |
78.2% |
15.0% |
31.9% |
|
Stanbic Bank |
81.9% |
45.7% |
10.9% |
11.0 |
8.5% |
64.8% |
13.0% |
44.0% |
|
HF Group |
97.4% |
123.0% |
(3.0%) |
1.9 |
26.7% |
54.3% |
16.4% |
22.4% |
|
Weighted Average H1'2020 |
72.0% |
67.3% |
15.5% |
3.5 |
11.6% |
57.8% |
14.2% |
35.2% |
The overall ranking was based on a weighted average ranking of Franchise value (accounting for 60%) and intrinsic value (accounting for 40%). The Intrinsic Valuation is computed through a combination of valuation techniques, with a weighting of 40.0% on Discounted Cash-flow Methods, 35.0% on Residual Income, and 25.0% on Relative Valuation, while the Franchise ranking is based on banks operating metrics, meant to assess efficiency, asset quality, diversification, and profitability, among other metrics. The overall H1’2020 ranking is as shown in the table below:
|
Bank |
Franchise Value Score |
Intrinsic Value Score |
Weighted Score |
H1'2020 Rank |
Q1'2020 Ranking |
|
I&M Holdings |
2 |
3 |
2.4 |
1 |
1 |
|
Co-operative Bank of Kenya Ltd |
1 |
6 |
3.0 |
2 |
2 |
|
KCB Group Plc |
6 |
2 |
4.4 |
3 |
3 |
|
Equity Group Holdings Ltd |
4 |
5 |
4.4 |
4 |
4 |
|
DTBK |
7 |
1 |
4.6 |
5 |
5 |
|
Stanbic Bank/Holdings |
3 |
9 |
5.4 |
6 |
6 |
|
ABSA |
5 |
8 |
6.2 |
7 |
7 |
|
NCBA Group Plc |
9 |
4 |
7.0 |
8 |
9 |
|
SCBK |
8 |
7 |
7.6 |
9 |
8 |
|
HF Group Plc |
10 |
10 |
10.0 |
10 |
10 |
Major Changes from the H1’2020 Ranking are:
- KCB Group recorded a decline in the franchise value ranking, coming in 6th mainly on the back of the deterioration of their asset quality as evidenced by the group's high Non- Performing Loans (NPL) ratio of 13.8% against a weighted average of 11.6%,
- NCBA Group whose rank improved to Position 8 from Position 9 in Q1’2020 mainly due to an improvement in NPL Ratio to 13.1% in H1’2020 from 14.5% in Q1’2020, in turn, improving its franchise value score, and,
- SCBK whose rank declined to Position 9 from Position 8 in Q1’2020 mainly due to a deterioration in the cost to income ratio to 63.0% in H1’2020 from 58.1% in Q1’2020 thus, in turn, worsening the franchise value score.
For more information, see our Cytonn H1’2020 Listed Banking Sector Review
Disclaimer: The views expressed in this publication are those of the writers where particulars are not warranted. This publication is meant for general information only and is not a warranty, representation, advice, or solicitation of any nature. Readers are advised in all circumstances to seek the advice of a registered investment advisor.

- Talk to us
- Kenya
- P.O Box 20695 - 00200, Nairobi, Kenya
- Cell +254709101200
- Tel +254709101200
- WhatsApp +254741676635
- United States
- +254709101200
- DOWNLOAD OUR APP
-


- Kenya
- 8th Floor, Pinetree Plaza, Kaburu Drive, Ngong Road, Nairobi, Kenya
- USA
- Suite 1150, 1775 Eye Street NW, USA, Washington DC 20006, USA
- Investments
- High Yield
- Private Equity
- Real Estate
- Real Estate
- RiverRun Estates
- Cytonn Towers
- The Ridge
- Taraji Heights
- The Alma