Cytonn Markets Review – Q1’2024
By Cytonn Research, Mar 31, 2024
Executive Summary
Global Markets Review
According to the January 2024 World Economic Outlook Report by the International Monetary Fund (IMF), the global economy is projected to grow at a rate of 3.1% in 2024, unchanged from the growth of 3.1% recorded in 2023. The latest projection is 1.2% points higher than the IMF’s earlier projection of 2.9% growth, with the upward revision being on account of greater-than-expected resilience in the United States and several large emerging market and developing economies, as well as fiscal support in China. Global headline inflation is expected to fall to an estimated 5.8% in 2024 from 6.8% recorded in 2023 as the Central Banks around the world continue to maintain tightened monetary policies;
Sub-Saharan Africa Region Review
According to the International Monetary Fund (IMF), the Sub-Saharan economy is projected to grow at a moderate rate of 3.8% in 2024, 0.5% points higher than the estimated economic growth of 3.3% in 2023. Notably, the projection is an upward revision from the initial IMF Regional outlook projection of 3.3%. The upward revision of regional growth by the IMF is mainly a result of the expected easing of inflationary pressures in line with the ongoing reduction of global inflation as the central banks around the world continue to tighten the monetary policies aimed at bringing down the inflation rate to the target ranges. However, the growth is expected to be significantly weighed down by sustained supply constraints worsened by the geopolitical tensions arising from the Middle East conflicts as well as the Russia-Ukraine invasion given that most countries in Sub-Saharan Africa are net importers, adverse weather conditions that have undermined agricultural productivity, and elevated risk of debt distress in the region;
Kenya Macro Economic Review
The Kenyan economy recorded an average growth of 5.5% in the period between January to September 2023, with Q3’2023 GDP coming in at 5.9%, adding to the 5.4% and 5.3% growth recorded in Q2’2023 and Q1’2023 respectively. The average GDP growth of 5.5% marked an improvement from the 5.2% average growth recorded in a similar period in 2022. Notably, the average inflation rate eased to 6.3% in Q1’2024, compared to 9.1% in Q1’2023, attributable to a decrease in the price of food and beverages following the favorable weather conditions that have boosted agricultural production, resulting in increased food supplies. As a result, Kenya’s general business environment improved in Q1’2024, with the average Purchasing Manager’s Index for the quarter coming at 50.6, compared to 49.3 recorded in a similar period in 2022;
Fixed Income
During the quarter, T-bills were oversubscribed, with the overall subscription rate coming in at 132.6%, up from 130.0% in Q4’2023. Investors’ preference for the 91-day paper persisted as they sought to avoid duration risk, with the paper receiving bids worth Kshs 276.9 bn against the offered Kshs 56.0 bn, translating to an oversubscription rate of 494.4%, lower than the oversubscription rate of 602.7% recorded in the previous quarter. Overall subscriptions for the 182-day and 364-day papers increased to 56.3% and 64.3% from 45.7% and 22.0% in Q4’2023, respectively. The yields on all the papers were on an upward trajectory with the average yields on the 364-day, 182-day, and 91-day papers increasing by 119.4 bps, 118.3 bps, and 114.0 bps to 16.7%, 16.6%, and 16.4%, from 15.5%, 15.4% and 15.3%, respectively, recorded in Q4’2023. The upward trajectory in yields is mainly on the back of investors attaching higher risks amid high inflation and tight liquidity positions, hence the need to demand higher returns to cushion against the possible loss. The acceptance rate during the period came in at 88.8%, albeit lower than the 91.9 recorded in Q4’2023, with the government accepting a total of Kshs 395.6 bn out of the Kshs 445.7 bn worth of bids received;
During the week, T-bills were undersubscribed, with the overall undersubscription rate coming in at 66.0%, a reversal from the oversubscription rate of 102.8% recorded the previous week, Investor’s preference for the shorter 91-day paper persisted as they sought to avoid duration risk, with the paper receiving bids worth Kshs 5.4 bn against the offered Kshs 4.0 bn, translating to an oversubscription rate of 134.5%, lower than the oversubscription rate of 291.2% recorded the previous week. The subscription rates for the 182-day paper and 364-day paper decreased to 27.0% and 77.5% respectively, from 40.9% and 89.4% respectively recorded the previous week. The government accepted a total of Kshs 13.5 bn worth of bids out of Kshs 15.8 bn of bids received, translating to an acceptance rate of 85.3%. The yields on the government papers recorded mixed performances, with the yield of the 364-day paper increasing marginally by 0.1 bps to remain relatively unchanged at 17.0%, while the 182-day and 91-day papers decreased marginally by 2.6 bps and 0.2 bps to 16.9%, and 16.7%, respectively;
During the week, the Kenya National Bureau of Statistics released data for the y/y inflation rates for the month of March. Inflation in the month eased by 0.6% points to 5.7%, from the 6.3% recorded in February 2024. This was according to our expectations and projection that it would come within a range of 5.7% to 6.1%;
During the week, Zambia’s Ministry of Finance and National Planning announced that the country had reached an agreement on debt restructuring terms with the steering committee on debt restructuring. Zambia had defaulted on its USD 3.5 bn Eurobond back in November 2020 and has been working on getting their debt restructured under the G20’s Common Framework;
Equities
During Q1’2024, the equities market was on an upward trajectory, with NSE 10 gaining the most by 27.3%, while NSE 25, NASI, and NSE 20 gained by 25.0%, 22.8%, and 16.7% respectively. The equities market performance was driven by gains recorded by large cap stocks such as Equity Group, KCB, and Cooperative Bank which gained by 40.1%, 37.2%, and 31.6%, respectively. The gains were however weighed down by losses recorded by other large cap stocks such as EABL and Cooperative Bank, which declined by 5.5% and 3.3%, respectively;
During the week, the equities market was on an upward trajectory, with NSE 10 gaining the most by 5.1%, while NASI, NSE 25, and NSE 20 gained by 5.0%, 4.7%, and 3.9% respectively, taking the YTD performance to gains of 26.8%, 24.6%, 23.0% and 16.1% for NSE 10, NSE 25, NASI and NSE 20 respectively. The equities market performance was driven by gains recorded by large-cap stocks such as KCB Group, DTB-K, and Safaricom, of 17.6%, 7.8%, and 6.0% respectively;
During the week, five of the listed banks released their FY’2023 results. I&M Group released its FY’2023 financial results, with its Core Earnings per Share (EPS) increasing by 15.2% to Kshs 8.1, from Kshs 7.0 in FY’2022. NCBA Group Kenya released its FY’2023 financial results, with its Core Earnings per Share (EPS) increasing by 55.7% to Kshs 13.0, from Kshs 8.4 in FY’2022. Diamond Trust Bank Kenya released its FY’2023 financial results, with its Core Earnings per Share (EPS) increasing by 14.7% to Kshs 27.9, from Kshs 24.3 in FY’2022. Equity Group Holdings released its FY’2023 financial results, with its Core Earnings per Share (EPS) decreasing by 5.1% to Kshs 11.6, from Kshs 12.2 in FY’2022, and HF Group released its FY’2023 financial results, with its Core Earnings per Share (EPS) increasing by 46.2% to Kshs 1.0, from Kshs 0.7 in FY’2022;
Also, during the week, Britam Holdings released their FY’2023 results. This was the second time the company was releasing their results under the new IFRS 17 reporting system. Britam’s Profit After Tax (PAT) increased by 97.5% to Kshs 3.3 bn, from Kshs 1.7 bn recorded in FY’2022;
Real Estate
In Q1’2024, Kenya’s Real Estate sector recorded notable growth in terms of activity compared to a similar period in 2023, attributable to continued investments flowing into the sector. In the Nairobi Metropolitan Area (NMA), the residential sector recorded a slight downturn in performance, with the average total returns coming in at 6.0%, a 0.1%-point decline from 6.1% recorded in Q1’2023. The commercial office sector recorded average rental yields of 7.6% in Q1’2024 remaining relatively unchanged from Q1’2023. The retail sector recorded average rental yields of 8.1% in Q1’2024, representing a 0.1% points y/y increase from 8.0% recorded in Q1’2023. The land sector recorded an average annualized capital appreciation of 4.3% in Q1’2024, with un-serviced land prices in satellite towns realizing the highest capital appreciation at 8.2% y/y;
Investment Updates:
- Weekly Rates:
- Cytonn Money Market Fund closed the week at a yield of 17.06% p.a To invest, dial *809# or download the Cytonn App from Google Playstore here or from the Appstore here;
- We continue to offer Wealth Management Training every Monday, from 9:00 am to 11:00 am. The training aims to grow financial literacy among the general public. To register for any of our Wealth Management Trainings, click here;
- If interested in our Private Wealth Management Training for your employees or investment group, please get in touch with us through wmt@cytonn.com;
- Cytonn Insurance Agency acts as an intermediary for those looking to secure their assets and loved ones’ future through insurance namely; Motor, Medical, Life, Property, WIBA, Credit and Fire and Burglary insurance covers. For assistance, get in touch with us through insuranceagency@cytonn.com;
- Cytonn Asset Managers Limited (CAML) continues to offer pension products to meet the needs of both individual clients who want to save for their retirement during their working years and Institutional clients that want to contribute on behalf of their employees to help them build their retirement pot. To more about our pension schemes, kindly get in touch with us through pensions@cytonn.com;
Real Estate Updates:
- For more information on Cytonn’s real estate developments, email us at sales@cytonn.com;
- Phase 3 of The Alma is now ready for occupation and the show house is open daily. To join the waiting list to rent, please email properties@cytonn.com;
- For Third Party Real Estate Consultancy Services, email us at rdo@cytonn.com;
- For recent news about the group, see our news section here;
Hospitality Updates:
We currently have promotions for Staycations. Visit cysuites.com/offers for details or email us at sales@cysuites.com;
Global Economic Growth:
According to the January 2024 World Economic Outlook Report by the International Monetary Fund (IMF), the global economy is projected to grow at a rate of 3.1% in 2024, unchanged from the growth of 3.1% recorded in 2023. The latest projection is 1.2% points higher than the IMF’s earlier projection of 2.9% growth, with the upward revision being on account of greater-than-expected resilience in the United States and several large emerging market and developing economies, as well as fiscal support in China. Global headline inflation is expected to fall to an estimated 5.8% in 2024 from 6.8% recorded in 2023 as the Central Banks around the world continue to maintain tightened monetary policies. Notably, advanced economies are expected to record a 1.5% growth in 2024, which is a slight decline from the 1.6% expansion recorded in 2023. However, the emerging markets and developing economies are projected to expand by 4.1% in 2024, marginally upwards from an estimated growth of 4.0% in 2023;
The expected sustained global economic growth in 2024 is majorly attributable to;
- Easing global inflation - Global headline inflation is expected to fall to an estimated 5.8% in 2024 from 6.8% recorded in 2023 as the Central Banks around the world continue to maintain tightened monetary policies. At the same time, the high-interest rates aimed at fighting inflation and a withdrawal of fiscal support in most economies are expected to weigh on growth in 2024, and,
- Slower-than-expected withdrawal of fiscal support - Governments in major economies might withdraw fiscal policy support more slowly than expected for 2024/25 by the IMF, implying higher-than-projected global growth in the near term. However, such delays could in some cases exacerbate inflation and, with elevated public debt, result in higher borrowing costs and a more disruptive policy adjustment, with a negative impact on global growth later on.
However, the global growth is expected to be weighed down by;
- Persistent supply chain constraints worsened by the ongoing Gaza and Israel conflict which could escalate further into the wider region which produces about 35.0% of the world’s oil exports and 14.0% of its gas exports. Consequently, the ongoing war in Ukraine risks generating fresh adverse supply shocks to the global recovery, with spikes in food, energy, and transportation costs,
- Tight global financial conditions occasioned by the high cost of borrowing which have increased risks of debt distress in emerging economies as most advanced economies continue to tighten their monetary policies, and,
- A slower-than-expected decline in core inflation in major economies due to persistent labour market tightness and renewed tensions in supply chains which could trigger a rise in interest rate expectation. Such developments could increase financial stability risks, tighten global financial conditions, trigger flight-to-safety capital flows, and strengthen the US dollar against other currencies.
The global economy is expected to remain subdued in the short term and gradually recover in the medium term mainly as a result of easing inflationary pressures as the impact of tightened monetary policies continues to transmit in most economies.
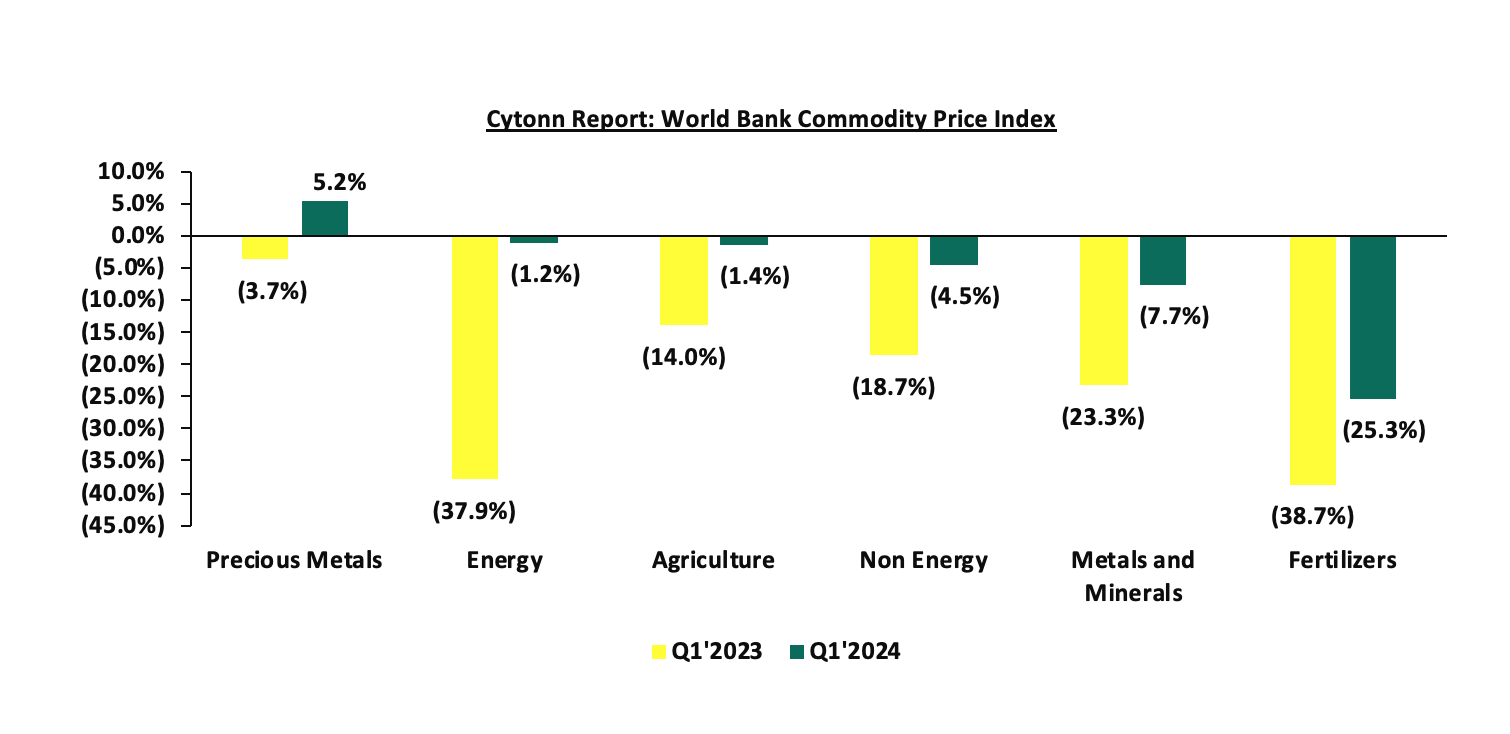
Global Commodities Market Performance
Global commodity prices recorded a mixed performance in Q1’2024, with prices of fertilizers declining the most, by 25.3% compared to the 38.7% decrease recorded in Q1’2023, mainly as a result of weaker global demand. Similarly, prices of metals and minerals, non-energy, agriculture, and energy declined by 7.7%, 4.5%, 1.4%, and 1.2%, respectively, on the back of reduced global demand coupled with easing supply chain constraints. Notably, Oil prices have been under downward pressure declining by 1.2% in Q1’2024, amid a weak global economic activity coupled with slowed global demand on the back of the easing supply chain constraints which had been worsened by the Russia-Ukraine conflict. Oil prices are expected to decline further in 2024 but remain above the pre-pandemic levels on the back of supply disruption concerns in the aftermath of the Middle East conflict and Slower-than-expected growth.
Global Equities Market Performance:
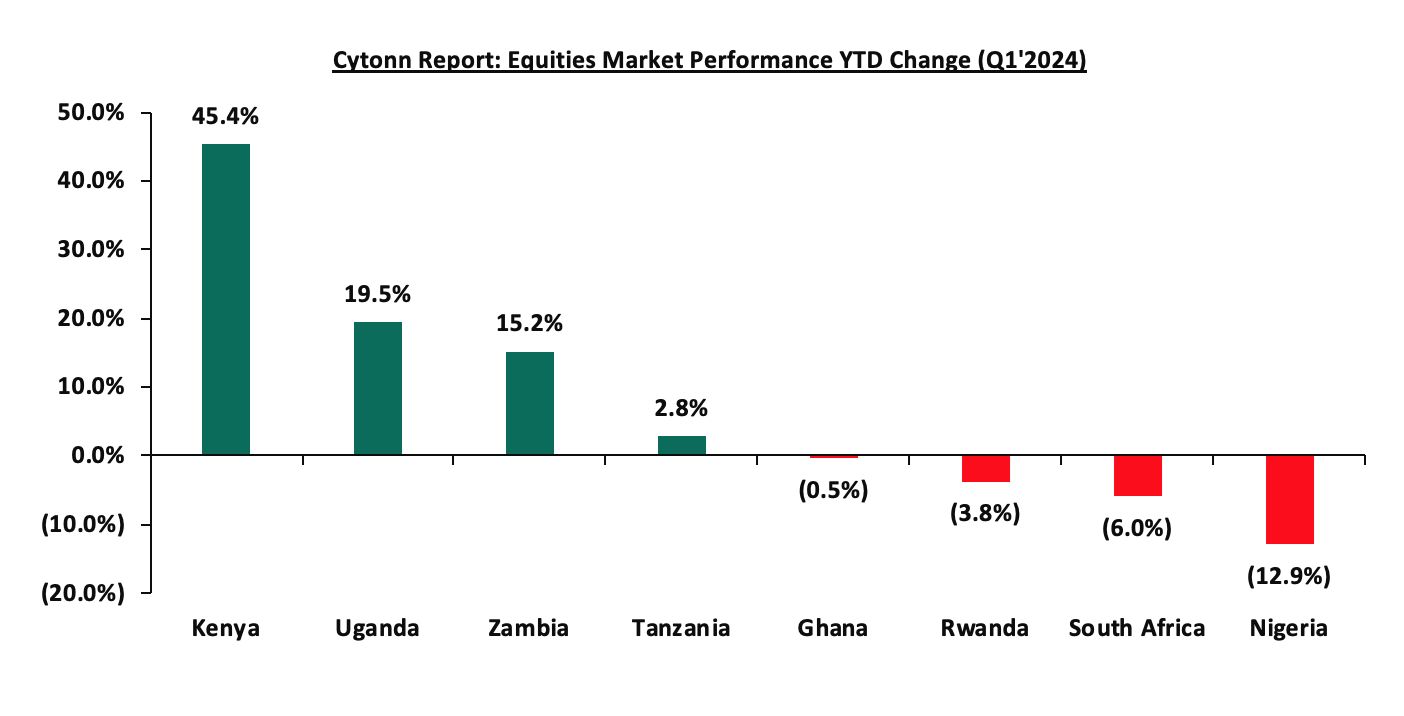
The global stock market recorded mixed performance in Q1’2024, with most indices gaining attributable to the eased capital flights which had persisted in 2023 following interest rate hikes in advanced economies aimed at curbing the inflationary pressures. Notably, in dollarized form, NASI was the largest gainer, gaining by 45.4% in Q1’2024 largely driven by gains in the large-cap stocks in the financial sector following improved earnings during the period as well as the improved business conditions in the country as evidenced by the Purchasing Managers Index (PMI) which came in at 51.3 in February 2024. Additionally, the Kenyan economy has been supported by the eased inflationary pressures and the strengthening of the Kenyan shilling having gained by 18.0% against the dollar on a YTD basis. Consequently, most indices in the developed countries recorded gains during the quarter largely attributable to increased investor sentiments as a result of continued economic recovery following the eased inflationary pressures coupled with investor preference for the stock markets in the developed countries. Notably, Nikkei 225 recorded the largest gain in developed economies at 11.8% in Q1’2024 driven by gains recorded by blue-chip financial companies as well as companies in the technological sector. On the contrary, most of the stocks in the developing economies were on a downward trajectory with the Nigerian stock exchange declining the most by 12.9% as investors have continued to attach a higher risk premium to the country mainly attributable to the high inflation at 31.7% as of February 2024 and continued weakening of the Nigerian currency which has depreciated by 19.0% on year-to-date basis in 2024. Below is a summary of the performance of key indices
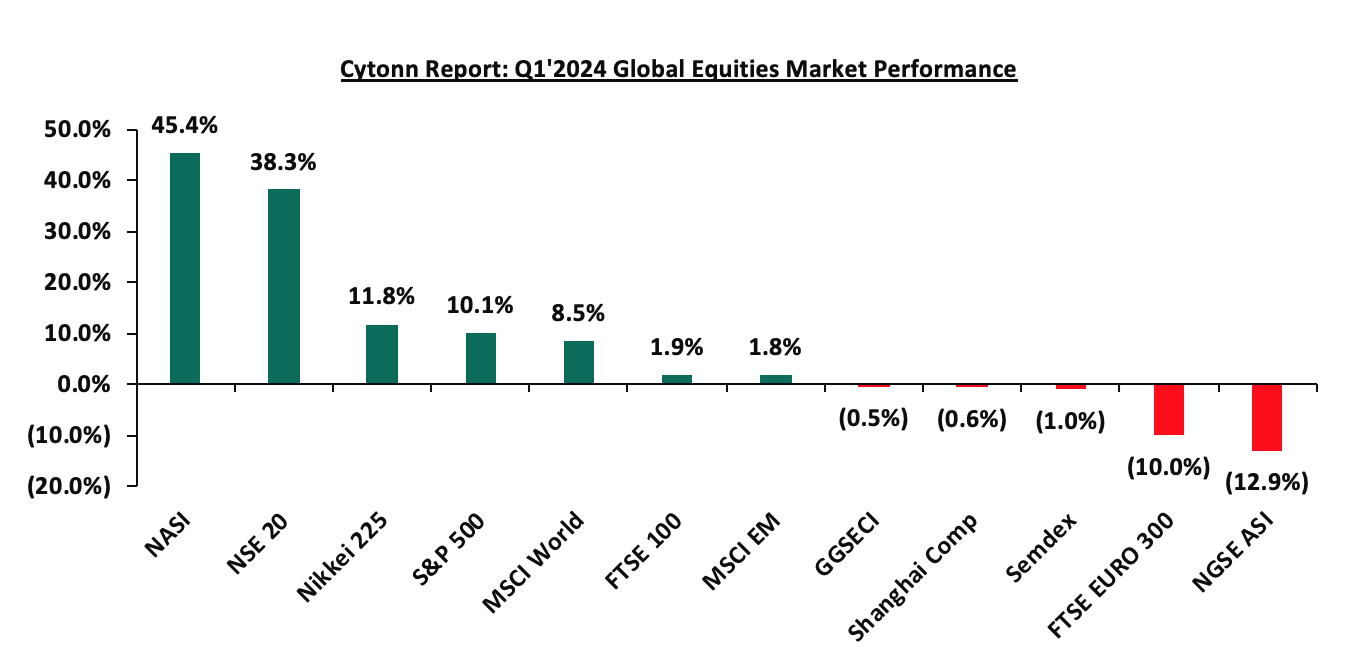
The index values are dollarized for ease of comparison
According to the International Monetary Fund (IMF), the Sub-Saharan region’s economy is projected to grow at a moderate rate of 3.8% in 2024, 0.5% points higher than the estimated economic growth of 3.3% in 2023. Notably, the projection is an upward revision from the initial IMF Regional outlook projection of 3.3%. The upward revision of regional growth by the IMF is mainly a result of the expected easing of inflationary pressures in line with the ongoing reduction of global inflation as the central banks around the world continue to tighten the monetary policies aimed at bringing down the inflation rate to the target ranges. However, the growth is expected to be significantly weighed down by sustained supply constraints worsened by the geopolitical tensions arising from the Middle East conflicts as well as the Russia-Ukraine invasion given that most countries in Sub-Saharan Africa are net importers, adverse weather conditions that have undermined agricultural productivity, and elevated risk of debt distress in the region.
Currency Performance
In Q1’2024, most of the select Sub-Saharan currencies depreciated against the US Dollar, similar to the trend witnessed in FY’2023. The depreciation trend is attributable to the elevated inflationary pressures in the region, high debt servicing costs that continue to dwindle foreign exchange reserves, and the tightened monetary policies by advanced economies such as the United States Federal Reserve and the European Central Bank. The high interest rates in developed countries have led to massive capital outflows as investors both institutional and individual seek to take advantage of the higher returns offered in developed economies. Further, the elevated inflationary pressures in most economies in the region put pressure on the value of local currencies due to expensive importation. Below is a table showing the performance of select African currencies against the US Dollar:
|
Cytonn Report: Select Sub Saharan Africa Currency Performance vs USD |
|||||
|
Currency |
Mar-23 |
Jan-24 |
Mar-24 |
Last 12 Months change (%) |
YTD change (%) |
|
Kenyan Shilling |
132.4 |
157.0 |
131.8 |
0.5% |
16.0% |
|
Zambian Kwacha |
21.2 |
27.1 |
24.8 |
(17.2%) |
8.4% |
|
Tanzanian Shilling |
2335.0 |
2540.0 |
2557.5 |
(9.5%) |
(0.7%) |
|
South African Rand |
17.8 |
18.7 |
18.9 |
(6.5%) |
(1.4%) |
|
Botswana Pula |
13.0 |
13.5 |
13.7 |
(5.6%) |
(1.5%) |
|
Ugandan Shilling |
3770.0 |
3815.0 |
3885.9 |
(3.1%) |
(1.9%) |
|
Mauritius Rupee |
45.4 |
44.8 |
46.3 |
(2.1%) |
(3.3%) |
|
Malawian kwacha |
1022.5 |
1683.4 |
1742.0 |
(70.4%) |
(3.5%) |
|
Ghanaian Cedi |
12.3 |
11.6 |
13.2 |
(7.3%) |
(14.3%) |
|
Nigerian Naira |
459.8 |
1191.9 |
1418.6 |
(208.5%) |
(19.0%) |
Source: Yahoo Finance
Key take outs from the table include:
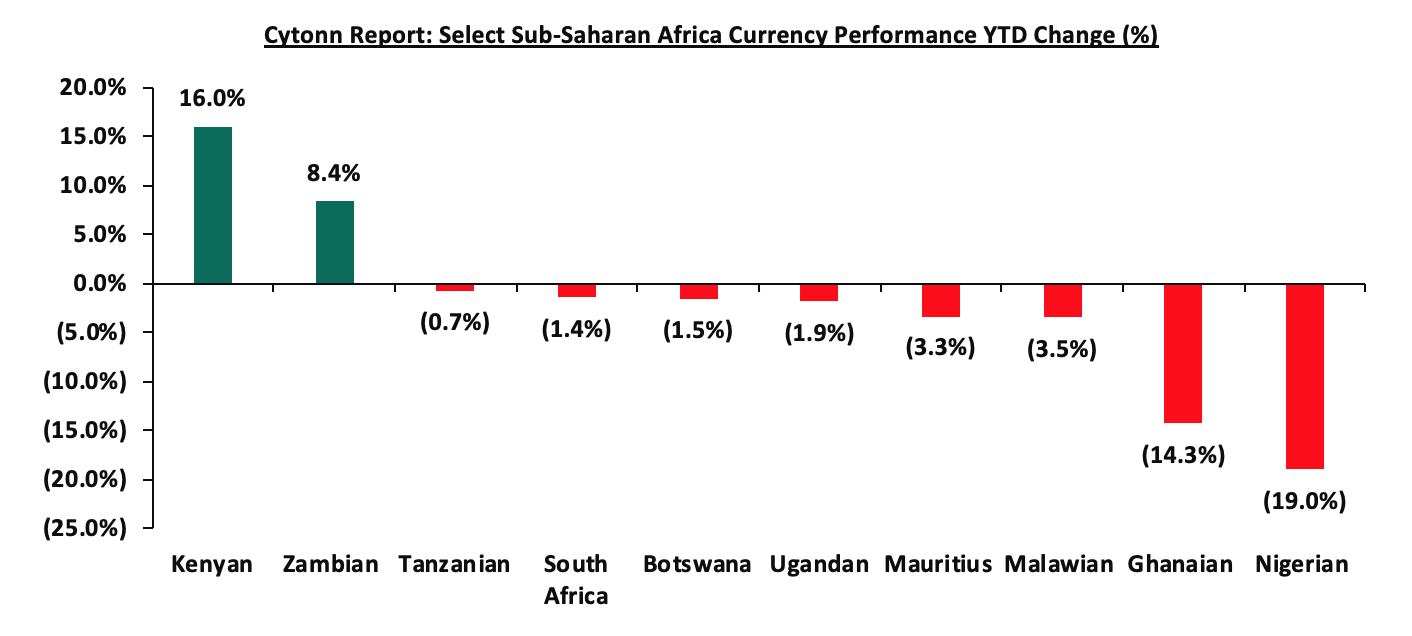
- The Kenyan shilling was the largest gainer against the dollar on year-to-date basis gaining by 16.0% to close at Kshs 131.8 as at the end of March from the Kshs 157.0 recorded at the beginning of the year. The shilling was supported by the increased dollar inflows into the country following the IMF funding as well as increased activity in the international bond markets which boosted the country’s foreign reserves. Notably, the Kenyan economy has continued to improve during the period under review with the Purchasing Managers Index (PMI) having crossed the 50.0 points threshold to 51.3 as of February 2024, and,
- Nigeria Naira was the worst-performing currency in Q1’2024 and the largest decliner over the last twelve months, depreciating by 19.0% and 208.5%, respectively, mainly as a result of the recent decision by the Central Bank of Nigeria to adopt a floating exchange rate regime, where the currency value of the Naira is allowed to vary according to the foreign exchange market coupled with the impacts of the heightened inflationary pressures in the country with current inflation rate coming at a high of 31.7% as of February 2024.
The chart below shows the year-to-date performance of different Sub-Saharan African countries in Q1’2024
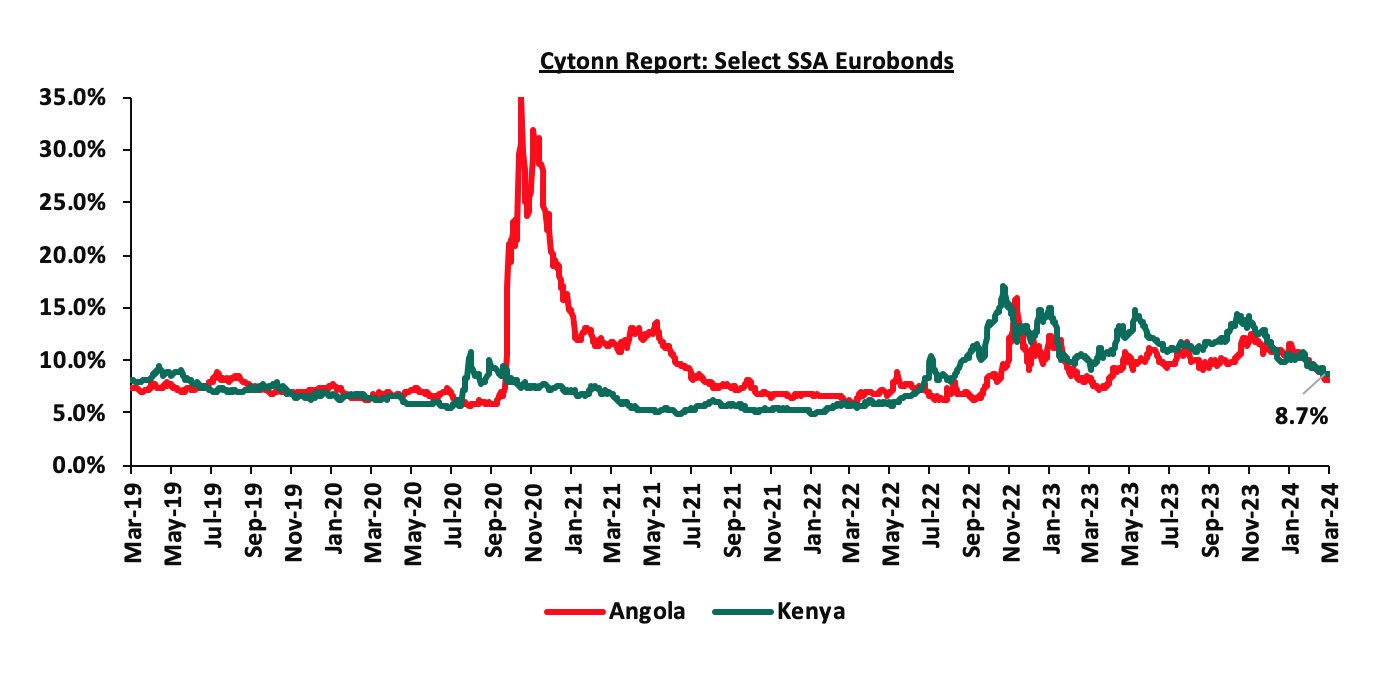
African Eurobonds
Africa’s appetite for foreign-denominated debt has increased in recent times with the latest issuers during the first quarter of 2024 being Ivory Coast, Benin, and Kenya raising a total of USD 2.6 bn, USD 0.8 bn, and USD 1.4 bn respectively. Notably, all the bonds were oversubscribed with the high support being driven by the yield-hungry investors and also the outlook of positive recovery in the regional economies. It is good to note that there was a general decline in the yields of the various bonds from different countries due to general improvement in investor sentiment as the economy recovers and the easing inflationary pressures in the region. The yields of Angola’s 10-year Eurobond maturing in 2025 declined by 2.1% points to 8.2% from 10.3% recorded in December 2023. Similarly, the Yields of Kenya’s 10-year Eurobond maturing in 2028 declined by 1.8% points to 8.7% from 10.5% in December 2023, partly attributable to improved investor confidence following the successful buy-back of the 2024 Eurobond maturity, increased IMF Credit funding and the strengthening of the Kenyan shilling against the dollar having gained by 16.0% in Q1’2024. Below is a 5-year graph showing the Eurobond secondary market performance of select 10-year Eurobonds issued by the respective countries;
Equities Market Performance
Sub-Saharan Africa (SSA) stock markets recorded mixed performance in Q1’2024, with Kenya’s stock market (NASI) being the best-performing market gaining by 45.4% YTD driven by gains in the large-cap stocks in the financial sector following improved earnings during the period as well as the improved business conditions in the country as evidenced by the Purchasing Managers Index (PMI) which came in at 51.3 in February 2024. On the other hand, the Nigerian stock market was the worst performing in the period under review mainly attributable to increased capital flight with investors chasing higher returns from advanced economies following the hiking of interest rates as well as deterioration in investor confidence in the country on the back of macroeconomic uncertainties occasioned by the high inflation at 31.7% as of February 2024 and continued weakening of the Nigerian Naira which has depreciated by 19.0% on year to date basis in 2024. Below is a summary of the performance of key indices:
|
Cytonn Report: Equities Market Performance Q1’2024 (Dollarized*) |
||||||
|
Country |
Index |
Mar-23 |
Jan-24 |
Mar-24 |
Last 12 Months change (%) |
YTD change (%) |
|
Kenya |
NASI |
0.9 |
0.6 |
0.9 |
0.7% |
45.4% |
|
Uganda |
USEASI |
0.3 |
0.2 |
0.3 |
(9.3%) |
19.5% |
|
Zambia |
LASILZ |
386.9 |
455.5 |
524.8 |
35.7% |
15.2% |
|
Tanzania |
DARSDEI |
0.7 |
0.7 |
0.7 |
(5.0%) |
2.8% |
|
Ghana |
GSECI |
235.7 |
263.0 |
261.8 |
11.1% |
(0.5%) |
|
Rwanda |
RSEASI |
0.1 |
0.1 |
0.1 |
(13.7%) |
(3.8%) |
|
South Africa |
JALSH |
4,289.8 |
4,137.9 |
3,891.5 |
(9.3%) |
(6.0%) |
|
Nigeria |
NGEASI |
118.2 |
84.9 |
73.9 |
(37.5%) |
(12.9%) |
|
*The index values are dollarized for ease of comparison |
||||||
Source: Cytonn Research, Kwayisi, Yahoo Finance
The chart below shows the YTD Performance of the sub-Saharan Equities Market;
GDP growth in the Sub-Saharan African region is expected to record moderate growth, in line with the rest of the global economy. Additionally, public debt continues to be a major headwind, with high debt levels experienced in the region on the back of the continued weakening of local currencies, which will make debt servicing costlier, making the region less attractive to foreign capital
Economic Growth
The Kenyan economy recorded an average growth of 5.5% in the period between January to September 2023, with Q3’2023 GDP coming in at 5.9%, adding to the 5.4% and 5.3% growth recorded in Q2’2023 and Q1’2023 respectively. The average GDP growth of 5.5% marked an improvement from the 5.2% average growth recorded in a similar period in 2022. The performance in Q3’2023 was mainly driven by the 6.7% growth in the agricultural sector due to the favourable weather conditions, which led to more agricultural output as evidenced by the 28.0% increase in tea output to 138.8 thousand metric tonnes coupled with the 84.3% growth in fruit exports to 59.6 thousand metric tonnes in the quarter under review. All sectors in Q3’2023 recorded positive growths, with varying magnitudes across activities. Most sectors recorded improved growth compared to Q3’2022 with Accommodation and Food Services, Agriculture, Forestry and Fishing, and Mining and Quarrying Sectors recording the highest growth improvements of 9.1% points, 8.0% points, and 5.6% points, respectively. Other sectors that recorded expansion in growth rate, from what was recorded in Q3’2022 were Financial and Insurance Services, Information and Communication, and Real Estate sectors, of 5.1%, 2.7%, and 2.2% points respectively.
In 2024, the Kenyan economy is projected to grow at an average of 5.3%, supported by resilient services and agricultural sectors. The table below shows the projections of Kenya’s 2024 GDP by various organizations:
|
Cytonn Report: Kenya 2024 growth Projections |
||
|
No. |
Organization |
2023 GDP Projections |
|
1 |
International Monetary Fund |
5.3% |
|
2 |
National Treasury |
5.5% |
|
3 |
World Bank |
5.2% |
|
4 |
Fitch Solutions |
5.2% |
|
5 |
Cytonn Investments Management PLC |
5.4% |
|
Average |
5.3% |
|
Source: Cytonn Research
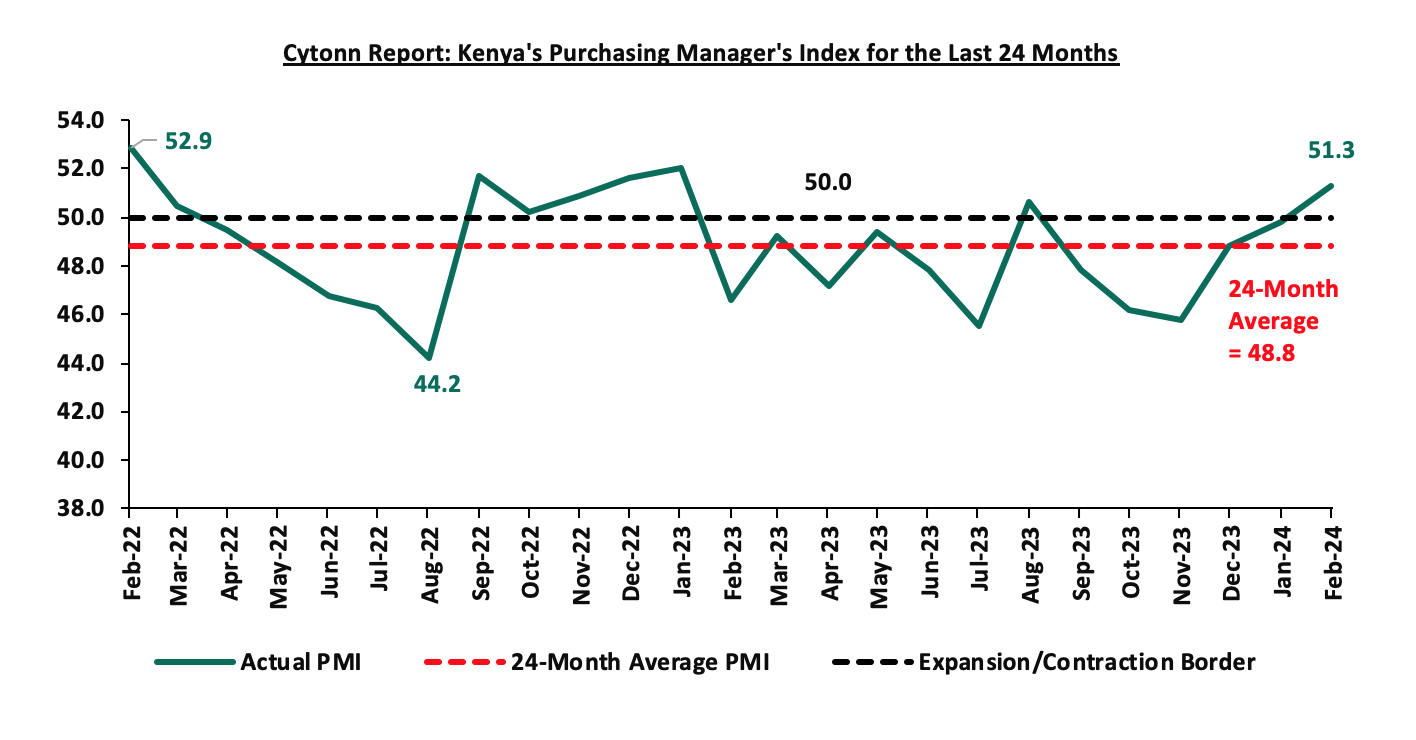
Key to note, Kenya’s general business environment improved in Q1’2024, with the average Purchasing Manager’s Index for the quarter coming at 50.6, compared to 49.3 recorded in a similar period in 2023. The improvement was mainly on the back of eased inflationary pressures experienced in the country, with the inflation rate averaging 6.6% in Q1’2024, significantly lower than the 9.1% recorded over a similar period in 2023. After five months of PMI remaining the contractionary zone, the private sector showed signs of recovery in February, with the PMI coming in at 51.3, up from 49.8 recorded in January evidenced by the increase in output and new orders as well as businesses hiring more workers and purchasing more goods. However, the economy continues to be under inflationary pressures with the fuel prices still remaining high relative to global fuel prices, despite the ongoing appreciation of the Kenyan shilling, having gained by 15.8% against the US Dollar, to close the quarter at Kshs 131.8 from Kshs 156.5 recorded at the end of 2023. The chart below summarizes the evolution of PMI over the last 24 months. (A reading above 50.0 signal an improvement in business conditions, while readings below 50.0 indicate a deterioration):
Inflation:
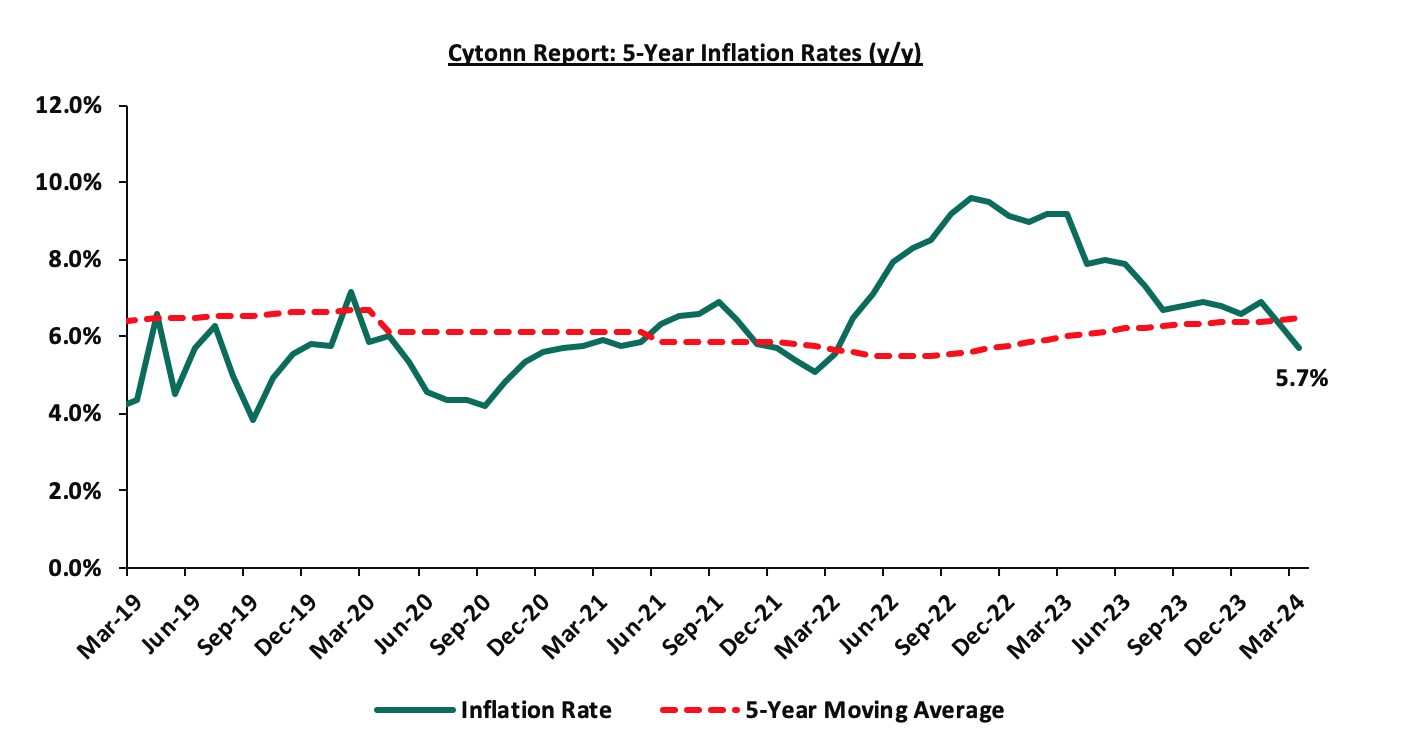
The average inflation rate eased to 6.3% in Q1’2024, compared to 9.1% in Q1’2024, attributable to a decrease in the price food and beverages, reduced fuel prices and the strengthening of the Kenya Shilling in the period under review. Notably, fuel prices decreased by 4.0%, 3.1% and 2.8% in March 2024 to Kshs 199.2, Kshs 190.4, and Kshs 188.7, from Kshs 207.4, Kshs 196.5, and Kshs 194.2 per liter at the beginning of the year for Super petrol, Diesel, and Kerosene, respectively. Below is a chart showing inflation trend for the last five years:
March 2024 Inflation
The y/y inflation in March 2024 eased by 0.6% points to 5.7%, from the 6.3% recorded in February 2024. This was according to our expectations and projection that it would come within a range of 5.7% to 6.1%. The headline inflation in March 2024 was majorly driven by increase in prices of commodities in the following categories, transport; housing, water, electricity, gas and other fuels; and food and non-alcoholic beverages by 9.7%, 8.0% and 5.8%, respectively. The table below shows a summary of both the year on year and month on month commodity indices performance:
|
Cytonn Report: Major Inflation Changes – 2024 |
|||
|
Broad Commodity Group |
Price change m/m (March-2024/February-2024) |
Price change y/y (March-2024/March-2023) |
Reason |
|
Food and Non-Alcoholic Beverages |
0.4% |
5.8% |
The m/m increase was mainly driven by the increase in prices of commodities such onions, mangoes and potatoes by 11.1%, 8.0%, and 7.7%, respectively. However, the increase was weighed down by decrease in prices of maize flour loose, sifted, sugar and fortified maize flour by 9.6%, 5.8%, 5.3 and 5.1%, respectively. |
|
Housing, Water, Electricity, Gas and Other Fuel |
0.2% |
8.0% |
The m/m performance was mainly driven by the increase in prices of gas/LPG by 1.4%. It was, however, supported by decrease in the 2.3% decrease price of kerosene per litre, coupled with the 0.3% and 0.4% reduction in the prices of 200kWh and 50 kWh of electricity |
|
Transport cost |
(0.6%) |
9.7% |
The m/m decrease in transport Index was recorded majorly due to the drop in prices of petrol and diesel by 3.5% and 2.6% respectively. |
|
Overall Inflation |
0.2% |
5.7% |
The m/m increase was mainly supported by the 0.4% increase in Food and Non-Alcoholic Beverages. |
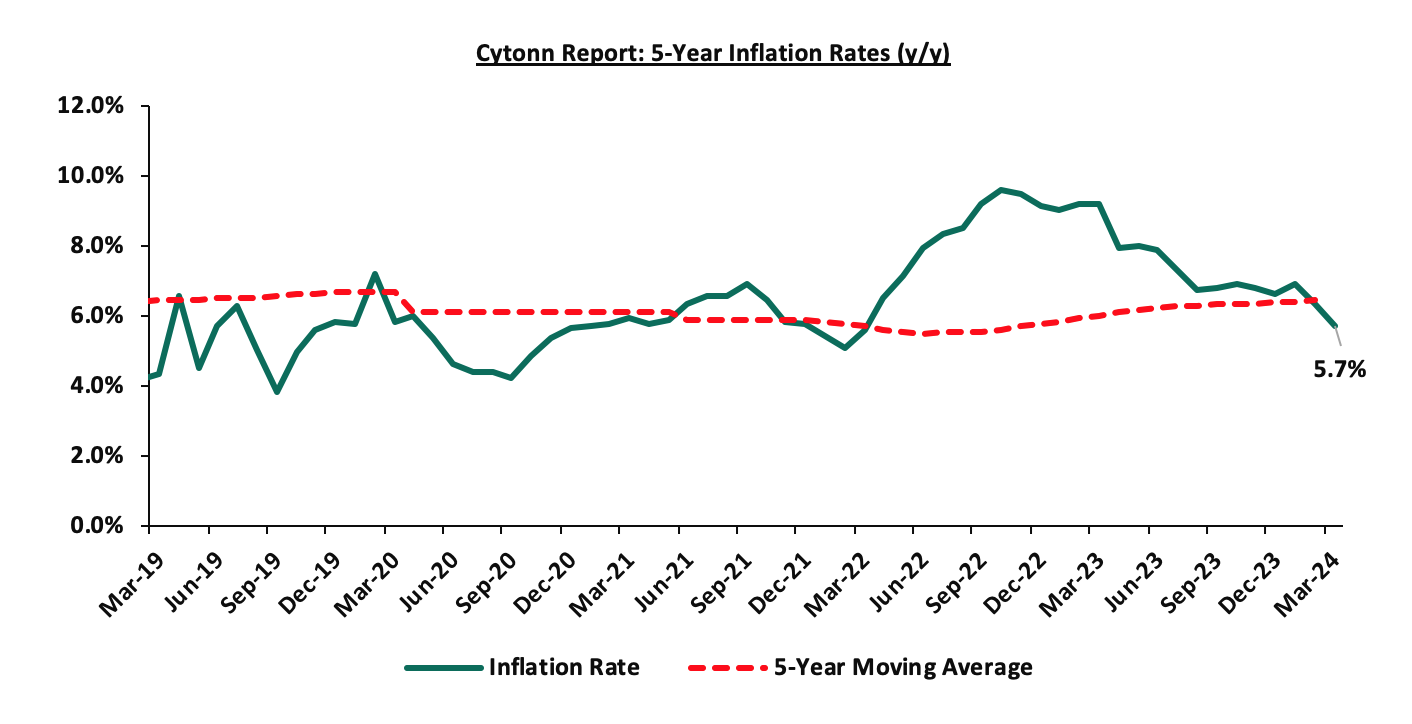
Notably, March’s overall headline inflation was on the decline for the second consecutive month and has remained within the Central Bank of Kenya (CBK) target range of 2.5% to 7.5% for the ninth consecutive month. The decrease in headline inflation in March 2024 comes following the decline in the Petrol, Diesel and Kerosene prices which decreased by Kshs 7.2, Kshs 5.1 and Kshs 4.5 each respectively, to retail at Kshs 199.2, Kshs. 190.4 and Kshs. 188.7 per litre respectively, for the period between 15th March 2024 to 14th April 2024. The chart below shows the inflation rates for the past 5 years:
Going forward, we expect inflationary pressures to ease and move close to the preferred CBK target of 5.0%, mainly on the back of a strengthened currency, tight monetary policy, reduced fuel prices and reduced electricity prices. The risk, however, lies on fuel prices which despite their decline in March 2024, still remain elevated compared to global prices. With fuel being a major input in most businesses, we expect that this will continue exerting inflationary pressure on the economy, leaving the rate close to the upper bound of the CBK target range. Key to note is that the Monetary Policy Committee raised the Central Bank Rate to 13.0% in February 2024, from the previous 12.5% with the aim of anchoring the inflation rate and is expected to meet again on 3rd April 2024. In our view, the rate will be pegged on whether the shilling will sustain its appreciation against the dollar, resulting to a decline in the import bill and costs passed to consumers through hiked consumer prices.
The Kenyan Shilling:
The Kenyan Shilling gained against the US Dollar by 15.8% in Q1’2024, to close at Kshs 131.8, from Kshs 156.5 as at the end of 2023. On a year-to-date basis, the shilling has appreciated by 16.0% against the dollar, a contrast to the 26.8% depreciation recorded in 2023.
We expect the shilling to be supported by:
- Diaspora remittances standing at a cumulative USD 4,329.7 mn in the 12 months to February 2024, 7.5% higher than the USD 4,026.2 mn recorded over the same period in 2023, which has continued to cushion the shilling against further depreciation. In the February 2024 diaspora remittances figures, North America remained the largest source of remittances to Kenya accounting for 56.0% in the period, and,
- The tourism inflow receipts which came in at USD 333.9 mn in 2023, a 24.6% increase from USD 268.1 mn inflow receipts recorded in 2022, and owing to tourist arrivals that improved by 30.7% to 192,000 in the 12 months to December 2023, from 161,000 recorded during a similar period in 2022.
The shilling is however expected to remain under pressure in 2024 as a result of:
- An ever-present current account deficit which came at 3.5% of GDP in Q3’2023 from 6.4% recorded in a similar period in 2022,
- The need for government debt servicing, continues to put pressure on forex reserves given that 67.5% of Kenya’s external debt was US Dollar denominated as of September 2023, and,
- Dwindling forex reserves, currently at USD 7.1 bn (equivalent to 3.8 months of import cover), which is below the statutory requirement of maintaining at least 4.0 months of import cover.
Monetary Policy:
The Monetary Policy Committee (MPC) met once during Q’12024, on February 6, 2024, to review the outcome of its previous policy decisions against a backdrop of continued global uncertainties, moderating global oil prices, an improved global growth outlook as well as the heightened geopolitical tensions. The MPC decided to raise the CBR rate by 0.5% points to 13.0% from 12.5%,. Below are some of the key highlights from the February meeting:
- The overall inflation tightened to 6.9% in January 2024, from 6.6% in December 2023, to remain on the higher bound of the preferred CBK range of 2.5%-7.5%, mainly driven by an increase in fuel inflation. Fuel inflation increased to 14.3% in January 2024 from 13.7% in December 2023, largely attributable to higher electricity tariffs. The food inflation increased slightly to 7.9% in January 2024 from 7.7% in December 2023, attributable largely to higher prices of a few non-vegetable food items, following a decline in food supply partly due to seasonal factors. The increase was however mitigated by a decrease in the prices of a few vegetables, particularly mangoes and tomatoes. The non-food non-fuel inflation slightly increased to 3.6% in January 2024 from 3.4% in December 2023. We expect the overall inflation to tighten further in the short-term, on the back of increased landing fuel prices resulting from the depreciation of the Shilling against the dollar,
- The recently released GDP data for the third quarter of 2023 showed continued strong performance of the Kenyan economy, with real GDP growing by 5.9%. This was attributable to a strong rebound in the agriculture sector due to favourable weather conditions and resilient performance of the services sector. Leading indicators of economic activity pointed to continued strong performance in the fourth quarter of 2023. Despite the global uncertainties, the economy is expected to continue to strengthen in 2024, supported by resilient services sector, the rebound in agriculture, and implementation of measures to boost economic activity in priority sectors by the Government,
- Goods exports declined by 2.2% in the 12 months to December 2023, compared to a 9.3% growth in a similar period in 2022. Receipts from manufactured exports increased by 11.3%, attributable to increased regional demand. Imports declined by 10.6% in the 12 months to December 2023 compared to a growth of 7.3% in a similar period in 2022, mainly reflecting lower imports across all categories except food and crude materials. Tourist arrivals improved by 30.7% in the 12 months to December 2023, compared to a similar period in 2022. Remittances totalled USD 4,190.0 mn in the 12 months to December 2023 and were 4.0% higher compared to a similar period in 2022. The current account deficit is estimated at 3.9% of GDP in the 12 months to December 2023, and is projected at 4.0% of GDP in 2024, reflecting the expected recovery in imports, resilient remittances and expected rebound in agricultural exports. Going forward for this year, the MPC expects a widening of the current account to a current account deficit of USD 4.9 bn, to be mostly funded by inflows of capital and to have a residual deficit of USD 111.0 mn,
- The CBK foreign exchange reserves, which stood at USD 7,101.0 mn in February representing 3.8 months of import cover, continue to provide adequate cover and a buffer against any short-term shocks in the foreign exchange market,
- The banking sector remains stable and resilient, with strong liquidity and capital adequacy ratios. The ratio of gross non-performing loans (NPLs) to gross loans decreased to 14.8% in December 2023 compared to 15.3% in October 2023. Decreases in NPLs were noted in the energy and water, manufacturing, agriculture, building and construction, and transport and communication sectors. However, banks have continued to make adequate provisions for the NPLs,
- The CEOs Survey and Market Perceptions Survey conducted ahead of the MPC meeting revealed a positive outlook on business activity for the next year. Participants of the survey expressed concerns about low demand for goods, weakening of the Kenya shilling and high interest rates. Despite this, they remained optimistic that economic growth would remain resilient and improve in 2024, supported by increased agricultural production, easing global inflation, a resilient private sector and focus by the government on key sectors including agriculture,
- The Survey of the Agriculture Sector revealed an expectation by respondents that the prices of key food items were expected to increase in the next three months due to high import costs as a result of the depreciation of the currency’s value,
- Global growth is expected to increase by 0.1% points to 3.2% in 2024 from 3.1% in 2023, attributable to a higher-than-expected growth in the United States, continued strengthening of the Chinese economy and a high growth in several large and emerging markets. Additionally, headline inflation rates in advanced economies have continued to ease, but remain above their respective core inflationary targets due to tight monetary policy and lower commodity prices of particularly oil and food,
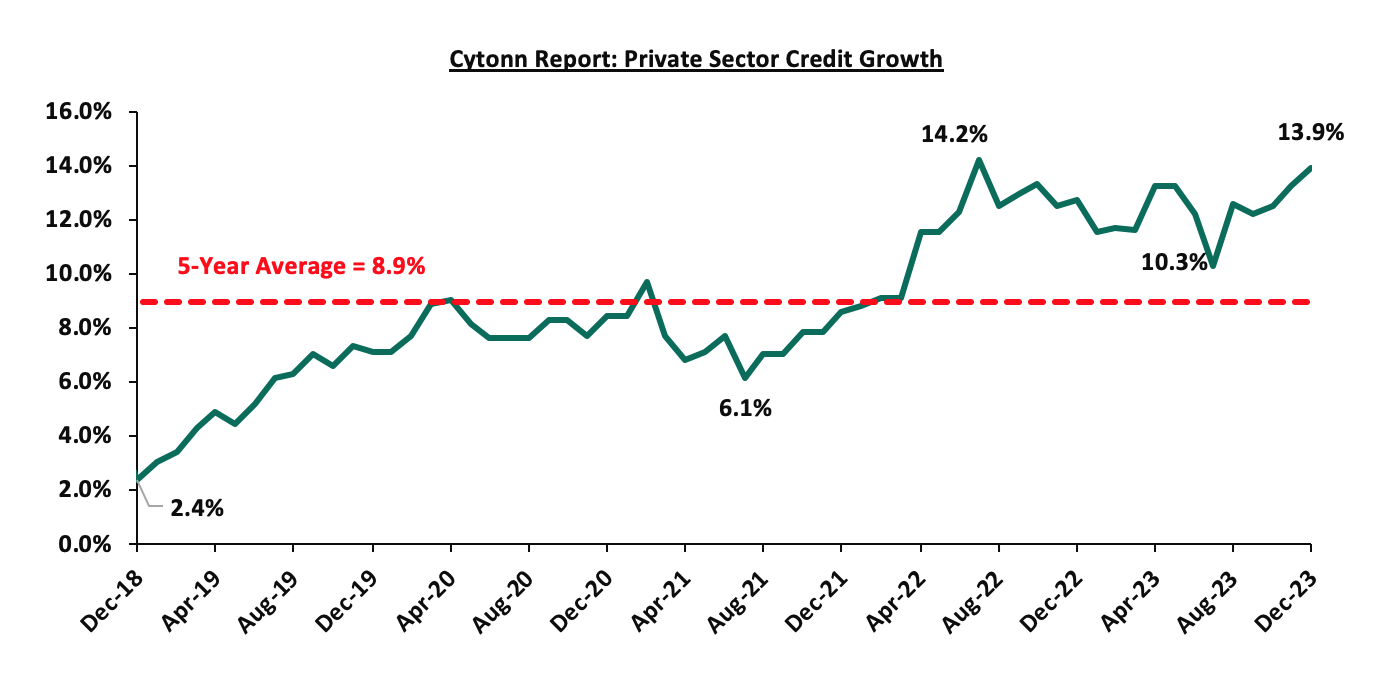
- Growth in private sector credit increased to 13.9% in December 2023 from 13.2% in November, mainly attributed to credit growth in the manufacturing, transport and communication, trade, and consumer durables sectors which grew by 20.9, 20.8%, 13.1% and 9.9% respectively. The number of loan applications and approvals remained strong, reflecting sustained demand, particularly for working capital requirements. The chart below shows the movement of the private sector credit growth over the last five years:
- The Committee noted the ongoing implementation of the FY2023/24 Government Budget, as well as the revised budget for the fiscal year which continues to reinforce fiscal consolidation. Notably, with fiscal deficit is expected to decline from 5.6% in 2023 to around 3.0% in the next three years.
The MPC noted the impact of the continued, albeit reduced, depreciation of the Kenyan Shilling against the dollar on domestic prices of goods and its ripple effect on the cost of living and purchasing power of consumers. In addition to the inflation tightening to 6.9% in January 2024, the committee noted that all key components of inflation had increased in January. Additionally, the Committee noted that the proposed action will ensure that inflationary pressures remain anchored and downward towards the 5.0% mid-point of the target range, as well as addressing residual pressures on the exchange rate. The MPC therefore decided to raise the Central Bank Rate (CBR) to 13.00%, from 12.50% and concluded that it will closely monitor the impact of the policy measures as well as developments in the global and domestic economy and stands ready to further tighten monetary policy as necessary to ensure price and exchange rate stability are achieved, in line with its mandate. The Committee will meet again on Wednesday 3rd April 2024.
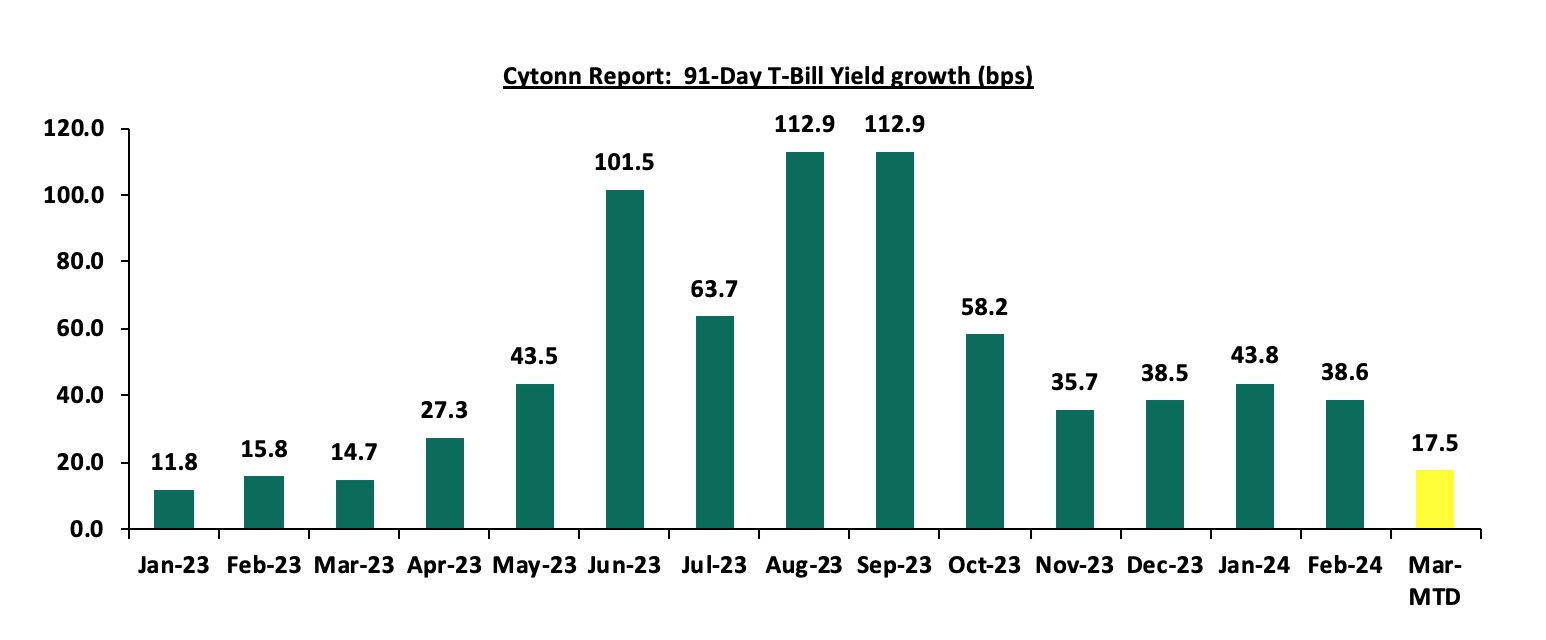
During the quarter, T-bills were oversubscribed, with the overall subscription rate coming in at 132.6%, up from 130.0% in Q4’2023. Investors’ preference for the 91-day paper persisted as they sought to avoid duration risk, with the paper receiving bids worth Kshs 276.9 bn against the offered Kshs 56.0 bn, translating to an oversubscription rate of 494.4%, lower than the oversubscription rate of 602.7% recorded in the previous quarter. Overall subscriptions for the 182-day and 364-day papers increased to 56.3% and 64.3% from 45.7% and 22.0% in Q4’2023, respectively. The yields on all the papers were on an upward trajectory with the average yields on the 364-day, 182-day, and 91-day papers increasing by 119.4 bps, 118.3 bps, and 114.0 bps to 16.7%, 16.6%, and 16.4%, from 15.5%, 15.4%, and 15.3%, respectively, recorded in Q4’2023. The upward trajectory in yields is mainly on the back of investors attaching higher risks amid high inflation and tight liquidity positions, hence the need to demand higher returns to cushion against the possible loss. The acceptance rate during the period came in at 88.8%, albeit lower than the 91.9 recorded in Q4’2023, with the government accepting a total of Kshs 395.6 bn out of the Kshs 445.7 bn worth of bids received. The chart below shows the yield growth rate for the 91-day paper in 2023 and 2024 YTD;
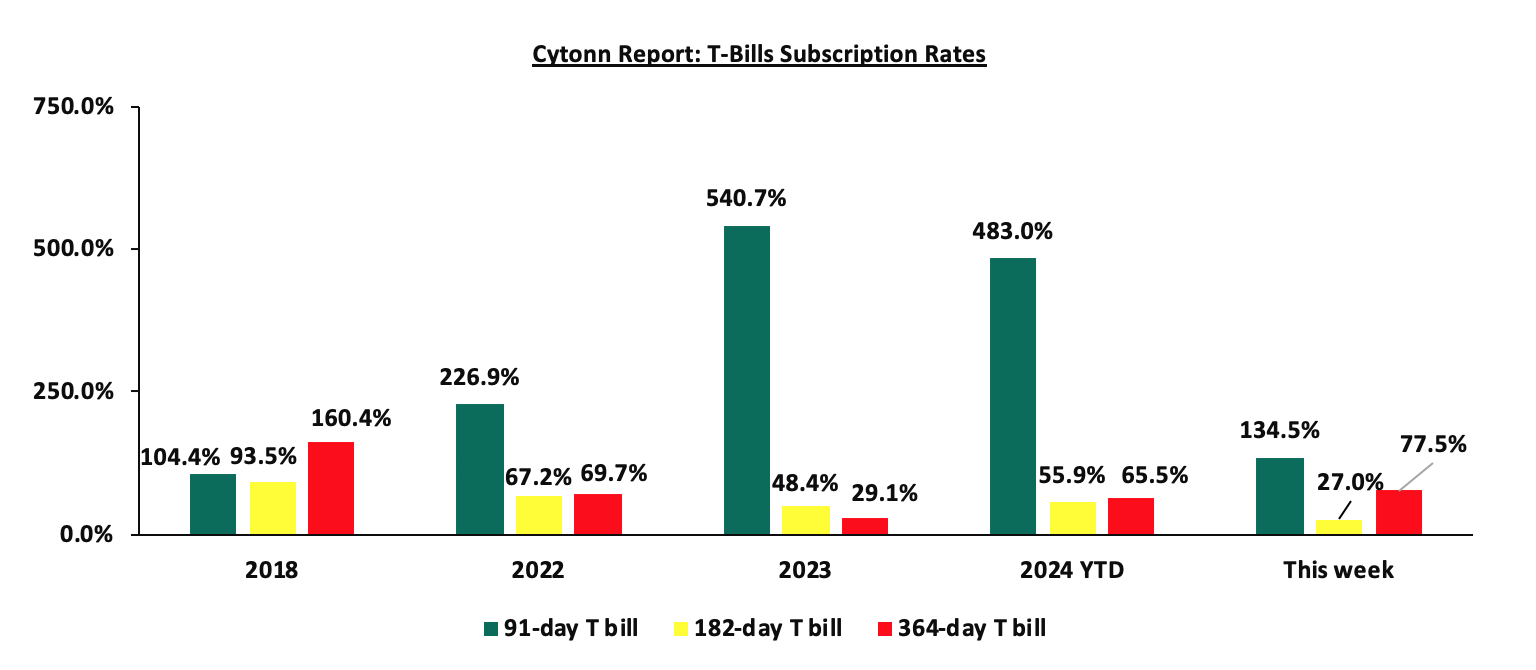
During the week, T-bills were undersubscribed, with the overall undersubscription rate coming in at 66.0%, a reversal from the oversubscription rate of 102.8% recorded the previous week, Investor’s preference for the shorter 91-day paper persisted as they sought to avoid duration risk, with the paper receiving bids worth Kshs 5.4 bn against the offered Kshs 4.0 bn, translating to an oversubscription rate of 134.5%, albeit lower than the oversubscription rate of 291.2% recorded the previous week. Notably, the subscription rates for the 182-day paper and 364-day paper decreased to 27.0% and 77.5% respectively, from 40.9% and 89.4% respectively recorded the previous week. The government accepted a total of Kshs 13.5 bn worth of bids out of Kshs 15.8 bn of bids received, translating to an acceptance rate of 85.3%. The yields on the government papers recorded mixed performances, with the yield of the 364-day paper increasing marginally by 0.1 bps to remain relatively unchanged at 17.0%, while the 182-day and 91-day papers decreased marginally by 2.6 bps and 0.2 bps to 16.9%, and 16.7%, respectively. The chart below compares the overall average T-bills subscription rates obtained in 2018, 2022, 2023, and 2024 Year to Date (YTD) and this week:
Primary T-bond auctions in Q1’2024:
In the primary bond market, the government issued two new Treasury bonds and one infrastructure bond, re-opened three, and offered two of them on tap sale, seeking to raise Kshs 200 bn during the quarter. The bonds were generally oversubscribed, receiving bids worth Kshs 440.5 bn against the offered Kshs 200.0 bn, translating to an oversubscription rate of 220.2%. The government accepted Kshs 334.6 bn of the Kshs 440.5 bn worth of bids received, translating to an acceptance rate of 76.0%. Additionally, the government is seeking to raise Kshs 25.0 bn through the tap sale of two bonds, FXD1/2023/005 and FXD1/2024/010, with a period of sale of Wednesday 27th March 2024 to Thursday 4th April 2024. The bids shall be priced at the average rate of accepted yield for the initial values which stood at 18.4% and 16.5% for FXD1/2023/005 and FXD1/2024/010, respectively. The table below provides more details on the bonds issued during the quarter:
|
Cytonn Report: Q1’2024 Kenya Bond Issuances |
|||||||||
|
Issue Date |
Bond Auctioned |
Effective Tenor to Maturity (Years) |
Coupon |
Amount offered (Kshs bn) |
Actual Amount Raised (Kshs bn) |
Total bids received |
Average Accepted Yield |
Subscription Rate |
Acceptance Rate |
|
15/01/2024 |
FXD1/2023/005 (re-opened) |
4.5 |
16.8% |
35.0 |
25.0 |
37.2 |
18.8% |
106.1% |
67.3% |
|
FXD1/2024/003 |
2.9 |
18.4% |
18.4% |
||||||
|
22/01/2024 |
FXD1/2023/005 - Tapsale |
4.5 |
16.8% |
15.0 |
11.8 |
11.9 |
18.8% |
79.1% |
99.1% |
|
FXD1/2024/003 - Tapsale |
2.9 |
18.4% |
18.4% |
||||||
|
19/02/2024 |
IFB/2024/8.5 |
8.5 |
18.5% |
70.0 |
241.0 |
288.7 |
18.5% |
412.4% |
83.5% |
|
11/03/2024 |
FXD1/2024/03 (re-opened) |
2.9 |
18.4% |
40.0 |
34.3 |
43.1 |
18.4% |
107.7% |
79.6% |
|
25/03/2024 |
FXD1/2024/005 (re-opened) |
4.5 |
16.8% |
40.0 |
22.6 |
59.7 |
18.4% |
149.3 |
37.8 |
|
FXD1/2024/010 |
10.0 |
16.0% |
16.5% |
||||||
|
Q1'2024 Total |
|
|
200.0 |
334.6 |
440.5 |
|
|
|
|
|
Q1'2024 Average |
5.1 |
17.8% |
40.0 |
66.9 |
88.1 |
18.3% |
170.9% |
60.5% |
|
|
Q4'2023 Average |
4.1 |
16.9% |
31.3 |
20.8 |
25.3 |
17.8% |
106.2% |
78.2% |
|
Source: CBK
Secondary Bond Market Activity:
- Bond Turnover
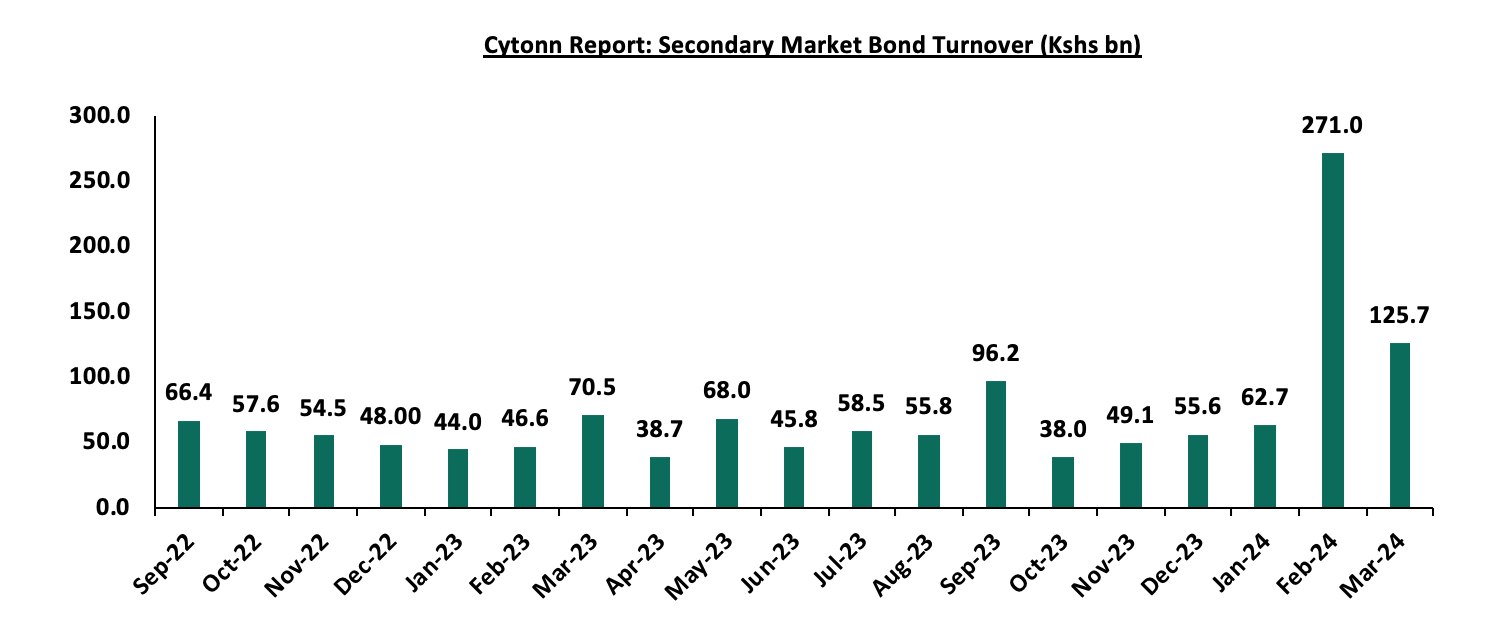
In the secondary bond market, activity increased significantly, with the turnover increasing by 254.2% to Kshs 505.4 bn, from Kshs 142.7 bn in Q4’2023, partially attributable to the increased allocation to treasury bonds by local institutional investors as they sought higher yield in the market. The chart below shows the bond turnover over the last one year:
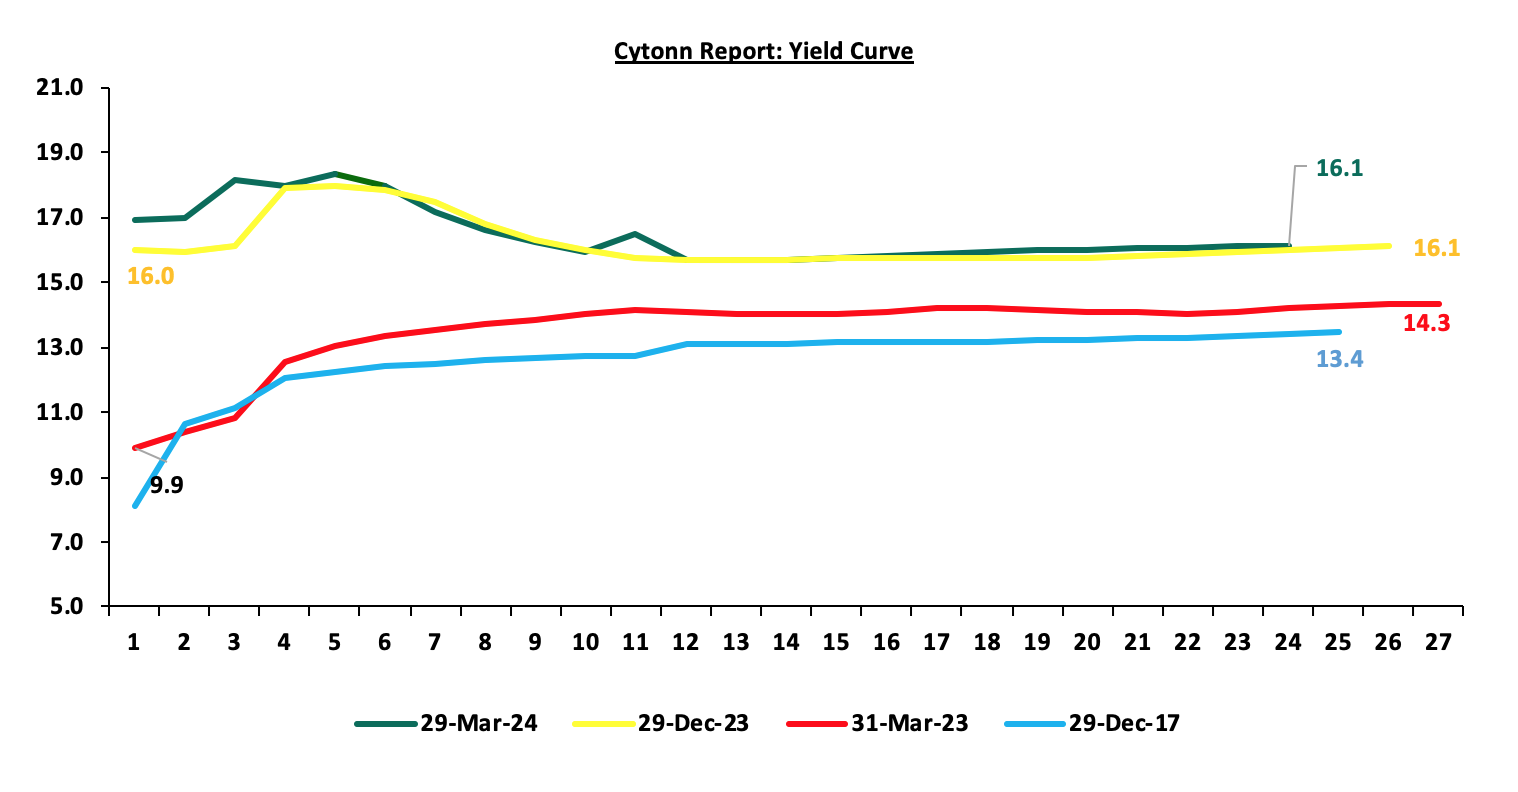
- Yield Curve
The yield curve was on an upward trajectory in Q1’2024 with a notable increase in the yields of the shorter-term bonds. We observe a slightly humped yield curve for the short to medium-term bonds, an indication of the prevailing uncertainty in the market regarding both medium-term interest rates and inflation. Investors, apprehensive about the economic outlook in the near to medium term are demanding higher yields for bonds to compensate for the perceived risks, The chart below shows the yield curve movement during the quarter;
Money Market Performance:
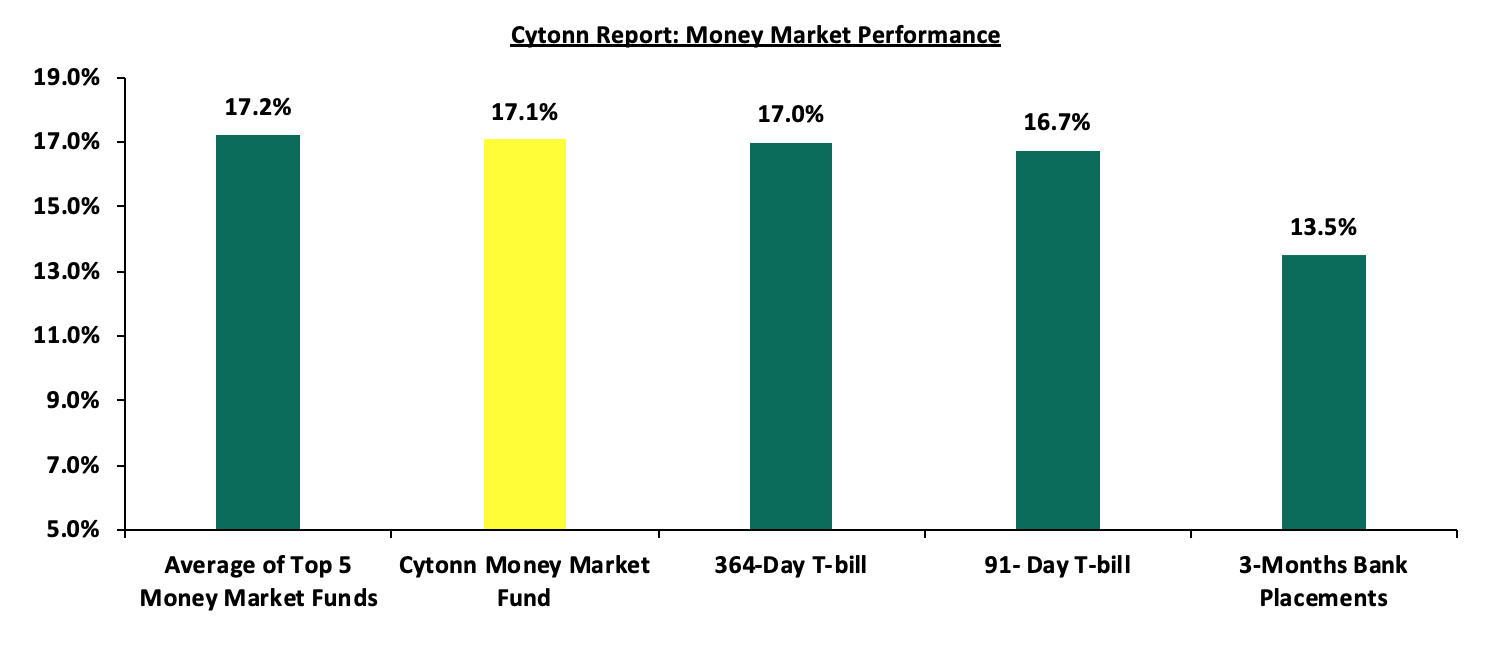
In the money markets, 3-month bank placements ended the week at 13.5% (based on what we have been offered by various banks), and the yields on the 364-day increased marginally by 0.1 bps to remain relatively unchanged at 17.0% while that of the 182-day and 91-day papers decreased by 2.6 bps and 0.2 bps to 16.9% and 16.7%, respectively. The yields of the Cytonn Money Market Fund decreased marginally by 1.0 bps to 17.06% from the 17.07% recorded the previous week, while the average yields on the Top 5 Money Market Funds increased marginally by 13.4 bps to close the week at 17.3 from the 17.2% recorded the previous week.
The table below shows the Money Market Fund Yields for Kenyan Fund Managers as published on 29th March 2024:
|
Cytonn Report: Money Market Fund Yield for Fund Managers as published on 29th March 2024 |
||
|
Rank |
Fund Manager |
Effective Annual Rate |
|
1 |
Etica Money Market Fund |
18.1% |
|
2 |
Lofty-Corban Money Market Fund |
18.0% |
|
3 |
Cytonn Money Market Fund (Dial *809# or download the cytonn app) |
17.1% |
|
4 |
GenAfrica Money Market Fund |
16.9% |
|
5 |
Nabo Africa Money Market Fund |
16.8% |
|
6 |
Kuza Money Market fund |
16.3% |
|
7 |
Enwealth Money Market Fund |
16.1% |
|
8 |
Madison Money Market Fund |
15.9% |
|
9 |
Apollo Money Market Fund |
15.9% |
|
10 |
Absa Shilling Money Market Fund |
15.5% |
|
11 |
Co-op Money Market Fund |
15.4% |
|
12 |
Jubilee Money Market Fund |
15.3% |
|
13 |
KCB Money Market Fund |
15.3% |
|
14 |
GenCap Hela Imara Money Market Fund |
15.2% |
|
15 |
Mali Money Market Fund |
14.9% |
|
16 |
Sanlam Money Market Fund |
14.8% |
|
17 |
Mayfair Money Market Fund |
14.0% |
|
18 |
AA Kenya Shillings Fund |
13.7% |
|
19 |
Orient Kasha Money Market Fund |
13.7% |
|
20 |
Old Mutual Money Market Fund |
13.7% |
|
21 |
Dry Associates Money Market Fund |
13.6% |
|
22 |
CIC Money Market Fund |
13.2% |
|
23 |
ICEA Lion Money Market Fund |
12.3% |
|
24 |
British-American Money Market Fund |
10.0% |
|
25 |
Equity Money Market Fund |
9.6% |
Source: Business Daily
Liquidity:
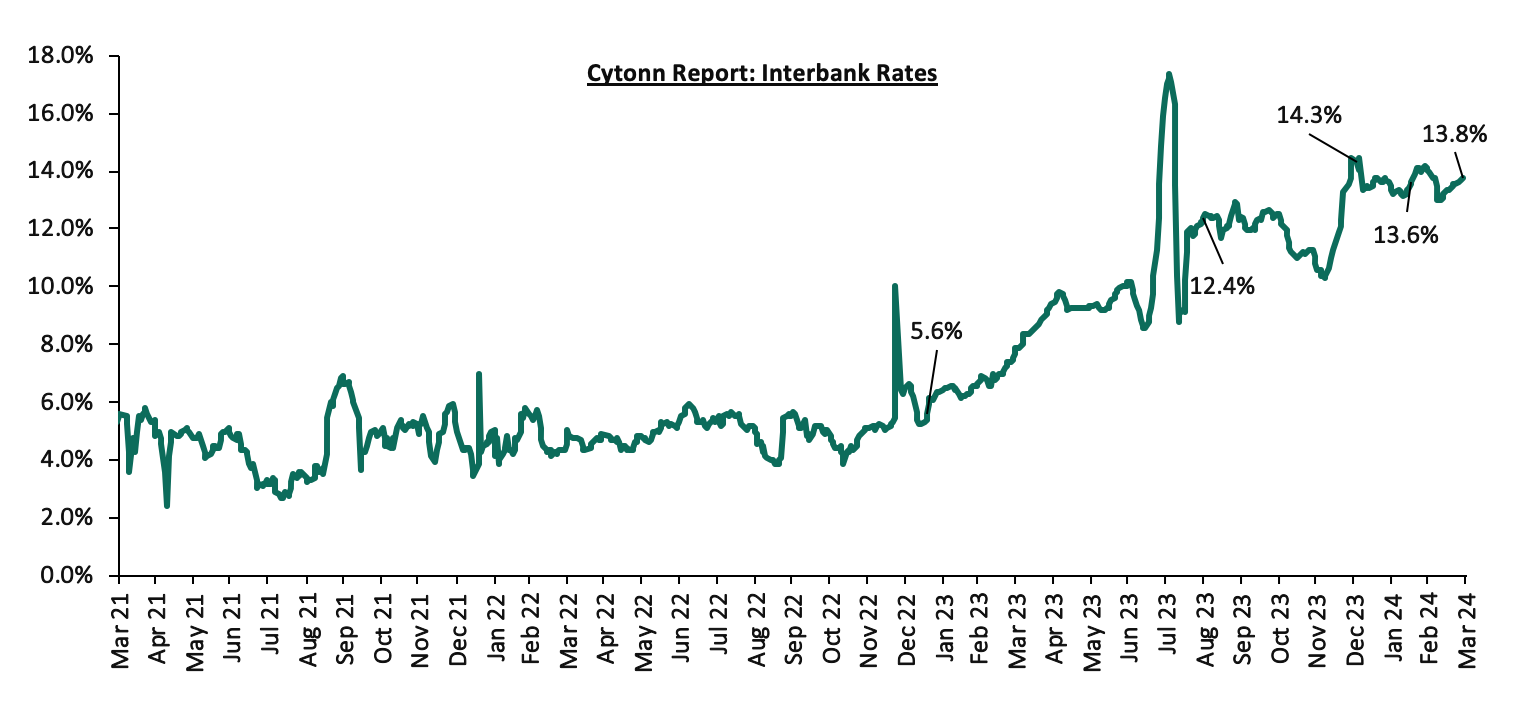
During the quarter, liquidity in the money market tightened, with the average interbank rate increasing by 1.8% points to 13.6% from 11.8% the previous quarter, partly attributable to tax remittances that offset government payments. The average volumes traded in the interbank market increased by 8.8% to Kshs 23.5.4 bn, from Kshs 21.6 bn recorded in the previous quarter.
During the week, liquidity in the money markets tightened, with the average interbank rate increasing by 19.8 bps to 13.7% from 13.5% recorded the previous week, partly attributable to government payments that offset tax remittances. The average interbank volumes traded decreased significantly by 31.9% to Kshs 23.9 bn from Kshs 35.0 bn recorded the previous week. The chart below shows the interbank rates in the market over the years:
Kenya Eurobonds:
During the quarter, the yields on Eurobonds were on a downward trajectory, with the 7-year Eurobond issued in 2019 decreasing the most by 1.7% points to 8.4% from 10.1% recorded at the start of the quarter. The decline in yields is partly attributable to reduced credit risk and positive investor sentiment following the successful buyback of the USD 2.0 bn Eurobond maturing in June 2024.
During the week, the yields on Kenya’s Eurobonds recorded mixed performances, with the yields on the13-year Eurobond issued in 2021 decreasing the most by 0.1% points to remain relatively unchanged at the 9.3% recorded the previous week, while the yield on the 7-year bond issued in 2019 increased marginally by 0.01% points to remain relatively unchanged at 8.4%. The table below shows the summary of the performance of the Kenyan Eurobonds as of 29th March 2024;
|
Cytonn Report: Kenya Eurobond Performance |
||||||
|
|
2018 |
2019 |
2021 |
2024 |
||
|
Date |
10-year issue |
30-year issue |
7-year issue |
12-year issue |
13-year issue |
6-year issue |
|
Years to Maturity |
3.9 |
23.9 |
3.1 |
8.1 |
10.2 |
5.9 |
|
01-Jan-24 |
9.8% |
10.2% |
10.1% |
9.9% |
9.5% |
|
|
01-Mar-24 |
9.5% |
10.3% |
9.2% |
9.9% |
9.8% |
9.8% |
|
21-Mar-24 |
8.7% |
9.9% |
8.4% |
9.3% |
9.3% |
9.3% |
|
22-Mar-24 |
8.7% |
9.9% |
8.4% |
9.3% |
9.3% |
9.3% |
|
25-Mar-24 |
8.7% |
9.9% |
8.5% |
9.3% |
9.3% |
9.3% |
|
26-Mar-24 |
8.7% |
9.8% |
8.4% |
9.3% |
9.3% |
9.2% |
|
27-Mar-24 |
8.7% |
9.8% |
8.4% |
9.3% |
9.3% |
9.2% |
|
28-Mar-24 |
8.7% |
9.8% |
8.4% |
9.3% |
9.3% |
9.2% |
|
Weekly Change |
(0.0%) |
(0.1%) |
0.0% |
0.0% |
(0.1%) |
(0.1%) |
|
MTD Change |
(0.8%) |
(0.5%) |
(0.7%) |
(0.6%) |
(0.6%) |
(0.6%) |
|
Q/Q Change |
(1.1%) |
(0.4%) |
(1.7%) |
(0.6%) |
(0.2%) |
- |
|
YTD Change |
(1.1%) |
(0.4%) |
(1.7%) |
(0.6%) |
(0.2%) |
- |
Source: Central Bank of Kenya (CBK) and National Treasury
Kenya Shilling:
During the quarter, the Kenya Shilling gained against the US Dollar by 16.0%, to close at Kshs 131.8, from Kshs 157.0 recorded at the start of the quarter. On a year-to-date basis, the shilling has appreciated by 16.0% against the dollar, a contrast to the 26.8% depreciation recorded in 2023.
During the week, the Kenya Shilling gained against the US Dollar by 0.8%, to close at Kshs 131.8, from Kshs 132.9 recorded the previous week.
We expect the shilling to be supported by:
- Diaspora remittances standing at a cumulative USD 4,329.7 mn in the 12 months to February 2024, 7.5% higher than the USD 4,026.2 mn recorded over the same period in 2023, which has continued to cushion the shilling against further depreciation. In the February 2024 diaspora remittances figures, North America remained the largest source of remittances to Kenya accounting for 56.0% in the period, and,
- The tourism inflow receipts which came in at USD 333.9 mn in 2023, a 24.6% increase from USD 268.1 mn inflow receipts recorded in 2022, and owing to tourist arrivals that improved by 30.7% to 192,000 in the 12 months to December 2023, from 161,000 recorded during a similar period in 2022.
The shilling is however expected to remain under pressure in 2024 as a result of:
- An ever-present current account deficit which came at 3.5% of GDP in Q3’2023 from 6.4% recorded in a similar period in 2022,
- The need for government debt servicing, continues to put pressure on forex reserves given that 67.5% of Kenya’s external debt was US Dollar denominated as of September 2023, and,
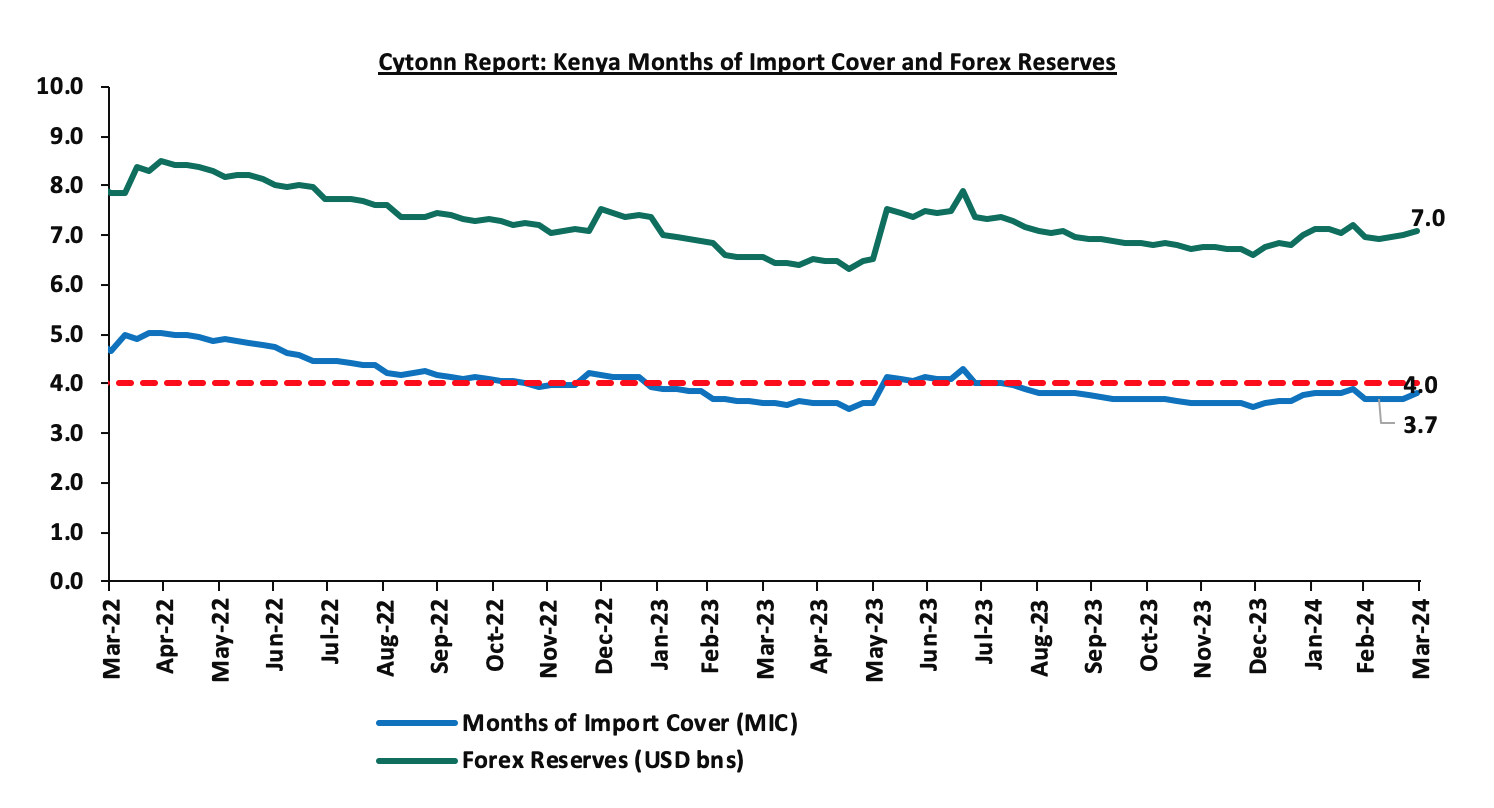
- Dwindling forex reserves, currently at USD 7.0 bn (equivalent to 3.7 months of import cover), which is below the statutory requirement of maintaining at least 4.0 months of import cover.
Key to note, during the quarter, Kenya’s forex reserves increased by 4.6% to close at USD 7.1 bn from the USD 6.8 recorded at the start of the quarter. Moreover, during the week, the reserves increased marginally by 0.9% to close the week at USD 7.1 bn from the USD 7.0 bn recorded last week, equivalent to 3.8 months of import cover, an increase from the previous week’s 3.7 months, but remained below the statutory requirement of maintaining at least 4.0 months of import cover. The chart below summarizes the evolution of Kenya's months of import cover over the years:
Q1’2024 Highlights:
- Stanbic Bank released its monthly Purchasing Manager's Index (PMI) highlighting that the index for the month of December 2023 improved slightly, coming in at 48.8, up from 45.8 in November 2023, signalling a modest improvement in operating conditions across Kenya. Please see our Cytonn Weekly 01/2024,
- The Energy and Petroleum Regulatory Authority (EPRA) released their monthly statement on the maximum retail fuel prices in Kenya, effective from 15th January 2024 to 14th February 2024. Notably, the maximum allowed price for Super Petrol, Diesel and Kerosene decreased by Kshs 5.0, Kshs 5.0 and Kshs 4.8 respectively and retailed at Kshs 207.4, Kshs 196.5 and Kshs 194.2 per litre respectively from the December 2023 prices of Kshs 212.4, Kshs 201.5 and Kshs 199.1 respectively. Please see our Cytonn Weekly 02/2024,
- During the quarter, The Executive Board of the International Monetary Fund (IMF) concluded the 2023 Article IV consultation with Kenya together with the sixth reviews and augmentations of access of USD 941.2 mn (Kshs 151.3 bn) under the Extended Fund Facility (EFF) and the Extended Credit Facility (ECF) arrangements, and the first review under the 20-month Resilience and Sustainability Facility (RSF) arrangement, approved in July 2023. Please see our Cytonn Weekly 03/2024,
- The National Treasury gazetted the revenue and net expenditures for the sixth month of FY’2023/2024, ending 29th December 2023. Total revenue collected as at the end of December 2023 amounted to Kshs 1,092.1 bn, equivalent to 42.4% of the revised estimates of Kshs 2,576.8 bn for FY’2023/2024 and is 84.8% of the prorated estimates of Kshs 1,288.4 bn. December’s 84.8% attainment of the revenue target was a 2.6%-points improvement from the performance in November where the government achieved 82.2% of the revenue targets. Please see our Cytonn Weekly 03/2024,
- During the quarter, Ivory Coast (Côte d’Ivoire) became the first Sub-Saharan Africa (SSA) country to tap into the international capital markets, issuing two bonds with respective maturities of 8.5 years and 12.5 years, maturing on 30th January 2033 and 30th January 2037 respectively. This was the first issue in the SSA region since 2022, when rising global interest rates and geopolitical tensions made foreign currency debt prohibitively expensive for most African borrowers. Notably, the sovereign raised a total of USD 2.6 bn from the two tranches, with the two issues recording an oversubscription of over USD 8.0 bn. The coupon rates for the 8.5-year (maturity 2033) and the 12.5-year (maturity 2037) were fixed at 7.625% and 8.250% respectively, with the coupons being payable semi-annually in arrears. Please see our Cytonn Weekly #04/2024,
- The Monetary Policy Committee met on February 6, 2024, to review the outcome of its previous policy decisions against a backdrop of continued global uncertainties, moderating global oil prices, an improved global growth outlook as well as heightened geopolitical tensions. The MPC decided to raise the CBR rate by 0.5% points to 13.0% from 12.5% on account of inflation remaining sticky in the economy as well as continued pressures on the exchange rate, albeit reduced. Please see our Cytonn Weekly 06/2024,
- Kenya announced it was going through with the earlier announced plan of buying back the 10-year tenor USD 2.0 bn Eurobond issued in 2014. In the announcement, Kenya stated that the buyback plan would be financed by the issuance of a new Eurobond. This followed successful issues by Ivory Coast and Benin which raised USD 2.6 bn and USD 750.0 mn respectively, marking the return of the Sub-Saharan region to the international Eurobonds market after nearly two years of absence. Please see our Cytonn Weekly 06/2024,
- During the quarter, Benin became the second country in the Sub-Saharan Africa (SSA) region to tap into the international capital markets in 2024, issuing their debut dollar bond with a tenor of 14 years and a coupon rate of 8.375%. Notably, the bond was oversubscribed with the overall subscription rate coming in at 666.7% having received bids worth USD 5.0 bn against the offered USD 750.0 mn; Please see our Cytonn Weekly 06/2024,
- The Stanbic Bank released its monthly Purchasing Manager's Index (PMI) highlighting that the index for the month of January 2024 improved slightly, coming in at 49.8, up from 48.8 in December 2023, signalling a modest and softer downturn in operating conditions across Kenya’s business environment; Please see our Cytonn Weekly 06/2024,
- The Energy and Petroleum Regulatory Authority (EPRA) released its monthly statement on the maximum retail fuel prices in Kenya, effective from 15th February 2024 to 14th March 2024. Notably, the maximum allowed price for Super Petrol, Diesel and Kerosene decreased by Kshs 1.0 each, and retailed at Kshs 206.4, Kshs 195.5 and Kshs 193.2 per litre respectively from the January 2024 prices of Kshs 207.4, Kshs 196.5 and Kshs 194.2 respectively; Please see our Cytonn Weekly 07/2024,
- During the month, The Government, through the Ministry of National Treasury & Planning announced the successful pricing of a new USD 1.5 bn Eurobond. The new issuance (KENINT 2031) attracted a yield of 10.375% and a coupon rate of 9.75%, in line with our expectations which were informed by the prevailing market conditions, Kenya’s credit ratings, and the unique nature of the buyback and issue plan. Interest payments for the bond are to be paid semi-annually on February 16th and August 16th starting August 2024; Please see our Cytonn Weekly 07/2024,
- The Government, on 15th February 2024, announced the results of the Tender offer of its USD 2.0 bn 10-year tenor Eurobond issued in 2014. The buyback offer received tenders worth 1.5 bn against the offered 1.4 bn, translating to an oversubscription rate of 106.1%, with Kenya accepting bids worth USD 1.4 bn, slightly below the offered USD 1.5 bn. This translated to an acceptance rate of 97.0%; Please see our Cytonn Weekly 07/2024,
- The global ratings agency, S&P Global affirmed Kenya's long-term sovereign credit rating at 'B' with a negative outlook and assigned a 'B' long-term issue rating to the proposed U.S. dollar-denominated Eurobonds. This came in following the buyback of the 10-year tenor USD 2.0 bn Eurobond tenders issued in 2014 and the new issuance of the KENINT 2031 Eurobond priced at USD 1.5 bn. In addition, the global ratings agency, Moody’s announced its revision of the Kenyan banks’ outlook to negative from stable on the back of the high volume of non-performing loans (NPLs), which have thrown a pall over the sector's strong profitability and liquidity. Please see our Cytonn Weekly 07/2024,
- The National Treasury gazetted the revenue and net expenditures for the seventh month of FY’2023/2024, ending 31st January 2024 highlighting that total revenue collected as at the end of January 2024 amounted to Kshs 1,261.0 bn, equivalent to 48.9% of the revised estimates of Kshs 2,576.8 bn for FY’2023/2024 and is 83.9% of the prorated estimates of Kshs 1,503.1 bn; Please see our Cytonn Weekly 07/2024,
- Yields on the Government securities had been on an upward trajectory with the 91-day paper yielding 16.6% from 9.4% in January 2023. Going forward, we anticipate a very modest increase in yields on the government papers before they stabilize in the remaining months of FY’2023/24. The increase will be muted going forward due to the positive investor sentiment brought about by the successful offering of the Eurobond, which helped alleviate the fears of possible default by the government. Please see our Cytonn Weekly 08/2024,
- Stanbic Bank released its monthly Purchasing Manager's Index (PMI)-Kenya highlighting that the index for the month of February 2024 improved, coming in at 51.3, up from 49.8 in January 2024. The index was also at its highest level in over a year, with positive directional influences seen in all five of its sub-components. The upturn of the general business environment was mainly attributable to eased inflationary pressures, appreciating Shilling, and reduced fuel prices. Please see our Cytonn Weekly 10/2024,
- The Energy and Petroleum Regulatory Authority (EPRA) released their monthly statement on the maximum retail fuel prices in Kenya, effective from 15th March 2024 to 14th April 2024. Notably, the maximum allowed price for Super Petrol, Diesel and Kerosene decreased by Kshs 7.2, Kshs 5.1, and Kshs 4.5 each respectively, and will retail at Kshs 199.2, Kshs 190.4 and Kshs 188.7 per litre respectively, from the February 2024 prices of Kshs 206.4, Kshs 195.5 and Kshs 193.2 respectively. Please see our Cytonn Weekly 11/2024,
- The National Treasury gazetted the revenue and net expenditures for the eighth month of FY’2023/2024, ending 29th February 2024. Total revenue collected as at the end of February 2024 amounted to Kshs 1,424.9 bn, equivalent to 55.3% of the revised estimates of Kshs 2,576.8 bn for FY’2023/2024, and was 82.9% of the prorated estimates of Kshs 1,717.8 bn. Please see our Cytonn Weekly 11/2024, and,
- Ghanaian authorities and international bondholders were poised to engage in crucial talks that week to navigate the complexities of restructuring approximately USD 13.0 bn of defaulted global debt. This effort marked the start of formal talks to restructure Ghana’s debt to private international bondholders. Please see our Cytonn Weekly 11/2024.
Weekly Highlights
- Zambia Eurobond Restructuring Deal
During the week, Zambia’s Ministry of Finance and National Planning announced that the country had reached an agreement on debt restructuring terms with the steering committee on debt restructuring. Zambia had defaulted on its USD 3.5 bn Eurobond back in November 2020 and has been working on getting their debt restructured under the G20’s Common Framework.
Pursuant to this agreement, Bondholders will be invited to exchange their Bonds for new fixed-income instruments. The new instruments will have an average weighted maturity period of 1 and 8 years under the Base Case and Upside Case treatments respectively. In this arrangement, bondholders will make substantial concessions of approximately USD 840.0 mn in claims forgone and another USD 2.5 bn in cash relief during the IMF program period. This USD 2.5 bn cashflow relief implies that Zambia will have more flexibility in managing its finances because it won't have to make as many debt payments during the specified period.
The government of Zambia has also accepted some non-financial terms in the new agreement. First, they have committed to a Most favored creditor clause which would ensure the government does not give preferential or better treatment to any of the creditors. In case that happens, those same terms will be extended to all creditors.
Also included is the Loss Reinstatement Clause which states that if Zambia defaults on its debt again during the time when the IMF program is still active, the Bondholders can get back some of the concessions they made. It's a way to protect Bondholders from additional losses if Zambia doesn't meet its obligations. There is also an additional requirement for Zambia to keep creditors updated throughout the process.
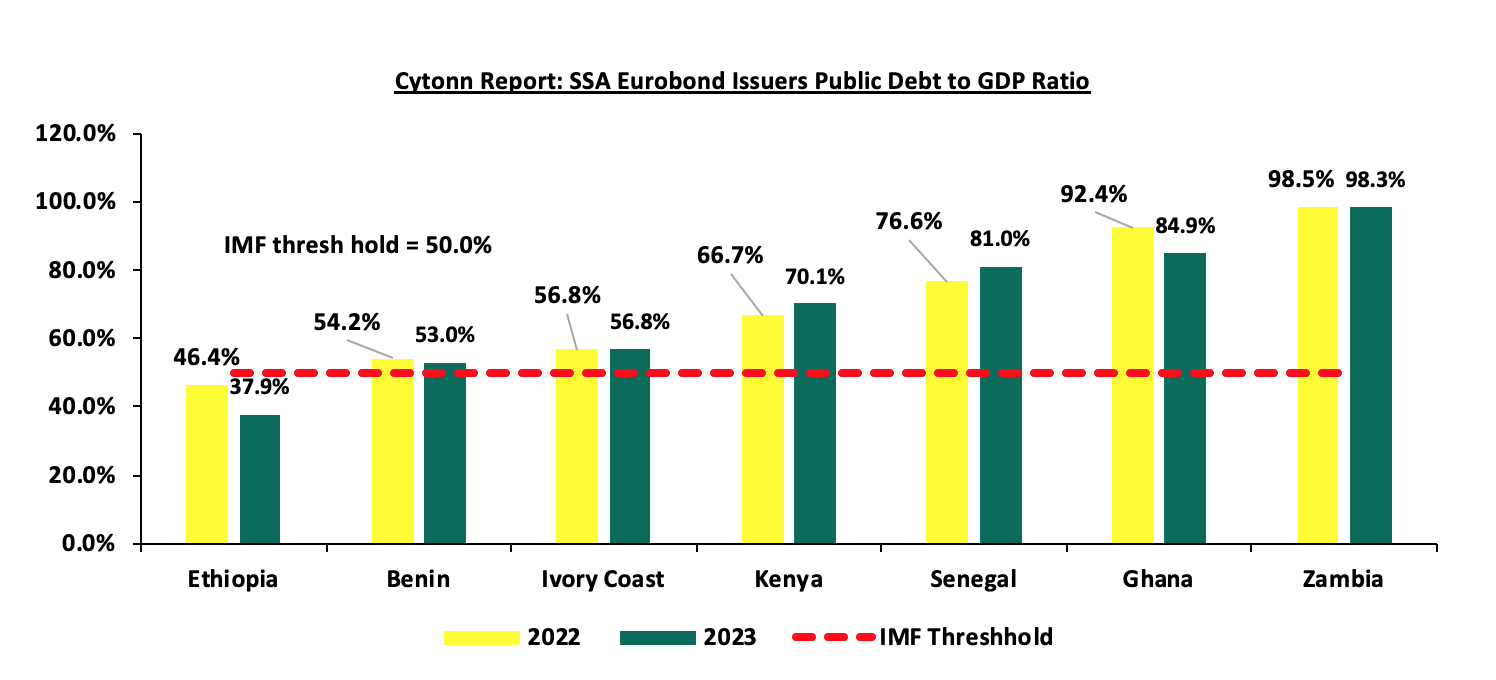
Following this news, Zambia’s existing dollar bonds strengthened, with the 2027 note up 1.8 cents to 73.85 cents on the dollar. According to Moody’s, S&P Global, and Fitch Zambia’s Credit Ratings currently stand at CCC- (Negative), CCC+ (Stable), and CCC+ (NR) respectively. Zambia’s high public debt-to-GDP ratio of 98.3%, which is 48.3% points higher than the IMF recommended threshold of 50.0%, has been a source of concern for the country’s debt sustainability. The graph below shows the public debt to GDP ratio of select SSA countries:
Source: IMF, CBK
This debt restructuring agreement represents a significant step towards addressing Zambia's debt challenges, providing necessary relief to the government involving important concessions from Bondholders. Implementation of the restructuring will be a critical next step that we’ll keep monitoring.
Rates in the Fixed Income market have been on an upward trend given the continued high demand for cash by the government and the occasional liquidity tightness in the money market, but now seem to have peaked and have started declining, albeit marginally. The government is 8.6% ahead of its prorated net domestic borrowing target of Kshs 356.1 bn, having a net borrowing position of Kshs 386.9 bn out of the domestic net borrowing target of Kshs 471.4 bn for the FY’2023/2024. Therefore, we expect a continued soft upward readjustment of the yield curve in the short and medium term, with the government looking to maintain the fiscal surplus through the domestic market. Owing to this, our view is that investors should be biased towards short-term fixed-income securities to reduce duration risk.
Market Performance:
During Q1’2024, the equities market was on an upward trajectory, with NSE 10 gaining the most by 27.3%, while NSE 25, NASI, and NSE 20 gained by 25.0%, 22.8%, and 16.7% respectively. The equities market performance was driven by gains recorded by large cap stocks such as Equity Group, KCB, and Cooperative Bank which gained by 40.1%, 37.2%, and 31.6%, respectively. The gains were however weighed down by losses recorded by other large cap stocks such as EABL and Cooperative Bank, which declined by 5.5% and 3.3%, respectively
During the week, the equities market was on an upward trajectory, with NSE 10 gaining the most by 5.1%, while NASI, NSE 25, and NSE 20 gained by 5.0%, 4.7%, and 3.9% respectively, taking the YTD performance to gains of 26.8%, 24.6%, 23.0% and 16.1% for NSE 10, NSE 25, NASI and NSE 20 respectively. The equities market performance was driven by gains recorded by large-cap stocks such as KCB Group, DTB-K, and Safaricom, of 17.6%, 7.8%, and 6.0% respectively.
During Q1’2024, equities turnover increased significantly by 70.7% to USD 130.4 mn, from USD 76.4 mn in Q4’2023. Foreign investors remained net sellers during the quarter, with a net selling position of USD 16.4 mn, from a net selling position of USD 14.2 mn in Q4’2023.
During the week, equities turnover increased significantly by 87.6% to USD 35.8 mn from USD 19.1 mn recorded the previous week, taking the YTD total turnover to USD 130.4 mn. Foreign investors became net sellers for the second consecutive week with a net selling position of USD 7.4 mn, from a net selling position of USD 0.9 mn recorded the previous week, taking the YTD foreign net selling position to USD 16.4 mn.
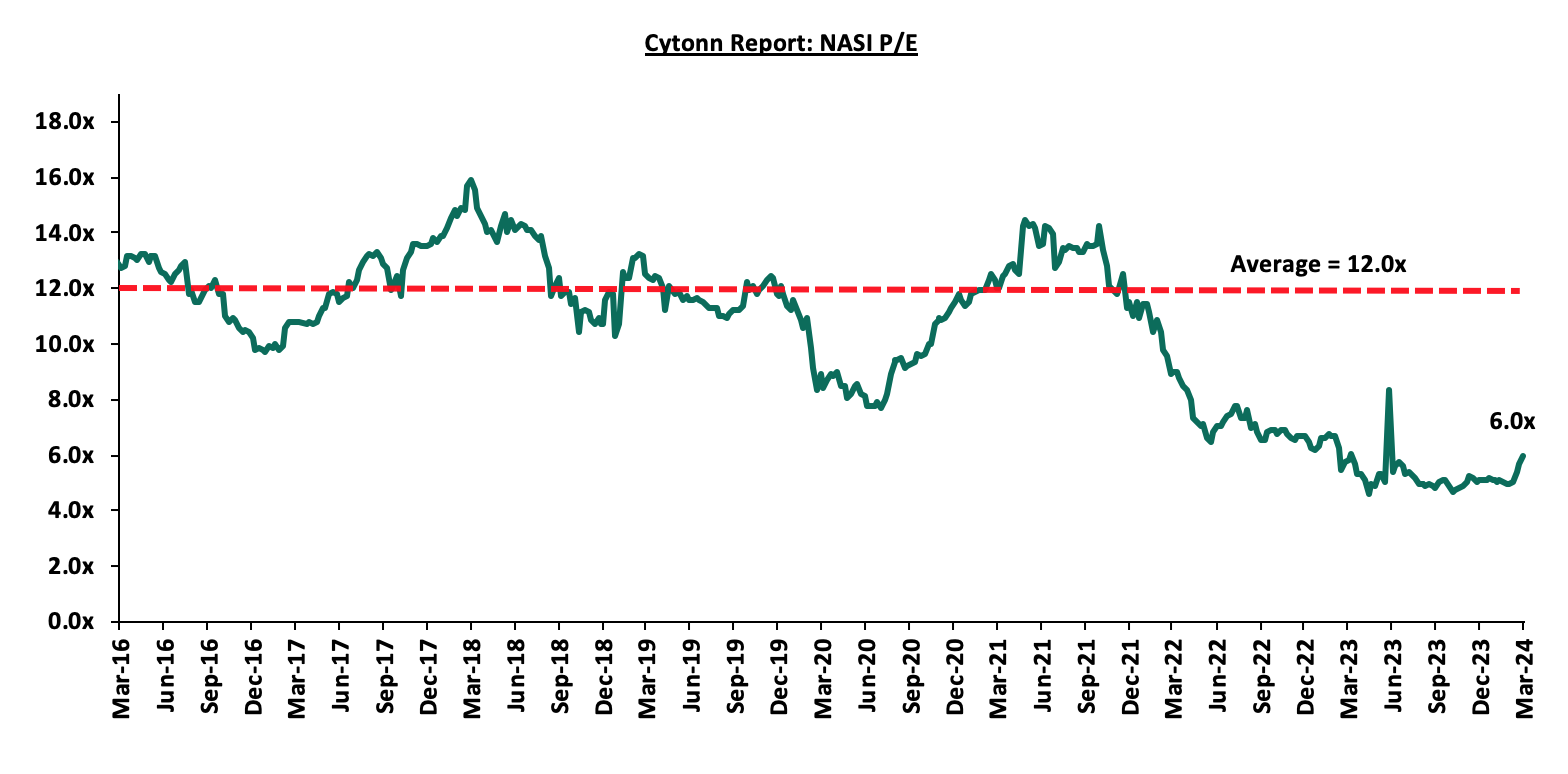
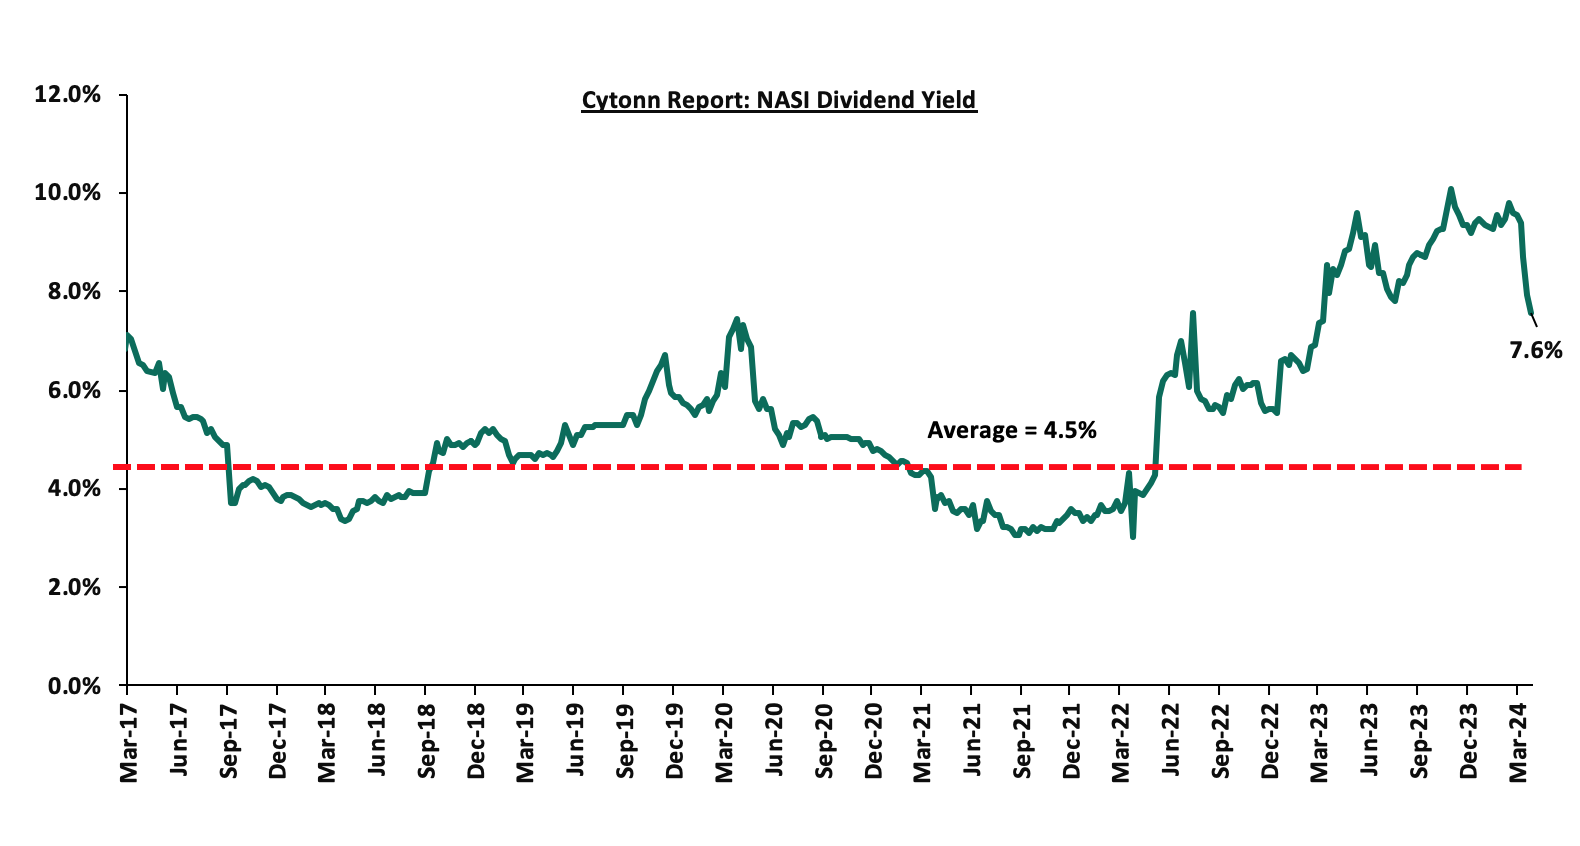
The market is currently trading at a price-to-earnings ratio (P/E) of 6.0x, 50.2% below the historical average of 12.0x. The dividend yield stands at 7.6%, 3.1% points above the historical average of 4.5%. Key to note, NASI’s PEG ratio currently stands at 0.8x, an indication that the market is undervalued relative to its future growth. A PEG ratio greater than 1.0x indicates the market is overvalued while a PEG ratio less than 1.0x indicates that the market is undervalued. The charts below indicate the historical P/E and dividend yields of the market;
Universe of Coverage:
|
Cytonn Report: Equities Universe of Coverage |
|||||||||||
|
Company |
Price as at 22/03/2024 |
Price as at 28/03/2024 |
w/w change |
q/q change |
YTD Change |
Year Open 2024 |
Target Price* |
Dividend Yield |
Upside/ Downside** |
P/TBv Multiple |
Recommendation |
|
Sanlam |
6.3 |
6.5 |
2.5% |
7.7% |
7.7% |
6.0 |
10.3 |
0.0% |
59.3% |
1.8x |
Buy |
|
I&M Group*** |
20.9 |
22.1 |
5.8% |
26.0% |
26.4% |
17.5 |
28.6 |
11.6% |
41.3% |
0.5x |
Buy |
|
Equity Group*** |
45.4 |
47.2 |
4.0% |
40.1% |
37.9% |
34.2 |
61.6 |
8.5% |
39.1% |
1.0x |
Buy |
|
Co-op Bank*** |
14.9 |
15.0 |
0.7% |
31.6% |
32.2% |
11.4 |
19.3 |
10.0% |
38.7% |
0.7x |
Buy |
|
Jubilee Holdings |
195.0 |
197.5 |
1.3% |
6.8% |
6.8% |
185.0 |
260.7 |
6.1% |
38.1% |
0.3x |
Buy |
|
ABSA Bank*** |
14.0 |
14.0 |
(0.4%) |
21.8% |
20.8% |
11.6 |
17.2 |
11.1% |
34.4% |
1.1x |
Buy |
|
Diamond Trust Bank*** |
51.0 |
55.0 |
7.8% |
22.1% |
22.9% |
44.8 |
67.8 |
9.1% |
32.4% |
0.2x |
Buy |
|
Standard Chartered*** |
187.8 |
197.8 |
5.3% |
22.1% |
23.4% |
160.3 |
232.1 |
14.7% |
32.0% |
1.3x |
Buy |
|
NCBA*** |
41.8 |
43.8 |
4.8% |
12.5% |
12.7% |
38.9 |
52.2 |
9.7% |
28.9% |
0.9x |
Buy |
|
Stanbic Holdings |
123.0 |
126.5 |
2.8% |
16.3% |
19.3% |
106.0 |
145.3 |
12.1% |
27.0% |
0.9x |
Buy |
|
KCB Group*** |
25.6 |
30.1 |
17.6% |
37.2% |
36.9% |
22.0 |
37.2 |
0.0% |
23.8% |
0.5x |
Buy |
|
Kenya Reinsurance |
2.0 |
2.2 |
8.9% |
17.6% |
19.5% |
1.9 |
2.5 |
9.0% |
22.6% |
0.2x |
Buy |
|
Britam |
5.6 |
5.0 |
(11.0%) |
4.4% |
(2.7%) |
5.1 |
6.0 |
0.0% |
19.4% |
0.7x |
Accumulate |
|
CIC Group |
2.2 |
2.2 |
0.0% |
(0.4%) |
(2.6%) |
2.3 |
2.5 |
5.8% |
17.9% |
0.7x |
Accumulate |
|
Liberty Holdings |
5.0 |
5.5 |
9.2% |
48.5% |
42.0% |
3.9 |
6.1 |
0.0% |
11.3% |
0.4x |
Accumulate |
|
HF Group |
4.4 |
4.2 |
(4.3%) |
21.0% |
22.0% |
3.5 |
3.9 |
0.0% |
(7.4%) |
0.2x |
Sell |
|
Target Price as per Cytonn Analysts’ estimates **Upside/ (Downside) is adjusted for Dividend Yield ***For Disclosure, these are stocks in which Cytonn and/or its affiliates are invested in |
|||||||||||
Earnings Releases
- I&M Group FY’2023 Financial Performance
During the week, I&M Group released their FY’2023 Financial Results. Below is a summary of their FY’2023 performance:
|
Balance Sheet Items |
FY'2022 |
FY'2023 |
y/y change |
|
Government Securities |
68.1 |
78.1 |
14.7% |
|
Net Loans and Advances |
238.6 |
311.3 |
30.5% |
|
Total Assets |
437.3 |
579.7 |
32.6% |
|
Customer Deposits |
312.3 |
416.7 |
33.4% |
|
Total Liabilities |
355.7 |
484.0 |
36.1% |
|
Shareholders’ Funds |
76.5 |
88.2 |
15.2% |
|
Balance Sheet Ratios |
FY'2022 |
FY'2023 |
% points change |
|
Loan to Deposit Ratio |
76.4% |
74.7% |
(1.7%) |
|
Government Securities to Deposit Ratio |
21.8% |
18.7% |
(3.1%) |
|
Return on average equity |
14.4% |
15.0% |
0.7% |
|
Return on average assets |
2.6% |
2.6% |
(0.0%) |
|
Dividend Yield |
12.5% |
11.6% |
(0.9%) |
|
Dividend Payout Ratio |
32.1% |
31.6% |
(0.5%) |
|
Income Statement |
FY'2022 |
FY'2023 |
y/y change |
|
Net Interest Income |
22.9 |
28.6 |
24.8% |
|
Net non-Interest Income |
12.7 |
14.1 |
10.4% |
|
Total Operating income |
35.7 |
42.7 |
19.7% |
|
Loan Loss provision |
(5.2) |
(6.9) |
31.0% |
|
Total Operating expenses |
(21.3) |
(27.2) |
27.5% |
|
Profit before tax |
15.0 |
16.7 |
11.3% |
|
Profit after tax |
11.6 |
13.3 |
15.2% |
|
Core EPS |
7.0 |
8.1 |
15.2% |
|
Income Statement Ratios |
FY'2022 |
FY'2023 |
% points change |
|
Yield from interest-earning assets |
11.0% |
13.0% |
2.0% |
|
Cost of funding |
4.2% |
5.4% |
1.2% |
|
Net Interest Margin |
6.7% |
7.4% |
0.6% |
|
Net Interest Income as % of operating income |
64.3% |
67.1% |
2.8% |
|
Non-Funded Income as a % of operating income |
35.7% |
32.9% |
(2.8%) |
|
Cost to Income Ratio |
59.8% |
63.7% |
3.9% |
|
CIR without LLP |
45.1% |
47.6% |
2.5% |
|
Cost to Assets |
3.7% |
3.5% |
(0.2%) |
|
Capital Adequacy Ratios |
FY'2022 |
FY'2023 |
% points change |
|
Core Capital/Total Liabilities |
22.6% |
19.2% |
(3.4%) |
|
Minimum Statutory ratio |
8.0% |
8.0% |
0.0% |
|
Excess |
14.6% |
11.2% |
(3.4%) |
|
Core Capital/Total Risk Weighted Assets |
16.3% |
14.5% |
(1.8%) |
|
Minimum Statutory ratio |
10.5% |
10.5% |
0.0% |
|
Excess |
5.8% |
4.0% |
(1.8%) |
|
Total Capital/Total Risk Weighted Assets |
20.5% |
18.9% |
(1.6%) |
|
Minimum Statutory ratio |
14.5% |
14.5% |
0.0% |
|
Excess |
6.0% |
4.4% |
(1.6%) |
|
Liquidity Ratio |
46.1% |
44.7% |
(1.4%) |
|
Minimum Statutory ratio |
20.0% |
20.0% |
0.0% |
|
Excess |
26.1% |
24.7% |
(1.4%) |
Key take-outs
- Strong earnings growth - Core earnings per share (EPS) increased by 15.2% to Kshs 8.1 from Kshs 7.0 in FY’2022, mainly driven by 19.7% growth in total operating income to Kshs 42.7 bn in FY’2023 from Kshs 35.7 bn in FY’2022. The performance was however weighed down by the 27.5% increase in total operating expenses to Kshs 27.2 bn, from Kshs 21.3 bn in FY’2022,
- Increased Provisioning – The group’s provisioning increased by 13.1% to Kshs 15.5 bn in FY’2023, from Kshs 13.7 bn in FY’2022 aimed at mitigating increased credit risk on the back of the deteriorated business environment. This is evidenced by the 41.7% growth in Gross Non-Performing Loans (NPLs) to Kshs 35.4 bn in FY’2023, from Kshs 25.0 bn recorded in FY’2022, and,
- Increased dividends- Dividends per share increased by 13.3% to Kshs 2.25 in FY’2023, from Kshs 2.55 in FY’2022 translating to a dividend yield of 11.6% and a dividend payout ratio of 31.6% in 2023 compared to a dividend yield of 12.5% and a dividend payout ratio of 32.1% in 2022.
For a more detailed analysis, please see the I&M Group FY’2023 Earnings Note
- NCBA Group PLC FY’2023 Financial Results
During the week, NCBA Group released their FY’2023 Financial Results. Below is a summary of their performance;
|
Balance Sheet Items |
FY'2022 |
FY'2023 |
y/y change |
|
Net Loans and Advances |
278.9 |
337.0 |
20.8% |
|
Kenya Government Securities |
205.4 |
203.4 |
(1.0%) |
|
Total Assets |
619.7 |
734.6 |
18.6% |
|
Customer Deposits |
502.7 |
579.4 |
15.3% |
|
Deposits Per Branch |
5.1 |
5.6 |
9.7% |
|
Total Liabilities |
537.2 |
638.0 |
18.7% |
|
Shareholders' Funds |
82.4 |
96.7 |
17.3% |
|
Balance Sheet Ratios |
FY'2022 |
FY'2023 |
% points change |
|
Loan to Deposit Ratio |
55.5% |
58.2% |
2.7% |
|
Government Securities to Deposit ratio |
40.9% |
35.1% |
(5.7%) |
|
Return on average equity |
17.2% |
24.0% |
6.8% |
|
Return on average assets |
2.3% |
3.2% |
0.9% |
|
Dividend Payout Ratio |
50.8% |
36.5% |
(14.3%) |
|
Dividend Yield |
13.0% |
10.8% |
(2.2%) |
|
Income Statement |
FY'2022 |
FY'2023 |
y/y change |
|
Net Interest Income |
30.7 |
34.6 |
12.8% |
|
Net non-Interest Income |
30.3 |
29.1 |
(3.9%) |
|
Total Operating income |
60.9 |
63.7 |
4.5% |
|
Loan Loss provision |
13.1 |
9.2 |
(29.9%) |
|
Total Operating expenses |
37.9 |
38.2 |
0.8% |
|
Profit before tax |
22.5 |
25.5 |
13.3% |
|
Profit after tax |
13.8 |
21.5 |
55.7% |
|
Core EPS |
8.4 |
13.0 |
55.7% |
|
Income Statement Ratios |
FY'2022 |
FY'2023 |
% points change |
|
Yield from interest-earning assets |
10.1% |
11.1% |
1.0% |
|
Cost of funding |
4.3% |
5.5% |
1.2% |
|
Net Interest Spread |
5.7% |
5.5% |
(0.2%) |
|
Net Interest Margin |
5.9% |
5.9% |
(0.0%) |
|
Net Interest Income as % of operating income |
50.3% |
54.3% |
4.0% |
|
Non-Funded Income as a % of operating income |
49.7% |
45.7% |
(4.0%) |
|
Cost to Income Ratio |
62.2% |
60.0% |
(2.2%) |
|
Cost to Income Ratio without LLP |
40.8% |
45.7% |
4.9% |
|
Capital Adequacy Ratios |
FY'2022 |
FY'2023 |
% points change |
|
Core Capital/Total Liabilities |
16.3% |
16.3% |
0.0% |
|
Minimum Statutory ratio |
8.0% |
8.0% |
0.0% |
|
Excess |
8.3% |
8.3% |
0.0% |
|
Core Capital/Total Risk Weighted Assets |
18.4% |
18.0% |
(0.4%) |
|
Minimum Statutory ratio |
10.5% |
10.5% |
0.0% |
|
Excess |
7.9% |
7.5% |
(0.4%) |
|
Total Capital/Total Risk Weighted Assets |
18.4% |
18.0% |
(0.4%) |
|
Minimum Statutory ratio |
14.5% |
14.5% |
0.0% |
|
Excess |
3.9% |
3.5% |
(0.4%) |
|
Liquidity Ratio |
53.2% |
55.1% |
1.9% |
|
Minimum Statutory ratio |
20.0% |
20.0% |
0.0% |
|
Excess |
33.2% |
35.1% |
1.9% |
Key Take-Outs:
- Strong earnings growth - Core earnings per share (EPS) grew by 55.7% to Kshs 13.0, from Kshs 8.4 in FY’2022, driven by the 4.5% growth in total operating income to Kshs 63.7 bn, from Kshs 60.9 bn in FY’2022, coupled with a reduced effective tax rate to 15.8%, from 38.7% in FY’2022,
- Improved asset quality – The bank’s gross NPL ratio decreased to 12.3% in FY’2023 from 13.0% in FY’2022, attributable to 13.9% increase in Gross non-performing loans to Kshs 44.6 bn, from Kshs 39.1 bn in FY’2022, compared to the faster 19.8% increase in gross loans to Kshs 361.6 bn, from Kshs 301.8 bn recorded in FY’2022, and,
- Increased dividends- Dividends per share increased to Kshs 4.75 in FY’2023, from Kshs 4.25 in FY’2022 translating to a dividend yield of 10.8% and a dividend payout ratio of 36.5% in 2023 compared to a dividend yield of 13.0% and a dividend payout ratio of 50.8% in 2022.
For a more detailed analysis, please see the NCBA Group FY’2023 Earnings Note
- Diamond Trust Bank Kenya Limited FY’2023 Financial Results
During the week, Diamond Trust Bank Kenya released their FY’2023 Financial Results. Below is a summary of their performance;
|
Balance Sheet Items |
FY'2022 |
FY'2023 |
y/y change |
|
Government Securities |
133.2 |
120.1 |
(9.8%) |
|
Net Loans and Advances |
253.7 |
308.5 |
21.6% |
|
Total Assets |
527.0 |
635.0 |
20.5% |
|
Customer Deposits |
387.6 |
486.1 |
25.4% |
|
Total Liabilities |
449.3 |
548.7 |
22.1% |
|
Shareholders Funds |
69.0 |
74.9 |
8.6% |
|
Balance Sheet Ratios |
FY'2022 |
FY'2023 |
% points change |
|
Loan to Deposit Ratio |
65.5% |
63.5% |
(2.0%) |
|
Government Securities to Deposit Ratio |
34.4% |
24.7% |
(9.7%) |
|
Return on average equity |
10.0% |
10.8% |
0.9% |
|
Return on average assets |
1.4% |
1.3% |
(0.0%) |
|
Dividend payout Ratio |
20.6% |
21.5% |
0.9% |
|
Dividend Yield |
10.8% |
10.9% |
0.1% |
|
Income Statement |
FY'2022 |
FY'2023 |
y/y change |
|
Net interest Income |
22.9 |
27.6 |
20.5% |
|
Net non-interest income |
9.1 |
12.2 |
34.3% |
|
Total Operating income |
31.9 |
39.7 |
24.4% |
|
Loan loss provision |
7.1 |
10.3 |
44.5% |
|
Total Operating expenses |
22.1 |
30.9 |
39.8% |
|
Profit before tax |
9.5 |
9.0 |
(5.5%) |
|
Profit after tax |
6.8 |
7.8 |
14.7% |
|
Core EPS |
24.3 |
27.9 |
14.7% |
|
Income Statement Ratios |
FY'2022 |
FY'2023 |
% points change |
|
Yield from interest-earning assets |
9.2% |
10.6% |
1.3% |
|
Cost of funding |
4.3% |
5.3% |
1.1% |
|
Net Interest Margin |
5.3% |
5.5% |
0.2% |
|
Net Interest Income as % of operating income |
71.7% |
69.4% |
(2.3%) |
|
Non-Funded Income as a % of operating income |
28.3% |
30.6% |
2.3% |
|
Cost to Income Ratio |
69.1% |
77.7% |
8.6% |
|
CIR without LLP |
46.8% |
51.7% |
4.9% |
|
Cost to Assets |
4.5% |
5.3% |
0.8% |
|
Capital Adequacy Ratios |
FY'2022 |
FY'2023 |
% points change |
|
Core Capital/Total Liabilities |
21.1% |
17.3% |
(3.8%) |
|
Minimum Statutory ratio |
8.0% |
8.0% |
|
|
Excess |
13.1% |
9.3% |
(3.8%) |
|
Core Capital/Total Risk Weighted Assets |
19.8% |
16.3% |
(3.5%) |
|
Minimum Statutory ratio |
10.5% |
10.5% |
|
|
Excess |
9.3% |
5.8% |
(3.5%) |
|
Total Capital/Total Risk Weighted Assets |
20.7% |
17.0% |
(3.7%) |
|
Minimum Statutory ratio |
14.5% |
14.5% |
|
|
Excess |
6.2% |
2.5% |
(3.7%) |
|
Liquidity Ratio |
58.2% |
48.6% |
(9.6%) |
|
Minimum Statutory ratio |
20.0% |
20.0% |
|
|
Excess |
38.2% |
28.6% |
(9.6%) |
Key Take-Outs:
- Sustained earnings growth - Core earnings per share (EPS) increased by 14.7% to Kshs 27.9, from Kshs 24.3 in FY’2022, driven by the 24.4% growth in total operating income to Kshs 39.7 bn, from Kshs 31.9 bn in FY’2022. The performance was, however, weighed down by the 39.8% increase in total operating expenses to Kshs 30.9 bn from Kshs 22.1 bn in FY’2022,
- Asset Growth – the bank’s total assets grew by 20.7% to Kshs 635.0 bn in FY’2023 from Kshs 527.0 bn in FY’2022, driven by a 21.6% expansion of the loan book to Kshs 308.5 bn from Kshs 253.7 bn in FY’2022,
- Declined asset quality – The bank’s Gross NPL ratio increased to 13.4% in FY’2023 from 12.0% in FY’2022, attributable to 35.4% increase in Gross non-performing loans to Kshs 43.6 bn, from Kshs 32.2 bn in FY’2022, compared to the 21.6% increase in gross loans to Kshs 326.5 bn, from Kshs 268.6 bn recorded in FY’2022,
- Improved Lending – The bank’s loan book increased by 21.6% to Kshs 308.5 bn from Kshs 253.7 bn in FY’2022, compared to the 9.8% decline in government securities to Kshs 120.1 bn, from Kshs 133.2 bn in FY’2022, emphasizing the bank's approach to boosting lending via digital transformation, and,
- Increased dividends – Dividends per share increased by 20.0% to Kshs 6.00 in FY’2023, from Kshs 5.00 in FY’2022 translating to a dividend yield of 10.9% and a dividend payout ratio of 21.5% in 2023 compared to a dividend yield of 10.8% and a dividend payout ratio of 23.1% in 2022.
For a more detailed analysis, please see the Diamond Trust Bank Kenya FY’2023 Earnings Note
- Equity Group Holdings FY’2023 Financial Results
During the week, Equity Group Holdings released their FY’2023 Financial Results. Below is a summary of their performance;
|
Balance Sheet Items |
FY'2022 |
FY'2023 |
y/y change |
|
Government Securities |
219.2 |
246.7 |
12.5% |
|
Net Loans and Advances |
706.6 |
887.4 |
25.6% |
|
Total Assets |
1447.0 |
1821.4 |
25.9% |
|
Customer Deposits |
1052.2 |
1358.2 |
29.1% |
|
Deposits per branch |
3.1 |
3.8 |
22.9% |
|
Total Liabilities |
1264.8 |
1603.3 |
26.8% |
|
Shareholders’ Funds |
176.2 |
207.8 |
17.9% |
|
Balance Sheet Ratios |
FY'2022 |
FY'2023 |
% y/y change |
|
Loan to Deposit Ratio |
67.2% |
65.3% |
(1.8%) |
|
Government securities to deposit ratio |
20.8% |
18.2% |
(2.6%) |
|
Return on average equity |
26.7% |
22.8% |
(3.9%) |
|
Return on average assets |
3.4% |
2.7% |
(0.7%) |
|
Dividend Yield |
8.7% |
8.5% |
(0.2%) |
|
Dividend payout ratio |
33.6% |
35.9% |
2.3% |
|
Income Statement |
FY'2022 |
FY'2023 |
y/y change |
|
Net Interest Income |
86.0 |
104.2 |
21.2% |
|
Net non-Interest Income |
59.9 |
78.3 |
30.7% |
|
Total Operating income |
145.9 |
182.5 |
25.1% |
|
Loan Loss provision |
(15.4) |
(35.3) |
128.7% |
|
Total Operating expenses |
(86.1) |
(130.6) |
51.7% |
|
Profit before tax |
59.8 |
51.9 |
(13.3%) |
|
Profit after tax |
46.1 |
43.7 |
(5.1%) |
|
Core EPS |
12.2 |
11.6 |
(5.1%) |
|
Income Statement Ratios |
FY'2022 |
FY'2023 |
y/y change |
|
Yield from interest-earning assets |
10.0% |
11.0% |
1.0% |
|
Cost of funding |
2.9% |
3.8% |
0.9% |
|
Cost of risk |
10.6% |
19.3% |
8.8% |
|
Net Interest Margin |
7.2% |
7.4% |
0.2% |
|
Net Interest Income as % of operating income |
58.9% |
57.1% |
(1.8%) |
|
Non-Funded Income as a % of operating income |
41.1% |
42.9% |
1.8% |
|
Cost to Income Ratio |
59.0% |
71.6% |
12.6% |
|
CIR without LLP |
48.4% |
52.3% |
3.8% |
|
Cost to Assets |
5.1% |
5.8% |
0.7% |
|
Capital Adequacy Ratios |
FY'2022 |
FY'2023 |
% Points Change |
|
Core Capital/Total Liabilities |
16.9% |
16.2% |
(0.7%) |
|
Minimum Statutory ratio |
8.0% |
8.0% |
0.0% |
|
Excess |
8.9% |
8.2% |
(0.7%) |
|
Core Capital/Total Risk Weighted Assets |
15.6% |
14.3% |
(1.3%) |
|
Minimum Statutory ratio |
10.5% |
10.5% |
0.0% |
|
Excess |
5.1% |
3.8% |
(1.3%) |
|
Total Capital/Total Risk Weighted Assets |
20.2% |
18.1% |
(2.1%) |
|
Minimum Statutory ratio |
14.5% |
14.5% |
0.0% |
|
Excess |
5.7% |
3.6% |
(2.1%) |
|
Liquidity Ratio |
52.1% |
53.4% |
1.3% |
|
Minimum Statutory ratio |
20.0% |
20.0% |
0.0% |
|
Excess |
32.1% |
33.4% |
1.3% |
Key Take outs
- Decline in Earnings - Core earnings per share (EPS) decreased by 5.1% to Kshs 11.6, from Kshs 12.2 in FY’2022, mainly driven by the 51.7% growth in total operating expenses to Kshs 130.6 bn, from Kshs 86.1 bn in FY’2022. However, the performance was supported by a 25.1% growth in total operating income to Kshs 182.5 bn, from Kshs 145.9 bn in FY’2022,
- Increased Provisioning – On the back of high credit risk occasioned by the deteriorated business environment, the bank increased its provisions holdings to cover for the anticipated losses in the future, with its loan loss provisions increasing significantly by 128.7% to Kshs 35.3 bn from Kshs 15.4 bn recorded in FY’2022, and,
- Revenue Diversification – The Group’s Non-Funded income increased by 30.7% to Kshs 78.3 bn in FY’2023, from Kshs 59.9 bn in FY’2022, which resulted to a shift in revenue mix to 57:43 in FY’2023 from 59:41 in FY’2022.
For a more detailed analysis, please see the Equity Group Holdings FY’2023 Earnings Note
- HF Group FY’2023 Financial Performance
During the week, HF Group released their FY’2023 Financial Results. Below is a summary of their performance;
|
Balance Sheet Items (Kshs bn) |
FY'2022 |
FY'2023 |
y/y change |
|
Net loans |
36.3 |
38.8 |
6.9% |
|
Government Securities |
8.2 |
9.0 |
10.9% |
|
Total Assets |
57.0 |
61.6 |
8.0% |
|
Customer Deposits |
39.8 |
43.8 |
10.2% |
|
Deposits Per Branch |
1.8 |
1.7 |
(6.8%) |
|
Total Liabilities |
48.2 |
52.7 |
9.2% |
|
Shareholder's Funds |
8.8 |
8.9 |
1.1% |
|
Balance Sheet Ratios |
FY'2022 |
FY'2023 |
% y/y change |
|
Loan to deposit ratio |
91.2% |
88.5% |
(2.8%) |
|
Government Securities to deposit ratio |
20.5% |
20.6% |
0.1% |
|
Return on Average Equity |
3.1% |
4.4% |
1.3% |
|
Return on Average Assets |
0.5% |
0.7% |
0.2% |
|
Dividend Yield |
0.0% |
0.0% |
|
|
Dividend Payout ratio |
0.0% |
0.0% |
|
Income Statement (Kshs bn) |
FY'2022 |
FY'2023 |
y/y change |
|
Net Interest Income |
2.2 |
2.5 |
18.1% |
|
Net non-Interest Income |
0.9 |
1.2 |
41.3% |
|
Total Operating income |
3.0 |
3.8 |
24.8% |
|
Loan Loss provision |
(0.2) |
(0.3) |
59.3% |
|
Total Operating expenses |
(2.8) |
(3.5) |
22.8% |
|
Profit before tax |
0.2 |
0.3 |
75.7% |
|
Profit after tax |
0.3 |
0.4 |
46.2% |
|
Core EPS |
0.7 |
1.0 |
46.2% |
|
Income Statement Ratios |
FY'2022 |
FY'2023 |
y/y change |
|
Yield from interest-earning assets |
9.9% |
11.0% |
1.2% |
|
Cost of funding |
4.9% |
5.8% |
0.9% |
|
Net Interest Spread |
5.0% |
5.3% |
0.2% |
|
Net Interest Margin |
5.0% |
5.4% |
0.4% |
|
Cost of Risk |
6.4% |
8.2% |
1.8% |
|
Net Interest Income as % of operating income |
71.1% |
67.2% |
(3.8%) |
|
Non-Funded Income as a % of operating income |
28.9% |
32.8% |
3.8% |
|
Cost to Income Ratio (with LLP) |
93.5% |
92.0% |
(1.5%) |
|
Cost to Income Ratio (without LLP) |
87.1% |
83.9% |
(3.3%) |
|
Capital Adequacy Ratios |
FY'2022 |
FY'2023 |
% points change |
|
Core Capital/Total Liabilities |
8.0% |
4.7% |
(3.3%) |
|
Minimum Statutory ratio |
8.0% |
8.0% |
0.0% |
|
Excess |
0.0% |
(3.3%) |
(3.3%) |
|
Core Capital/Total Risk Weighted Assets |
8.3% |
5.3% |
(3.0%) |
|
Minimum Statutory ratio |
10.5% |
10.5% |
0.0% |
|
Excess |
(2.2%) |
(5.2%) |
(3.0%) |
|
Total Capital/Total Risk Weighted Assets |
12.2% |
9.0% |
(3.2%) |
|
Minimum Statutory ratio |
14.5% |
14.5% |
0.0% |
|
Excess |
(2.3%) |
(5.5%) |
(3.2%) |
|
Liquidity Ratio |
25.2% |
24.5% |
(0.7%) |
|
Minimum Statutory ratio |
20.0% |
20.0% |
0.0% |
|
Excess |
5.2% |
4.5% |
(0.7%) |
Key Takeouts
- Strong earnings growth - Core earnings per share increased by 46.2% to Kshs 1.0 from Kshs 0.7 in FY’2022, mainly driven by the 24.8% growth in total operating income to Kshs 3.8 bn, from Kshs 3.0 bn in FY’2022.
- Asset quality deterioration – The bank’s gross NPL ratio increased to 23.1% in FY’2023 from 19.7% in FY’2022, attributable to the faster growth of 27.5% in Gross non-performing loans to Kshs 10.8 bn in FY’2023 from Kshs 8.5 bn in FY’2022, which outpaced the 9.1% increase in gross loans to Kshs 46.9 bn, from Kshs 43.0 bn recorded in FY’2022, and,
- Sustained Efficiency – Cost to Income Ratio (CIR) improved by 1.5% points to 92.0%, from 93.5% in FY’2022, owing to the 24.8% increase in total operating income to Kshs 3.8 bn from Kshs 3.0 bn in FY’2022, which outpaced the 22.8% increase in total operating expenses to Kshs 3.5 bn, from Kshs 2.8 bn in FY’2022. The cost-to-income ratio without loan loss provisions declined by 3.3% points to 83.9%, from 87.1% in FY’2022.
For a more detailed analysis, please see the HF Group FY’2023 Earnings Note
Asset Quality:
The table below shows the asset quality of listed banks that have released their FY’2023 results using several metrics:
|
Cytonn Report: Listed Banks Asset Quality in FY’2023 |
||||||
|
|
FY'2023 NPL Ratio* |
FY'2022 NPL Ratio** |
% point change in NPL Ratio |
FY'2023 NPL Coverage* |
FY'2022 NPL Coverage** |
% point change in NPL Coverage |
|
Equity Group Holdings |
12.1% |
8.4% |
3.7% |
52.4% |
70.5% |
(18.1%) |
|
KCB |
17.0% |
17.0% |
(0.0%) |
62.5% |
52.4% |
10.1% |
|
Co-operative Bank of Kenya |
16.2% |
14.0% |
2.2% |
57.2% |
65.1% |
(8.0%) |
|
ABSA Bank Kenya |
9.9% |
7.5% |
2.4% |
65.6% |
80.5% |
(14.9%) |
|
Standard Chartered Bank Kenya |
9.7% |
14.2% |
(4.5%) |
81.6% |
87.1% |
(5.6%) |
|
NCBA Group |
12.0% |
12.6% |
(0.6%) |
56.8% |
65.3% |
(8.5%) |
|
Stanbic Bank |
9.5% |
11.2% |
(1.7%) |
70.4% |
63.1% |
7.4% |
|
I&M Group |
10.7% |
9.7% |
1.0% |
55.8% |
71.9% |
(16.2%) |
|
Diamond Trust Bank Kenya |
13.4% |
12.0% |
1.4% |
41.4% |
46.3% |
(4.8%) |
|
HF Group |
23.1% |
19.7% |
3.3% |
74.9% |
78.8% |
(4.0%) |
|
Mkt Weighted Average* |
12.6% |
11.7% |
0.9% |
60.8% |
68.7% |
(7.9%) |
|
*Market cap weighted as at 28/03/2024 |
||||||
|
**Market cap weighted as at 20/04/2023 |
||||||
Key take-outs from the table include;
- Asset quality for the listed banks declined during FY’2023, with the market-weighted average NPL ratio increasing by 0.9% points to 12.6% from 11.7% in FY’2022 attributable to the increase in NPL ratio from Equity Group, HF Group and ABSA Bank to 12.1%, 23.1% and 9.9%, from 8.4%, 19.7% and 7.5% respectively.
- Market-weighted average NPL Coverage for the listed banks decreased by 7.9% points to 60.8% in FY’2023 from 68.7% recorded in FY’2022 attributable to the decrease in NPL coverage ratio from Equity Group, I&M Group and ABSA Bank to 52.4%, 55.8% and 65.6%, from 70.5%, 71.9% and 80.5% respectively.
Summary Performance
The table below shows the performance of listed banks that have released their FY’2023 results using several metrics:
|
Cytonn Report: Listed Banks Performance in FY’2023 |
|||||||||||||
|
Bank |
Core EPS Growth |
Interest Income Growth |
Interest Expense Growth |
Net Interest Income Growth |
Net Interest Margin |
Non-Funded Income Growth |
NFI to Total Operating Income |
Deposit Growth |
Growth in Government Securities |
Loan to Deposit Ratio |
Return on Average Equity |
Dividend Yield |
Dividend payout ratio |
|
Equity |
(5.1%) |
30.1% |
52.9% |
21.2% |
7.4% |
30.7% |
42.9% |
29.1% |
12.5% |
65.3% |
22.8% |
8.1% |
35.9% |
|
KCB |
(8.3%) |
42.8% |
95.6% |
23.9% |
6.6% |
33.9% |
35.0% |
48.9% |
37.7% |
64.8% |
17.5% |
0.0% |
0.0% |
|
Coop |
5.2% |
11.9% |
46.9% |
(0.6%) |
8.1% |
2.8% |
36.9% |
6.6% |
9.1% |
82.9% |
21.0% |
10.1% |
38.0% |
|
ABSA |
12.2% |
32.8% |
66.5% |
23.9% |
9.4% |
6.3% |
26.6% |
19.4% |
(17.5%) |
92.5% |
24.6% |
11.1% |
51.4% |
|
StanChart |
16.4% |
27.0% |
(6.9%) |
32.0% |
8.3% |
5.5% |
29.7% |
22.9% |
(34.2%) |
47.6% |
23.5% |
15.8% |
79.2% |
|
NCBA |
55.7% |
21.1% |
35.3% |
12.8% |
5.9% |
(3.9%) |
45.7% |
15.3% |
(1.0%) |
58.2% |
18.4% |
10.8% |
36.5% |
|
Stanbic |
34.2% |
48.0% |
71.7% |
35.4% |
7.9% |
19.3% |
37.9% |
17.3% |
(27.4%) |
78.7% |
18.6% |
12.5% |
49.9% |
|
I&M Group |
15.2% |
35.1% |
51.5% |
24.8% |
7.4% |
10.4% |
32.9% |
33.4% |
14.7% |
74.7% |
15.0% |
12.2% |
31.6% |
|
DTB-K |
14.7% |
33.1% |
49.8% |
20.5% |
5.5% |
34.3% |
30.6% |
25.4% |
(9.8%) |
63.5% |
10.8% |
10.9% |
14.3% |
|
HF Group |
46.2% |
22.2% |
25.8% |
18.1% |
5.4% |
41.3% |
32.8% |
10.2% |
10.9% |
88.5% |
4.4% |
0.0% |
0.0% |
|
FY'23 Mkt Weighted Average* |
10.9% |
30.2% |
52.5% |
20.6% |
7.5% |
16.7% |
36.9% |
25.1% |
2.5% |
69.3% |
20.6% |
9.2% |
37.8% |
|
FY'22 Mkt Weighted Average* |
26.6% |
19.7% |
20.1% |
19.2% |
7.2% |
31.6% |
37.7% |
13.7% |
3.1% |
71.8% |
21.8% |
9.6% |
36.6% |
|
*Market cap weighted as at 28/03/2024 |
|||||||||||||
|
**Market cap weighted as at 20/04/2023 |
|||||||||||||
Key take-outs from the table include:
- The listed banks recorded a 10.9% growth in core Earnings per Share (EPS) in FY’2023, compared to the weighted average growth of 26.6% in FY’2022, an indication of declined performance attributable to the tough operating environment experienced during the year,
- Non-Funded Income grew by 16.7% compared to market-weighted average growth of 31.6% in FY’2022, despite the increased revenue diversification efforts by the banks,
- The Banks recorded a weighted average deposit growth of 25.1%, higher than the market-weighted average deposit growth of 13.7% in FY’2022, and,
- The Banks recorded a weighted average dividend yield of 9.2% in FY’2023, slightly lower than the weighted average dividend yield of 9.6% in FY’2022. Similarly, the bank’s weighted average dividend payout ratio increased to 37.8%, from a weighted average payout ratio of 36.6% in FY’2022.
- Britam Holdings Plc FY’2023 Financial Results
During the week, Britam Holdings released their FY’ 2023 results. This was the second time the company was releasing their results under the new IFRS 17 reporting system. Britam’s Profit After Tax (PAT) increased by 97.5% to Kshs 3.3 bn, from Kshs 1.7 bn recorded in FY’2022. The performance was mainly driven by a 2.6% increase in Net Investment income to Kshs 11.6 bn, from Kshs 113 bn in FY’2022, but was weighed down by the 30.6% increase in Insurance Expenses to Kshs 26.9 bn in FY’2023, from Kshs 20.6 bn in FY’2022;
|
Cytonn Report: Britam Holdings Income Statement |
|||
|
Item (All figures in Bns) |
FY'2022 |
FY'2023 |
y/y change |
|
Insurance Revenue |
25.8 |
36.4 |
41.4% |
|
Insurance service expenses |
20.6 |
26.9 |
30.6% |
|
Net Insurance income |
2.3 |
3.8 |
61.5% |
|
Net Investment Income |
11.3 |
11.6 |
2.6% |
|
Net Insurance and Finance expenses |
9.1 |
8.6 |
(5.5%) |
|
Other Income |
0.5 |
0.8 |
41.9% |
|
Other operating expenses |
2.6 |
3.4 |
29.6% |
|
Profit Before Tax |
2.9 |
4.8 |
65.0% |
|
Profit After Tax |
1.7 |
3.3 |
97.5% |
|
Cytonn Report: Britam Holdings Balance Sheet |
|||
|
Item (All figures in Bns) |
FY'2022 |
FY'2023 |
y/y change |
|
Investment assets |
140.6 |
150.1 |
6.8% |
|
Intangible Assets |
2.2 |
2.0 |
(8.0%) |
|
Total Assets |
155.8 |
174.4 |
12.0% |
|
Insurance Contract Liabilities |
122.3 |
133.7 |
9.4% |
|
Provisions & other payables |
9.4 |
11.9 |
25.7% |
|
Total liabilities |
134.4 |
148.7 |
10.6% |
|
Shareholder funds |
21.1 |
25.4 |
20.5% |
|
Minority Interest |
0.2 |
0.2 |
(0.1%) |
|
Total Equity |
21.4 |
25.7 |
20.2% |
key take outs from the results:
- Core Earnings Per share increased by 97.5% to Kshs 1.31 from Kshs 0.66 in FY’2022, driven by the 41.4% increase in insurance revenue to Kshs 36.4 bn from Kshs 25.8 bn in FY’2022 which outpaced the 30.6% increase in insurance services expenses to Kshs 26.9 bn from Kshs 20.6 bn in FY’2022,
- Net Investment Income (NII) increased by 2.6% to Kshs 11.6 bn in FY’2023, from Kshs 11.3 bn in FY’2022. This was majorly attributable to the 20.0% increase in interest and dividend income to 15.6 bn from Kshs 13.0 bn in FY’2022, but was weighed down by the 99.6% increase in losses on financial assets fair value to Kshs 4.6 bn from Kshs 2.3 bn in FY’2022,
- Insurance revenue increased by 41.4% to Kshs 36.4 bn in FY’2023 from Kshs 25.8 bn in FY’2022, while insurance expenses increased by 30.6% to Kshs 26.9 bn from Kshs 20.6 bn in FY2022, this translated to a Net insurance service result increase of 61.5% to Kshs 3.8 bn from Kshs 2.3 bn in FY’2022,
- The balance sheet recorded an expansion as total assets increased by 12.0% to Kshs 174.4 bn in FY’2023 from Kshs 155.8 bn in FY’2022 mainly driven by 6.8% increase in investment assets to Kshs 150.1 bn from Kshs 140.6 bn in FY’2022, coupled with a 6.1% increase in reinsurance contract assets Kshs 7.8 bn from Kshs 7.3 bn, and,
- Total liabilities increased by 10.6% to Kshs 148.7 bn from Kshs 134 bn in FY2022, majorly on the back of Insurance contract liabilities 9.4% increase to Kshs 133.7 bn from Kshs 122.3 bn in FY’2022, as well as the 25.7% increase in provisions and other payables to Kshs 11.9 bn from Kshs 9.4 bn in FY’2022.
Other highlights from the release include:
- Non-declaration of dividends – The Group’s board of directors declined to announce any dividends for the fourth consecutive year citing the group’s attempt to conserve capital.
Going forward, the factors that would drive the company’s growth would be:
- Microinsurance partnerships – With a 43.0% market share in microinsurance, Britam continues to leverage this segment through internal initiatives and partnerships. Partnerships such as that between the company and Bonfire Adventures and Digital innovation hub Ohala to offer travel insurance, and another with Voltic Kenya to provide travel insurance and online ticketing are some notable initiatives, and,
- Diversified Products – On top of their mainstream insurance products, Britam has innovatively introduced a number of products into the market. These diversified products, such as school personal accidents, newborn baby insurance products, and their unit trust products, will contribute to the continued growth of the company’s growth.
Q1’2024 Highlights:
- East African Breweries Plc (EABL) released their H1’2024 financial results for the period ending 31 st December 2023, recording a 22.1% decline in the Profits After Tax (PAT) to Kshs 6.8 bn in H1’2024, from Kshs 8.7 bn in H1’2023. The decline was mainly attributable to a 10.8% increase in Indirect Taxes to Kshs 52.5 bn in H1’2024, from Kshs 47.4 bn in H1’2023, coupled with the 36.6% increase in operating costs to Kshs 15.5 bn, from Kshs 11.3 bn in H1’2023 that offset the 13.8% growth in Gross Sales to Kshs 119.1 bn in H1’2024 from Kshs 104 bn in H1’2023. For more details, please see our Cytonn Weekly #04/2024,
- During the quarter, British American Tobacco Kenya Plc released their FY’2023 financial results, recording a 19.2% decline in Profits after Tax (PAT) to Kshs 5.6 bn, from Kshs 6.9 bn recorded in FY’2022. The decline in PAT was majorly attributed to the 2.4% decrease in Gross Sales to Kshs 41.2 bn in FY’2023 from Kshs 42.2 bn recorded in FY’2022. The performance was further weighed down by the 5.5% increase in indirect taxes to Kshs 15.7 bn in FY’2023, from Kshs 14.9 bn recorded in FY’2022 mainly driven by the upward revision of excise duty by 10.0% in July 2022 and a further 6.0% increment in October 2022. For more details, please see our Cytonn Weekly #07/2024,
- During the quarter, Kenya Electricity Generating Company released their H1’2023 financial results, recording a 9.2% decline in Profits after Tax (PAT) to Kshs 3.0 bn, from Kshs 3.3 bn recorded in H1’2022. The decline in PAT was majorly attributed to the 16.4% increase in operating expenses to Kshs 10.1 bn from Kshs 8.7 bn, coupled with the 25.7% increase in income tax to Kshs 1.9 bn in H1’2023 from Kshs 1.5 bn recorded in H1’2022. The performance was further weighed down by the 27.2% increase in finance costs to Kshs 1.9 bn in H1’2023, from Kshs 1.5 bn recorded in H1’2022. For more details, please see our Cytonn Monthly - February,
- During the quarter, Bamburi Cement Plc announced the successful completion of the sale of 1.3 mn ordinary shares in Hima Cement Limited, representing 70.0% of the total shares owned by Bamburi Cement Plc through its parent company Himcem Holdings Limited, to Sarrai Group Limited and Rwimi Holdings Limited. This milestone, following the approval by Bamburi’s shareholders in a virtual general meeting held on December 14, 2023, is a bid to divest from fragmented markets and concentrate in countries where it is among the biggest players. For a more detailed analysis, please see the Cytonn Weekly #10/2024, and,
- During the quarter, KCB Group Plc (KCB) announced that it had entered into a share purchase agreement with Access Bank on March 20, 2024, that would allow Access Bank Plc to acquire 100% shareholding in National Bank of Kenya Limited (NBK) from KCB. Key to note, KCB bank had acquired the National Bank of Kenya back in 2019 in a rescue deal that was supervised by the Central Bank of Kenya. For a more detailed analysis, please see the Cytonn Weekly #12/2024.
We are “Neutral” on the Equities markets in the short term due to the current tough operating environment and huge foreign investor outflows, and, “Bullish” in the long term due to current cheap valuations and expected global and local economic recovery. With the market currently being undervalued for its future growth (PEG Ratio at 0.8x), we believe that investors should reposition towards value stocks with strong earnings growth and that are trading at discounts to their intrinsic value. We expect the current high foreign investors’ sell-offs to continue weighing down the equities outlook in the short term.
In Q1’2024, Kenya’s Real Estate sector recorded notable growth in terms of activity compared to the similar period in 2023, attributable to various factors. Some of the key factors that have continued to shape the performance of the Real Estate sector include;
- The Kenyan government has continued to put its best foot forward towards delivering affordable housing to its citizens. Currently, the AHP pipeline boasts an estimated total of 838,876 housing units under construction by both the government and private sector. This is according to the Architectural Association of Kenya (AAK’s) Status of the Built Environment Report 2023,
- In general, infrastructure development continues to be a factor supporting the growth of the Real Estate sector through opening up areas for Real Estate investments. The government has continually prioritized infrastructural development in efforts aimed at positioning the country as a regional hub through the implementation of several key projects including, Makupa Bridge, Nairobi Expressway, Nairobi Western and Eastern Bypasses among others. Notable projects expected to be delivered in 2024 include phase two of the Dongo Kundu bypass project,
- Kenya Mortgage Refinance Company (KMRC) has continued to drive the availability and affordability of home loans to Kenyans by providing single-digit fixed rate, and long-term finance to Primary Mortgage Lenders (PMLs) such as banks and SACCOs. As at August 2023, KMRC had disbursed Kshs 7.2 bn to nine PMLs,
- The retail sector has continued to grow, with both local and international retailers such as Naivas, QuickMart and Carrefour pursuing aggressive expansion strategies in a bid to increase their dominance in the market, and replace distressed and exited retailers such as Choppies, Nakumatt, Tuskys, and Uchumi. Additionally, the continued entry and expansions witnessed by global retail brands into the country such as Adidas, Puma, Aldo, Micheal Kors among others is expected to further promote the sector’s performance,
- Kenya continues to enjoy recognition as a regional business hub. As a result, foreign entities have continued to open business operations in Kenya, boosting the demand for both commercial and residential Real Estate. Increased business activity has driven up demand for office space, apartments, and housing near business hubs, leading to the development of new projects, increased property values, and job creation in the construction sector,
- With relatively high urbanization and population growth rates of 3.7% p.a and 1.9% p.a, respectively, against the global average of 1.5% p.a and 0.8% p.a, respectively, as at 2022, there is a sustained demand for more housing units in the country, and Real Estate in general,
- The hospitality sector has seen resumed investor confidence evidenced by positive volumes in hotel mergers, expansions, and acquisitions. Furthermore, the number of international arrivals into the country registered a 28.7% year-to-year (y/y) increase to 1,238,330 persons as of October 2023, from 962,157 persons recorded during a similar period last year. Notably, the Hotel Chain Development Pipelines in Africa 2024 Report ranks Nairobi at 7th position by planned number of hotels and rooms with 31 hotels and 4,268 rooms in the pipeline, and,
- The alternatives market, particularly the rising popularity of purpose-built student residences, health and data centers, and consular housing, presents a promising avenue for the growth of the sector in 2024. These asset classes have positioned the sector to remain resilient in a rapidly evolving economic and technological landscape.
However, some of the challenges impeding the performance of the sector include;
- Rising construction costs which increased by 27.0% in 2023 to an average of Kshs 71,200 per SQM from an average of Kshs 56,075 per SQM recorded in 2022. The rise is primarily due to the hike in prices of key construction materials such as cement, steel, paint, aluminum, and PVC on the back of rising inflation. These higher costs are expected to impede development activities in the sector,
- Existing oversupply of physical space in select sectors. With approximately 5.8 mn SQFT in the NMA commercial office market, approximately 3.0 mn SQFT in the Nairobi Metropolitan Area (NMA) retail market, with the rest of the Kenyan retail market having an oversupply of approximately 1.7 mn SQFT. This has led to prolonged vacancy rates in the respective Real Estate sectoral themes,
- The REITs market in Kenya continues to be subdued owing to various challenges such as the large capital requirements of Kshs 100.0 mn for trustees which limits the role to banks, prolonged approval process for REITs, only a few legal entities capable of incorporating REITs, high minimum investment amounts set at Kshs 5.0 mn which discourage investments and lack of adequate knowledge of the financial asset class by investors,
- Tough micro-economic conditions including high inflation and rising interest rates have led to eroded purchasing power and expensive borrowing respectively. This impacts the Real Estate sector negatively as developers enjoy lower profit margins due to the inflated construction costs. Additionally, increased interest rates make borrowing more expensive, further dampening demand for mortgages and lending to developers,
- Constrained financing to developers as lenders continue to tighten their lending requirements and demand more collateral from developers as a result of the high credit risk in the real estate sector. This is evidenced by a 20.9% surge in gross Non-Performing Loans (NPLs) in the Real Estate sector, reaching Kshs 96.0 bn in Q2’2023, up from Kshs 79.4 bn recorded during the same period in 2022, and,
- Underdeveloped capital markets compound difficulties for developers in realizing pools of capital focused on projects, particularly in the private markets, to supplement government efforts in providing housing. Banks in Kenya are the primary source of funding for real estate developers, providing nearly 95.0% of funding as opposed to 40.0% in developed countries. This means that capital markets contribute only 5.0% of Real Estate development funding, compared to 60.0% in developed countries as shown below;
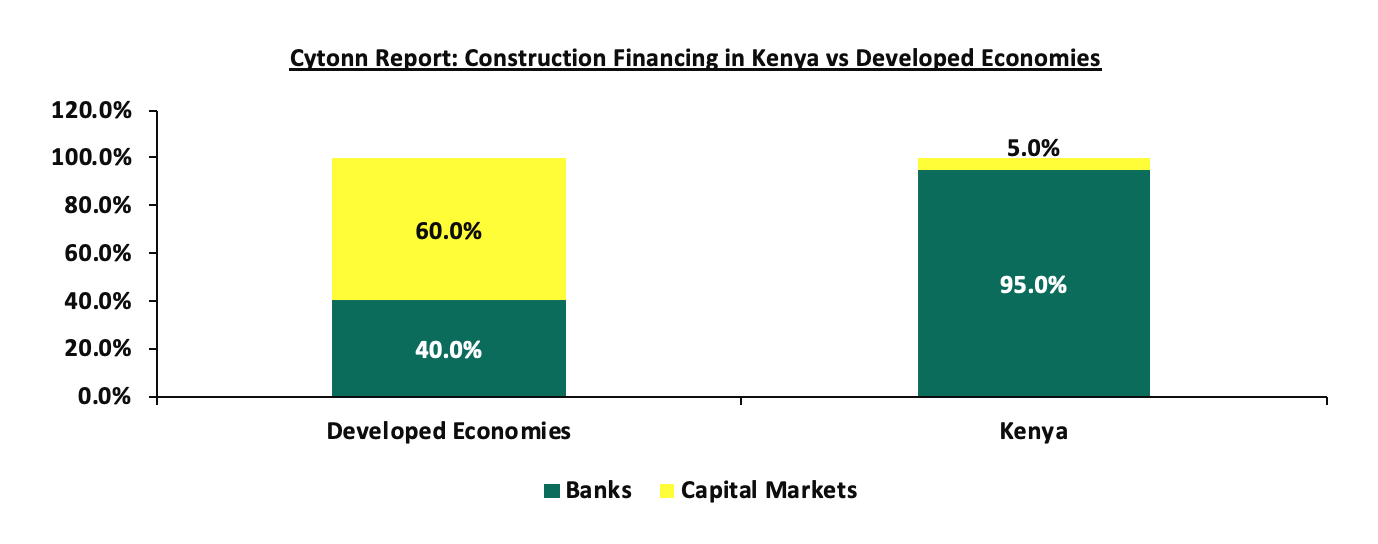
Sectoral Market Performance:
- Residential Sector
During Q1’2024, the NMA residential sector recorded a slight downturn in performance, with the average total returns coming in at 6.0%, a 0.1%-point decline from 6.1% recorded in Q1’2023. The performance was primarily attributed to a decrease in the residential average y/y price appreciation which came in at 0.6% in FY’2024, 0.5%-points lower than the 1.1% appreciation recorded in Q1’2023, mainly driven by reduced property transactions during the period under review. On the other hand, the average rental yield came in at 5.6% in Q1’2024, recording a 0.6%-points increase from the 5.0% rental yield recorded in Q1’2023. The table below shows the NMA residential sector’s performance during Q1’2024 and Q1’2023;
|
(All values in Kshs unless stated otherwise) |
|||||||||||
|
Cytonn Report: Nairobi Metropolitan Area (NMA) Residential Sector Summary - Q1’2024/Q1’2023 |
|||||||||||
|
Segment |
Average of Price per SQM Q1'2024 |
Average of Rent per SQM Q1'2024 |
Average of Rental Yield Q1'2024 |
Average of Price Appreciation Q1'2024 |
Average of Total Returns Q1'2024 |
Average of Rental Yield Q1'2023 |
Average of Price Appreciation Q1'2023 |
Average of Total Returns Q1'2023 |
y/y change in Rental Yield (% Points) |
y/y change in Price Appreciation (% Points) |
y/y change in Total Returns (% Points) |
|
Detached Units |
|||||||||||
|
High End |
203,337 |
886 |
5.0% |
0.8% |
5.8% |
4.4% |
1.4% |
5.8% |
0.6% |
(1.1%) |
(0.0%) |
|
Upper Middle |
147,146 |
643 |
4.8% |
0.6% |
5.4% |
4.5% |
1.1% |
5.6% |
0.3% |
(0.5%) |
(0.2% |
|
Lower Middle |
81,345 |
355 |
5.0% |
1.1% |
6.1% |
5.0% |
0.9% |
5.9% |
0.0% |
(0.1%) |
0.2% |
|
Detached Units Average |
143,943 |
671 |
5.0% |
0.6% |
5.6% |
4.7% |
1.1% |
5.8% |
0.6% |
(0.5%) |
(0.2%) |
|
Apartments |
|||||||||||
|
Upper Mid-End |
127,241 |
683 |
5.9% |
0.1% |
6.0% |
5.2% |
0.6% |
5.8% |
0.3% |
(0.5%) |
0.2% |
|
Lower Mid-End Suburbs |
91,904 |
483 |
5.7% |
0.8% |
6.5% |
5.3% |
1.0% |
6.6% |
0.3% |
(0.2%) |
(0.1%) |
|
Lower Mid-End Satellite Towns |
79,831 |
433 |
5.9% |
0.8% |
6.7% |
5.5% |
1.5% |
6.5% |
0.1% |
(0.7%) |
(0.4%) |
|
Apartments Average |
99,606 |
533 |
5.8% |
0.6% |
6.4% |
5.3% |
1.1% |
6.4% |
0.5% |
(0.5%) |
(0.0%) |
|
Residential Market Average |
121,775 |
602 |
5.6% |
0.6% |
6.0% |
5.0% |
1.1% |
6.1% |
0.6% |
(0.6%) |
(0.1%) |
- Detached Units Performance
The table below shows the NMA residential sector detached units’ performance during Q1’2024;
|
(All values in Kshs unless stated otherwise) |
||||||||
|
Cytonn Report: Residential Detached Units Summary Q1’2024 |
||||||||
|
Area |
Average of Price per SQM Q1'2024 |
Average of Rent per SQM Q1'2024 |
Average of Occupancy Q1'2024 |
Average of Uptake Q1'2024 |
Average of Annual Uptake Q1'2024 |
Average of Rental Yield Q1'2024 |
Average of Price Appreciation Q1'2024 |
Total Returns |
|
High End |
||||||||
|
Lower Kabete |
157,586 |
686 |
97.9% |
89.1% |
10.1% |
5.3% |
0.1% |
5.4% |
|
Runda |
233,160 |
1,047 |
95.2% |
96.7% |
8.9% |
5.2% |
0.2% |
5.4% |
|
Karen |
203,349 |
843 |
92.0% |
93.7% |
12.3% |
4.7% |
0.6% |
5.3% |
|
Kitisuru |
229,148 |
965 |
90.7% |
95.0% |
10.5% |
4.8% |
0.5% |
5.3% |
|
Rosslyn |
193,442 |
888 |
92.4% |
98.0% |
10.4% |
5.2% |
0.0% |
5.2% |
|
Average |
203,337 |
886 |
93.6% |
94.5% |
10.4% |
5.0% |
0.8% |
5.8% |
|
Upper Middle |
||||||||
|
Redhill & Sigona |
99,721 |
479 |
91.3% |
97.0% |
11.4% |
5.4% |
1.1% |
6.4% |
|
Lavington |
189,551 |
737 |
90.7% |
93.1% |
9.8% |
4.4% |
1.3% |
5.7% |
|
Ridgeways |
176,697 |
802 |
87.5% |
91.7% |
10.0% |
5.2% |
0.5% |
5.7% |
|
Loresho |
168,905 |
823 |
88.3% |
90.6% |
10.6% |
5.3% |
0.1% |
5.4% |
|
Runda Mumwe |
158,817 |
749 |
89.4% |
93.3% |
13.7% |
5.1% |
0.3% |
5.4% |
|
South B/C |
117,900 |
459 |
90.7% |
87.5% |
10.7% |
4.3% |
0.4% |
4.8% |
|
Langata |
118,431 |
450 |
91.1% |
87.1% |
8.0% |
4.3% |
0.3% |
4.6% |
|
Average |
147,146 |
643 |
89.8% |
91.5% |
10.6% |
4.8% |
0.6% |
5.4% |
|
Lower Middle |
||||||||
|
Ngong |
73,668 |
370 |
94.2% |
95.4% |
10.3% |
5.8% |
1.5% |
7.3% |
|
Syokimau/Mlolongo |
75,717 |
382 |
89.0% |
91.6% |
11.2% |
5.4% |
1.4% |
6.8% |
|
Ruiru |
68,275 |
348 |
87.4% |
83.7% |
10.4% |
5.7% |
1.0% |
6.7% |
|
Athi River |
86,206 |
431 |
87.2% |
93.3% |
9.7% |
5.2% |
1.4% |
6.6% |
|
Thika |
64,076 |
304 |
83.2% |
87.8% |
11.6% |
5.2% |
0.6% |
5.8% |
|
Juja |
101,718 |
303 |
90.4% |
93.3% |
13.7% |
4.1% |
1.5% |
5.6% |
|
Kitengela |
65,698 |
295 |
90.6% |
90.4% |
10.7% |
4.9% |
0.7% |
5.6% |
|
Rongai |
83,821 |
307 |
96.9% |
95.6% |
11.3% |
4.6% |
0.7% |
5.3% |
|
Donholm & Komarock |
95,656 |
402 |
88.6% |
87.1% |
9.6% |
4.6% |
0.6% |
5.2% |
|
Average |
81,345 |
355 |
90.5% |
91.3% |
10.9% |
5.0% |
1.1% |
6.1% |
|
Detached Grand Average |
143,943 |
628 |
91.3% |
92.4% |
10.6% |
5.0% |
0.6% |
5.6% |
Source: Cytonn Research
The Key take-outs from the table include;
- Average Total Returns - The average total returns came in at 5.6%, translating to 0.2% points decrease from the 5.8% recorded in Q1’2023. However, rental yields came in at 5.6%, representing a 0.9%-point increase from the 4.7% recorded in Q1’2023. The improved performance is attributable to an increase in selling and rental prices per SQM at Kshs 143,943 and Kshs 628, respectively, from Kshs 137,743 and Kshs 550, respectively recorded in Q1’2023,
- Segment Performance- The best performing segment was the lower-middle segment with an average total return of 6.1%, attributable to relatively high rental yields of 5.0%, which is driven by returns from well-performing nodes such as Ngong and Syokimau/Mlolongo which posted relatively high returns at 7.3% and 6.8% respectively, and,
- Nodal Performance – Overall, Ngong was the best-performing node, offering the highest returns at 7.3%, 1.2% points higher than the detached market average of 6.1%, driven by a relatively high y/y price appreciation of 1.5%. The node is witnessing major development supported to its close proximity to the CBD and enhanced connectivity via Ngong Road. Syokimau/Mlolongo followed with an average total return of 6.8%, 0.7% points higher than the detached market average of 5.8%.
- Apartments Performance
The table below shows the NMA residential sector apartments’ performance during Q1’2024;
|
All values in Kshs unless stated otherwise |
||||||||
|
Cytonn Report: Residential Apartments Summary Q1'2024 |
||||||||
|
Area |
Average of Price per SQM Q1'2024 |
Average of Rent per SQM Q1'2024 |
Average of Occupancy Q1'2024 |
Average of Uptake Q1'2024 |
Average of Annual Uptake Q1'2024 |
Average of Rental Yield Q1'2024 |
Average of Price Appreciation Q1'2024 |
Total Returns |
|
Upper Mid-End |
||||||||
|
Westlands |
161,556 |
889 |
91.6% |
90.5% |
15.8% |
6.3% |
0.5% |
6.8% |
|
Kileleshwa |
129,952 |
733 |
89.6% |
92.9% |
11.3% |
6.1% |
0.0% |
6.2% |
|
Kilimani |
107,855 |
644 |
88.2% |
92.0% |
15.5% |
6.3% |
(0.2%) |
6.2% |
|
Parklands |
121,932 |
631 |
92.3% |
94.5% |
11.0% |
5.8% |
0.3% |
6.1% |
|
Loresho |
124,054 |
535 |
90.5% |
98.5% |
8.7% |
4.7% |
1.0% |
5.7% |
|
Upperhill |
118,095 |
668 |
86.7% |
90.0% |
10.9% |
6.1% |
(0.8%) |
5.2% |
|
Average |
127,241 |
683 |
89.8% |
93.1% |
12.2% |
5.9% |
0.1% |
6.0% |
|
Lower Mid-End Suburbs |
||||||||
|
Race Course/ Lenana |
100,158 |
588 |
86.0% |
92.7% |
13.6% |
6.1% |
5.2% |
11.2% |
|
South C |
116,364 |
669 |
90.6% |
91.7% |
13.4% |
6.5% |
0.3% |
6.7% |
|
Waiyaki Way |
91,354 |
497 |
86.9% |
89.7% |
14.2% |
6.1% |
0.2% |
6.3% |
|
Dagoretti |
84,571 |
432 |
89.3% |
81.4% |
9.3% |
5.3% |
0.6% |
5.9% |
|
South B |
113,583 |
542 |
93.0% |
97.8% |
13.1% |
5.4% |
0.4% |
5.9% |
|
Donholm & Komarock |
77,285 |
389 |
93.8% |
92.4% |
9.6% |
5.7% |
0.0% |
5.7% |
|
Imara Daima |
72,126 |
354 |
86.4% |
88.9% |
8.2% |
5.3% |
0.3% |
5.5% |
|
Kahawa West |
71,104 |
360 |
93.5% |
91.6% |
5.8% |
5.6% |
0.0% |
5.5% |
|
Langata |
100,587 |
518 |
85.9% |
89.5% |
9.6% |
5.3% |
0.2% |
5.5% |
|
Average |
91,904 |
483 |
89.5% |
90.6% |
10.7% |
5.7% |
0.8% |
6.5% |
|
Lower Mid-End Satellite Towns |
||||||||
|
Athi River |
61,754 |
421 |
91.4% |
94.5% |
9.4% |
7.4% |
1.3% |
8.7% |
|
Thindigua |
104,142 |
554 |
90.4% |
88.3% |
13.2% |
5.9% |
1.1% |
7.0% |
|
Ngong |
72,992 |
381 |
85.9% |
88.4% |
11.0% |
5.7% |
1.0% |
6.7% |
|
Rongai |
55,887 |
318 |
86.7% |
87.4% |
14.6% |
6.1% |
0.5% |
6.6% |
|
Ruaka |
104,663 |
537 |
90.1% |
86.0% |
12.7% |
5.2% |
1.1% |
6.4% |
|
Ruiru |
88,872 |
479 |
88.6% |
85.2% |
12.6% |
5.7% |
0.5% |
6.2% |
|
Syokimau |
67,491 |
340 |
87.3% |
90.8% |
9.8% |
5.4% |
0.7% |
6.1% |
|
Kikuyu |
82,849 |
432 |
91.0% |
95.5% |
15.0% |
5.7% |
0.2% |
5.9% |
|
Average |
79,831 |
433 |
88.9% |
89.5% |
12.3% |
5.9% |
0.8% |
6.7% |
|
Apartment Grand Average |
99,659 |
533 |
89.4% |
91.1% |
11.7% |
5.8% |
0.6% |
6.4% |
Source: Cytonn Research
The key take-outs from the table include;
- Average Total Returns – The average total return came in at 6.4%, relatively unchanged from Q1’2023. In Q1’2024 the average selling and rental prices remained stable at Kshs 99,650 per SQM and Kshs 533 per SQM respectively, from Kshs 100,550 per SQM and Kshs 533 per SQM recorded in Q1’2023 respectively. Average rental yields came in at 5.8%, 0.4% higher than the 5.4% recorded in Q1’2023 driven by a 1.3% increase in occupancy to 88.9% in Q1’2024, from 87.6% recorded in Q1’2023,
- Segment Performance – The best performing segment was the lower mid-end satellite towns with average total return of 6.7%, attributed to an average rental yield of 5.9% and a relatively high price appreciation of 0.8%. The segment's performance is boosted by nodes such as Athi River and Thindigua, which have become highly attractive for investment, and,
- Nodal Performance – Athi River was the best performing node with total average returns of 8.7%, attributable to a relatively high rental yield of 7.4% and y/y price appreciation of 1.3%. The nodes performance is attributable to enhanced accessibility by the Mombasa Road, presence of Malls such as Coloho Mall and Great Wall Gardens, enhanced proximity to JKIA and a growing middle class in the area driving the demand of housing. Thindigua and Ngong followed closely, offering investors average total returns of 7.0% and 6.7% respectively, compared to the apartments market average of 6.7%.
For notable highlights during the quarter, please see our Cytonn Monthly - January 2024 and Cytonn Monthly - February 2024. For the month of March;
- Kiambu County initiated a Kshs 1.0 bn infrastructure development plan aimed at upgrading slums as part of phase two of the Kenya Informal Settlement Improvement Project (KISIP). This initiative will be carried out through a partnership with the State Department of Housing and Urban Development. Additionally, President William Ruto laid the foundation for the Talai Ainamoi Affordable Housing Project in Ainamoi Constituency, Kericho County. The project will be constructed on a 5-acre piece of land in the first phase and will incorporate 320 housing units. For more information, please see our Cytonn Weekly #11/2024, and,
- President William Ruto presided over the ground breaking of 6,704 Affordable Housing units situated on 22.4-acre parcels of land in Ziwani, Starehe. For more information, please see our Cytonn Weekly #10/2024
We have a NEUTRAL outlook for the NMA residential sector, as we anticipate heightened activities by industry players. We expect the sector to be supported by: i) government initiatives in the residential sector, especially through the Affordable Housing Agenda, ii) increased activities by industry players, iii) demand for housing driven by the growing population and high urbanization rate, and iv) infrastructure development activities by the government. On the other hand, sector growth continues to be constrained by the increased cost of construction, a challenging macroeconomic environment, and limited financing options for developers.
- Commercial Office Sector
The table below highlights the performance of the Nairobi Metropolitan Area (NMA) Commercial Office sector over time;
|
Cytonn Report: Nairobi Metropolitan Area (NMA) Commercial Office Returns Over Time |
||||||
|
Year |
Q1'2023 |
H1'2023 |
Q3'2023 |
FY'2023 |
Q1'2024 |
∆ Q1'2023/Q1'2024 |
|
Occupancy % |
79.8% |
80.8% |
79.9% |
80.3% |
80.1% |
0.3% |
|
Asking Rents (Kshs/SQFT) |
97 |
98 |
100 |
103 |
103 |
6.0% |
|
Average Prices (Kshs/SQFT) |
12,238 |
12,238 |
12,265 |
12,673 |
12,665 |
3.4% |
|
Average Rental Yields (%) |
7.6% |
7.9% |
7.7% |
7.7% |
7.6% |
0.0% |
Source: Cytonn Research
- Average Asking Rents – In Q1’2024, average asking rents per SQFT in the NMA increased by 6.0% to Kshs 103 per SQFT from Kshs 97 in Q1’2023. The increase was driven by a rise in the supply of grade A offices such as The Cube, Karen Green, The Piano, Principal Place among others ultimately pushing the asking prices higher. Additionally, landlords continue to hedge against the Kenyan Shilling, which had significantly depreciated against the US dollar especially in 2023. On a quarter-on-quarter (q/q) basis, the performance remained quite unchanged. This can be attributed to the performance of the Kenyan Shilling, which has begun gaining ground against the US dollar,
- Average Occupancy Rate – In Q1’2024 commercial office occupancy increased by 0.3% points to 80.1% from 79.8% recorded in Q1’2023. On q/q basis, occupancy decreased marginally by 0.2%. On y/y basis the increase in occupancy can be linked to the decline in supply of office in the area witnessed in 2023. However, in q/q basis the slight decrease can be attributed to the increased demand in serviced offices, where some businesses prefer leasing short-term offices rather than buying an entire office space, and,
- Average Rental Yield – The average rental yield remained stable on y/y basis. On q/q basis the performances declined slightly due to the marginal decrease in occupancy.
For submarket performance, Westlands stood out as the best performing, boasting an average rental yield of 8.5% in FY’2023, compared to the market average of 7.6%. Gigiri and Karen followed closely, with rental yields of 8.2% and 8.0%, respectively. We attribute this performance to several factors: i) a high concentration of Grade A offices in the areas, ii) robust infrastructure developments such as roads, iii) close proximity to residential areas, iv) increasing demand for high quality offices supported by embassies, international organizations, and multinational companies in the areas, and, v) the presence of after-work amenities such as hotels and quality social venues. On the other hand, Mombasa Road was the least performing node with an average rental yield of 6.0% in Q1’2024, 1.6% points lower than the market average of 7.6%, the performance can be attributed to; i) its reputation as an industrial center diminishes its appeal to office businesses, ii) intense competition from other neighbourhoods like the CBD and Upperhill, and, iii) offices of relatively lower quality, which are perceived as less attractive and thus command lower rents. The table below displays the performance of sub-markets in the Nairobi Metropolitan Area (NMA);
|
All values in Kshs unless stated otherwise |
|||||||||||
|
Cytonn Report: NMA Commercial Office Submarket Performance Q1'2024 |
|||||||||||
|
Area |
Price/SQFT Q1'2024 |
Rent/SQFT Q1'2024 |
Occupancy Q1'2024 |
Rental Yields Q1'2024 |
Price/SQFT Q1'2023 |
Rent/SQFT Q1'2023 |
Occupancy Q1'2023 |
Rental Yields Q1'2023 |
∆ in Rent |
∆ in Occupancy (% points) |
∆ in Rental Yields (% points) |
|
Westlands |
12,495 |
118 |
76.3% |
8.5% |
12032 |
108 |
77.2% |
8.4% |
9.6% |
-0.9% |
0.1% |
|
Gigiri |
15,000 |
128 |
80.2% |
8.2% |
13,500 |
118 |
81.6% |
8.7% |
8.5% |
-1.4% |
-0.5% |
|
Karen |
14,254 |
118 |
80.5% |
8.0% |
13,431 |
111 |
82.9% |
8.3% |
6.3% |
-2.5% |
-0.3% |
|
Parklands |
11,875 |
92 |
84.0% |
7.8% |
11,662 |
91 |
82.2% |
7.8% |
1.0% |
1.8% |
0.1% |
|
Kilimani |
13,051 |
100 |
83.2% |
7.8% |
12,260 |
93 |
84.1% |
7.8% |
7.2% |
-0.9% |
0.0% |
|
Nairobi CBD |
12,029 |
89 |
85.6% |
7.6% |
11,971 |
83 |
85.3% |
7.2% |
8.0% |
0.3% |
0.4% |
|
Upperhill |
13,014 |
100 |
72.9% |
6.3% |
12,605 |
97 |
76.6% |
7.0% |
3.6% |
-3.6% |
-0.7% |
|
Thika Road |
12,571 |
79 |
80.4% |
6.0% |
12,571 |
79 |
80.3% |
6.0% |
0.0% |
0.1% |
0.0% |
|
Mombasa Road |
11,325 |
79 |
72.2% |
6.0% |
11,325 |
71 |
67.0% |
5.2% |
10.1% |
5.2% |
0.8% |
|
Average |
12,665 |
103 |
80.1% |
7.6% |
12,238 |
97 |
79.8% |
7.6% |
6.0% |
0.3% |
0.0% |
Source: Cytonn Research
Our outlook for the NMA commercial office sector remains NEUTRAL, driven by factors such as i) a rising presence of multinational corporations in the country, is expected to enhance occupancy rates, ii) the increasing trend of co-working spaces, and, iii) a decrease in developments witnessed in 2023, which we predict will help alleviate the current oversupply issue.However, the sector’s performance will be limited by the persistent oversupply of office space totalling 5.8 mn SQFT in the NMA. Investment opportunity lies in Westlands, Gigiri and Karen offering relatively higher returns compared to the market average.
- Retail Sector
The table below shows the performance of the retail sector performance in the Nairobi Metropolitan Area from Q1’2023 to Q1’2024;
|
(All values in Kshs unless stated otherwise) |
||||||
|
Cytonn Report: Summary of Retail Sector Performance in Nairobi Metropolitan Area Q1’2023 - Q1’2024 |
||||||
|
Item |
Q1’2023 |
H1’2023 |
Q3'2023 |
FY'2023 |
Q1’2024 |
∆ Y/Y 2024 |
|
Average Asking Rents (Kshs/SQFT) |
176 |
177 |
182 |
182 |
180 |
2.3% |
|
Average Occupancy (%) |
78.0% |
79.2% |
78.7% |
79.8% |
79.3% |
1.3% |
|
Average Rental Yields |
8.0% |
8.2% |
8.2% |
8.3% |
8.1% |
0.1% |
Source: Cytonn Research
The key take-outs from the table include;
- Average Occupancy Rate - In Q1’2024, the retail sector witnessed a notable uptick in average occupancy rates, increasing by 1.3%-points to reach 79.3%, compared to the 78.0% recorded in the same period of 2023. This surge can be attributed to several key factors: i) vigorous expansion endeavors undertaken by both domestic and international retailers such as Naivas, Jaza Stores, QuickMart, Carrefour, and Panda Mart, ii) emergence of new shopping complexes like Business Bay Square (BBS) Mall in Eastleigh, which have attracted a wave of smaller retailers, thereby filling crucial retail spaces, iii) sustained demand for consumer goods and services, buoyed by favorable demographic trends, iv) adaptation to evolving market dynamics, exemplified by initiatives like Jaza Stores and Carrefour allowing purchases to be made online via platforms like Whatsapp, aligning with shifting consumer preferences, and, v) ongoing improvements in infrastructure not only bolstering existing retail spaces but also unlocking new regions for retail growth opportunities, thus broadening the scope of the sector's expansion,
- Asking Rents - In Q1’2024, there was a notable surge in average rental rates per SQFT, climbing by 2.3% to Kshs 180, up from Kshs 176 in Q1’2023. This sharp increase was driven by several key factors: i) the introduction of premium retail spaces like the Global Trade Centre (GTC) mall and Business Bay Square (BBS) Mall, which commanded higher rents due to their top-tier offerings, ii) continued demand for premium retail spaces in strategic areas within the Nairobi Metropolitan Area (NMA), such as Karen, Kilimani, Westlands, and along Kiambu and Limuru roads. These locations, known for their quality offerings, attracted both local and foreign businesses seeking proximity to multinational organizations and embassies, serving an international clientele, iii) the entry of renowned global brands like Adidas, Puma, Michael Kors, and Aldo into the Kenyan market, competing for prime retail spaces and further driving up rental rates, and, iv) property owners in sought-after locations opting for rental transactions quoted in dollars, amidst the depreciation of the Kenyan currency against the dollar in 2023. This shift to dollar-denominated rents has contributed significantly to the escalation in rental prices across these regions, fuelled by the amalgamation of foreign business interest and currency dynamics, and,
- Average Rental Yield- The average rental yield for the NMA retail sector improved by 0.1%-points to 8.1% in Q1’2024, from 8.0% in Q1’2023, as a result of improved asking rents and occupancy rates.
In terms of sub-market performance, Kilimani, Karen, and Kiambu Road & Limuru Road demonstrated impressive average rental yields of 9.5%, 9.0%, and 8.9% respectively, outpacing the overall market average of 8.1%. This strong performance was largely driven by the increased demand for retail offerings in the above locations, as well as the presence of top-tier retail spaces commanding higher rents, coupled with the provision of quality infrastructure services enhancing the attractiveness for both tenants and customers. Conversely, retail spaces in Eastlands reported the lowest average rental yield at 6.4%, influenced by several factors: i) rental rates significantly below the market average of Kshs 180 per SQFT, standing at Kshs 146 per SQFT resulting from the presence of lower quality spaces in the region, ii) inadequate infrastructure across most towns within the region, hindering accessibility and sustainability for retail spaces, and, iii) the prevalence of informal retail spaces and service stations, offering competitive rates and diverse amenities, intensifying market competition and impacting demand. However, it is noteworthy that Eastlands experienced a remarkable surge in rental rates, recording a substantial 15.0% increase from Kshs 127 in Q1’2023, surpassing the market average growth rate of 4.0%. This surge can be attributed to the addition of prime high-quality space commanding premium rents, such as the Business Bay Square (BBS) Mall. BBS Mall, currently the largest mall in East and Central Africa, offers 130,000 SQM of modern, high-quality spaces, contributing significantly to the region's retail landscape.
Furthermore, a notable shift in occupancy rates has been particularly pronounced in Eastlands, witnessing a significant 7.6% increase compared to the market average of 1.4%. This notable uptick is primarily driven by evolving consumer preferences and the burgeoning population in these areas, prompting retailers to expand their footprint beyond the city center and explore opportunities in Eastlands. This strategic expansion aims to offer convenience to local residents in the most accessible manner possible. Augmenting this surge in occupancy rates, rental rates in Eastlands are positioned below market averages at Kshs 146, in contrast to the market average of Kshs 180. This intentional adjustment serves as a strategic move to attract a wider clientele base by providing more affordable options, particularly considering the heightened demand for consumer goods, diverse services, and entertainment facilities in these rapidly developing locales. The following table illustrates the submarket performance of nodes within the Nairobi Metropolitan Area (NMA) in Q1’2024;
|
(All values in Kshs unless stated otherwise) |
|||||||||
|
Cytonn Report: Nairobi Metropolitan Area Retail Market Performance Q1’2024 |
|||||||||
|
Area |
Rent Kshs/SQFT Q1’2024 |
Occupancy% Q1’2024 |
Rental Yield Q1’2024 |
Rent Kshs/SQFT Q1’2023 |
Occupancy% Q1’2023 |
Rental Yield Q1’2023 |
∆ in Rental Rates |
∆ in Occupancy (% points) |
Q1’2024 ∆ in Rental Yield (% points) |
|
Kilimani |
198 |
80.0% |
9.5% |
187 |
84.2% |
9.8% |
5.7% |
(4.2%) |
(0.3%) |
|
Karen |
218 |
81.0% |
9.0% |
216 |
80.6% |
9.5% |
1.0% |
0.4% |
(0.5%) |
|
Kiambu road & Limuru Road |
205 |
74.3% |
8.9% |
202 |
72.8% |
8.6% |
1.5% |
1.5% |
0.3% |
|
Westlands |
213 |
80.2% |
8.8% |
215 |
76.6% |
8.9% |
(1.0%) |
3.6% |
(0.1%) |
|
Ngong Road |
181 |
82.1% |
8.5% |
170 |
81.0% |
7.8% |
6.3% |
1.1% |
0.7% |
|
Mombasa road |
169 |
78.0% |
8.0% |
154 |
79.4% |
7.4% |
9.5% |
(1.4%) |
0.6% |
|
Thika Road |
155 |
82.2% |
7.2% |
165 |
78.7% |
7.3% |
(5.8%) |
3.5% |
(0.1%) |
|
Satellite towns |
139 |
80.0% |
6.8% |
134 |
74.6% |
6.2% |
3.7% |
5.4% |
0.6% |
|
Eastlands |
146 |
77.7% |
6.4% |
127 |
75.1% |
5.9% |
15.0% |
2.6% |
0.5% |
|
Average |
180 |
79.3% |
8.1% |
176 |
78.0% |
8.0% |
4.0% |
1.3% |
0.2% |
Source: Cytonn Research
For notable highlights during the quarter;
- Naivas Supermarket, a local retailer, opened its most recent store in the Survey area, situated along Thika Road, bringing its total number of outlets countrywide to 103. For more information, please see our Cytonn Monthly – February 2024,
- Local retailer and budget supermarket chain Jaza opened two outlets, bringing its total number of stores countrywide to 6. The newly opened outlets are located in Chokaa in Embakasi and Gachie in Kiambu respectively. For more information, please see our Cytonn Monthly - January 2024,
- Naivas Supermarket opened its latest outlet located at Mwanzi Road in Westlands, Nairobi. This new addition brings the retailer's total number of outlets in the country to 102. For more information, please see our Cytonn 2024 Markets Outlook, and,
- Global retailer Panda Mart opened its first outlet in Kenya at Garden City Mall in Nairobi. The retailer invested about USD 7.0 mn (Kshs 1.1 bn) to set up the outlet, acquiring 8,956 SQM within the mall. For more information, please see our Cytonn 2024 Markets Outlook.
We maintain a NEUTRAL outlook on the retail sector’s performance, which is anticipated to be influenced by several key drivers: i) ccontinued aggressive expansion efforts by both local and foreign retailers, as they seek to secure new and existing spaces to capitalize on evolving consumer preferences and market dynamics, ii) oongoing advancements in public infrastructure, including road and railway projects, are expected to enhance accessibility to new areas for retail investments, stimulating further growth opportunities, and, iii) ppositive demographic trends, characterized by a growing population, are anticipated to underpin increasing demand for retail goods and services. However, the sector's growth momentum may face headwinds from certain negative factors, including: i) existing oversupply, with approximately 3.0 mn SQFT of retail space in the Nairobi Metropolitan Area (NMA) and an additional 1.7 mn SQFT across the Kenyan retail sector, posing challenges in achieving optimal occupancy rates and rental yields, ii) escalating adoption of e-commerce by retailers, which continues to erode traditional occupier demand for physical retail spaces, necessitating innovative strategies to adapt to changing consumer shopping habits, and, iii) limited access to and expensive financing from financial institutions for retail developments, coupled with the imperative for small and medium-sized enterprises (SMEs) to invest in technological advancements to enhance operational efficiency and competitiveness in the market.
- Hospitality Sector
During Q1’2024, one Industry Report related to the Hospitality sector was released, namely;
|
Cytonn Report: Released Industry Report related to Hospitality Sector Q1’2024 |
||
|
# |
Report |
Key Take-outs |
|
1 |
The Leading Economic Indicators (LEI) January 2024 Report by National Bureau of Statistics (KNBS) |
|
Source; Cytonn Research
Weekly Highlights:
- Launching of JW Marriott Hotel, Nairobi
During the week, JW Marriott an International luxury hotel brand opened JW Marriott Nairobi, marking its second property in Kenya after JW Marriott Masai Mara Lodge opened in February 2023. The hotel which is located in GTC building Westlands, stands as the tallest hotel in the country with 35 stories. The hotel also features 315 sophisticated guestrooms, five internationally-inspired dining destinations, a luxury Spa by JW, swimming pool, fitness center, and eight exceptional event spaces for gatherings and celebrations. An additional 51 spacious serviced apartments and a sky bar & lounge are slated to open later in the year.
President Ruto, while attending the opening ceremony noted that Meetings, Incentives, Conferences, and Exhibitions (MICE) have registered a massive expansion as more delegates visit the country for events such as the Kenya Business Forum, Africa Climate Summit, East African Tourism Expo, Magical Travel Kenya Expo, United Nations Habitat Assembly on Urban Development Agenda, and United Nations Environment Assembly. Additionally, some government projects underway were revealed, including a 1200-bed capacity conference center at Bomas of Kenya and the construction of a convention center by the Nairobi City government at Green Park.
The hotel is poised to; i) draw more opportunities for the City’s conferencing with its eight events spaces with a grand ballroom hosting upto 800 guests, and, ii) promote Meetings Incentives Conferences and Events (MICE) tourism within the city. We anticipate that the development of the conference and convention centres will serve as a pivotal step in closing the gap between the demand for top-notch conference facilities and their availability in Nairobi. Moreover, this initiative will further elevate Nairobi, Kenya as a central hub for meetings and business activities.
- Hotel Chain Development Pipelines in Africa 2024 Report
During the week, W Hospitality Group released the Hotel Chain Development Pipelines in Africa 2024 Report, compiling data from 47 regional and international hotel chains. Key highlights from the report included;
- African hotel chain development pipelines now total 524 hotels and resorts with 92,193 rooms, a 9.2% increase from 482 hotels with 84,427 rooms registered in the pipeline in 2023. This total was analyzed according to two main regions, which are North Africa accounting for five countries – Morocco, Algeria, Tunisia, Libya, and Egypt, and Sub-Saharan Africa accounting for 49 countries, including the Indian Ocean islands. Notably, the pipeline for Sub-Saharan Africa recorded a 9.0% increase to 52,059 rooms in 2024, from 47,750 rooms in 2023,
- Kenya was ranked seventh highest in the continent by number of planned rooms, with 31 hotels and 4,268 rooms in the pipeline. This was a 14.5% increase from 2023, when Kenya registered 25 hotels and 3,729 rooms in the pipeline and was ranked position five in the continent, and,
- Additionally, Nairobi was ranked the fifth-highest city with anticipated additions to supply, with 18 hotels and 3,145 rooms expected to open in 2023. This is a 0.5% decrease from 17 hotels with a total of 3161 rooms in the pipeline in 2023.
The graph below highlights the number of new hotels and hotel rooms in the pipeline in the top ten countries and cities in the African continent;
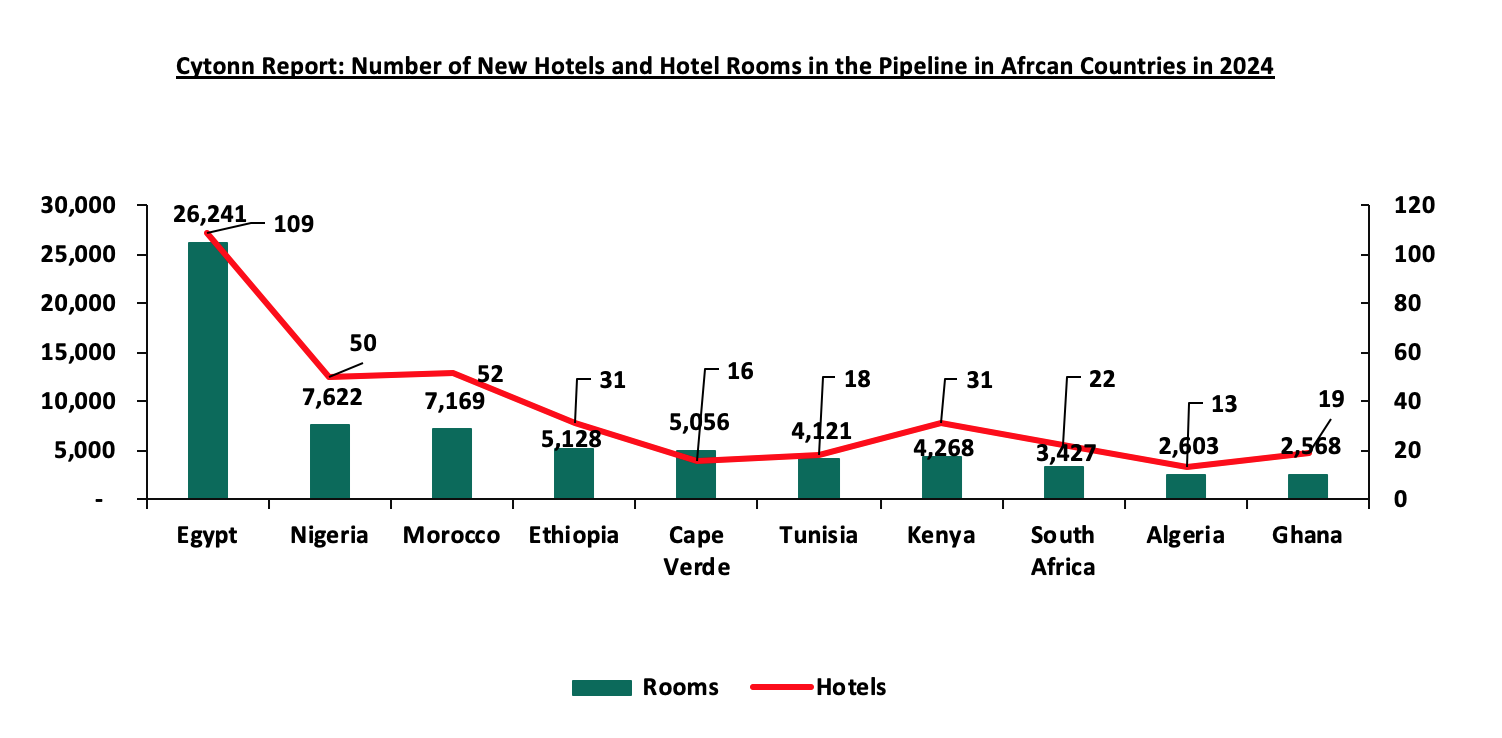
Source: Hotels Chains Pipeline Development in Africa 2024
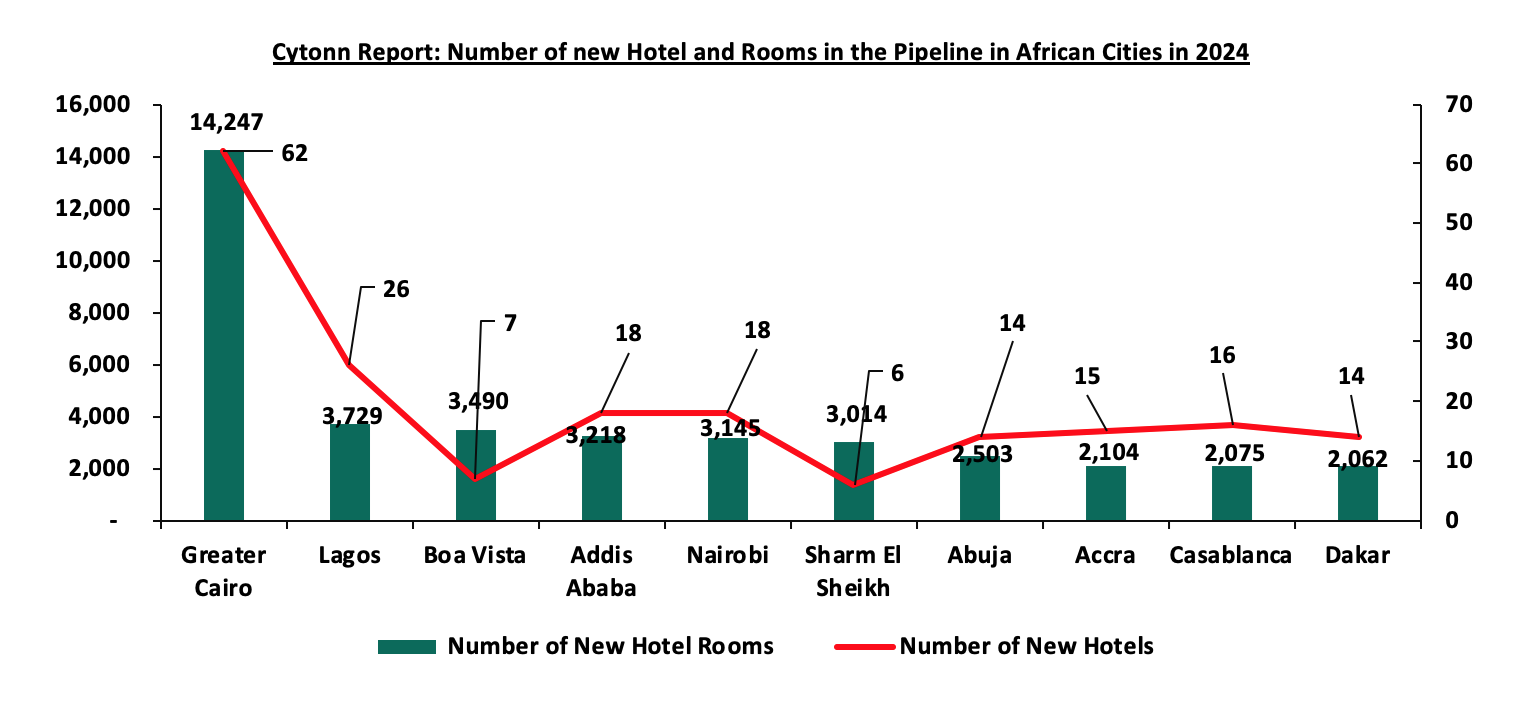
Source: Hotels Chains Pipeline Development in Africa 2024
The region has witnessed a surge in the number hotels and hotel rooms in the pipeline on the back of recovery from effects of COVID-19 pandemic, political stability and renewed investor confidence. We expect the sector to experience more growth during the year driven by; i) increased number of tourists arrivals in the country, ii) global recognition of Nairobi as a major tourists hub by Lonely planet which ranked Nairobi as the top City to Visit in 2024 ousting major destinations such as Paris, iii) activities such as Annual World Rally Championship (WRC) in Naivasha, iv) promotion of regional tourism expected to enhance performance of the African market, v) development of niche products such as cruise tourism, adventure tourism, culture and sports tourism, and, vi) governments initiative to end visa requirements to all visitors.
- Infrastructure Sector
For notable highlights during Q1’2024 please see our Cytonn Monthly - February 2024 and Cytonn Monthly - January 2024. For the month of March;
- President William Ruto launched several projects in Bomet and Kericho Counties aimed at enhancing connectivity and transportation. In Bomet County, construction works commenced for the rehabilitation and upgrading of 10-Km of Bomet Town Roads. Additionally, President William Ruto launched the construction works for the upgrading and maintenance of Longisa-Sigor and Kyongong-Sigor Roads in Bomet County. In neighbouring Kericho County, the President initiated the construction works for the upgrading of Kapsuser-Sosiot (9.2 Km) and Kapsuser-Kipsolu (3.8 Km) roads. For more information, please see our Cytonn Weekly #12/2024.
We expect the infrastructure sector in Kenya will continue to play a crucial role in promoting economic activities, supported by the government's commitment to: i) construct and rehabilitate essential infrastructure such as roads, bridges, railways, airports, and affordable housing units, ii) strengthen diplomatic ties and partnerships with neighbouring nations to foster mutual development, iii) intensify efforts to attract regional and international investors, positioning Kenya competitively within the East African region, particularly through railway connections and port infrastructure. Upon their completion, these projects are poised to unlock new areas for penetration of real estate investments across various subsectors, generating fresh opportunities and stimulating demand for properties, goods, and services. However, recent budgetary adjustments, including cuts to the State Department for Housing and a reduction in the country's overall development expenditure, may pose challenges to the sector's optimal performance. According to the Supplementary Budget FY’2023/24, the allocation to the State Department of Roads decreased by 8.3% to Kshs 230.1 billion from Kshs 250.8 billion. This reduction was attributed to fund reallocation to other priority sectors such as education and addressing escalating costs associated with debt repayment, exacerbated by the depreciation of the Kenyan Shilling. These budgetary shifts may impact the pace and scope of infrastructure development, potentially affecting the real estate sector's growth trajectory in the near term.
- Industrial Sector
Notable highlights in the quarter include;
- President William Ruto witnessed the signing of a Memorandum of Understanding (MoU) between Kenya and the United Arab Emirates to develop a 1-Gigawatt (GW) data centre that is powered by geothermal energy. In the partnership deal, Kenya's EcoCloud, a leading provider of data centre solutions and the first-ever green data centre in Africa powered entirely by geothermal energy, and UAE's G42 will develop a robust digital infrastructure and ecosystem. For more information, see Cytonn Weekly #10/2024,.
- Airtel Africa announced plans to build a data centre in Nairobi, which will become its second facility in Africa after Nigeria in a move to diversify its revenue streams. The data centre in Nairobi will be mainly usable in the telecommunication sector as well as in other sectors. Additionally, the centre will have a capacity of 7.0 megawatts to trail the 36-megawatt centre that it plans to build in Lagos, Nigeria. For more information, see Cytonn Weekly #7/2024, and,
- The International Finance Corporation (IFC) announced its plans to lend Kshs 4.8 bn (USD 30.0 mn) to Bora Africa, a REIT-like investment vehicle focused on investing in industrial properties and real estate assets in Kenya and Africa. Bora Africa, is a special purpose vehicle of the Mauritian based firm Grit Real Estate Income Group and aims to utilize the IFC funds to expand its project pipeline, further enhancing its presence in the industrial real estate market on the continent. For more information, see Cytonn Weekly #06/2024.
We maintain a POSITIVE outlook for the sector. Going forward, we expect the sector to continue on an upward trajectory driven by: i) the rising demand for data centers in the country, ii) an increasing demand for cold rooms, especially in the Nairobi Metropolitan Area, iii) demand for quality warehouses due to the growing ecommerce business in the country, iv) support from the government, as evidenced by the establishment of Special Economic Zones (SEZ) and Export Processing Zones (EPZ), v) increased development activities by industry players such as ALP Africa Logistics, vi) Kenya’s continued recognition as a regional hub, hence attracting international investors, and, vii) efforts by the government to support agricultural and horticultural products in the international market.
- Land Sector
The average selling prices for land in the Nairobi Metropolitan Area (NMA) in Q1’2024 recorded a capital appreciation of 4.3% to Kshs 133.7 mn, from Kshs 130.4 mn recorded in Q1’2023. The performance was supported by;
- Positive demographics driving demand for land facilitated by high population and urbanization growth rates of 1.9% and 3.7%, above the global averages of 0.9% and 1.6% respectively,
- Improved development of infrastructure such as roads, railways, water and sewer lines which has improved and opened up areas for investment, ultimately increasing property prices,
- Growth in popularity of satellite towns by investors and buyers which provide affordable land options in comparison to the suburbs and key commercial zones,
- Increased construction activities particularly in the residential sector driven by the government’s affordable housing agenda thus boosting demand for land,
- Limited supply of land especially in urban areas which has contributed to rising land prices,
- Rising middle-income class population with more disposable income to invest, and,
- Land is the most preferred choice of investment among a majority of people which further drives up demand for land.
Overall Performance: Un-serviced land in the satellite towns of Nairobi recorded the highest y/y capital appreciation of 8.2% mainly due to; i) the areas improved accessibility benefitting from infrastructural developments such as the Nairobi Expressway, the expansion of the Eastern Bypass, and Nairobi Western Bypass, ii) affordability of land prices attracting both buyers and investors, and, iii) high land prices within Nairobi commercial and suburb zones. Notably, average land prices per acre in Nairobi commercial zones registered significant price corrections owing to their high prices weighing down on the average selling prices. The table below shows the overall performance of the sector across all land sub-sectors during Q1’2024;
|
All values in Kshs unless stated otherwise |
|||
|
Cytonn Report: Summary of the Performance Across All regions Q1’2023/Q1’2024 |
|||
|
Q1'2023 |
Q1'2024 |
Annualized Capital Appreciation |
|
|
Un-serviced land-satellite Towns |
14.5 mn |
15.6 mn |
8.2% |
|
Serviced land-Satellite Towns |
18.1 mn |
19.1 mn |
4.7% |
|
Nairobi Suburbs- High Rise Residential Areas |
79.4 mn |
82.2 mn |
3.7% |
|
Nairobi Suburbs (Low Rise & High Residential Areas) |
136.4 mn |
137.3 mn |
2.1% |
|
Nairobi Suburbs- Commercial Areas |
403.4 mn |
414.1 mn |
(2.8%) |
|
Average |
130.4 mn |
133.7 mn |
4.3% |
Source: Cytonn Research
Sub-markets Performance - For the satellite areas, Juja, Rongai and Athi River were the best performing nodes both with 9.2%, 8.9% and 8.8% year-on-year (y/y) capital appreciations owing to: i) good infrastructure connectivity promoting accessibility in the areas, ii) availability of amenities such as malls, schools which appeal to families, and, iii) high concentration of learning institutions around and within the areas necessitating demand land for development of student housing particularly in Juja and Rongai areas. For Nairobi commercial zones, recorded a 2.8% price correction mainly on the back of weakened demand owing to high land prices. The average asking prices per acre coming in at Kshs 414.1 mn, which is significantly higher than the market average of Kshs 133.7 mn. Furthermore, these areas are increasingly becoming congested due to relaxed zoning regulations in areas such as Kilimani, occasioning frequent traffic snarl-ups rendering them inconvenient and difficult to access. The table below shows NMA’s land performance by submarkets in Q1’2024;
|
Price in Kshs per Acre |
|||
|
Cytonn Report: Nairobi Metropolitan Area Land Performance by Submarkets – Q1'2024 |
|||
|
Location |
Price Q1'2023 |
Price Q1'2024 |
Capital Appreciation |
|
Satellite Towns - Unserviced Land |
|||
|
Juja |
14.5 mn |
15.8 mn |
9.2% |
|
Rongai |
14.6 mn |
15.9 mn |
8.9% |
|
Athi River |
4.4 mn |
4.8 mn |
8.8% |
|
Utawala |
16.7 mn |
18.1 mn |
8.4% |
|
Limuru |
22.3 mn |
23.5 mn |
5.6% |
|
Average |
14.5 mn |
15.6 mn |
8.2% |
|
Satellite Towns - Serviced Land |
|||
|
Athi River |
14.4 mn |
15.6 mn |
8.1% |
|
Syokimau |
18.1 mn |
19.4 mn |
7.2% |
|
Ruiru & Juja |
26.5 mn |
28.1 mn |
5.9% |
|
Rongai |
19.1 mn |
19.8 mn |
3.7% |
|
Ruai |
12.5 mn |
12.4 mn |
(1.3%) |
|
Average |
18.1 mn |
19.1 mn |
4.7% |
|
Nairobi Suburbs – High Rise Areas |
|||
|
Embakasi |
78.8 mn |
84.3 mn |
7.0% |
|
Kasarani |
73.7 mn |
76.7 mn |
4.1% |
|
Dagoretti |
85.7 mn |
85.6 mn |
(0.1%) |
|
Average |
79.4 mn |
82.2 mn |
3.7% |
|
Nairobi High End Suburbs (Low- and High-Rise Areas) |
|||
|
Spring Valley |
179.7 mn |
191.0 mn |
6.3% |
|
Runda |
83.7 mn |
87.9 mn |
5.0% |
|
Ridgeways |
83.7 mn |
87.1 mn |
4.1% |
|
Karen |
64.5 mn |
65.7 mn |
1.9% |
|
Kitisuru |
97.4 mn |
97.5 mn |
0.1% |
|
Kileleshwa |
309.5 mn |
294.5 mn |
(4.9%) |
|
Average |
136.4 mn |
137.3 mn |
2.1% |
|
Nairobi Suburbs - Commercial Zones |
|||
|
Westlands |
413.2 mn |
437.2 mn |
5.8% |
|
Kilimani |
378.7 mn |
396.6 mn |
4.7% |
|
Riverside |
342.1 mn |
345.9 mn |
1.1% |
|
Upperhill |
479.4 mn |
476.7 mn |
(0.6%) |
|
Average |
403.4 mn |
414.1 mn |
2.8% |
Source: Cytonn Research
We retain a POSITIVE outlook for the land sector in the NMA which proves to be a reliable investment opportunity. We anticipate that the sector’s performance will continue to be driven by; i) positive population demographics facilitating increased demand for land, ii) the government's attempts to streamline land transactions, iii) increased launch and completion of affordable housing projects by both the government and private sector, and, iv) rapid growth of satellite towns amid increased delivery of infrastructural developments which are improving accessibility, property prices and demand for land in the regions.
- Statutory Reviews
During the quarter, the Real Estate sector witnessed various legislations and reforms geared towards boosting the government’s agenda on affordable housing, increasing safety and efficiency in the Kenyan tourism and building construction sectors.
The Development Control Zoning Framework has been tabled in the Nairobi County Assembly. If passed, certain areas will be allowed buildings of up to 75 floors. Some zones that could potentially accommodate buildings with up to 75 floors include Dennis Pritt Road, State House Road, Hombe Road, Ring Road Ngara, Muratina Street, and Kipanga Athumani Street. Other areas where this regulation could potentially be implemented include Valley Road, Arwings Kodhek Road, Ralph Bunche Road, Hospital Road, Upper Hill Road, and Mbagathi Ways.
The potential upheaval of the City's plot and ground coverage ratios comes on the back of strained on infrastructure development, including roads and sewage drains in the majority of the zones in the County. While the proposal may address the scarcity of development land, it's crucial to emphasize that infrastructure development is essential for alleviating issues such as heavy traffic congestion and inadequate drainage in these areas.
Other key highlights in Q1’2024 include;
- The Affordable Housing Bill 2023 was assented to law by President William Ruto on March 19, 2024. Following the assent, the Bill shall become known as the Affordable Housing Act 2024. This enactment follows a rigorous legislative process, spurred by a High Court ruling that declared the previous housing levy unconstitutional, citing administrative and discriminatory flaws. For more information, please see our Cytonn Weekly #12/2024, and,
- A new directive mandating all operators of short-term accommodation rentals, including Airbnb hosts, to register with the Tourism Regulatory Authority (TRA) was issued. The purpose of this registration is to ensure that all accommodations adhere to the highest standards of security for guests. This measure has been implemented in response to resident safety concerns arising from the increased cases of homicides occurring in Airbnbs in the country. For more information, please see our Cytonn Monthly – January 2024.
- Real Estate Investments Trusts (REITs)
During the week, ILAM Fahari I-REIT released its FY’2023 financial results highlighting that the REIT’s net earnings during the period under review improved by 99.0% to a loss of Kshs 0.3 mn, from a loss of Kshs 28.4 mn recorded in FY’2022.
The table below includes a summary of the REIT’s performance in FY’2023;
|
(Figures in Kshs bn Unless Stated Otherwise) |
|||
|
Balance Sheet |
FY’2022 |
FY’2023 |
∆ (FY'22/ FY’23) |
|
Total Assets |
3.6 |
3.5 |
(4.0%) |
|
Total Equity |
3.4 |
3.3 |
(3.4%) |
|
Total Liabilities |
0.1 |
0.2 |
(14.8%) |
|
(Figures in Kshs bn Unless Stated Otherwise) |
|||
|
Income Statement |
FY’2022 |
FY’2023 |
∆ (FY'22/ FY’23) |
|
Rental Income |
0.4 |
0.3 |
(9.0%) |
|
Income from Other Sources |
0.0 |
0.0 |
68.1% |
|
Operating Expenses |
0.2 |
0.2 |
(7.2%) |
|
Profit Before Tax |
(0.0) |
(0.0) |
(99.0%) |
|
Basic EPS |
(0.0) |
(0.0) |
(99.0%) |
|
Ratios Summary |
FY’2022 |
FY’2023 |
∆ (FY'22/ FY’23) |
|
ROA |
(0.8%) |
(0.0%) |
0.8% |
|
ROE |
(0.8%) |
(0.0%) |
0.8% |
|
Debt Ratio |
5.3% |
4.7% |
(0.6%) |
|
PBT Margin |
(8.4%) |
(0.1%) |
8.3% |
|
Rental Yield |
12.1% |
11.6% |
(0.5%) |
The key take-outs include;
- The basic earnings per unit improved to come in at a loss of Kshs 0.002 in FY’2023, from a loss of Kshs 0.2 in FY’2022. The performance was supported by a 99.0% improvement in ILAM Fahari's net loss which came in at a loss of Kshs 0.3 mn in FY’2023, from a loss of Kshs 28.4 mn recorded in FY’2022. This was mainly driven by a 12.5% reduction in fair value loss of investment property to a loss of Kshs 149.0 mn in FY’2023, from a loss of Kshs 170.3 mn realized in FY’2022. Additionally, operating expenses declined by 7.2% to Kshs 225.9 mn in FY’2023, from Kshs 243.4% recorded in FY’2022. Moreover, income from other sources also increased by 68.1% to Kshs 52.1 mn in FY’2023, from Kshs 31.0 mn in FY’2022,
- Rental income declined by 9.0% to Kshs 322.4 mn in FY’2023, from Kshs 354.3 mn recorded in FY’2022, largely attributed to the termination of the lease agreement for the single-tenanted property at 67 Gitanga Place. We note that efforts are underway by the REIT Manager to secure a new tenant for the property,
- Interest income increased by 25.0% to Kshs 38.8 mn in FY’2023, from Kshs 31.0 mn realized in the similar period in 2022, owing to the high interest rates being experienced in the market currently,
- The total operating expenses decreased by 7.2% to Kshs 225.8 mn in FY’2023, from Kshs 243.4 mn recorded in FY’2022, driven by a 26.0% decrease in property expenses to Kshs 97.2 mn in FY’2023, from Kshs 131.3 mn in FY’2022. This was attributable to lower repairs and maintenance costs as well as reduced provision for doubtful debts. However, there was a 14.8% increase in the fund operating expenses to Kshs 128.6 mn in FY’2023, from Kshs 112.1 mn in FY’2022. The increase in expenses was mainly on the back of the restructuring costs incurred during the year under review. Key to note, expenses made up 61.2% of the total operating income,
- Total assets reduced by 4.0% to Kshs 3.5 bn in FY’2023, from Kshs 3.6 bn in FY’2022. This was attributable to; i) a 38.4% decline in investment securities to Kshs 176.8 mn in FY’2023, from Kshs 287.1 mn recorded in FY’2022, ii) 20.2% decrease in assets held for sale to Kshs 160.0 mn in FY’2023, from Kshs 200. 4 mn in FY’2022, and, iii) a 4.8% reduction in investment property to Kshs 2.8 bn in FY’2023 from 2.9 bn in FY’2022, and,
- Total liabilities decreased by 14.8% to Kshs 163.0 mn in FY’2023, from Kshs 191.2 mn in FY’2022 attributable to a 14.8% decrease in the trade and other payables to Kshs 163.0 mn, from Kshs 191.2 in FY’2022. The REIT remained without non-current liabilities as at FY’2023.
For a more comprehensive analysis, please see our ILAM Fahari I-REIT FY’2023 Earnings Note.
Additionally, Acorn Holdings released their FY’2023 financial results highlighting that both Acorn I-REIT and D-REIT recorded 21.5% and 79.2% decline in profits respectively. Acorn I-REIT’s profits declined to Kshs 396.1 mn recorded in FY’2023, from Kshs 504.9 mn that was recorded in FY’2022 for.On the other hand, profits for the D-REIT decreased to Kshs 71.6 mn from Kshs 396.1 mn in FY’2022. The table below includes a summary of the REIT’s performance in FY’2023;
|
Cytonn Report: Income Statement |
||||||
|
|
Acorn I-REIT |
Acorn D-REIT |
||||
|
FY’2022 |
FY’2023 |
Change |
FY’2022 |
FY’2023 |
Change |
|
|
Figures in Kshs mn unless stated otherwise |
||||||
|
Rental Income |
442.0 |
722.3 |
63.4% |
311.0 |
324.5 |
4.3% |
|
Income from Other Sources |
4.8 |
2.2 |
(54.9%) |
0.5 |
6.8 |
1,325.7% |
|
Total operating income |
463.0 |
724.9 |
56.6% |
1,012.6 |
728.0 |
(28.1%) |
|
Operating Expenses |
316.1 |
384.7 |
21.7% |
356.1 |
366.2 |
2.8% |
|
Finance costs |
22.0 |
127.4 |
459.0% |
313.3 |
305.4 |
2.5% |
|
Profit Before Tax |
504.9 |
396.1 |
(21.5%) |
343.6 |
71.6 |
(79.2%) |
|
Basic EPS (Kshs) |
1.9 |
1.2 |
(36.5%) |
1.6 |
0.3 |
(82.9%) |
|
Cytonn Report: Balance Sheet |
||||||
|
Figures in Kshs bn unless stated otherwise |
||||||
|
Total Assets |
6.8 |
9.2 |
34.7% |
10.4 |
11.5 |
10.7% |
|
Total Equity |
5.9 |
7.4 |
26.0% |
6.2 |
6.6 |
6.6% |
|
Total Liabilities |
0.9 |
1.8 |
88.4% |
4.2 |
4.9 |
16.6% |
|
Cytonn Report: Ratios Summary |
||||||
|
ROA |
7.4% |
4.3% |
(3.1%) |
3.3% |
0.6% |
(2.7%) |
|
ROE |
8.6% |
5.4% |
(3.3%) |
5.6% |
1.1% |
(4.5%) |
|
Debt Ratio |
13.9% |
19.5% |
5.5% |
40.7% |
42.9% |
2.2% |
|
PBT Margin |
114.2% |
54.8% |
(59.4%) |
33.9% |
42.9% |
(24.1.0%) |
|
Rental Yield |
6.8% |
8.2% |
1.5% |
3.4% |
3.8% |
0.4% |
|
Distribution Per Unit |
0.8 |
0.8 |
0.2% |
0.0 |
0.9 |
- |
|
Payout Ratio |
96.9% |
73.4% |
(24.2%) |
0.0% |
335.2% |
- |
The key take-outs include;
Acorn I-REIT
- The basic earnings per unit decreased by 36.5% to Kshs 1.2 in FY’2023, from Kshs 1.9 recorded in FY’2022. This was mainly driven by a 21.5% decline in profit to Kshs 396.1 mn recorded in FY’2023, from Kshs 504.9 mn that was recorded in FY’2022. This was on the back of increased total operating expenses which registered a 21.7% increase to come in at Kshs 384.7 mn from Kshs 316.1 mn in FY’2022. The increase was however offset by a 56.6% increase in total operating income to Kshs 724.9 mn in FY’2023 from Kshs 463.0 mn in FY’2022,
- The REIT’s total operating expenses came in at Kshs 384.7 mn, a 21.7% increase from Kshs 316.1 mn recorded in FY’2022. This performance was attributable to a 58.9% increase in; fund-operating expenses to Kshs 124.2 mn in FY’2023, from Kshs 114.0 mn in FY’2022. Additionally, administrative expenses also increased by 30.3% to Kshs 264.8 mn in FY’2023 from Kshs 47.8 mn in FY’2022,
- Total assets for the I-REIT increased by 34.7% to Kshs 9.2 bn in FY’2023 from Kshs 6.8 bn in FY’2022. This was mainly on the back of a 34.2% increase in investment property during the period, coming in at Kshs 8.8 bn from Kshs 6.5 bn in FY’2022. This was a result of newer acquisitions during the period including Qwetu Hurlingham, and,
- Total liabilities increased by 88.4% to Kshs 1.8 bn in FY’2023, from Kshs 0.9 bn in FY’2022 as a result of increase in trade payables. During the period under review, payables increased by 66.3% to Kshs 260.0 mn from Kshs 156.3 mn in FY’2022. Moreover, the REIT registered short-term borrowings amounting to Kshs 1.5 bn in FY’2023 which further contributed to the increase in liabilities.
Acorn D-REIT
- The basic earnings per unit for the REIT decreased by 82.9% to Kshs 0.3 in FY’2023, from Kshs 1.6 in FY’2022. This was mainly driven by a 79.2% decline in profits to Kshs 71.6 mn from Kshs 396.1 mn in FY’2022, on the back of declined total operating income by 28.1% to Kshs 728.0 mn from 1.0 bn in FY’2022,
- The total operating expenses for the D-REIT increased for the D-REIT increased marginally by 2.8% to Kshs 366.2 mn in FY’2023 from Kshs 356.1 mn in FY’2022, mainly driven by a 16.7% increase fund-operating expenses to Kshs 214.4 mn from Kshs 183.7 mn in FY’2022,
- Total assets for the D-REIT increased by 10.7% to Kshs 11.5 bn in FY’2023, from Kshs 10.4 bn in FY’2022. The increase in assets was mainly on the back of an increase in non-current assets to Kshs 2.2 bn from Kshs 0.7 bn in FY’2022as a result of classified as held for sale which came in at Kshs 1.5 bn, and,
- Total liabilities for the D-REIT increased by 16.6% to Kshs 4.9 bn, from Kshs 4.2 bn in FY’2022, mainly driven by; i) 5330.5% increase in short-term borrowings which came in at Kshs 2.9 bn in FY’2023, from Kshs 54.1 mn in FY’2022, and ii) 89.1% increase in trade and other payables to Kshs 744.8 mn, from Kshs 393.9 mn in FY’2022.
For a more comprehensive analysis, please see our Acorn I-REIT and D-REIT FY’2023 Earnings Note.
In the Unquoted Securities Platform, Acorn D-REIT and I-REIT traded at Kshs 24.4 and Kshs 21.7 per unit, respectively, as of 22nd March 2024. The performance represented a 22.0% and 8.3% gain for the D-REIT and I-REIT, respectively, from the Kshs 20.0 inception price. The volumes traded for the D-REIT and I-REIT came in at 12.3 mn and 30.7 mn shares, respectively, with a turnover of Kshs 257.5 mn and Kshs 633.8 mn, respectively, since inception in February 2021
Notably, during the quarter;
- ILAM Fahari Income Real Estate Investment Trust (ILAM Fahari I-REIT or IFIR) through a public notice, announced it received approval from the Capital Markets Authority (CMA) to delist from the Main Investment Market Segment (MIMS) of the Nairobi Securities Exchange (NSE).The delisting, effective from Monday, February 12th, 2024, follows the resolution by Unitholders of ILAM Fahari to delist in November 2023. For more information, please see our Cytonn Weekly #06/2024 ,and,
- The Capital Markets Authority (CMA) licensed NCBA Bank Kenya PLC to become a Real Estate Investment Trust (REIT) trustee in Kenya. This accreditation, issued in line with the Capital Markets (REITs) (Collective Investment Schemes) Regulations 2013, and, the Capital Markets (Corporate Governance) (Market Intermediaries) Regulations 2011, underscores the CMA's commitment to supporting the National Government's Affordable Housing agenda through the stimulation of the Kenyan Real Estate capital markets. For more information, please see our Cytonn Weekly #06/2024.
With the delisting of ILAM Fahari I-REIT, the Kenyan REIT sector has continued to underperform in comparison to other jurisdictions. Notably, REIT market capitalization in Kenya remains significantly lower compared to other jurisdictions as shown below;
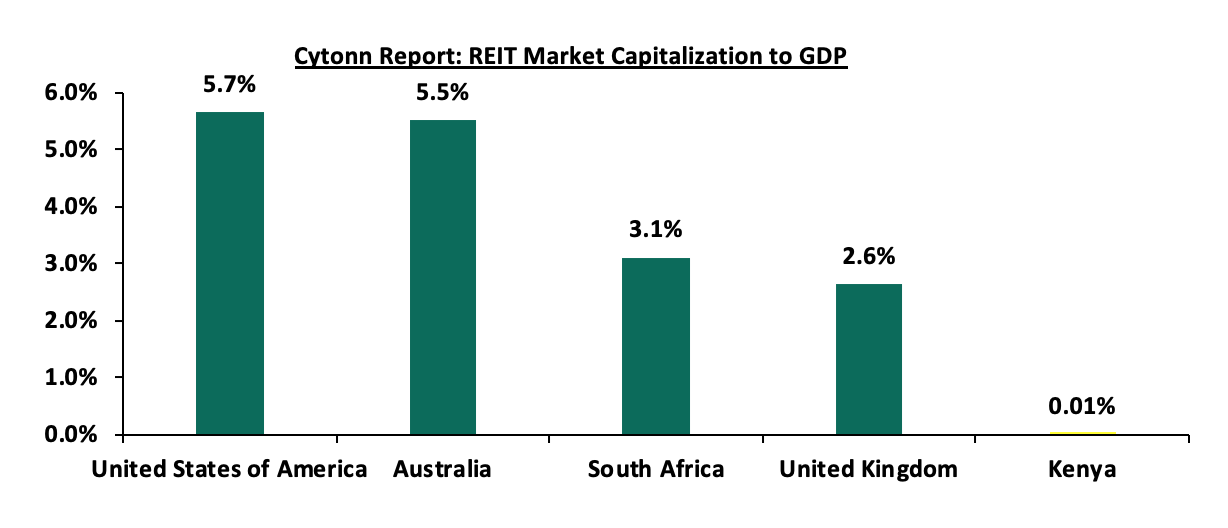
On the other hand, REITs provide various benefits like tax exemptions, diversified portfolios, and stable long-term profits. However, the continuous deterioration in the performance of the Kenyan REITs and restructuring of their business portfolio is hampering major investments that had previously been made. The other general challenges include; i) inadequate comprehension of the investment instrument among investors, ii) prolonged approval processes for REITs creation, iii) high minimum capital requirements of Kshs 100.0 mn for trustees, and, iv) minimum investment amounts set at Kshs 5.0 mn, continue to limit the performance of the Kenyan REITs market. For more information on REITs, please see our topical on Real Estate Investment Trusts (REITs) Progress Update in Kenya.
We anticipate that the Real Estate sector in Kenya will experience a boost from several significant factors; i) the implementation of expanded initiatives and the advancement of affordable housing projects are expected to stimulate growth in the residential sector, ii) favorable demographic trends, including population growth and urbanization are fuelling increased demand for housing and Real Estate assets, iii) a rise in tourist arrivals, and iv) expansion efforts by key players in the hospitality industry. However, challenges such as rising construction expenses, limited investor understanding of Real Estate Investment Trusts (REITs), and existing oversupply in certain market segments may persist. These obstacles could hinder sectoral performance by limiting development and investment prospects.
Disclaimer: The views expressed in this publication are those of the writers where particulars are not warranted. This publication, which is in compliance with Section 2 of the Capital Markets Authority Act Cap 485A, is meant for general information only and is not a warranty, representation, advice or solicitation of any nature. Readers are advised in all circumstances to seek the advice of a registered investment advisor.

- Talk to us
- Kenya
- P.O Box 20695 - 00200, Nairobi, Kenya
- Cell +254709101200
- Tel +254709101200
- WhatsApp +254741676635
- United States
- +254709101200
- DOWNLOAD OUR APP
-


- Kenya
- 8th Floor, Pinetree Plaza, Kaburu Drive, Ngong Road, Nairobi, Kenya
- USA
- Suite 1150, 1775 Eye Street NW, USA, Washington DC 20006, USA
- Investments
- High Yield
- Private Equity
- Real Estate
- Real Estate
- RiverRun Estates
- Cytonn Towers
- The Ridge
- Taraji Heights
- The Alma