Cytonn Q1’2025 Markets Review
By Research Team, Apr 6, 2025
Executive Summary
Global Markets Review
According to the World Bank the global economy is projected to grow at 2.7% in 2025, matching the 2.7% growth recorded in 2024. This forecast marks a slight upward revision from earlier projections, reflecting economic recovery, particularly for emerging markets. The World Bank’s growth projection is 0.6% points lower than the IMF’s 2025 forecast of 3.3%. The upward revision is despite the global inflationary pressures and continued tightening by central banks for much of 2024. However, recent developments indicate that some central banks, such as those in the United States and England, have begun to cut interest rates in response to easing inflation, which could stimulate economic activity going forward. Notably, advanced economies are expected to record a 1.9% growth in 2025, up from the 1.7% expansion recorded in 2024. However, emerging markets and developing economies are projected to expand by 4.2% in 2025, remaining unchanged from an estimated growth of 4.2% in 2024;
Sub-Saharan Africa Regional Review
According to the World Bank, the Sub-Saharan economy is projected to grow at a moderate rate of 4.1% in 2025, which is 0.9% higher than the 3.2% growth estimate recorded in 2024. The expected recovery is primarily driven by private consumption growth as declining inflation boosts the purchasing power of household incomes. Nevertheless, the risk of debt distress remains high with more than half of countries facing unsustainable debt burdens. The public debt is expected to remain high due to increased debt servicing costs as a result of continued currency depreciation and high interest rates in developed economies. Additionally, many countries are providing subsidies in order to mitigate inflationary pressures, which could worsen public finance, increase public debt, and weigh down on debt sustainability;
In Q1’2025, most of the select Sub-Saharan currencies depreciated against the US Dollar, primarily due to elevated inflationary pressures in the region, high debt servicing costs that continued to deplete foreign exchange reserves, and monetary policy tightening by advanced economies. High interest rates in developed countries resulted in significant capital outflows as investors, both institutional and individual, sought higher returns offered in these economies. Additionally, the rising inflation across most Sub-Saharan economies exerted pressure on local currencies due to the increasing cost of imports;
Kenya Macroeconomic Review
According to the Kenya National Bureau of Statistics (KNBS) Q3’2024 Quarterly Gross Domestic Product Report, the Kenyan economy recorded a 4.0% growth in Q3’2024, slower than the 6.0% growth recorded in Q3’2023. The main contributor to Kenyan GDP remains to be the Agriculture, Fishing and Forestry sector which grew by 4.2% in Q3’2024, lower than the 5.1% expansion recorded in Q3’2023. In Q3’2024 all sectors, except Mining and Quarrying and Construction recorded positive growths, with varying magnitudes across activities. Most sectors recorded declining growth rates compared to Q3’2023 with Accommodation and Food Services, Mining and Quarrying and Financial & Insurance Sectors recording the highest declines of 20.8%, 11.9%, and 10.8% points, respectively. Other sectors that recorded a contraction in growth rate, from what was recorded in Q3’2023 were Construction, Electricity and Water Supply and Real Estate sector which grew by 6.0%, 2.4%, and 2.2% points respectively. The slowed growth in the economy is majorly attributed to the high cost of borrowing that stagnated the private sector credit growth in the country, the high fuel prices which made production more expensive;
Fixed Income
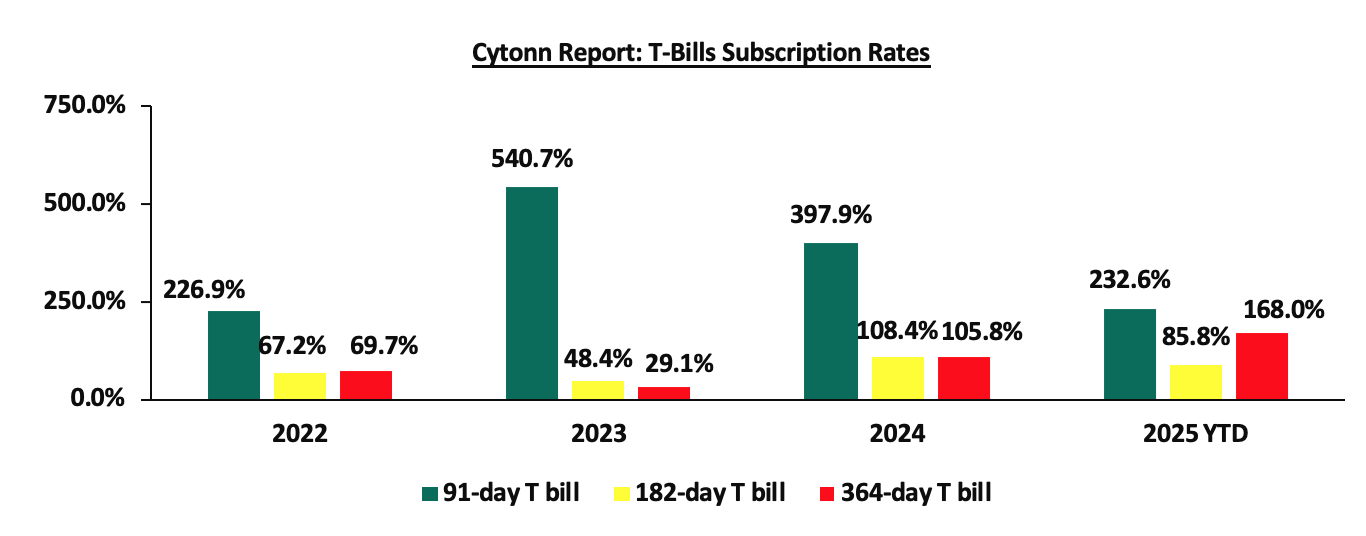
During the quarter, T-bills were oversubscribed, with the overall subscription rate coming in at 136.1%, up from 132.6% in Q1’2024. Investors’ preference for the 91-day paper persisted as they sought to avoid duration risk, with the paper receiving bids worth Kshs 424.6 bn against the offered Kshs 52.0 bn, translating to an oversubscription rate of 221.1%, albeit lower than the subscription rate of 494.4% recorded in the previous year same period. Overall subscriptions for the 364-day and 182-day papers increased significantly to 140.4% and 97.8%, from 64.3% and 56.3% in Q1’2024, respectively. The yields on all the papers were on a downward trajectory with the average yields on the 91-day, 182-day, and 364-day papers decreasing by 7.3%, 7.0%, and 5.9% points to 9.2%, 9.5%, and 10.8%, from 16.4%, 16.6%, and 16.7%, respectively, recorded in Q1’2024. The downward trajectory in yields is mainly due to high liquidity in the money market which allowed the government to front load most of its borrowing. The acceptance rate during the period came in at 86.4%, albeit lower than the 88.8% recorded in Q1’2024, with the government accepting a total of Kshs 366.8 bn out of the Kshs 424.6 bn worth of bids received;
During the week, T-bills were oversubscribed for the first time in two weeks, with the overall subscription rate coming in at 169.5%, a reversal from the undersubscription rate of 61.4% recorded the previous week. Investors’ preference for the shorter 91-day paper persisted, with the paper receiving bids worth Kshs 11.2 bn against the offered Kshs 4.0 bn, translating to an oversubscription rate of 279.5%, higher than the undersubscription rate of 69.8%, recorded the previous week. The subscription rates for the 182-day paper increased to 44.9% from the 17.1% recorded the previous week while the 364-day paper increased to 250.1% from the 102.5% recorded the previous week. The government accepted a total of Kshs 40.5 bn worth of bids out of Kshs 40.7 bn bids received, translating to an acceptance rate of 99.7%. The yields on the government papers were on a downward trajectory with the yields on the 91-day paper decreasing the most by 16.1 bps to 8.6% from 8.8% recorded the previous week. The yields on the 364-day paper decreased by 2.5 bps to remain relatively unchanged from the 10.4% recorded the previous week while the 182-day paper decreased by 2.3 bps to 9.0% from the 9.1% recorded the previous week;
During the quarter, the government re-opened five bonds, seeking to raise Kshs 125.0 bn during the quarter. The bonds were generally oversubscribed, receiving bids worth Kshs 299.9 bn against the offered Kshs 125.0 bn, translating to a subscription rate of 239.9%. The government accepted Kshs 214.5 bn of the Kshs 299.9 bn worth of bids received, translating to an acceptance rate of 71.5%;
Also, during the quarter, the government announced its first-ever domestic treasury bond buyback aiming to buyback Kshs 50.0 bn of Kshs 185.1 bn outstanding ofs the FXD1/2020/005, FXD1/2022/003 and IFB1/2016/009 with tenors to maturity of 0.4 years, 0.3 years and 0.4 years respectively, and fixed coupon rates of 11.7%, 11.8% and 12.5% respectively. The total outstanding amounts for the FXD1/2020/005, FXD1/2022/003 and IFB1/2016/009 were Kshs 104.5 bn, Kshs 60.6 bn and Kshs 19.9 bn each respectively. The offer was oversubscribed, with the overall subscription rate coming in at 112.2%, receiving bids worth Kshs 56.1 bn against the offered Kshs 50.0 bn. The government accepted bids worth Kshs 50.1 bn, translating to an acceptance rate of 89.3%, and equivalent to 27.1% of the total outstanding amount of Kshs 185.1 bn for the three bonds. The weighted average yield for the accepted bids for the FXD1/2022/003, FXD1/2020/005 and IFB1/2016/009 came in at 9.1%, 8.9% and 9.1% respectively;
During the week, the Central Bank of Kenya released the auction results for the re-opened treasury bonds FXD1/2020/015, FXD1/2022/015 and FXD1/2022/025 with tenors to maturity of 9.9 years, 12.1 years and 22.6 years respectively and fixed coupon rates of 12.8% 13.9% and 14.2% respectively. The bonds were oversubscribed, with the overall subscription rate coming in at 102.5%, receiving bids worth Kshs 71.7 bn against the offered Kshs 70.0 bn. The government accepted bids worth Kshs 71.4 bn, translating to an acceptance rate of 99.5%. The weighted average yield for the accepted bids for the FXD1/2020/015, FXD1/2022/015 and FXD1/2022/025 came in at 13.7%, 13.8% and 14.2%. Notably, the 13.7% on the FXD1/2020/015 was relatively unchanged from the last tap sale in March 2022 while the 13.8% on the FXD1/2022/015 was lower than the 14.2% recorded on the last time it was reopened in January 2023 and the 14.2% on the FXD1/2022/025 was lower than the 15.7% recorded the last time it was reopened in January 2025. With the Inflation rate at 3.6% as of March 2025, the real returns of the FXD1/2018/025, FXD1/2022/015 and FXD1/2022/025 are 10.1%, 10.2% and 10.6%. Given the withholding tax of 10.0%% for the three bonds, a shorter-term bond subject to 15.0% withholding tax would need to offer an equivalent yield of 14.5%, 14.6% and 15.0% for the FXD1/2020/015, FXD1/2022/015 and FXD1/2022/025 respectively;
During the week, Stanbic Bank released its monthly Purchasing Manager's Index (PMI) highlighting that the index for the month of March 2025 increased slightly, coming in at 51.7, up from 50.6 in February 2025, signaling another improvement in business conditions. This marked the sixth consecutive month that index fell above the 50.0 neutral mark. Increased output, new orders and increased sales supported the improvement;
The Monetary Policy Committee (MPC) is set to meet on Tuesday, 8th April 2025, to review the outcome of its previous policy decisions and recent economic developments, and to decide on the direction of the Central Bank Rate (CBR). In their previous meeting held on 5th February 2025, the committee noted that they would closely monitor the impact of the policy measures taken so far, as well as developments in the global and domestic economy, and stood ready to reconvene earlier if necessary. Additionally, the MPC decided to cut the CBR by 50.0 bps citing that its previous interventions successfully curbed inflation to below the midpoint of the CBK’s target range, which came in at 3.6% in March 2025, supported by the exchange rate stability, and lower fuel inflation;
Equities
During the quarter, the equities market was on an upward trajectory with NSE 20, NASI, NSE 25 and NSE 10 gaining by 10.8%,6.0%, 3.8% and 3.1% respectively. The equities market performance during the quarter was driven by gains recorded by large caps such as Stanbic Bank, DTB-Kenya, and NCBA Bank of 17.9%, 9.8%, and 8.9%, respectively. The gains were however weighed down by losses recorded by Co-operative Bank, Equity Bank and BAT of 2.7%, 2.5% and 1.3 respectively;
During the week, the equities market recorded a mixed performance, with NASI, NSE 25, and NSE 10 gaining by 0.5%, 0.1%, and 0.1%, respectively, while NSE 20 declined by 0.1%, taking the YTD performance to gains of 8.1%, 4.9%, 2.3% and 1.3% for NSE 20, NASI, NSE 25, and NSE 10 respectively. The equities market performance during the week was mainly driven by gains recorded by East African Breweries Limited (EABL), NCBA Group, and Stanbic Bank of 3.2%, 2.9%, and 2.3% respectively. The gains were however weighed down by losses recorded by large-cap stocks such as KCB Group, ABSA and DTB-K of 5.7%, 4.7% and 1.0% respectively
During the week, Jubilee Holdings Limited released their FY’2024 results. Jubilee’s Profit After Tax (PAT) increased by 82.5% to Kshs 4.7 bn, from Kshs 2.6 bn recorded in FY’2023. The performance was mainly driven by a 13.5% increase in Insurance Services Revenues to Kshs 25.7 bn, from Kshs 22.6 bn in FY’2023, but was however weighed down by the 11.4% increase in Insurance Services Expenses to Kshs 24.2 bn in FY’2024, from Kshs 21.8 bn in FY’2023
Real Estate
In Q1’2025, the general Real Estate sector continued to witness considerable growth in activity in terms of property transactions and development activities. Consequently, the sector’s activity contribution to Gross Domestic Product (GDP) grew by 5.5 % to Kshs 283.8 bn in Q3’2024, from Kshs 268.9 bn recorded during the same period in 2023. In addition, the sector contributed 10.8% to the country’s GDP, 0.3% points increase from 10.5% recorded in Q3’2023. Cumulatively, the Real Estate and construction sectors contributed 16.5% to GDP, 0.2% points decrease from 16.7% in Q3’2023, attributable to decline in construction contribution to GDP by 0.4% points, to 5.7% in Q3’2024, from 6.1% recorded in Q3’2023;
During the week, Kenya secured Kshs 559.6 mn from the World Bank Group to initiate a credit guarantee scheme aimed at providing affordable mortgages to non-salaried workers, commonly referred to as "hustlers." This initiative, managed by the Kenya Mortgage Guarantee Trust (KMGT), seeks to mitigate lender risk by covering up to 40% of potential mortgage defaults, encouraging financial institutions to extend home loans to informal sector workers who typically lack consistent income streams;
Additionally, during the week, Kenya introduced a State-backed initiative to provide affordable mortgages of up to Kshs 6.0 mn to non-salaried workers, aiming to enhance homeownership among the informal sector, which comprises approximately 83.0% of the nation's 18.0 mn labor force. The Kenya Mortgage Guarantee Trust (KMGT) will cover up to 40.0% of defaulted mortgages, encouraging banks and savings and credit cooperative societies (Saccos) to extend credit to individuals with irregular incomes;
Also during the week, the state postponed the launch of 4,888 housing units, initially scheduled for March 2025, to May 2025 due to delays in the installation of essential fittings, notably lifts. Housing Principal Secretary Charles Hinga acknowledged the setback, stating that while final touches are being applied and the allocation process is ongoing, the realistic timeline for completion is now May;
On the Unquoted Securities Platform, Acorn D-REIT and I-REIT traded at Kshs 25.4 and Kshs 22.2 per unit, respectively, as per the last updated data on 21st March 2025. The performance represented a 27.0% and 11.0% gain for the D-REIT and I-REIT, respectively, from the Kshs s 20.0 inception price. Additionally, ILAM Fahari I-REIT traded at Kshs 11.0 per share as of 21st March 2025, representing a 45.0% loss from the Kshs 20.0 inception price. The volume traded to date came in at 138,600 shares for the I-REIT, with a turnover of Kshs 1.5 mn since inception in November 2015.
Investment Updates:
- Weekly Rates:
- Cytonn Money Market Fund closed the week at a yield of 14.90% p.a. To invest, dial *809# or download the Cytonn App from Google Play store here or from the Appstore here;
- We continue to offer Wealth Management Training every Tuesday, from 7:00 pm to 8:00 pm. The training aims to grow financial literacy among the general public. To register for any of our Wealth Management Trainings, click here;
- If interested in our Private Wealth Management Training for your employees or investment group, please get in touch with us through wmt@cytonn.com;
- Cytonn Insurance Agency acts as an intermediary for those looking to secure their assets and loved ones’ future through insurance namely; Motor, Medical, Life, Property, WIBA, Credit and Fire and Burglary insurance covers. For assistance, get in touch with us through insuranceagency@cytonn.com;
- Cytonn Asset Managers Limited (CAML) continues to offer pension products to meet the needs of both individual clients who want to save for their retirement during their working years and Institutional clients that want to contribute on behalf of their employees to help them build their retirement pot. To more about our pension schemes, kindly get in touch with us through pensions@cytonn.com
Hospitality Updates:
- We currently have promotions for Staycations. Visit cysuites.com/offers for details or email us at sales@cysuites.com;
Global Economic Growth:
According to the World Bank the global economy is projected to grow at 2.7% in 2025, matching the 2.7% recorded in 2024. This forecast marks a slight upward revision from earlier projections, reflecting economic recovery, particularly for emerging markets. The World Bank’s growth projection is 0.6% points lower than the IMF’s 2025 forecast of 3.3%. However, recent developments indicate that some central banks, such as those in the United States and England, have begun to cut interest rates in response to easing inflation, which could stimulate economic activity going forward. Notably, advanced economies are expected to record a 1.9% growth in 2025, up from the 1.7% expansion recorded in 2024. However, emerging markets and developing economies are projected to expand by 4.2% in 2025, remaining unchanged from an estimated growth of 4.2% in 2024.
The stabilization in global economic growth in 2024 as compared to 2023 is majorly attributable to;
- The recovery in global trade supported by a pickup in goods trade. Services-trade growth is expected to provide less tailwinds this year, given that tourism has nearly recovered to pre-pandemic levels. However, the trade outlook remains lackluster compared to recent decades, partly reflecting a proliferation of trade-restrictive measures and elevated trade policy uncertainty, and,
- A decrease in inflation rates making progress toward central bank targets in advanced economies and Emerging Markets and Developing Economies (EMDEs), but at a slower pace than previously expected. Core inflation has remained stubbornly high in many economies, supported by rapid growth of services prices. As such, by the end of 2026, global inflation is expected to settle at an average rate of 3.5%, broadly consistent with central bank’s targets.
The global economy is showing signs of improvement, with inflationary pressures easing and several central banks moving from rate hikes to rate cuts. This shift is expected to support economic recovery, although growth remains uneven across regions.
Global Commodities Market Performance:
Global commodity prices registered mixed performance in Q1’2025, with prices of energy declining by 3.0%, higher than the 1.2% decrease recorded in Q1’2024, mainly as a result of the declining energy production and exports among oil-importing economies coupled with reduced geopolitical tensions on the Middle east that caused disruption on the supply leading. On the other hand, prices of Precious Metals, Fertilizers, Agriculture, and Non-Energy increased by 42.5%, 13.1%, 11.0%, and 9.6% respectively, on the back of increased global demand coupled with easing supply chain constraints. Below is a summary performance of various commodities;
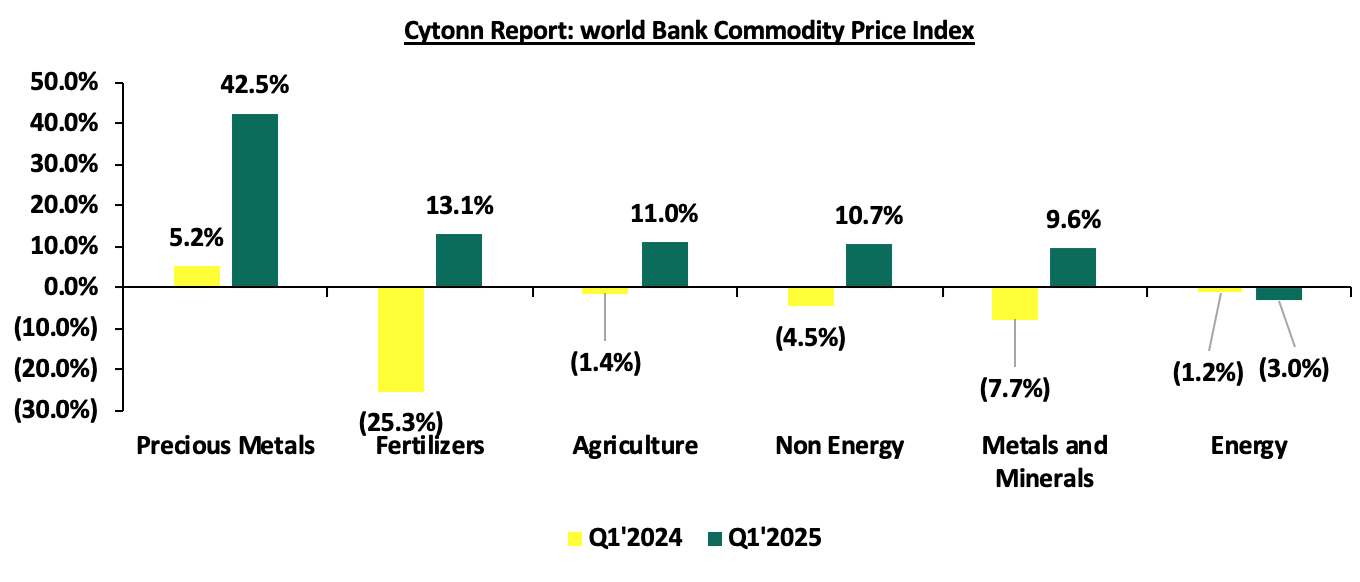
Source: World Bank
Q1’2025 data as of February 2025
Global Equities Market Performance:
The global stock market recorded mixed performance in Q1’2025, with most indices in the developed countries recording gains during the period, largely attributable to increased investor sentiments as a result of continued economic recovery following the full reopening of the economies coupled with investor preference for the stock markets in the developed countries. Notably, GGSECI was the best performer during the period, recording a gain at 53.5% in Q1’2025 largely driven by gains in the large-cap stocks such as Access Bank, MTN Ghana and Standard Chartered Bank gaining by 74.4%,27.6% and 13.0%, following improved earnings during the period, additionally supported by easing inflation. S&P 500 was the largest decliner, recording losses of 4.9% with the performance being skewed by tariffs imposed by US President Donald Trump which hit the top global corporations coupled with the increase in bond yields even though the interest rates were cut. Below is a summary of the performance of key indices as at the end of Q1’2025:
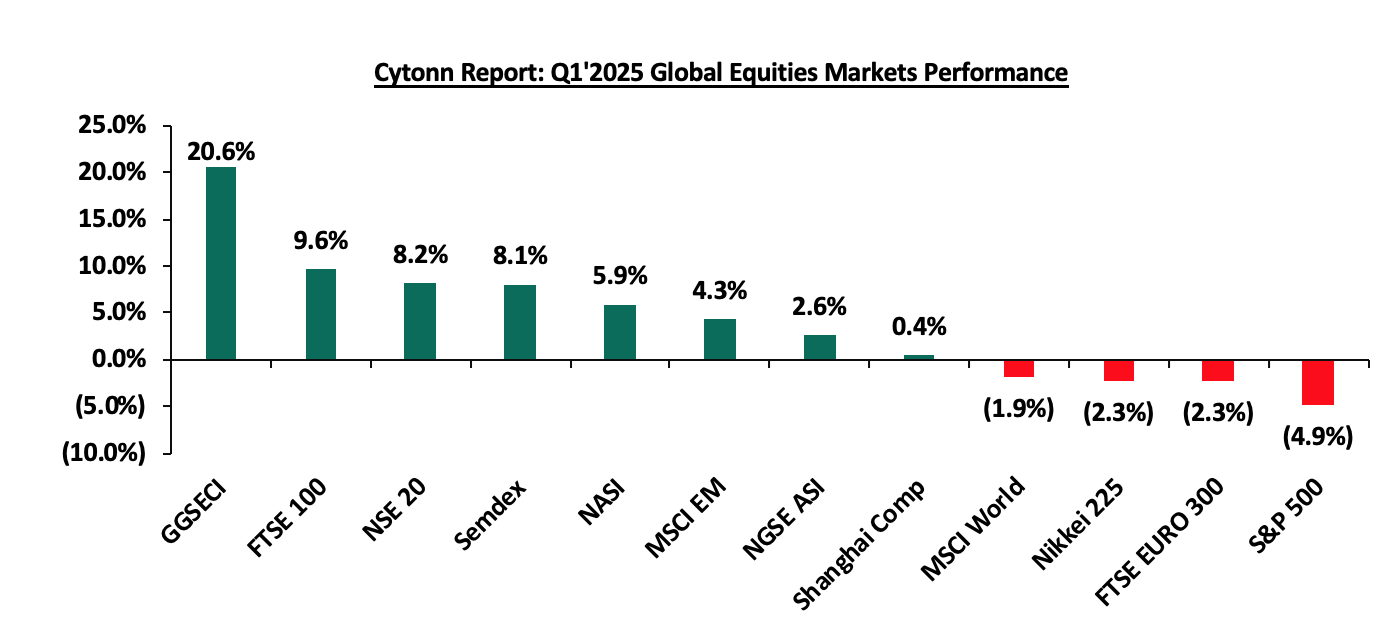
*Dollarized performance
Sub-Saharan Africa Region Review
According to the World Bank, the Sub-Saharan economy is projected to grow at a moderate rate of 4.1% in 2025, which is 0.9% higher than the 3.2% growth estimate recorded in 2024. The expected recovery is primarily driven by private consumption growth as declining inflation boosts the purchasing power of household incomes. Nevertheless, the risk of debt distress remains high with more than half of countries facing unsustainable debt burdens. The public debt is expected to remain high due to increased debt servicing costs as a result of continued currency depreciation and high interest rates in developed economies. Additionally, many countries are providing subsidies in order to mitigate inflationary pressures, which could worsen public finance, increase public debt, and weigh down on debt sustainability.
Currency Performance:
In Q1’2025, most of the select Sub-Saharan currencies depreciated against the US Dollar, primarily due to elevated inflationary pressures in the region, high debt servicing costs that continued to deplete foreign exchange reserves, and monetary policy tightening by advanced economies. High interest rates in developed countries resulted in significant capital outflows as investors, both institutional and individual, sought higher returns offered in these economies. Additionally, the rising inflation across most Sub-Saharan economies exerted pressure on local currencies due to the increasing cost of imports. However, the Mauritius Rupee emerged as the best performer among the selected currencies, appreciating by 4.2% against the USD on a year-to-date basis, closing Q1'2025 at MUR 45.7, from MUR 47.7 at the beginning of the year. Below is a table showing the performance of select African currencies against the US Dollar:
|
Cytonn Report: Select Sub-Saharan Africa Currency Performance vs USD |
|||||
|
Currency |
Mar-24 |
Jan-25 |
Mar-25 |
Last 12 months |
YTD change (%) |
|
Mauritius Rupee |
46.3 |
47.7 |
45.7 |
1.3% |
4.2% |
|
South African Rand |
19.0 |
18.8 |
18.3 |
3.7% |
2.5% |
|
Botswana Pula |
13.7 |
14.0 |
13.7 |
0.1% |
2.1% |
|
Ugandan Shilling |
3,885.9 |
3,697.6 |
3,662.6 |
5.7% |
0.9% |
|
Nigerian Naira |
1,418.6 |
1,540.7 |
1,538.3 |
(8.4%) |
0.2% |
|
Malawian kwacha |
1,742.0 |
1,750.3 |
1,750.2 |
(0.5%) |
0.0% |
|
Kenyan Shilling |
131.8 |
129.3 |
129.3 |
1.9% |
(0.0%) |
|
Zambian Kwacha |
24.8 |
27.9 |
28.2 |
(13.8%) |
(1.1%) |
|
Ghanaian Cedi |
13.2 |
14.7 |
15.5 |
(17.7%) |
(5.6%) |
|
Tanzanian Shilling |
2,557.5 |
2,374.7 |
2,650.0 |
(3.6%) |
(11.6%) |
Source: Yahoo Finance
The chart below shows the year-to-date performance of different sub-Saharan African countries in Q1’2025;
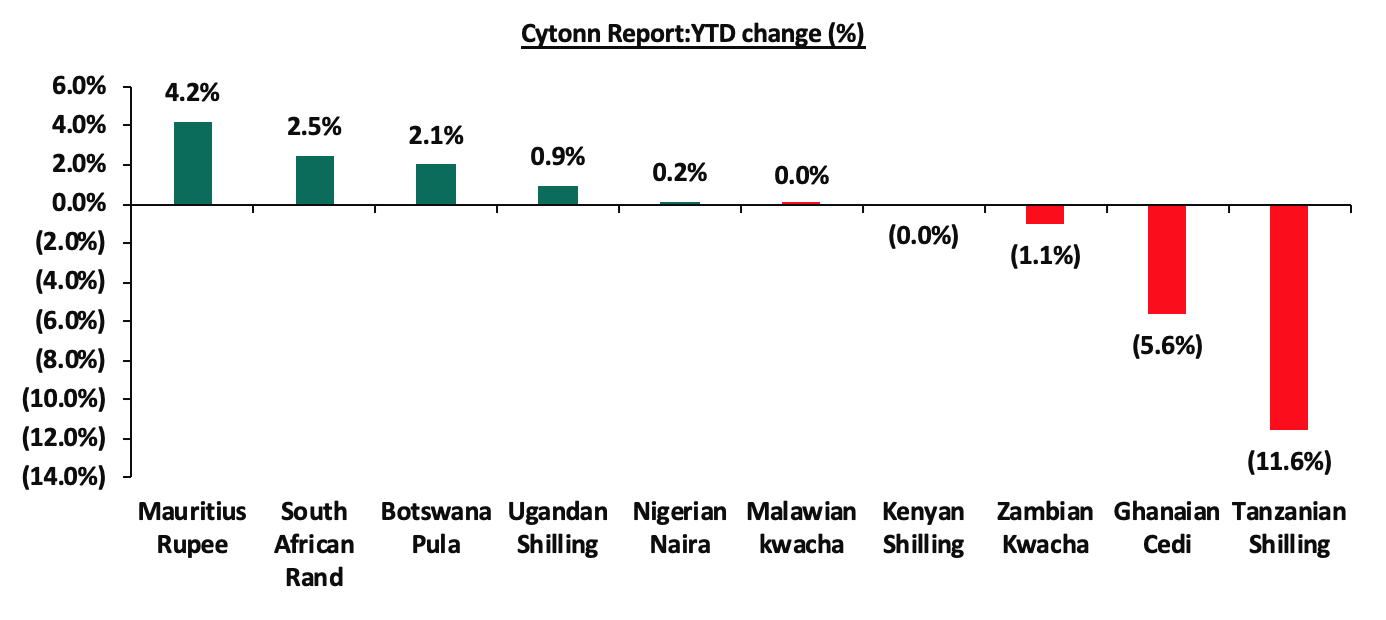
Source: Yahoo Finance
Key take outs from the above table and chart include:
- The Mauritius Rupee was the largest gainer against the USD Dollar, gaining by 4.2% year to date to close at MUR 45.7 as at the end of March from the MUR 47.7 recorded at the beginning of the year. The Rupee's strength has been supported by several factors, including the county’s effort to contain excess volatility of the rupee by market selling USD 120.0 mn in order to intervene the domestic foreign exchange, coupled with the US Federal Reserve's decision to cut its benchmark interest rate by 25 basis points to a range of 4.25%-4.50% has also contributed to a favorable environment for the South African Rand, and,
- The Tanzanian Shilling was the worst performing currency in Q1’2025, depreciating by 11.6%, mainly as a result of rising imports and increased public debt linked to major infrastructure projects.
African Eurobonds:
Africa’s appetite for foreign-denominated debt has increased in recent times with the latest issuers during the three months to end of Q1’2025 being Ivory Coast and Benin raising a total of USD 0.7 bn and USD 0.5 bn respectively. Additionally, 2024 issuers were Ivory Coast, Benin, Kenya, Senegal and Cameroon raising a total of USD 2.6 bn, USD 0.8 bn, USD 1.5 bn, USD 0.8 bn and USD 0.6 bn respectively. Notably, all the bonds were oversubscribed with the high support being driven by the yield hungry investors and also the outlook of positive recovery in the regional economies. It is good to note that there was a general decline in the yields of the various bonds from different countries due to general improvement in investor sentiment as the economy recovers and the easing inflationary pressures in the region. The yields of the Ivory Coasts’ 10-year Eurobond maturing in 2033 increased marginally by 0.3% points to 8.4% as at the end of March 2025 from 7.8% recorded in March 2024. Similarly, the Yields of the Kenya’s 10-year Eurobond maturing in 2028 decreased by 0.1% points to 8.7% as at the end of March 2025 from 8.8% in March 2024, partly attributable to improved investor confidence following the successful buy-back of the 2027 Eurobond maturity, increased IMF Credit funding and the stabilizing of the Kenyan shilling against the dollar. Below is a graph showing the Eurobond secondary market performance of select Eurobonds issued by the respective countries:
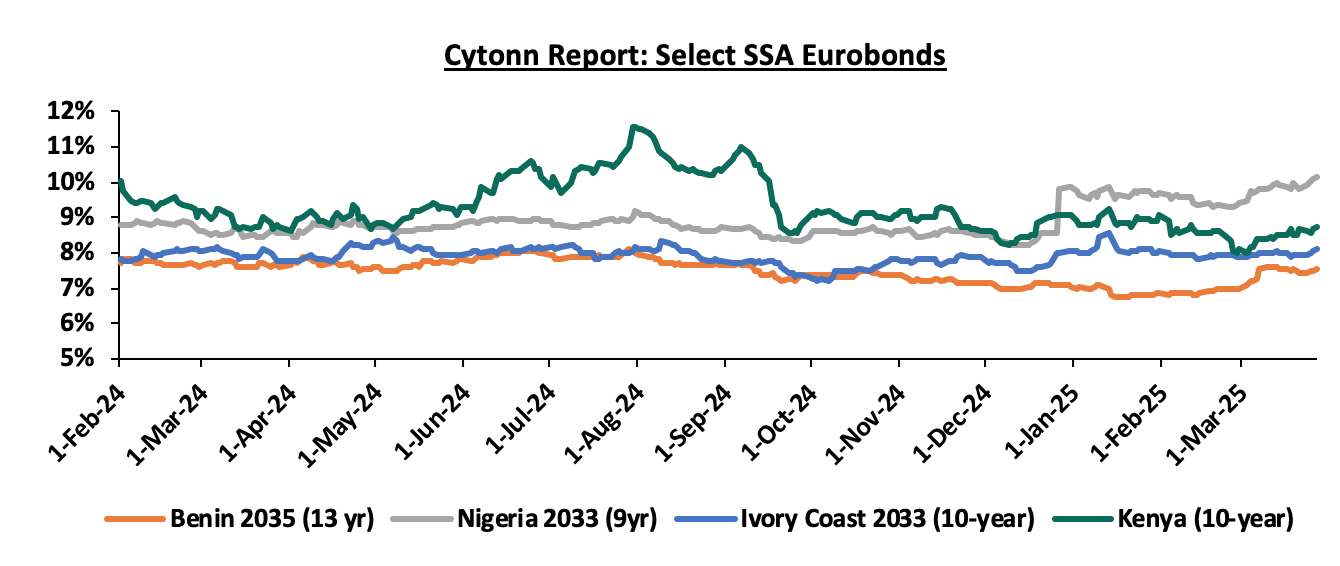
Source: Bloomberg, CBK
Equities Market Performance:
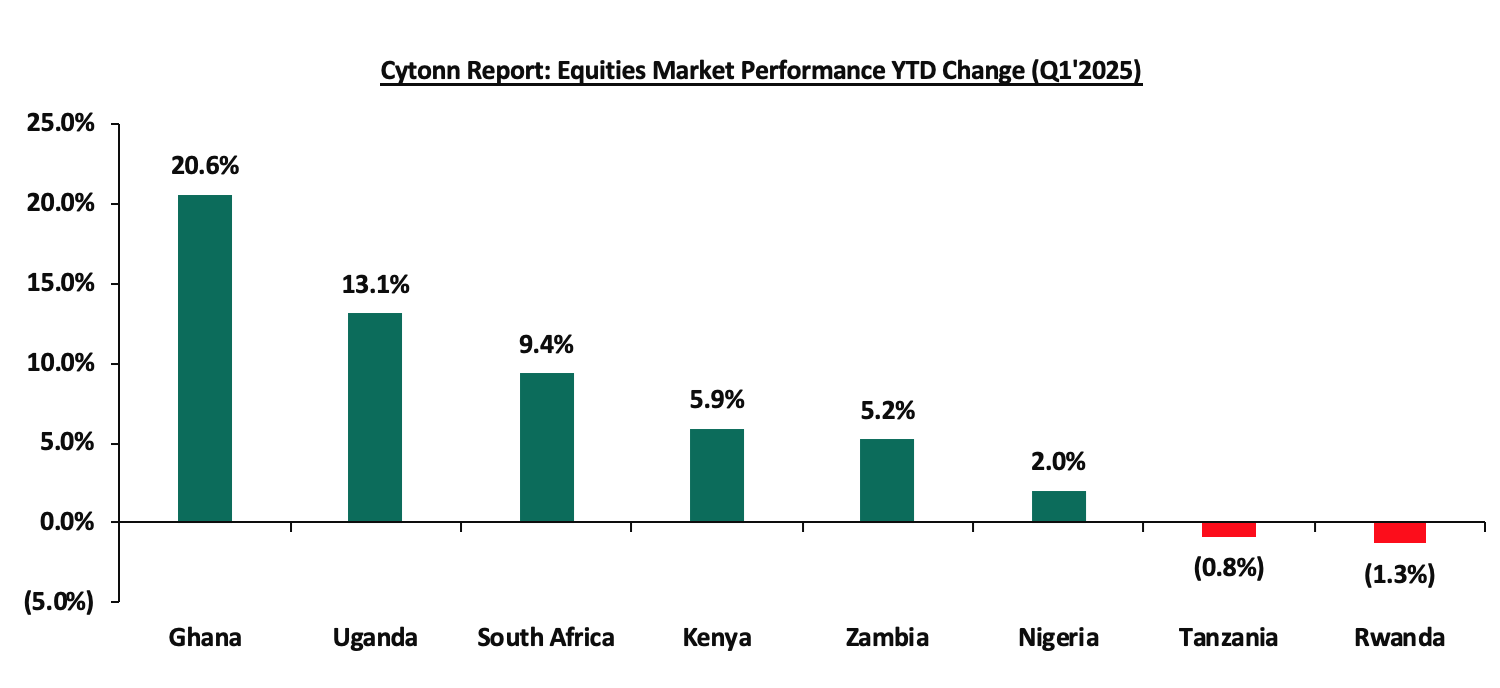
Sub-Saharan Africa (SSA) stock markets recorded mixed performance in Q1’2025, with Ghana’s stock market (GSECI) being the best performing market gaining by 20.6% YTD attributable to gains in the large-cap stocks such as Access Bank, MTN Ghana and Standard Chartered Bank gaining by 74.4%,27.6% and 13.0%, following improved earnings during the period, additionally supported by easing inflation. Rwanda’s RAEASI was the worst performing stock market, declining by 1.3% YTD, mainly attributable to losses recorded by large-cap stocks such as KCB Rwanda and MTN Rwanda of 1.6% and 15.4% respectively. Below is a summary of the performance of key indices:
|
Cytonn Report: Equities Market Performance Q1'2025(Dollarized*) |
||||||
|
Country |
Index |
Mar-24 |
Jan-25 |
Mar-25 |
Last 12 months |
YTD Change |
|
Ghana |
GSECI |
261.8 |
333.8 |
402.5 |
53.7% |
20.6% |
|
Uganda |
USEASI |
0.3 |
0.3 |
0.4 |
29.1% |
13.1% |
|
South Africa |
JALSH |
3,891.5 |
4,502.1 |
4,924.7 |
26.6% |
9.4% |
|
Kenya |
NASI |
0.9 |
1.0 |
1.0 |
17.9% |
5.9% |
|
Zambia |
LASILZ |
524.8 |
578.8 |
608.9 |
16.0% |
5.2% |
|
Nigeria |
NGEASI |
73.9 |
67.5 |
68.8 |
(6.8%) |
2.0% |
|
Tanzania |
DARSDEI |
0.7 |
0.9 |
0.9 |
23.4% |
(0.8%) |
|
Rwanda |
RSEASI |
0.1 |
0.1 |
0.1 |
(4.7%) |
(1.3%) |
|
*The index values are dollarized for ease of comparison |
||||||
Source: Cytonn Research, Kwayisi, Yahoo Finance
The chart below shows the YTD Performance of the sub-Saharan Equities Market;
Dollarized performance
GDP growth in the Sub-Saharan Africa region is expected to slow down, in line with the rest of the global economy. Additionally, public debt continues to be a major headwind, with high debt levels experienced in the region on the back of continued weakening of local currencies, which will make debt servicing costlier, making the region less attractive to foreign capital.
According to the Kenya National Bureau of Statistics (KNBS) Q3’2024 Quarterly Gross Domestic Product Report, the Kenyan economy recorded a 4.0% growth in Q3’2024, lower than the 6.0% growth recorded in Q3’2023. The main contributor to Kenyan GDP remains to be Agriculture, Fishing and Forestry sector which grew by 4.2% in Q3’2024, lower than the 5.1% expansion recorded in Q3’2023. In Q3’2024 all sectors, except Mining and Quarrying and Construction recorded positive growths, with varying magnitudes across activities. Most sectors recorded declining growth rates compared to Q3’2023 with Accommodation and Food Services, Mining and Quarrying and Financial & Insurance Sectors recording the highest declines of 20.8%, 11.9%, and 10.8% points, respectively. Other sectors that recorded a contraction in growth rate, from what was recorded in Q3’2023 were Construction, Electricity and Water Supply and Real Estate sectors, of 6.0%, 2.4%, and 2.2% points respectively. The slowed growth in the economy is majorly attributed to the high cost of borrowing , the low private sector credit growth and the high fuel prices. The Kenyan Economy is projected to grow at an average of 4.8% in 2024, revised from an average of 5.3% after a weaker-than-expected growth in Q2’2024 and Q3’2024, according to various organizations as shown below:
|
Cytonn Report: Kenya 2024 Growth Projections |
|||
|
No. |
Organization |
2024 GDP Projections |
2024 Revised GDP Projections |
|
1 |
International Monetary Fund |
5.3% |
5.0% |
|
2 |
National Treasury |
5.5% |
4.7% |
|
3 |
World Bank |
5.2% |
4.7% |
|
4 |
Fitch Solutions |
5.2% |
4.5% |
|
5 |
Cytonn Investments Management PLC |
5.4% |
4.9% |
|
Average |
5.3% |
4.8% |
|
Source: Cytonn Research
In 2025, the Kenyan economy is expected to rebound, returning to its growth path, with the average projected growth estimated at 5.2% by various organizations as outlined below:
|
Cytonn Report: Kenya 2025 Growth Projections |
||
|
No. |
Organization |
2025 GDP Projections |
|
1 |
International Monetary Fund |
5.0% |
|
2 |
National Treasury |
5.3% |
|
3 |
World Bank |
5.3% |
|
4 |
Fitch Solutions |
5.1% |
|
5 |
Cytonn Investments Management PLC |
5.4% |
|
Average |
5.2% |
|
Source: Cytonn Research
Key to note, Kenya’s general business environment slightly improved in Q1’2025, with the average Purchasing Manager’s Index coming in at 50.9, compared to 50.3 recorded in a similar period in 2024. The improvement was mainly on the back of easing monetary policy stance, reducing the cost of borrowing and increasing spending therefore supporting business activity. The chart below summarizes the evolution of PMI over the last 24 months. (A reading above 50.0 signals an improvement in business conditions, while readings below 50.0 indicate a deterioration):
 Inflation:
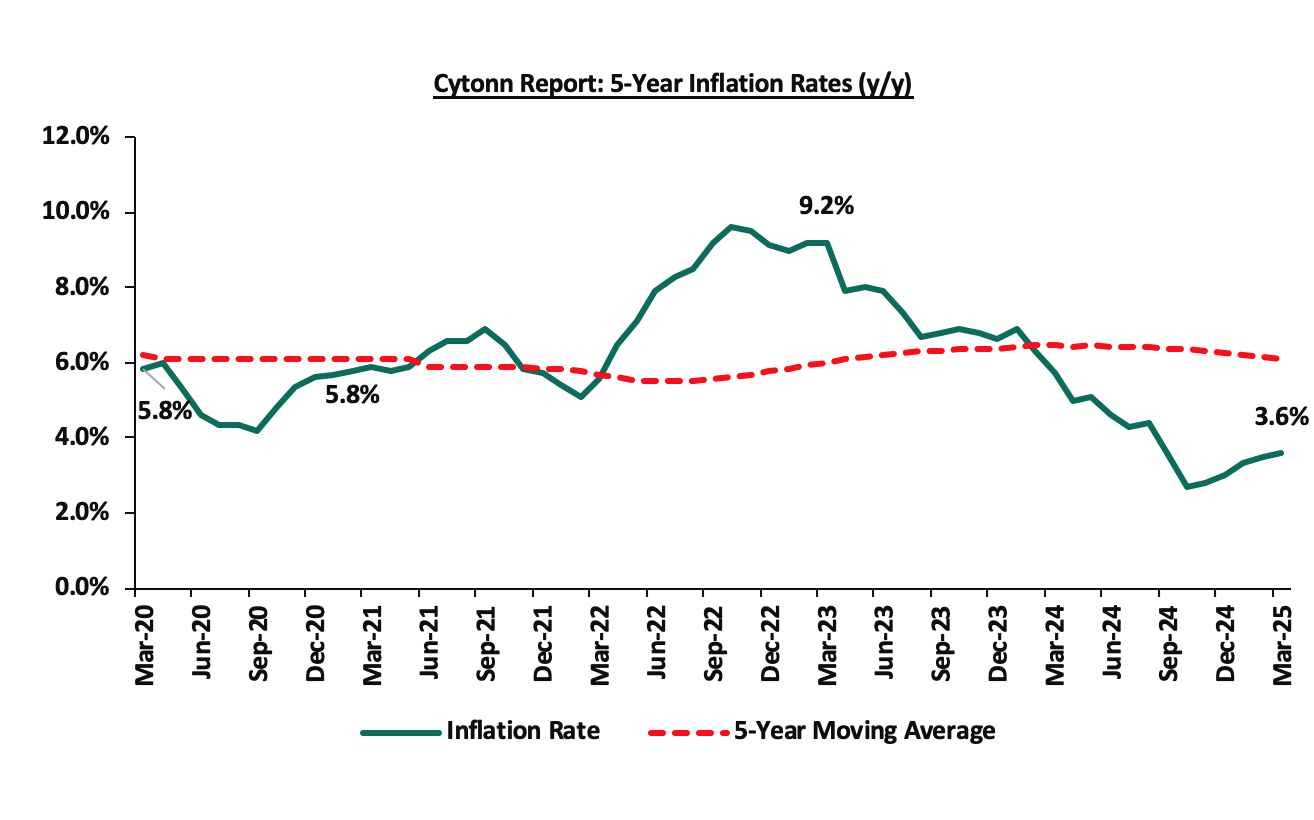
The average inflation rate decreased to 3.5% in Q1’2025, compared to 6.3% in Q1’2024, attributable to a stronger Shilling, and stabilized fuel prices. Notably, the maximum allowed price for Super Petrol and Diesel in March remained unchanged at Kshs 176.6 and Kshs 167.1 respectively from the prices announced for the month of February. Inflation for the month of March 2025 increased to 3.6%, from 3.5% recorded in February 2025, mainly driven by a 0.7% increase in the Food & Non-Alcoholic Beverages category. Below is a chart showing the inflation trend for the last five years:
Over the last 21 months, Kenya’s inflation has persistently remained within the Central Bank of Kenya (CBK) target range of 2.5% - 7.5%, owing to a stronger Shilling and reduced fuel prices. However, risks still persist, particularly due to the high fuel prices and an increasingly accommodative monetary policy, with the MPC on 5th February 2025, cutting the CBR rate by 50 bps to 10.75% from 11.25%. In their meeting this month, we expect further cuts that would increase the money supply and, therefore, may drive inflation upwards.
Going forward, we expect the inflationary pressures to remain within the CBK’s preferred target, mainly on the back of a stable Shilling, and stable fuel prices. However, the loosening monetary policy, the still elevated, though stabilized fuel prices, and the increasing electricity prices remain a risk for the inflation rate.
March 2025 Inflation
The y/y inflation in March 2025 increased slightly by 0.1% points to 3.6%, from the 3.5% recorded in February 2025. This was in line with our projected range of 3.6% to 3.8%, where our decision was mainly driven by the easing in the Central Bank Rate (CBR) to 10.75% in February 2025, slight depreciation of the Kenya Shilling against the US Dollar and increased electricity prices in March 2025. The headline inflation in March 2025 was majorly driven by increases in prices of commodities in the following categories; Food & Non-Alcoholic Beverages, and Transport sector which grew by by 6.6% and 1.5% respectively. However, the commodity prices in Housing, Water, Electricity, Gas & other fuels declined by 0.8%.
|
Cytonn Report: Major Inflation Changes – March 2025 |
|||
|
Broad Commodity Group |
Price change m/m (March-2025/ February -2025) |
Price change y/y (March-2025/March-2024) |
Reason |
|
Food and non-alcoholic beverages |
0.7% |
6.6% |
The m/m increase was mainly driven by the increase in prices of commodities such as kales, Irish potatoes and maize grain (loose) by 6.2%, 4.5% and 3.3% respectively. However, the increase was weighed down by decreases in prices of sugar and beans by 0.7% and 0.2% respectively |
|
Transport |
0.2% |
1.5% |
The transport index recorded a slight m/m increase mainly due to a 3.9% increase in local flights prices. Prices of Super Petrol and Diesel remained unchanged at Kshs 176.6 and Kshs 167.1 respectively |
|
Housing, water, electricity, gas and other fuels |
0.2% |
(0.8%) |
The m/m increase was mainly driven by an increase in prices of gas/LPG by 0.2% coupled with an increase in prices of 50kWh electricity and 200kWh electricity by 1.0% and 0.9% respectively. |
|
Overall Inflation |
0.4% |
3.6% |
The m/m increase was mainly attributable to the 0.7% increase in food and non-alcoholic beverages. |
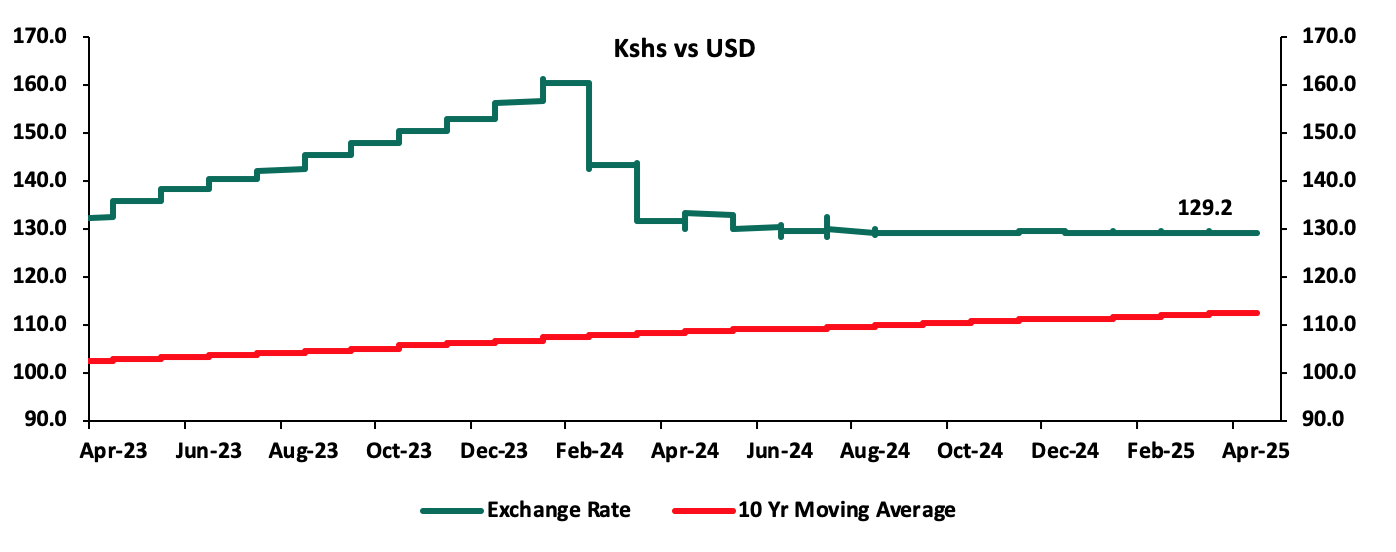
Notably, March’s overall headline inflation increased slightly for the fifth consecutive month, remaining within the CBK’s preferred range of 2.5%-7.5% for the twenty first consecutive month. The increase in headline inflation in March 2025 comes amid the maximum allowed price for Super Petrol and Diesel remaining unchanged at Kshs 176.6 and Kshs 167.1 respectively. Despite fuel prices remaining unchanged, prices are still high, resulting in high production costs and high costs of goods and services. Additionally, the reduction in the CBR to 10.75% from 11.25% is likely to increase the money supply through lower borrowing costs, which may cause a slight rise in inflation rates as the effects of the CBR gradually take hold in the broader economy. The Kenya Shilling also recorded a 4.7 bps year-to-date appreciation to Kshs 129.2, from the Kshs 129.3 recorded at the beginning of the year. This stabilization in the exchange rate and fuel prices is however expected to continue anchoring inflationary pressures in the country remaining within the CBK’s preferred range of 2.5%-7.5%. The chart below shows the inflation rates for the past 5 years:
Going forward, we expect inflation to remain within the CBK’s preferred range of 2.5%-7.5%, mainly on the back of a stable currency and stable fuel prices. Additionally, favourable weather conditions will also contribute to stabilizing food prices, further supporting stable inflation rates. The risk, however, lies in the fuel prices which despite their stability, still remain elevated compared to historical levels. Additionally, the Monetary Policy Committee cut the Central Bank Rate by 50.0 bps to 10.75% from 11.25% in its February 2025 meeting, with the aim of easing the monetary policy, while maintaining exchange rate stability, and will meet again in April 8th 2025. This cut in the Central Bank Rate is likely to elevate inflationary pressures gradually as consumer spending rises leading to demand- pull inflation. The committee is expected to lower rates further, though gradually, to provide further support for the economy.
The Kenyan Shilling:
The Kenyan Shilling remained stable during the quarter, depreciating slightly against the US Dollar by 1.8 bps in Q1’2025, to close at Kshs 129.3, relatively unchanged from end of FY’2024, possibly attributable to reduced foreign inflows during the quarter as a result of the lower interest rates following the Monetary Policy Committee decision to cut the Central Bank Rate (CBR) to 10.75%, and higher liquidity increasing money supply of the local currency relative to the dollar. During the week, the Kenya Shilling appreciated against the US Dollar by 5.5 bps to Kshs 129.2 from the Kshs 129.3 recorded the previous week.
We expect the shilling to be supported by:
- Diaspora remittances standing at a cumulative USD 4,956.5 mn in the twelve months to February 2025, 14.5% higher than the USD 4,329.7 mn recorded over the same period in 2024. These has continued to cushion the shilling against further depreciation. In the February 2025 diaspora remittances figures, North America remained the largest source of remittances to Kenya accounting for 53.0% in the period,
- The tourism inflow receipts which came in at Kshs 452.2 bn in 2024, a 19.8% increase from Kshs 377.5 bn inflow receipts recorded in 2023, and owing to tourist arrivals that improved by 14.6% to 2,394,376 in 2024 from 2,089,259 in 2023, and,
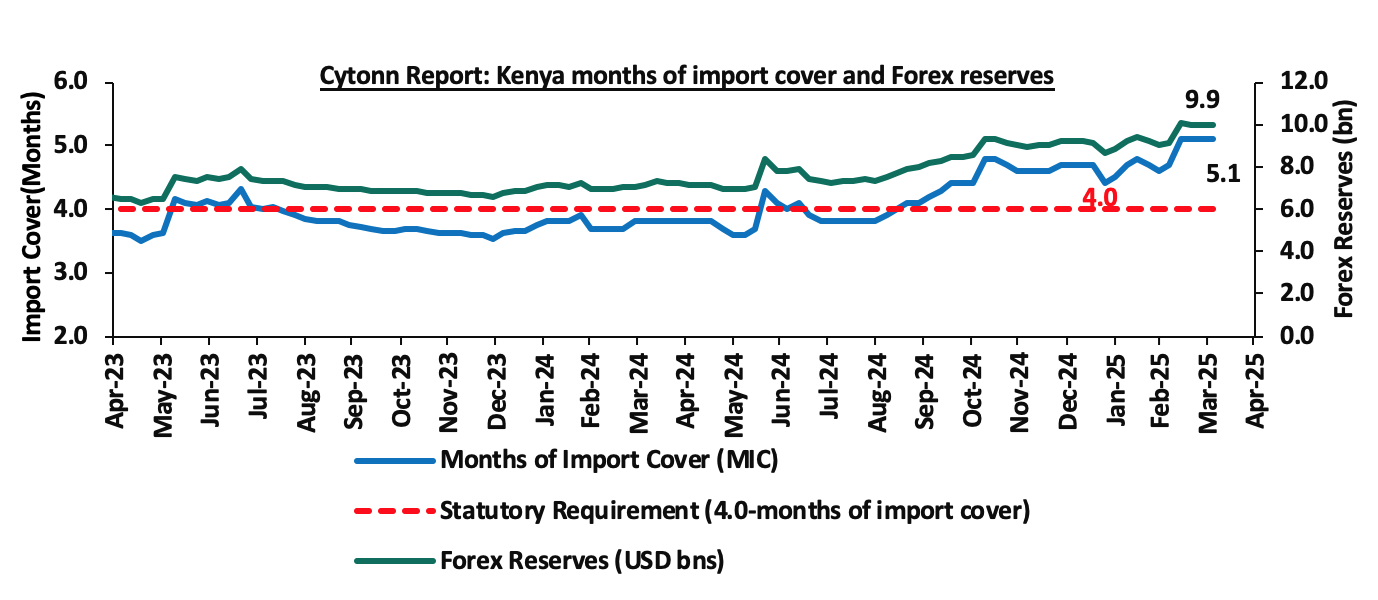
- Improved forex reserves currently at USD 9.9 bn (equivalent to 5.1-months of import cover), which is above the statutory requirement of maintaining at least 4.0-months of import cover and above the EAC region’s convergence criteria of 4.5-months of import cover.
The shilling is however expected to remain under pressure in 2025 as a result of:
- An ever-present current account deficit which came at 4.0% of GDP in Q3’2024, and,
- The need for government debt servicing, continues to put pressure on forex reserves given that 62.1% of Kenya’s external debt is US Dollar-denominated as of September 2024.
Key to note, during the quarter, Kenya’s forex reserves increased by 8.2% to close at USD 10.0 bn from the USD 9.2 recorded at the start of the quarter. The chart below summarizes the evolution of Kenya's months of import cover over the years:
Monetary Policy:
The Monetary Policy Committee (MPC) met once in Q1’2025, where the Central Bank Rate was cut by 50 bps to 10.75% from the 11.25% , noting that its previous interventions had successfully stabilized exchange rate pressures, and anchored inflation with inflation coming at 3.3%, 3.5 and 3.6% in January, February and March 2025 respectively, remaining within and below the mid-point of the CBK target range of 2.5%-7.5%. Below are some of the key highlights from the February 2025 meeting:
- The overall inflation increased marginally by 0.3% points to 3.3% in January 2025, from 3.0% in December 2024, positioning it below the mid-point of the preferred CBK range of 2.5%-7.5%. Core inflation decreased to 2.0% in January 2025, from 2.2% in December 2024, reflecting subdued demand pressures in the economy. This decline was largely attributed to lower prices of processed food items, particularly sugar, maize, and wheat products. Conversely, non-core inflation increased to 7.1% in January 2025, from 5.2% in December 2024, driven by higher prices of food crops, especially vegetables, due to seasonal factors. Lower energy and utilities costs, including reduced electricity and fuel prices, continued to help moderate non-core inflation. Overall inflation is expected to stay below the mid-point of the target range in the near term, supported by low and stable core inflation, an anticipated reduction in energy prices, and a stable exchange rate.
- In January 2025, the Kenya National Bureau of Statistics (KNBS) and the Central Bank of Kenya (CBK) jointly introduced core and non-core inflation figures in Kenya. Core inflation excludes items with highly volatile or transient prices from the overall Consumer Price Index (CPI), offering a clearer view of underlying inflation trends. Alongside overall inflation, CBK will now monitor core and non-core inflation numbers, aligning with global best practices of inflation-targeting central banks. This initiative also adheres to the East African Community (EAC) guidelines for harmonized CPI computation. The core CPI basket includes 275 items, representing 81.1% of the overall CPI weight, making it a more accurate tool for tracking inflation trends, closely aligned with overall inflation.
- The recently released Quarterly Gross Domestic Product Report, for Q3’2024 showed a slowdown in the performance of the Kenyan economy, with real GDP growing by 4.0%, slower than the 6.0% recorded a similar period in 2023. This was attributable to deceleration in growth in most sectors of the economy, particularly agriculture and forestry, real estate, financial and insurance, information and communication, and transport and storage. The economy is expected to continue to strengthen in 2025 with real GDP growth projected to come in at 5.4%, from the 4.6% growth projected for 2024. The growth is supported by resilient services sector, expected recovery in growth of credit to the private sector, sustained performance in agriculture, and enhanced exports. However, this positive outlook is tempered by potential risks, including geopolitical tensions.
- Goods exports increased by 15.4% in the 12 months to December 2024, compared to 2023, reflecting a rise in exports of agricultural commodities and re-exports. Goods imports rose by 9.9% reflecting increases in intermediate and capital goods imports. The current account deficit as at December 2024 is estimated at 3.7% of GDP, down from 4.0% in 2023, driven by stronger goods exports, robust diaspora remittance inflows, and reduced oil imports. In 2024, diaspora remittances rose by 18.0% totalling to USD 4,945.0 from USD 4,190.0 in 2023 and tourist arrivals in 2024 increased by 14.6%. The current account deficit was fully financed by capital and financial inflows, leading to an overall balance of payments surplus of USD 1,466.0 mn. This surplus, combined with IMF disbursements, resulted in a USD 2,749.0 mn build-up in gross reserves. For 2025, the current account deficit is projected at 3.8% of GDP and is expected to be fully financed by capital and financial inflows, yielding a balance of payments surplus of USD 591.0 mn and an increase in gross reserves of USD 1,451.0 mn.
- The CBK foreign exchange reserves, which currently stand at USD 9, 219.0 and representing 4.7 months of import cover, continue to provide adequate cover and a buffer against any short-term shocks in the foreign exchange market,
- The banking sector remains stable and resilient, with strong liquidity and capital adequacy ratios. The ratio of gross non-performing loans (NPLs) to gross loans decreased to 16.4% in December 2024 compared to 16.5% in October 2024. Decreases in NPLs were noted in the manufacturing, trade, building and construction, real estate and energy and water sectors. Banks have continued to make adequate provisions for the NPLs,
- The CEOs Survey and Market Perceptions Survey conducted ahead of the MPC meeting revealed an improved optimism about business activity and economic growth prospects for the next 12 months. The optimism was attributed to the stable macroeconomic environment reflected in the low inflation rate and stability in the exchange rate, expectations of a decline in interest rates, favorable weather conditions supporting agriculture, resilience of the services sector, and improved global growth prospects. Nevertheless, respondents expressed concerns about high cost of doing business and subdued consumer demand,
- The Survey of the Agriculture Sector for January 2025 revealed an expectation for moderate upward pressure on overall headline inflation in the next three months, on account of higher vegetables and cereals prices attributed to seasonal factors. Nevertheless, respondents expressed that stability in pump prices and exchange rate are expected to moderate inflation,
- Global growth is expected to continue to recover and is projected at 3.3% in 2025 from an estimate of 3.2% in 2024, attributable to strong growth in the United States, strong growth in some large emerging market economies such as India, and improved growth prospects in the United Kingdom. The main risk to the global growth outlook relates to an elevated uncertainty on trade policy amid rising tariffs on imports and further escalation of geopolitical tensions particularly the conflict in the Middle East and the Russia-Ukraine war
- Global headline inflation has eased; however, the rate of decline has slowed in major economies due to persistent core inflation. Central banks in these economies have continued to reduce interest rates, though at varying speeds based on their inflation and growth projections. While international oil prices have moderated, the risk of volatility remains high, fuelled by rising import tariffs and ongoing geopolitical tensions. Meanwhile, food inflation has risen, primarily due to higher edible oil prices.
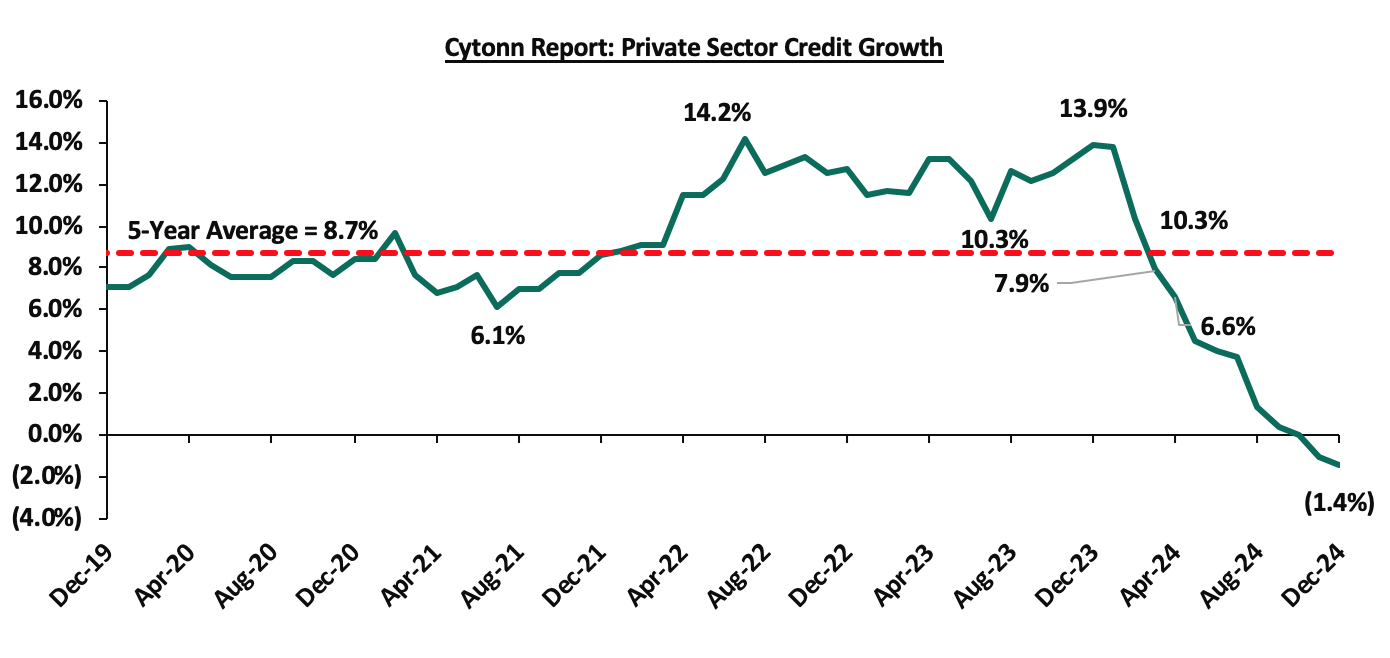
- Growth in private sector credit contracted by 1.4% in December 2024 compared to the previous year, mainly attributed to exchange rate valuation effects on foreign currency-denominated loans due to the appreciation of the Shilling and reduced demand attributable to high lending interest rates. In December, local currency loans stood at 2.1%, while foreign currency loans, which make up around 26.0% of total loans, decreased by 11.4%. The chart below shows the movement of the private sector credit growth over the last five years:
- The Committee acknowledged the ongoing implementation of the FY’2024/25 Supplementary Budget I. These measures are anticipated to further support fiscal consolidation, reducing the fiscal deficit to 4.3% of GDP in FY’2024/25, from 5.3% of GDP in FY’2023/24. The fiscal consolidation in the medium-term should reduce debt vulnerabilities while moving the present-value-of-debt to GDP ratio towards the target anchor of 55.0%.
The MPC noted that overall inflation is expected to stay below the midpoint of the target range of 2.5%–7.5% in the near term. This outlook is supported by stable core inflation, low energy prices, and a stable exchange rate which is largely attributed to its earlier tight monetary policy stance. As a result, the MPC has shifted to a more accommodative monetary policy, reducing the Central Bank Rate (CBR) by a cumulative 225 bps to 10.75% by February 2025 from 13.0% in June 2024. Additionally, central banks in major economies have continued to lower interest rates at varying paces. The Committee also noted that economic growth slowed in 2024, creating room for further easing of monetary policy to support economic activity while maintaining exchange rate stability. The MPC stated that the CRR reduction would release additional liquidity to banks, which is expected to reduce the cost of funds, lower lending rates, and boost private sector credit growth. The Committee observed that despite significant reductions in the CBR since the August 2024 meeting, lending rates have only marginally declined. It emphasized that banks must take further action to reduce lending rates to stimulate private sector credit growth and support economic activity. To ensure compliance with the Risk-Based Credit Pricing Model (RBCPM), the CBK decided to initiate on-site inspections of banks to verify their alignment with the RBCPM in reducing interest rates. Recent amendments to the Banking Act empower the CBK to penalize any bank that fails to pass on the reduced cost of funds to borrowers. The MPC noted that it will continue to monitor the effects of these policy measures, as well as global and domestic economic developments, and will remain ready to take additional action if necessary. The next MPC meeting is scheduled for April 2025.
Fiscal Policy:
The execution of the FY’2024/25 budget has been largely smooth, despite facing challenges in July and August 2024 due to demonstrations that disrupted economic activities. These disruptions led to a decline in revenue collection, increased debt servicing costs, and the need to address outstanding expenditure carryovers from FY’2023/24, as well as pending bills. Additionally, there have been rising expenditure pressures driven by increased demand for additional resources and as a result, the National Treasury presented the Supplementary Estimates II for the Fiscal Year 2024/25 to the National Assembly.
The table below summarizes the overall change in the FY’2024/25 budget estimates.
|
Cytonn Report: FY’2024/25 Supplementary Budget Estimates II (Kshs bn) |
|||||
|
Item |
Original Approved Estimates FY’2024/25 (a) |
Supplementary Estimates I FY’2024/25 (b) |
Supplementary Estimates II FY’2024/25 (c) |
% Change (c/a) |
% Change (c/b) |
|
Recurrent Expenditure |
1,632.1 |
1,591.6 |
1,728.6 |
5.9% |
8.6% |
|
Development Expenditure |
746.3 |
641.2 |
590.1 |
(20.9%) |
(8.0%) |
|
Ministerial National Government Expenditure |
2,378.4 |
2,232.8 |
2,318.6 |
(2.5%) |
3.8% |
|
Consolidated Fund Services |
1,213.5 |
1,237.2 |
1,242.7 |
2.4% |
0.4% |
|
County Equitable Allocation |
400.1 |
411.0 |
418.3 |
4.5% |
1.8% |
|
Total Expenditure |
3,992.0 |
3,880.9 |
3,979.6 |
(0.3%) |
2.5% |
Source: The National Treasury
Key take outs from the table include;
- The recurrent expenditure (Costs incurred to cover regular government expenses such as salaries, operational costs and maintenance costs) increased by 8.6% to Kshs 1,728.6 bn in the Supplementary Estimates II from Kshs 1,591.6 bn in the Supplementary Estimates I, and by 8.6% from Kshs 1,632.1 bn in the original estimates, an indication of the government's initiative to increase expenditure allocation to boost public services, responding to economic growth and ensuring the well-being of its citizens,
- Development expenditure (Costs incurred in order to create assets that will provide long term public infrastructure such as roads, hospitals, and schools) declined by 8.0% to Kshs 590.1 bn in the Supplementary Estimates II from Kshs 641.2 bn in the Supplementary Estimates I, and by 20.8%% from Kshs 746.3 bn in the original estimates a detriment to the sectors such as infrastructure, energy, water and health that require heavy development financing,
- The Ministerial National Government expenditure estimates for the FY’2024/25 Supplementary Budget II is set to increase by 3.8% to Kshs 2,318.6 bn from Kshs 2,232.8 bn Supplementary Budget I translating to an increase of Kshs 85.9 bn in expenses for the government. This increase is mainly due to the increasing expenditure in various sectors and public services,
- Consolidated Fund Services (CFS) (refers to the Consolidated Fund established in the Kenya’s constitution into which development partners deposit funds before disbursing to the Exchequer accounts for projects such as servicing of public debt, and subscription to International Organizations) has increased by 0.4% to Kshs 1,242.7 bn from Kshs 1,237.2 bn in the Supplementary Budget I and further by 4.5% from Kshs 1,213.5 in the original estimates, and,
- The County Equitable Share (allocation on national government revenue to county governments) increased by 1.8% to Kshs 418.3bn from Kshs 411.0 bn in the Supplementary Estimates I.
Notably, for the FY’2024/2025, from the figures released by the National Treasury for revenue and net expenditures collected as at the end of February 2025, total revenue collected amounted to Kshs 1,403.7 bn, equivalent to 56.7% of the revised estimates of Kshs 2,475.1 bn for FY’2024/2025 and is 85.1% of the prorated estimates of Kshs 1,650.0 bn. The total expenditure amounted to Kshs 2,316.1 bn, equivalent to 55.0% of the revised estimates of Kshs 4,207.9 bn, and is 82.6% of the prorated target expenditure estimates of Kshs 2,805.3 bn.
Going forward, we believe that the coming months’ revenue collection performance will largely depend on how quickly the country’s business climate stabilizes. We therefore expect the government to cut on its expenditure, mostly the development expenditure in order to finance the growing debt maturities and the ballooning recurrent expenditure.
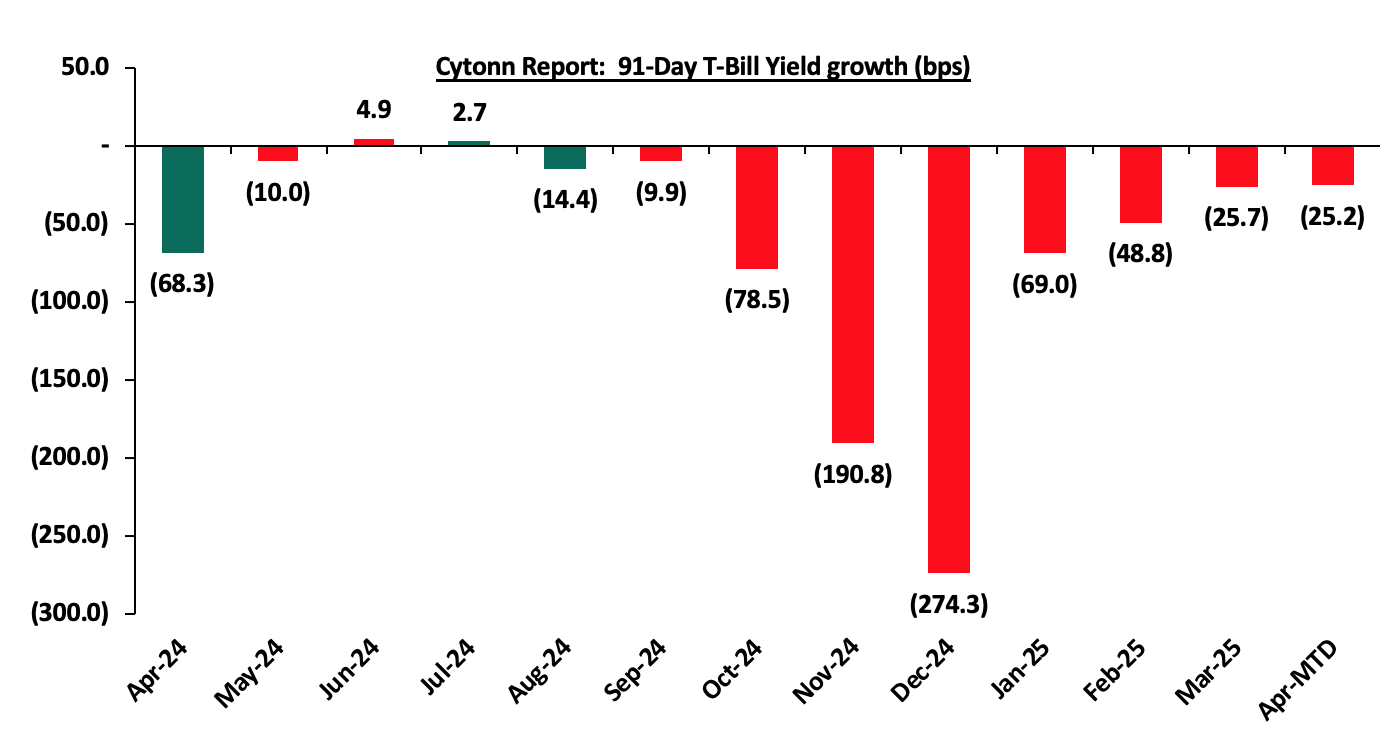
During the quarter, T-bills were oversubscribed, with the overall subscription rate coming in at 136.1%, up from 132.6% in Q1’2024. Investors’ preference for the 91-day paper persisted as they sought to avoid duration risk, with the paper receiving bids worth Kshs 424.6 bn against the offered Kshs 52.0 bn, translating to an oversubscription rate of 221.1%, albeit lower than the subscription rate of 494.4% recorded in the previous year same period. Overall subscriptions for the 364-day and 182-day papers increased significantly to 140.4% and 97.8%, from 64.3% and 56.3% in Q1’2024, respectively. The yields on all the papers were on a downward trajectory with the average yields on the 91-day, 182-day, and 364-day papers decreasing by 7.3%, 7.0%, and 5.9% points to 9.2%, 9.5%, and 10.8%, from 16.4%, 16.6%, and 16.7%, respectively, recorded in Q1’2024. The downward trajectory in yields is mainly due to high liquidity in the money market which allowed the government to front load most of its borrowing. The acceptance rate during the period came in at 86.4%, albeit lower than the 88.8% recorded in Q1’2024, with the government accepting a total of Kshs 366.8 bn out of the Kshs 424.6 bn worth of bids received. The chart below shows the yield growth rate for the 91-day paper in 2024 and during the year:
During the week, T-bills were oversubscribed for the first time in two weeks, with the overall subscription rate coming in at 169.5%, a reversal from the undersubscription rate of 61.4% recorded the previous week. Investors’ preference for the shorter 91-day paper persisted, with the paper receiving bids worth Kshs 11.2 bn against the offered Kshs 4.0 bn, translating to an oversubscription rate of 279.5%, higher than the undersubscription rate of 69.8%, recorded the previous week. The subscription rates for the 182-day paper increased to 44.9% from the 17.1% recorded the previous week while the 364-day paper increased to 250.1% from the 102.5% recorded the previous week. The government accepted a total of Kshs 40.5 bn worth of bids out of Kshs 40.7 bn bids received, translating to an acceptance rate of 99.7%. The yields on the government papers were on a downward trajectory with the yields on the 91-day paper decreasing the most by 16.1 bps to 8.6% from 8.8% recorded the previous week. The yields on the 364-day paper decreased by 2.5 bps to remain relatively unchanged from the 10.4% recorded the previous week while the 182-day paper decreased by 2.3 bps to 9.0% from the 9.1% recorded the previous week
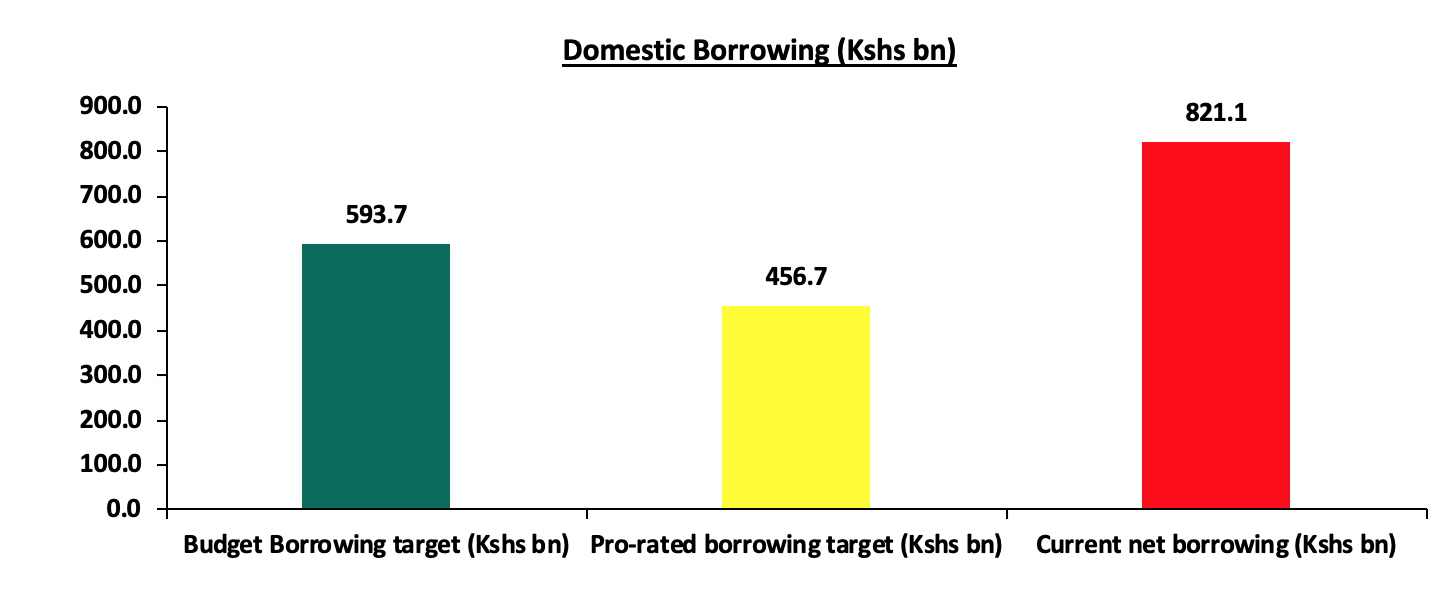
So far in the current FY’2024/25, government securities totalling Kshs 1,459.0 bn have been advertised. The government has accepted bids worth Kshs 1,786.8 bn, of which Kshs 1,151.2 bn and Kshs 635.6 bn were treasury bills and bonds, respectively. Total redemptions so far in FY’2024/25 equal to Kshs 965.7 bn, with treasury bills accounting for Kshs 916.7 bn, and 49.0 bn for treasury bonds. As a result, currently, the government has a domestic borrowing surplus of Kshs 227.4 bn, which is 38.3% of the total net domestic borrowing target of Kshs 593.7 bn for FY’2024/25. The chart below shows government’s current borrowing position:
The chart below compares the overall average T-bills subscription rates obtained in 2022, 2023, 2024, and 2025 Year to Date (YTD):
Primary T-bond Auctions in Q1’2025:
During the quarter, the government re-opened five bonds, seeking to raise Kshs 125.0 bn during the quarter. The bonds were generally oversubscribed, receiving bids worth Kshs 299.9 bn against the offered Kshs 125.0 bn, translating to a subscription rate of 239.9%. The government accepted Kshs 214.5 bn of the Kshs 299.9 bn worth of bids received, translating to an acceptance rate of 71.5%. The table below provides more details on the bonds issued during the quarter:
|
Cytonn Report: Bond Issuances in Q1’2025 |
||||||||||
|
Issue Date |
Bond Auctioned |
Effective Tenor to Maturity (Years) |
Coupon |
Amount offered (Kshs bn) |
Actual Amount Raised (Kshs bn) |
Total bids received |
Average Accepted Yield |
Subscription Rate |
Acceptance Rate |
|
|
10/03/2025 |
FXD1/2018/025 - Reopened |
18.3 |
13.4% |
25.0 |
35.2 |
47.0 |
13.8% |
188.0% |
75.0% |
|
|
17/02/2025 |
IFB1/2022/014 - Reopened |
11.8 |
13.9% |
70.0 |
65.3 |
93.1 |
14.0% |
411.3% |
45.4% |
|
|
IFB1/2023/017 - Reopened |
15.1 |
14.4% |
65.6 |
100.8 |
14.3% |
|
||||
|
20/01/2025 |
FXD1/2022/025 -Reopened |
22.8 |
14.2% |
30.0 |
24.7 |
28.4 |
15.7% |
196.7% |
87.0% |
|
|
FXD1/2018/015-Reopened |
8.3 |
12.7% |
23.8 |
30.6 |
14.2% |
77.7% |
||||
|
Q1’2025 Total |
|
|
125.0 |
214.5 |
299.9 |
|
|
|
||
|
Q1’2024 Total |
|
|
200.0 |
334.6 |
440.5 |
|
|
|
||
|
Q1’2025 Average |
15.3 |
13.7% |
|
|
|
14.4% |
239.9% |
71.5% |
||
|
Q1’2024 Average |
5.1 |
17.5% |
|
|
|
18.3% |
220.2% |
76.0% |
||
Source: CBK
During the quarter, the government re-opened five treasury bonds, including FXD1/2018/025, IFB1/2022/014, IFB1/2023/017, FXD1/2018/015, and FXD1/2022/025, with weighted average yields of 13.8%, 14.0%, 14.3%, 14.2% and 15.7% respectively, and fixed coupon rates of 13.4%, 13.9%, 14.4%, 12.7% and 14.2% respectively.
Also, during the quarter, the government announced its first-ever domestic treasury bond buyback aiming to buyback Kshs 50.0 bn of Kshs 185.1 bn for the FXD1/2020/005, FXD1/2022/003 and IFB1/2016/009 with tenors to maturity of 0.4 years, 0.3 years and 0.4 years respectively, and fixed coupon rates of 11.7%, 11.8% and 12.5% respectively. The total outstanding amounts for the FXD1/2020/005, FXD1/2022/003 and IFB1/2016/009 were Kshs 104.5 bn, Kshs 60.6 bn and Kshs 19.9 bn each respectively. The offer was oversubscribed, with the overall subscription rate coming in at 112.2%, receiving bids worth Kshs 56.1 bn against the offered Kshs 50.0 bn. The government accepted bids worth Kshs 50.1 bn, translating to an acceptance rate of 89.3%, and equivalent to 27.1% of the total outstanding amount of Kshs 185.1 bn for the three bonds. The weighted average yield for the accepted bids for the FXD1/2022/003, FXD1/2020/005 and IFB1/2016/009 came in at 9.1%, 8.9% and 9.1% respectively.
During the week, the Central Bank of Kenya released the auction results for the re-opened treasury bonds FXD1/2020/015, FXD1/2022/015 and FXD1/2022/025 with tenors to maturity of 9.9 years, 12.1 years and 22.6 years respectively and fixed coupon rates of 12.8% 13.9% and 14.2% respectively. The bonds were oversubscribed, with the overall subscription rate coming in at 102.5%, receiving bids worth Kshs 71.7 bn against the offered Kshs 70.0 bn. The government accepted bids worth Kshs 71.4 bn, translating to an acceptance rate of 99.5%. The weighted average yield for the accepted bids for the FXD1/2020/015, FXD1/2022/015 and FXD1/2022/025 came in at 13.7%, 13.8% and 14.2%. Notably, the 13.7% on the FXD1/2020/015 was relatively unchanged from the last tap sale in March 2022 while the 13.8% on the FXD1/2022/015 was lower than the 14.2% recorded on the last time it was reopened in January 2023 and the 14.2% on the FXD1/2022/025 was lower than the 15.7% recorded the last time it was reopened in January 2025. With the Inflation rate at 3.6% as of March 2025, the real returns of the FXD1/2018/025, FXD1/2022/015 and FXD1/2022/025 are 10.1%, 10.2% and 10.6%. Given the withholding tax of 10.0%% for the three bonds, a shorter-term bond subject to 15.0% withholding tax would need to offer an equivalent yield of 14.5%, 14.6% and 15.0% for the FXD1/2020/015, FXD1/2022/015 and FXD1/2022/025 respectively.
Secondary Bond Market Activity:
- Bond Turnover
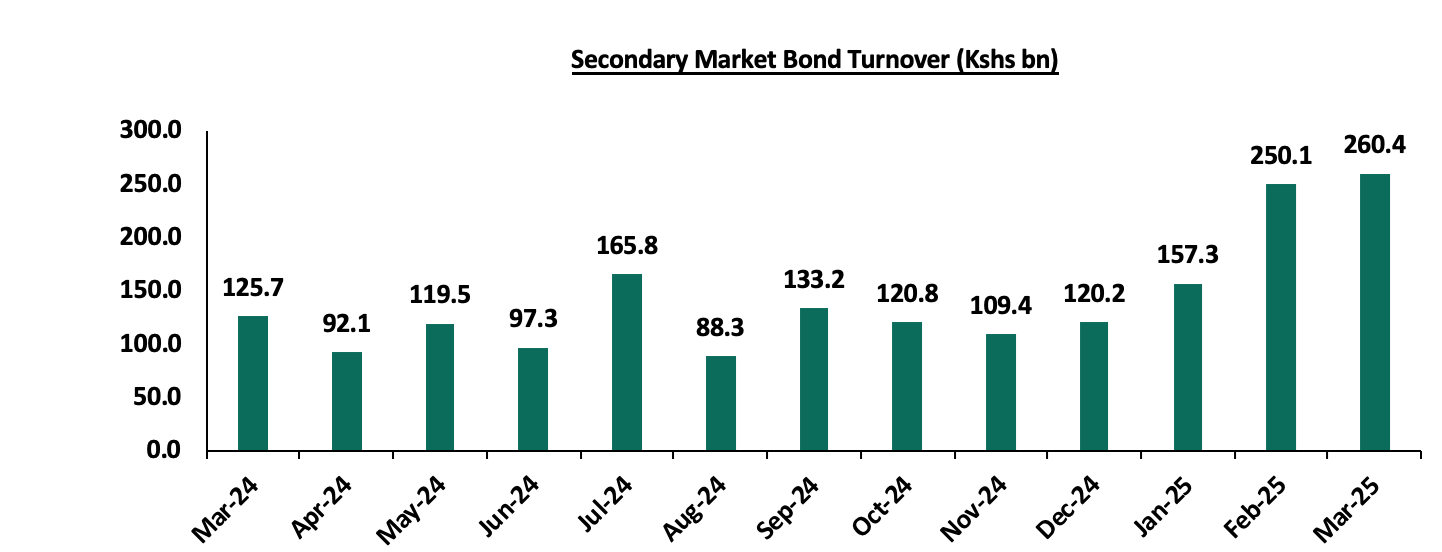
In the secondary bond market, activity increased, with the turnover increasing by 45.4% to Kshs 667.8 bn, from Kshs 459.3 bn in Q1’2024, pointing towards increased activities by commercial banks in the secondary bond market. Similarly, on a year-on-year basis, the bond turnover increased by 107.2% to Kshs 260.4 in March 2025, from Kshs 125.7 bn worth of treasury bonds transacted over a similar period last year. The chart below shows the bond turnover over the past 12 months;
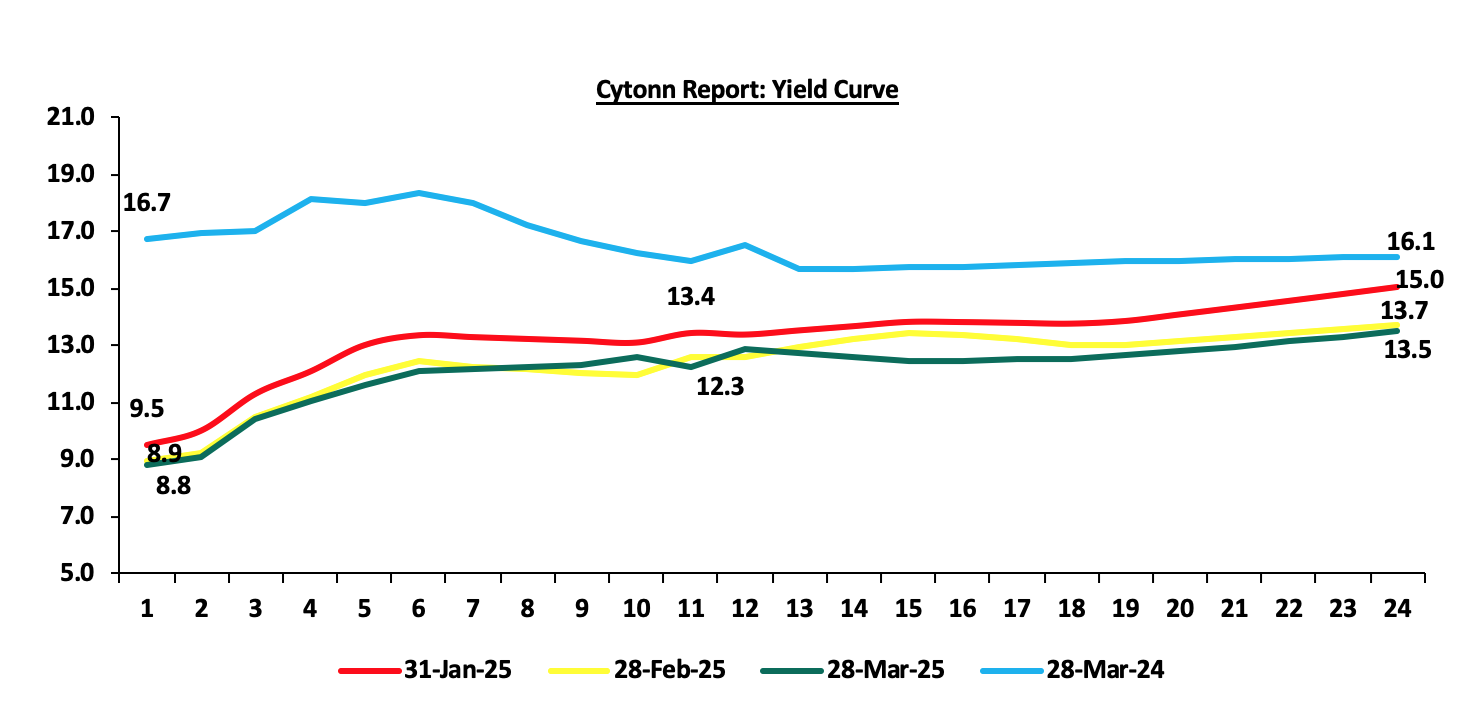
- Yield Curve
During Q1’2025, yields on the government securities were on a downward trajectory compared to the same period in 2024. This was primarily driven by continued effort by the government to reject highly priced bids, local currency stabilization, and eased inflation. These factors reduced the need for investors to demand higher yields as compensation for inflation and currency depreciation risks, resulting in an overall decline across the yield curve. Notably, the yield curve has adjusted from a humped yield curve observed in 2023 and most part of 2024, towards a normal upward sloping curve, with long-term bonds registering highest yields. The shift in sentiment indicates increased confidence in the economic landscape. The chart below shows the yield curve movement during the period:
Money Market Performance:
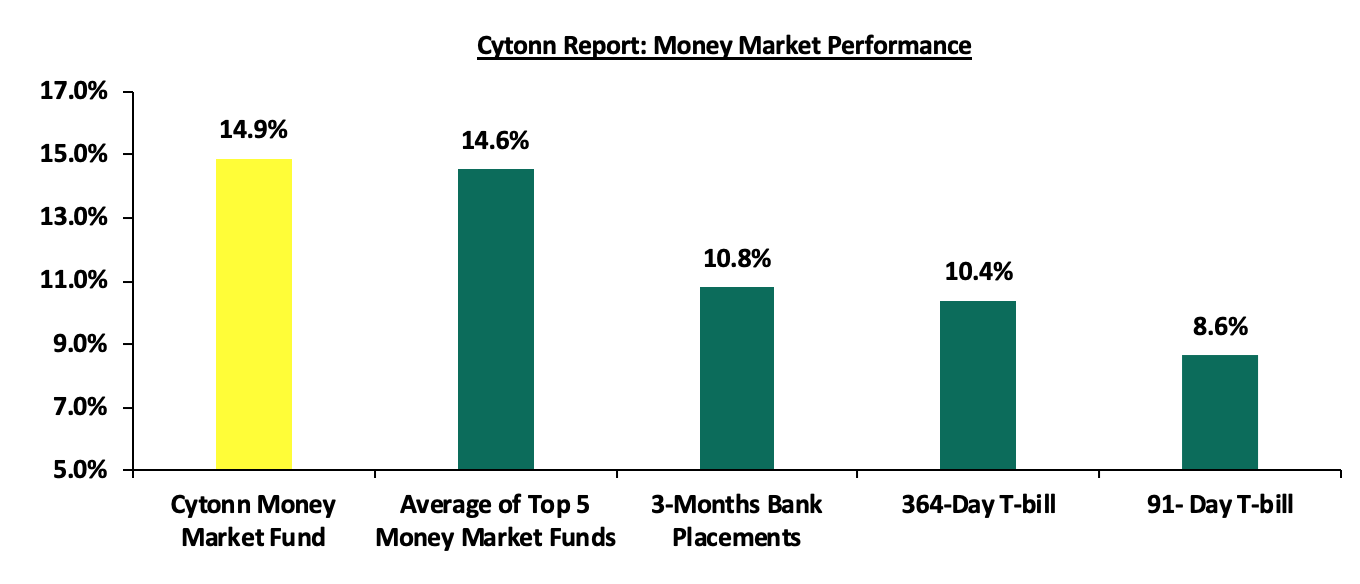
In the money markets, 3-month bank placements ended the week at 10.8% (based on what we have been offered by various banks), the yields on the government papers were on a downward trajectory with the yields on the 364-day paper decreasing by 2.5 bps to remain relatively unchanged from the 10.4% recorded the previous week, while yields on the 91-day paper decreased by 16.1 bps to 8.6% from the 8.8% recorded the previous week. The yield on the Cytonn Money Market Fund decreased by 19.0 bps to 14.9% from the 15.1% recorded the previous week, while the average yields on the Top 5 Money Market Funds decreased by 25.2bps to close the week at 14.6%, from the 14.8% recorded the previous week.
The table below shows the Money Market Fund Yields for Kenyan Fund Managers as published on 4th April 2025:
|
Cytonn Report: Money Market Fund Yield for Fund Managers as published on 4th April 2025 |
||
|
Rank |
Fund Manager |
Effective Annual Rate |
|
1 |
Gulfcap Money Market Fund |
16.3% |
|
2 |
Cytonn Money Market Fund (Dial *809# or download the Cytonn app) |
14.9% |
|
3 |
Etica Money Market Fund |
14.1% |
|
4 |
Kuza Money Market fund |
13.8% |
|
5 |
Lofty-Corban Money Market Fund |
13.7% |
|
6 |
Orient Kasha Money Market Fund |
13.3% |
|
7 |
Ndovu Money Market Fund |
13.1% |
|
8 |
Enwealth Money Market Fund |
12.7% |
|
9 |
British-American Money Market Fund |
12.5% |
|
10 |
Old Mutual Money Market Fund |
12.5% |
|
11 |
Arvocap Money Market Fund |
12.5% |
|
12 |
Apollo Money Market Fund |
12.3% |
|
13 |
Madison Money Market Fund |
12.3% |
|
14 |
Nabo Africa Money Market Fund |
12.2% |
|
15 |
Dry Associates Money Market Fund |
12.1% |
|
16 |
Jubilee Money Market Fund |
11.9% |
|
17 |
Sanlam Money Market Fund |
11.8% |
|
18 |
Faulu Money Market Fund |
11.7% |
|
19 |
Co-op Money Market Fund |
11.5% |
|
20 |
GenAfrica Money Market Fund |
11.5% |
|
21 |
Absa Shilling Money Market Fund |
11.2% |
|
22 |
CIC Money Market Fund |
11.2% |
|
23 |
ICEA Lion Money Market Fund |
10.9% |
|
24 |
KCB Money Market Fund |
10.8% |
|
25 |
Mali Money Market Fund |
10.6% |
|
26 |
AA Kenya Shillings Fund |
10.5% |
|
27 |
Genghis Money Market Fund |
10.0% |
|
28 |
Mayfair Money Market Fund |
9.7% |
|
29 |
Stanbic Money Market Fund |
7.5% |
|
30 |
Ziidi Money Market Fund |
7.3% |
|
31 |
Equity Money Market Fund |
5.7% |
Source: Business Daily
Liquidity:
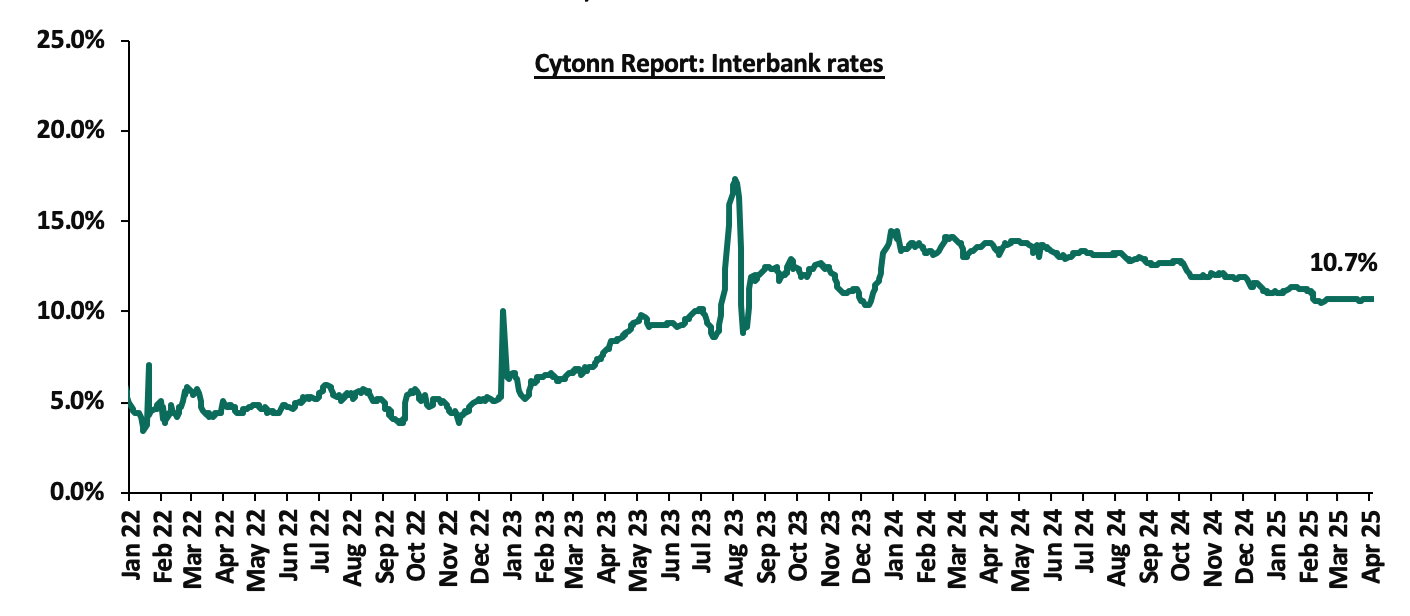
During the quarter, liquidity in the money market eased, with the average interbank rate decreasing by 2.7% points to 10.9% from 13.6% in Q1’2024, partly attributable to government payments that offset tax remittances. The average volumes traded in the interbank market decreased by 19.5% to Kshs 19.2 bn, from Kshs 23.9 bn recorded in Q1’2024.
During the week, liquidity in the money markets marginally eased, with the average interbank rate decreasing by 2.9 bps, to remain unchanged from the 10.7% recorded the previous week, partly attributable to tax remittances that were offset by government payments. The average interbank volumes traded decreased by 48.4% to Kshs 6.3 bn from Kshs 12.1 bn recorded the previous week. The chart below shows the interbank rates in the market over the years:
Kenya Eurobonds:
During the quarter, the yields on Eurobonds recorded a mixed performance, with the 7-year Eurobond issued in 2019 decreasing the most by 1.0% points to 7.5% from 8.5% recorded at the start of the quarter while the 30-year Eurobond issued in 2018 increased the most by 0.4% points to 10.7% from 10.3% recorded at the start of the quarter. Also, during the week, the yields on Kenya’s Eurobonds recorded a mixed performance, with the yield on the 7-year issued in 2024 increasing the most by 82.8 bps to 11.0% from the 10.2% recorded the previous week, while the 10-year Eurobond issued in 2018 decreased the most by 16.5 bps to 8.6% from the 8.7% recorded the previous week. The table below shows the summary of the performance of the Kenyan Eurobonds as of 3rd April 2025;
|
Cytonn Report: Kenya Eurobonds Performance |
|
||||||
|
|
2018 |
2019 |
2021 |
2024 |
2025 |
||
|
Tenor |
10-year issue |
30-year issue |
7-year issue |
12-year issue |
13-year issue |
7-year issue |
11-year issue |
|
Amount Issued (USD) |
1.0 bn |
1.0 bn |
0.3 bn |
1.2 bn |
1.0 bn |
1.5 bn |
1.5 bn |
|
Years to Maturity |
3.0 |
23.0 |
2.2 |
7.2 |
9.3 |
5.9 |
11.0 |
|
Yields at Issue |
7.3% |
8.3% |
7.0% |
7.9% |
6.2% |
10.4% |
9.9% |
|
02-Jan-25 |
9.1% |
10.3% |
8.5% |
10.1% |
10.1% |
10.1% |
|
|
27-Mar-25 |
8.7% |
10.6% |
7.5% |
10.2% |
10.3% |
10.2% |
|
|
28-Mar-25 |
8.8% |
10.7% |
7.5% |
10.3% |
10.3% |
10.3% |
|
|
31-Mar-25 |
8.8% |
10.8% |
7.6% |
10.4% |
10.4% |
10.4% |
|
|
01-Apr-25 |
8.8% |
10.8% |
7.5% |
10.4% |
10.4% |
10.4% |
|
|
02-Apr-25 |
9.0% |
10.9% |
7.5% |
10.5% |
10.5% |
10.5% |
|
|
03-Apr-25 |
8.6% |
11.2% |
8.0% |
10.9% |
10.9% |
11.0% |
|
|
Weekly Change |
(0.2%) |
0.6% |
0.5% |
0.6% |
0.6% |
0.8% |
- |
|
Q/Q Change |
(0.3%) |
0.4% |
(1.0%) |
0.2% |
0.2% |
0.2% |
- |
|
YTD Change |
(0.5%) |
0.9% |
(0.5%) |
0.8% |
0.8% |
0.9% |
- |
Source: Central Bank of Kenya (CBK) and National Treasury
Weekly Highlights:
- Stanbic Bank’s February 2025 Purchasing Manager’s Index (PMI)
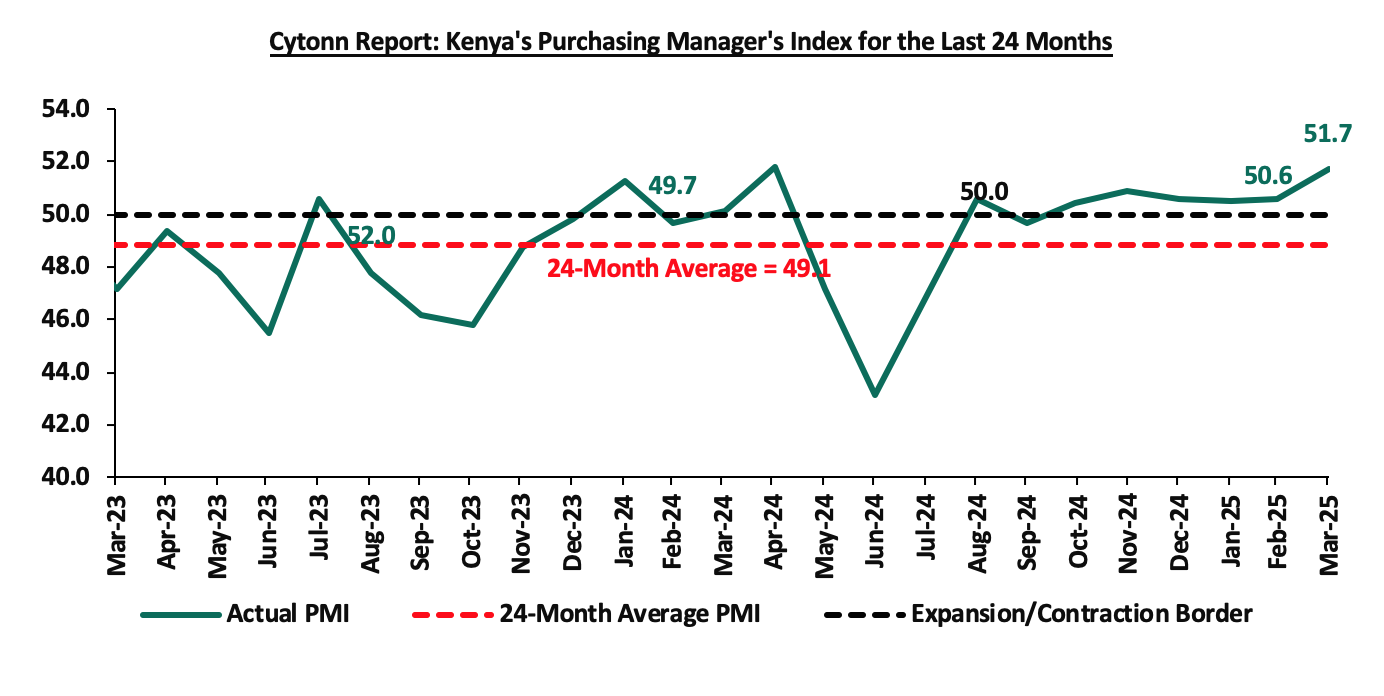
In March 2025, the Stanbic Bank Kenya PMI showed an improvement in business conditions, coming in at 51.7, up from 50.6 in February 2025, signaling another improvement in business conditions. This marked the sixth month that index fell above the 50.0 neutral mark. Increased output, new orders and increased sales supported the improvement. On a year-to-year basis, the index recorded 4.0% points increase from the 49.7 recorded in March 2024. The modest improvement of the general business environment is mainly attributable to inflation remaining relatively low in March coming in at 3.6%, remaining within the Central Bank of Kenya (CBK) target range of 2.5% to 7.5% for the twenty first consecutive month. However, this was a slight increase of 0.1% points from 3.5% in February 2025 attributable to increase in prices of commodities in Food & Non-Alcoholic Beverages and Transport sector by 6.6% and 1.5% respectively. The lower Central Bank Rate (CBR) at 10.75% led to reduced borrowing costs, further promoting improved business activity.
Input purchases increased due to the increased sales resulting in a slight build-up of raw material inventory. The average input charges marginally increased, attributable to a marginal increase in purchase prices and the slight tightening of inflationary pressures. As a result, purchase price increases were relatively modest. Meanwhile, output prices rose, just marginally. The sector data showed an increase in output, for the sixth consecutive month attributable to increased sales. However, some firms faced challenges in sales growth due to inflation and customers’ cash flow constraints prompting them to lower their fees in an effort to boost sales. New orders increased for the sixth consecutive month attributable to increased customers and increased demand. Moreover, the private sector saw an increase in new customers due to increased marketing efforts and favourable weather conditions. Additionally, employment numbers rose for the second consecutive month, with most firms marginally increasing their staffing levels attributable to minimal capacity pressures. Notably, there was a marginal increase in staffing costs. On the sectoral performance, most sectors experienced growth in output and sales. However, the manufacturing sector saw difficulties in production and new orders.
Private sector prices increased marginally in March for the fifth consecutive month. The marginal increase in purchasing costs and taxes led to price increases. However, the increase in prices was weighed down by the easing of input price inflation. Notably, overall sentiment towards future activity of the Kenyan business environment was negative. The outlook reflected concerns about the general economy despite investment in expansion through new outlets and product diversification. Key to note, a PMI reading of above 50.0 indicates an improvement in the business conditions, while readings below 50.0 indicate a deterioration. The chart below summarizes the evolution of PMI over the last 24 months
Going forward, we anticipate that the business environment will improve in the short to medium term as a result of the improving economic environment driven by lower interest rates following the easing monetary policy with the CBR decreasing by 50.0 bps to 10.75% from 11.25% in February 2025, the stability of the Kenyan Shilling against the USD and the low inflation rates currently at 3.6% and stable fuel prices. However, we expect businesses to be weighed down by the high cost of living coupled with the high taxation, which are set to increase input costs. Overall the private sector is expected to continue with the recovery albeit with potential headwinds in the coming months.
- MPC Note on the 8th April 2025 Monetary Policy Committee (MPC) Meeting
We expect the MPC to cut the Central Bank Rate (CBR) by 25.0 bps – 75.0 bps to within a range of 10.00% - 10.50% with their decision mainly being supported by:
- The need to support the economy by adopting a more accommodative policy that will ease financing activities and support private sector financing. Private sector credit growth marginally increasing to 1.4% in December 2024, a further decline from 1.3% in October 2024. A rate cut would help unlock the private sector's potential, enabling it to act as a key driver of economic recovery and sustained growth. Additionally, the business environment remains subdued, hence a cut in the CBR will help spur economic growth, increase money supply and improve business activities in the country
- Rate cuts by global giant economies: The European Central Bank announced a rate cut by 25 bps to 2.50% on 6th March 2025, from 2.75% earlier in 30th January 2025. Meanwhile, the US Federal Reserve decided to maintain their benchmark interest rate in their recent sitting on 19th March 2025 at 4.25%-4.50% for the second time since January sitting, following the rate cut by 25.0 bps to a range of 4.25%-4.50% in their December 2024 meeting from a range of 4.50%-4.75% in their November 2024 meeting. As such, we expect the MPC to follow through with this set precedence of loosening the monetary policy and cut the rate further, and,
- The continued stability of the Shilling against major currencies: Despite the February rate cut in the CBR the shilling has remained stable , this still gives room for a moderate cut without reversing the Shilling’s stability. Since the last meeting, the Kenyan Shilling has depreciated marginally by 4.0 bps against the US Dollar to 129.2 as at 4th April 2025, from Kshs 129.2 recorded on 5th February 2025, but remains stable. The stability of the Shilling is expected to be supported by the stable foreign reserves which are currently at 5.1 months of import cover, above the statutory requirement of 4.0 months cover
For more details, please see our April 2025 MPC Note
Rates in the Fixed Income market have been on a downward trend due to high liquidity in the money market which allowed the government to front load most of its borrowing. The government is 79.8% ahead of its prorated net domestic borrowing target of Kshs 456.7 bn, and 38.3% ahead of the total FY’2024/25 net domestic borrowing target of Kshs 593.7 bn, having a net borrowing position of Kshs 821.1 bn (inclusive of T-bills). However, we expect a continued downward readjustment of the yield curve in the short and medium term, with the government looking to increase its external borrowing to maintain the fiscal surplus, hence alleviating pressure in the domestic market. As such, we expect the yield curve to stabilize in the short to medium-term and hence investors are expected to shift towards the long-term papers to lock in the high returns.
Market Performance:
During the quarter, the equities market was on an upward trajectory with NSE 20, NASI, NSE 25 and NSE 10 gaining by 10.8%,6.0%, 3.8% and 3.1% respectively. The equities market performance during the quarter was driven by gains recorded by large caps such as Stanbic Bank, DTB-Kenya, and NCBA Bank of 17.9%, 9.8%, and 8.9%, respectively. The gains were however weighed down by losses recorded by Co-operative Bank, Equity Bank and BAT of 2.7%, 2.5% and 1.3 respectively
Equities turnover declined by 34.5% in Q1’2025 to USD 202.7 mn, from USD 309.5 mn in Q4’2024. Foreign investors remained net sellers in Q1’2025 with a net selling position of USD 25.2 mn, from a net selling position of USD 19.5 mn recorded in Q4’2024.
During the week, the equities market recorded a mixed performance, with NASI, NSE 25, and NSE 10 gaining by 0.5%, 0.1%, and 0.1%, respectively, while NSE 20 declined by 0.1%, taking the YTD performance to gains of 8.1%, 4.9%, 2.3% and 1.3% for NSE 20, NASI, NSE 25, and NSE 10 respectively. The equities market performance was mainly driven by gains recorded by East African Breweries Limited (EABL), NCBA Group, and Stanbic Bank of 3.2%, 2.9%, and 2.3% respectively. The gains were however weighed down by losses recorded by large-cap stocks such as KCB Group, ABSA and DTB-K of 5.7%, 4.7% and 1.0% respectively
During the week, equities turnover increased by 11.7% to USD 11.5 mn from USD 10.3 mn recorded the previous week, taking the YTD turnover to USD 214.2 mn. Foreign investors became net buyers, with a net buying position of USD 1.0 mn, from a net selling position of USD 0.7 mn recorded the previous week, taking the YTD net selling position to USD 24.1 mn.
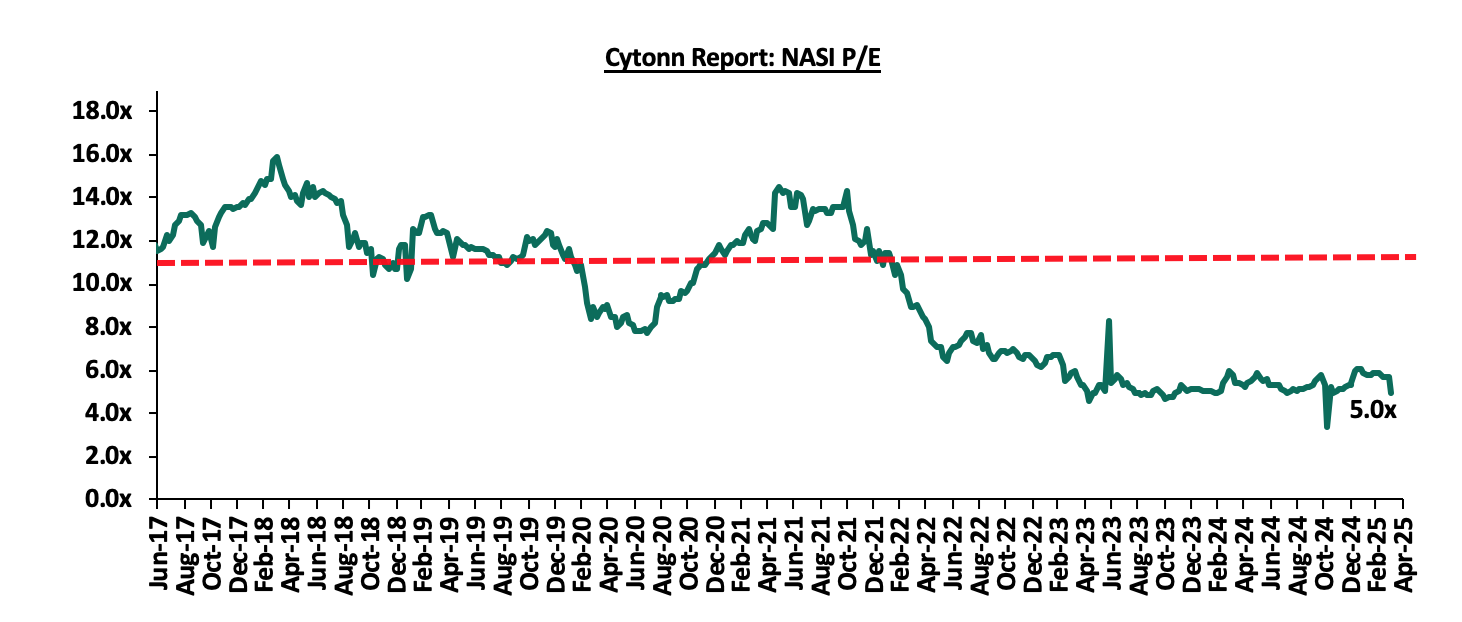
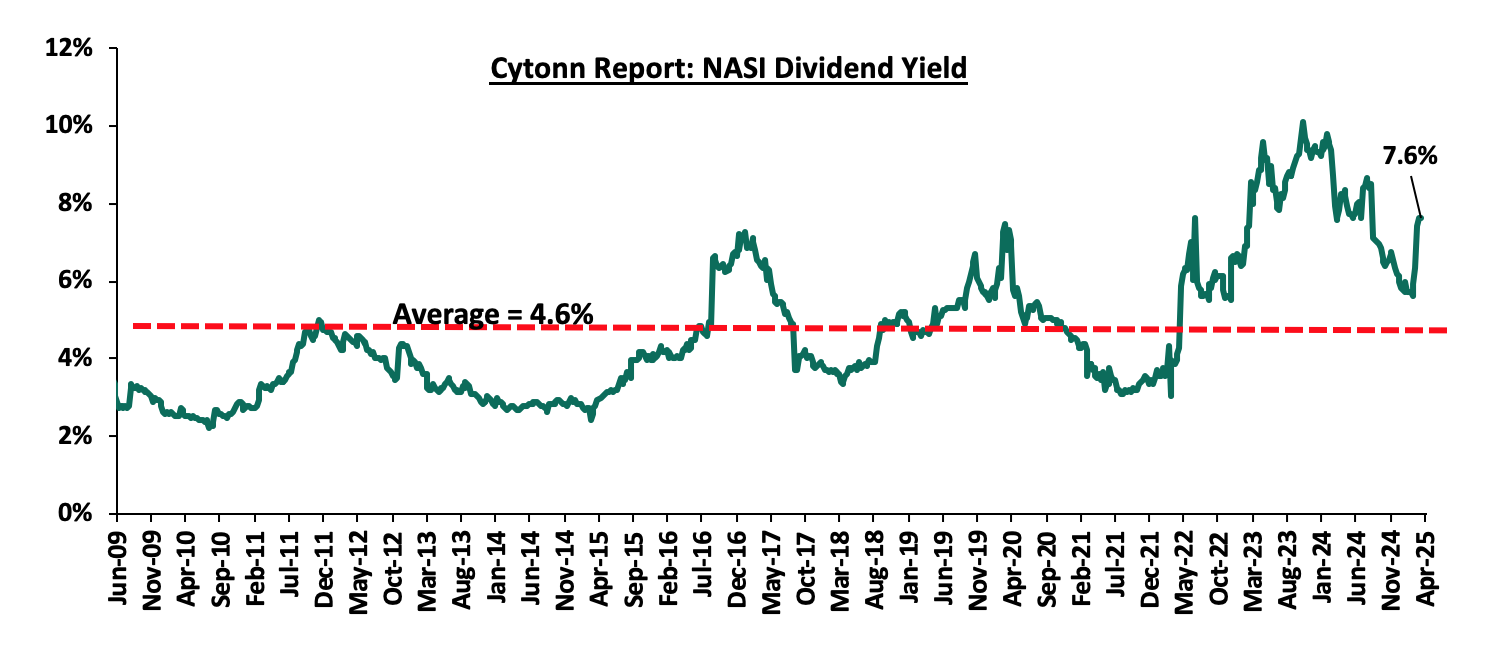
The market is currently trading at a price-to-earnings ratio (P/E) of 5.0x, 57.0% below the historical average of 11.6x. The dividend yield stands at 7.6%, 3.0% points above the historical average of 4.6%. Key to note, NASI’s PEG ratio currently stands at 0.6x, an indication that the market is undervalued relative to its future growth. A PEG ratio greater than 1.0x indicates the market is overvalued while a PEG ratio less than 1.0x indicates that the market is undervalued. The charts below indicate the historical P/E and dividend yields of the market;
Listed Banks’ FY’2024 Performance
During the first quarter of 2025, the listed banking sector released their FY’2024 results, recording a weighted average y/y earnings growth of 26.2% in their core EPS in FY’2024. The performance in FY’2024 was supported by a 12.0% growth in weighted average net interest income coupled with a 13.9% growth in weighted average non-funded income. The table below shows the performance of listed banks that have released their FY’2024 results using several metrics:
|
Cytonn Report: Listed Banks Performance in FY’2024 |
||||||||||||||
|
Bank |
Core EPS Growth |
Interest Income Growth |
Interest Expense Growth |
Net Interest Income Growth |
Net Interest Margin |
Non-Funded Income Growth |
NFI to Total Operating Income |
Growth in Total Fees & Commissions |
Deposit Growth |
Growth in Government Securities |
Loan to Deposit Ratio |
Loan Growth |
Return on Average Equity |
|
|
KCB Group |
64.9% |
26.9% |
25.0% |
28.0% |
7.8% |
16.6% |
33.0% |
0.9% |
(18.3%) |
(13.2%) |
71.7% |
(9.6%) |
24.6% |
|
|
Standard Chartered Bank |
45.0% |
20.0% |
83.4% |
13.4% |
9.6% |
40.4% |
34.4% |
11.9% |
(13.8%) |
34.7% |
51.3% |
(7.1%) |
30.1% |
|
|
Diamond Trust Bank Kenya |
28.2% |
12.0% |
21.6% |
3.0% |
5.5% |
7.3% |
31.5% |
15.8% |
(8.0%) |
5.0% |
63.8% |
(7.5%) |
11.3% |
|
|
Absa Bank Kenya |
27.5% |
15.4% |
30.1% |
15.4% |
10.5% |
10.8% |
25.8% |
27.5% |
1.2% |
30.0% |
84.2% |
(7.9%) |
27.0% |
|
|
I&M Group |
21.9% |
35.0% |
39.9% |
31.2% |
8.5% |
(2.8%) |
26.7% |
15.6% |
(1.1%) |
31.0% |
69.6% |
(7.8%) |
14.9% |
|
|
Stanbic Holdings |
12.8% |
37.8% |
105.7% |
(5.1%) |
5.9% |
(1.7%) |
38.8% |
(13.1%) |
(2.8%) |
70.6% |
71.6% |
(11.6%) |
19.1% |
|
|
Equity Group |
11.0% |
9.2% |
20.3% |
3.7% |
5.8% |
10.7% |
43.9% |
12.9% |
3.1% |
22.0% |
58.5% |
(7.7%) |
22.1% |
|
|
Co-operative Bank of Kenya |
9.8% |
24.9% |
45.7% |
13.9% |
8.4% |
24.5% |
36.1% |
3.2% |
12.1% |
15.1% |
73.8% |
(0.1%) |
19.7% |
|
|
NCBA Group |
1.9% |
16.0% |
34.5% |
(0.3%) |
5.7% |
(3.1%) |
45.0% |
5.5% |
(13.4%) |
(11.1%) |
60.2% |
(10.4%) |
21.2% |
|
|
HF Group |
(10.8%) |
23.1% |
41.0% |
4.4% |
4.3% |
21.2% |
36.1% |
36.1% |
8.3% |
75.3% |
81.9% |
0.2% |
4.3% |
|
|
FY'24 Mkt Weighted Average* |
26.2% |
20.5% |
42.6% |
12.0% |
7.6% |
13.9% |
36.1% |
9.2% |
(4.4%) |
18.9% |
66.5% |
(7.6%) |
22.8% |
|
|
FY'23 Mkt Weighted Average** |
11.4% |
30.5% |
52.4% |
20.6% |
7.5% |
16.4% |
37.0% |
25.0% |
2.2% |
69.0% |
21.2% |
9.5% |
38.3% |
|
|
*Market cap weighted as at 28/03/2025 |
||||||||||||||
|
**Market cap weighted as at 18/04/2024 |
||||||||||||||
Key Q1’2025 Highlights:
During Q1’2025;
- Nairobi Securities Exchange (NSE) announced the lifting of the suspension in the trading of Kenya Airways Plc securities, effective January,5 2025. The suspension on trading Kenya Airways PLC shares was lifted following the company’s recent positive performance, which included posting a profit after tax and the withdrawal of the National Aviation Management Bill 2020.The trading of the group’s shares were suspended in July 2020 mainly due to implementation of the National Aviation Management Bill 2020. Please see our Cytonn Outlook 2025 for more info
- Kenya Power & Lighting Company Plc (KPLC) released its H1’2025 financial results, for the period ending 31st December 2024, recording a significant 3025.4% improvement in profitability, with Profit After Tax (PAT) increasing to Kshs 10.0 bn, from Kshs 0.3 bn in H1’2024. The increase was mainly driven by, an 86.9% reduction in finance costs to Kshs 1.9 bn in H1’2025, from Kshs 15.0 bn in H1’2024, coupled with a 14.1% decline in the cost of sales to Kshs 71.3 bn, from Kshs 83.0 bn in H1’2024. The performance was however weighed down by a 5.4% decline in the total revenue to Kshs 107.4 bn, from 113.6 bn in H1’2024 attributed to lower pass-through costs and tariff adjustment. For more information please see our Cytonn Monthly
- East African Breweries Plc (EABL) released their H1’2025 financial results for the period ending 31st December 2024, recording a 19.6% increase in Profits After Tax (PAT) to Kshs 8.1 bn in H1’2025, from Kshs 6.8 bn in H1’2024. The increase was mainly attributable to the 14.4% decrease in finance costs to Kshs 3.4 bn from Kshs 4.0 bn in H1’2024, coupled with a 2.1% increase in net revenue to Kshs 67.9 bn from Kshs 66.5 bn in H1’2024. The performance was however weighed down by the 4.9% increase in the operating costs to Kshs 13.7 bn in H1’2025, from Kshs 13.1 bn in H1’2024. For more information please see our Cytonn Monthly
- Kenya Electricity Generating Company (KenGen), released its H1'2025 financial results for the period ended 31st December 2024, recording a Profit After Tax (PAT) of Kshs 5.3 bn, a 79.0% increase from the Kshs 3.0 bn recorded in H1’2024, majorly attributable to the 13.7% decrease in operating expenses to Kshs 17.7 bn from Kshs 20.5 bn recorded in H1’2024, which was driven by cost optimization strategies and cutting edge-efficiency enhancements across the power plants. However, net revenue decreased by 5.6% to Kshs 23.4 bn in H1’2025, from Kshs 24.7 bn in H1’2024 mainly driven by the 3.6% decrease in topline revenue to Kshs 27.5 bn from Kshs 28.5 bn in H1’2024. Notably, finance costs reduced by 23.8% to Kshs 1.1 bn, from Kshs 1.5 bn in H1’2024, showcasing improved capital efficiency and optimized debt management. Please see our Cytonn Weekly #06/2025 for more info
- British American Tobacco Kenya Plc released their FY’2024 financial results, recording a 19.5% decline in Profits after Tax (PAT) to Kshs 4.5 bn, from Kshs 5.6 bn recorded in FY’2023. The decline in PAT was majorly attributed to the 4.4% increase in the cost of sales to Kshs 18.4 bn in FY’2024, from Kshs 17.6 bn recorded in FY’2023, coupled with the 954.6% increase in the finance costs to a finance loss of Kshs 0.8 bn, from a finance income of Kshs 0.1 bn in FY’2023 that outpaced the 0.6% increase in the net revenue to Kshs 25.7 bn from Kshs 25.6 bn. For more information please see our Cytonn Monthly
- Nairobi Securities Exchange (NSE) announced the suspension in the trading of Bamburi Cement shares, effective February,27 2025 until May, 9 2025. The suspension on trading Bamburi Cement PLC shares was enacted following the company’s successful 96.5% acquisition by Amsons Industries (K) Ltd. The suspension was put in place to facilitate the squeeze out process for Amsons to acquire the remaining 3.5% of Bamburi’s shares. For more information please see our Cytonn Monthly
- Savannah Cement attracted 15 potential buyers after its planned sale was revived. The cement manufacturer was placed under administration by KCB Bank Kenya and Absa Bank over a Kshs 10.0 billion debt, and its key assets, including industrial property valued at Kshs 10.1 bn, remain central to the bidding process. For more information please see our Cytonn Monthly
- Proctor & Allan, a leading cereals manufacturer, was placed under receivership due to a Kshs 3.7 bn loan from KCB Group. The company has struggled with competition and economic downturns, exacerbated by its relocation from Nairobi to Limuru. The High Court appointed joint receivers to oversee the restructuring. For more information please see our Cytonn Monthly
- Multiple Hauliers received a six-month extension for its administration process, which has been ongoing since June 2021. The court barred Prime Bank from selling its Mombasa property, emphasizing a fair restructuring process for all creditors. The firm, burdened with Kshs 14.0 bn in debt, awaits an investor to inject funds for recovery. For more information please see our Cytonn Monthly
- Stanbic released their FY’2024 financial results, highlighting that their Profit After Tax (PAT) increased by 12.8% to Kshs 13.7 bn, from Kshs 12.2 bn in FY’2023. The performance was mainly driven by a 14.2% decrease in Total Operating Expense to Kshs 20.8 bn, from Kshs 24.2 bn in FY’2023, which outpaced the decrease in Total Operating Income by 3.8% to Kshs 39.7 bn inFY’2024, from Kshs 41.3 bn in FY’2023.The decrease in Operating Expense was largely driven by the 50.3% decrease in loan loss provisions to Kshs 3.1 bn from Kshs 6.2 bn in FY’2023. For more information please see our Cytonn weekly #10/2025
- KCB Group released their FY’2024 results, recording a 64.9% increase in Profit After Tax to Kshs 61.8 bn, from Kshs 37.5 bn in FY’2023. The performance was mainly driven by a 24.0% increase in total operating income to Kshs 204.9 bn, from Kshs 165.2 bn in FY’2023, which outpaced the 5.2% increase in total Operating expense to Kshs 122.9 bn in FY’2024, from Kshs 116.8 bn in FY’2023. For more information please see our Cytonn weekly #11/2025
- Sanlam Kenya Holdings released their FY’2024 results, recording a significant 933.5% increase in Profit After Tax to Kshs 1.1 bn, from the Kshs 0.1 bn loss recorded in FY’2023. The performance was mainly driven by a significant 396.9% increase in insurance investment revenue to Kshs 5.3 bn, from Kshs 1.1 bn in FY’2023, and supported by a 13.3% decrease in Net expenses from reinsurance contracts held to Kshs 1.0 bn in FY’2024, from Kshs 1.2 bn in FY’2023. For more information please see our Cytonn weekly #11/2025
- Standard Chartered Bank Kenya released its FY’2024 financial results, Standard Chartered Bank Kenya’s Profit After Tax (PAT) increased by 45.0% to Kshs 20.1 bn, from Kshs 13.8 bn in FY’2023. The performance was mainly driven by a 21.4% increase in total operating income to Kshs 50.7 bn, from Kshs 41.7 bn in FY’2023, which outpaced the 1.9% increase in total operating expense to Kshs 22.5 bn in FY’2024, from Kshs 22.1 bn in FY’2023. For more information please see our Cytonn weekly #12/2025
- Co-operative Bank released its FY’2024 financial results, Cooperative Bank Kenya’s Profit After Tax (PAT) increased by 9.8% to Kshs 25.5 bn, from Kshs 23.2 bn in FY’2023. The performance was mainly driven by a 12.5% increase in total operating income to Kshs 80.6 bn, from Kshs 71.7 bn in FY’2023, which was however weighed down by the 17.7% increase in total operating expense to Kshs 46.7 bn in FY’2024, from Kshs 39.7 bn in FY’2023. For more information please see our Cytonn weekly #12/2025
- Absa Bank Kenya released its FY’2024 financial results, Absa Bank Kenya’s Profit After Tax (PAT) increased by 27.5% to Kshs 20.9 bn, from Kshs 16.4 bn in FY’2023. The performance was mainly driven by a 14.2% increase in total operating income to Kshs 62.3 bn, from Kshs 54.6 bn in FY’2023, which outpaced the 5.5% increase in total operating expense to Kshs 32.6 bn in FY’2024, from Kshs 30.9 bn in FY’2023.For more information please see our Cytonn weekly #12/2025
- Equity Group released its FY’2024 financial results, Equity Group’s Profit After Tax (PAT) increased by 11.6% to Kshs 48.8 bn, from Kshs 43.7 bn in FY’2023. The performance was mainly driven by a 6.7% increase in Total Operating Income to kshs 193.8 bn, from kshs 181.7 bn in FY’2023, which outpaced the 2.5% increase in total operating expense to kshs 133.0 bn in FY’2024, from kshs 129.8 bn in FY’2023. For more information please see our Cytonn weekly #13/2025
- NCBA Group released its FY’2024 financial results, NCBA Group’s Profit After Tax (PAT) increased by 1.9% to Kshs 21.9 bn, from Kshs 21.5 bn in FY’2023. The performance was mainly driven by a 1.6% decrease in operating expenses to Kshs 37.6 bn, from Kshs 38.2 bn in FY 2023, which outpaced 1.5% decrease in total operating income to Kshs 62.7 bn, from Kshs 63.7 bn in FY’2023.The decrease in Operating expenses was largely driven by the 40.1% decrease in loan loss provisions expense to Kshs 5.5 bn, from 9.2 bn in FY’2023. For more information please see our Cytonn weekly #13/2025
- I&M Group released its FY’2024 financial results, I&M Group’s Profit After Tax (PAT) increased by 24.8% to Kshs 16.7 bn, from Kshs 13.3 bn in FY’2023. The performance was mainly driven by a 20.0% increase in Total Operating Income to Kshs 51.2 bn, from Kshs 42.7 bn in FY’2023, which outpaced the 15.2% increase in Total Operating expense to Kshs 31.3 bn in FY’2024, from Kshs 27.2 bn in FY’2023. For more information please see our Cytonn weekly #13/2025
- DTB-K released its FY’2024 financial results, DTB-K’s Profit After Tax (PAT) increased by 13.1% to Kshs 8.8 bn, from Kshs 7.8 bn in FY’2023. The performance was mainly driven by a 4.3% increase in Total Operating Income to Kshs 41.4 bn, from Kshs 39.7 bn in FY’2023, coupled with the 2.3% decrease in Total Operating expense to Kshs 30.2 bn in FY’2024, from Kshs 30.9 bn in FY’2023. For more information please see our Cytonn weekly #13/2025
- HF Group released its FY’2024 financial results, HF Group’s Profit After Tax (PAT) increased by 35.2% to Kshs 0.5 bn, from Kshs 0.4 bn in FY’2023. The performance was mainly driven by a 9.9% increase in Total Operating Income to Kshs 4.2 bn, from Kshs 3.8 bn in FY’2023, which outpaced the 7.0% increase in Total Operating expense to Kshs 3.7 bn in FY’2024, from Kshs 3.5 bn in FY’2023. For more information please see our Cytonn weekly #13/2025
- CIC Group released their FY’2024 results. CIC’s Profit After Tax (PAT) increased by 98.0% to Kshs 2.9 bn from Kshs 1.4 bn, recorded in FY’2023. The performance was mainly driven by a 35.7% increase in Net investment income to Kshs 8.8 bn in FY’2024, from Kshs 2.9 bn in FY’2023, and further supported by a 14.0% decrease in Net expenses from reinsurance contracts to Kshs 1.8 bn, from Kshs 2.1 bn in FY’2023. However, the performance was weighed down by the 56.4% decrease in net income from insurance services to Kshs 0.3 bn, from Kshs 0.8 bn in FY’2023. For more information please see our Cytonn weekly #13/2025
- Britam Holdings released their FY’ 2024 results. Britam’s Profit After Tax (PAT) increased by 53.5% to Kshs 5.0 bn, from Kshs 3.3 bn recorded in FY’2023. The performance was mainly driven by a 163.4% increase in Net Investment income to Kshs 30.6 bn, from Kshs 11.6 bn in FY’2023 as well as a 35.5% increase in net insurance and investment result to Kshs 9.2 bn from 6.8 bn in FY 2023 but was weighed down by the 208.8% increase in Insurance Expenses to Kshs 26.4 bn in FY’2024, from Kshs 8.6 bn in FY’2023. For more information please see our Cytonn weekly #13/2025
- Liberty Kenya Holdings released their FY’ 2024 results, with Profit After Tax (PAT) increasing by 119.7% to Kshs 1.4 bn, from Kshs 0.6 bn recorded in FY’2023, mainly driven by a 99.8% increase in Net investment income to Kshs 2.0 bn, from Kshs 1.0 bn in FY’2023, and further supported by 5.6 % increase in Net insurance income to Kshs 1.00 bn, from Kshs 0.95 bn in FY’2023. For more information please see our Cytonn weekly #13/2025
- Kenya Airways Plc released their FY’2024 results, recording a significant 123.9% increase in Profit After Tax to Kshs 5.4 bn, from the Kshs 22.7 bn loss recorded in FY’2023. The performance was mainly driven by a 106.5% increase in forex gains on borrowings, attributable to the 17.4% appreciation of the Kenyan shilling in 2024, coupled with a 57.8% increase in operating profit to Kshs 16.6 bn, from the Kshs 10.5 bn recorded in FY’2023. The Kshs 5.4 bn profit after tax was the highest ever recorded in Kenya Airways’ history due to the recovery strategy under Project Kifaru. For more information please see our Cytonn weekly #13/2025
- KCB Group Plc disclosed its plan of acquisition of a 75.0% controlling interest in Riverbank Solutions Limited, a fintech entity focused on payment systems, as part of its strategic initiative to bolster digital capabilities and reinforce its footprint in banking, agency solutions, and business services across Kenya, Uganda, and Rwanda. The integration of Riverbank’s capabilities is expected to facilitate the unification of KCB’s agent banking channels into a single platform, optimizing operational efficiency. For more information please see our Cytonn weekly #13/2025
Universe of Coverage:
|
|
Cytonn Report: Equities Universe of Coverage |
||||||||||||
|
Company |
Price as at 28/03/2028 |
Price as at 04/04/2025 |
w/w change |
q/q change |
YTD Change |
Year Open 2025 |
Target Price* |
Dividend Yield |
Upside/ Downside** |
P/TBv Multiple |
Recommendation |
|
|
|
ABSA Bank |
19.0 |
18.1 |
(4.7%) |
5.3% |
(4.0%) |
18.9 |
24.2 |
9.7% |
43.4% |
1.2x |
Buy |
|
|
|
Equity Group |
47.1 |
47.1 |
0.0% |
(2.5%) |
(1.9%) |
48.0 |
60.2 |
9.0% |
36.8% |
0.9x |
Buy |
|
|
|
Co-op Bank |
16.0 |
16.2 |
0.9% |
(2.7%) |
(7.4%) |
17.5 |
20.3 |
9.3% |
34.9% |
0.7x |
Buy |
|
|
|
KCB Group |
42.2 |
39.8 |
(5.7%) |
1.3% |
(6.3%) |
42.4 |
50.4 |
7.5% |
34.3% |
0.5x |
Buy |
|
|
|
Jubilee Holdings |
192.3 |
210.0 |
9.2% |
10.8% |
20.2% |
174.8 |
260.7 |
6.4% |
30.5% |
0.3x |
Buy |
|
|
|
Standard Chartered Bank |
299.3 |
300.3 |
0.3% |
7.0% |
5.3% |
285.3 |
328.6 |
15.0% |
24.4% |
1.8x |
Buy |
|
|
|
Diamond Trust Bank |
75.8 |
75.0 |
(1.0%) |
9.8% |
12.4% |
66.8 |
84.4 |
9.3% |
21.8% |
0.3x |
Buy |
|
|
|
NCBA |
52.5 |
54.0 |
2.9% |
8.9% |
5.9% |
51.0 |
57.4 |
10.2% |
16.5% |
1.0x |
Accumulate |
|
|
|
Stanbic Holdings |
161.8 |
165.5 |
2.3% |
17.9% |
18.4% |
139.8 |
171.2 |
12.5% |
16.0% |
0.9x |
Accumulate |
|
|
|
I&M Group |
32.4 |
31.6 |
(2.3%) |
(10.8%) |
(12.2%) |
36.0 |
31.4 |
9.5% |
8.9% |
0.6x |
Hold |
|
|
|
CIC Group |
2.8 |
3.0 |
4.9% |
32.1% |
39.3% |
2.1 |
3.1 |
4.4% |
8.4% |
0.9x |
Hold |
|
|
|
Britam |
8.0 |
7.3 |
(8.3%) |
37.6% |
25.8% |
5.8 |
7.5 |
0.0% |
2.5% |
1.1x |
Lighten |
|
|
|
|
*Target Price as per Cytonn Analyst estimates **Upside/ (Downside) is adjusted for Dividend Yield ***Dividend Yield is calculated using FY’2024 Dividends. |
||||||||||||
Weekly Highlights
- Jubilee Holdings Ltd FY’2024 Financial Results.
|
Cytonn Report: Jubilee Holdings Ltd Income Statement |
|||
|
Item (All figures in Bns) |
FY’2023 |
FY’2024 |
y/y change |
|
Insurance Revenue |
22.6 |
25.7 |
13.5% |
|
Insurance service expenses |
(21.8) |
(24.2) |
11.4% |
|
Net expenses from reinsurance contracts held |
(0.3) |
(0.8) |
173.1% |
|
Net Insurance income |
0.6 |
0.7 |
20.0% |
|
Net Financial Result |
(0.3) |
4.1 |
1574.7% |
|
Net non-attributable income (expenses) |
2.5 |
1.5 |
(41.1%) |
|
Profit Before Tax |
2.8 |
6.2 |
123.8% |
|
Taxation |
(0.2) |
(1.5) |
678.2% |
|
Profit After Tax |
2.6 |
4.7 |
82.5% |
|
Cytonn Report: Jubilee Holdings Ltd Balance Sheet |
|||
|
Item (All figures in Bns) |
FY’2023 |
FY’2024 |
y/y change |
|
Investment assets |
2.6 |
2.9 |
8.9% |
|
Insurance assets |
167.9 |
188.6 |
12.4% |
|
Total Assets |
191.4 |
213.6 |
11.6% |
|
Insurance Contract Liabilities |
130.1 |
153.0 |
17.6% |
|
Provisions & other payables |
10.2 |
9.4 |
(8.1%) |
|
Total liabilities |
140.3 |
162.4 |
15.8% |
|
Shareholder funds |
47.8 |
49.1 |
2.7% |
|
Minority Interest |
2.4 |
2.1 |
(15.3%) |
|
Total Equity |
50.3 |
51.2 |
1.9% |
During the week, Jubilee Holdings Limited released their FY’2024 results. Jubilee’s Profit After Tax (PAT) increased by 82.5% to Kshs 4.7 bn, from Kshs 2.6 bn recorded in FY’2023. The performance was mainly driven by a 13.5% increase in Insurance Services Revenues to Kshs 25.7 bn, from Kshs 22.6 bn in FY’2023, but was however weighed down by the 11.4% increase in Insurance Services Expenses to Kshs 24.2 bn in FY’2024, from Kshs 21.8 bn in FY’2023;
key take outs from the results:
- Core Earnings Per share increased by 80.6% to Kshs 65.0 from Kshs 36.0 in FY’2023, driven by the 13.5% increase in Insurance Services Revenues to Kshs 25.7 bn, from Kshs 22.6 bn in FY’2023, but was however weighed down by the 11.4% increase in Insurance Services Expenses to Kshs 24.2 bn in FY’2024, from Kshs 21.8 bn in FY’2023,
- Net financial result increased significantly by 1574.7% to Kshs 4.1 bn in FY’2024, from Kshs (0.3) bn in FY’2023, while net non-attributable expenses decreased by 41.1% to Kshs 1.5 bn, from Kshs 2.5 bn in FY’2023, resulting in a 123.8% increase in the Profit Before Tax to Kshs 6.2 bn in FY’2024, from Kshs 2.8 bn recorded in FY’2023,
- Insurance services revenue increased by 13.5% to Kshs 25.7 bn in FY’2024 from Kshs 22.6 bn in FY’2023, while insurance expenses increased by 11.4% to Kshs 24.2 bn from Kshs 21.8 bn in FY’2023, and the net expenses from reinsurance contracts held increased significantly by 173.1% to Kshs 0.8 bn, from Kshs 0.3 bn in FY’2023. This translated to a Net insurance service result increase of 20.0% to Kshs 0.7 bn from Kshs 0.6 bn in FY’2023,
- The balance sheet recorded an expansion as total assets increased by 11.6% to Kshs 213.6 bn in FY’2024 from Kshs 191.4 bn in FY’2023 mainly driven by 12.4% increase in investment assets to Kshs 188.6 bn from Kshs 167.9 bn in FY’2023, coupled with 8.9% increase in fixed assets to Kshs 2.9 bn form Kshs 2.6 bn in FY’2023, and,
- Total liabilities increased by 15.8% to Kshs 162.4 bn from Kshs 140.3 bn in FY’2023, majorly on the back of Insurance contract liabilities 17.6% increase to Kshs 153.0 bn from Kshs 130.1 bn in FY’2023, but was however weighed down by the 8.1% decrease in other liabilities to Kshs 9.4 bn from Kshs 10.2 bn in FY’2023.
Other highlights from the release include:
- Declaration of dividends – The board of directors declared a final dividend of Kshs 11.5 per share, up from Kshs 9.0 per share declared in FY’2023 bringing the total dividend for FY’2024 to Kshs 13.5 per share inclusive of the interim dividend of Kshs 2.0. This translated to a dividend yield of 6.4% and a dividend payout of 20.8%.
Key to note, this was the fourth time the company was releasing their results under the new IFRS 17 reporting system, restating their FY’2023 profit before tax to Kshs 2.8 bn, changing associate results reported from Jubilee Allianz Kenya. This standard requires insurers to measure insurance contracts using updated estimates and assumptions that account for the timing of cash flows and any uncertainties related to insurance contracts. Looking ahead, the Group's earnings are expected to benefit from its enhanced performance in both the life and general insurance segments.
We are “Bullish” on the Equities markets in the short term due to current cheap valuations, lower yields on short-term government papers and expected global and local economic recovery, and, “Neutral” in the long term due to persistent foreign investor outflows. With the market currently trading at a discount to its future growth (PEG Ratio at 0.6x), we believe that investors should reposition towards value stocks with strong earnings growth and that are trading at discounts to their intrinsic value. We expect the current high foreign investors sell-offs to continue weighing down the economic outlook in the short term.
In Q1’2025, the general Real Estate sector continued to witness considerable growth in activity in terms of property transactions and development activities. Consequently, the sector’s activity contribution to Gross Domestic Product (GDP) grew by 5.5 % to Kshs 283.8 bn in Q3’2024, from Kshs 268.9 bn recorded during the same period in 2023. In addition, the sector contributed 10.8% to the country’s GDP, a 0.3% points increase from 10.5% recorded in Q3’2023. Cumulatively, the Real Estate and construction sectors contributed 16.5% to GDP, 0.2% points decrease from 16.7% in Q3’2023, attributable to decline in construction contribution to GDP by 0.4% points, to 5.7% in Q3’2024, from 6.1% recorded in Q3’2023. The graph below highlights the Real Estate and Construction sectors’ contribution to GDP from 2020 to Q3’2024;
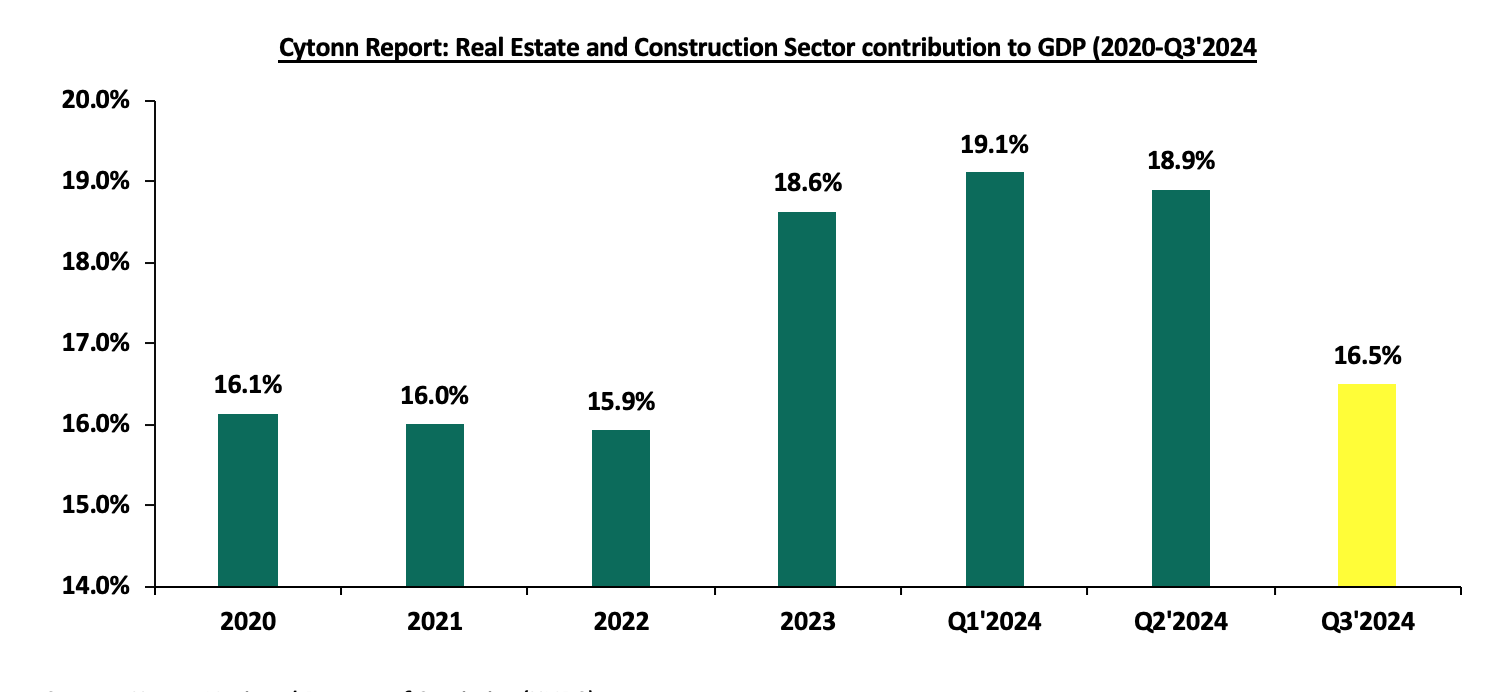
Source: Kenya National Bureau of Statistics (KNBS)
In Q1’2025, Real Estate was promoted by key initiatives as follows:
- Government’s continued Focus on Affordable Housing: The Kenyan government has continued to put its best foot forward towards delivering affordable housing to its citizens. Currently, the AHP pipeline boasts an estimated total of 730,062 housing units under construction by both the government and private sector. This is according to the Architectural Association of Kenya (AAK’s) Status of the Built Environment Report 2024. In addition, the government is developing a pool of resources geared towards the provision of affordable housing through the affordable housing levy, which the Affordable Housing Bill 2023 which was accented into law and took effect in 2024
- Infrastructural Development: In general, Continuous improvements in infrastructure, such as new roads, bridges, and utilities, have opened up previously inaccessible areas for real estate development. This has led to increased property value and demand in urban and peri-urban areas. The government has continually prioritized infrastructural development in efforts aimed at positioning the country as a regional hub through the implementation of several key projects including, Makupa Bridge, Nairobi Expressway, Nairobi Western and Eastern Bypasses among others. Notable projects delivered in 2024 include phase two of the Dongo Kundu bypass project,
- Provision of Affordable Mortgage Financing: Kenya Mortgage Refinance Company (KMRC) has continued to drive the availability and affordability of home loans to Kenyans by providing single-digit fixed rate, and long-term finance to Primary Mortgage Lenders (PMLs) such as banks and SACCOs. Recently, KMRC, broadened its refinancing services to include non-shareholders, such as SACCOs and microfinance institutions. This is a strategic move to improve access to affordable mortgages, particularly for low and middle-income earners, a key target of Kenya's affordable housing agenda.
- Aggressive Expansion pursued by Retailers: The retail landscape has seen a surge in growth, with both domestic and international retailers like Naivas, QuickMart, China Square, and Carrefour aggressively expanding their market presence. These retailers are capitalizing on the opportunities created by the exit of distressed chains like Choppies, Nakumatt, Tuskys, and Uchumi. Furthermore, the influx of global brands such as Adidas, Puma, Aldo, and Michael Kors is poised to further fuel the sector's growth and development,
- Kenya’s Recognition as a Regional Business Hub: Kenya continues to enjoy recognition as a regional business hub. As a result, foreign entities have continued to open business operations in Kenya, boosting the demand for both commercial and residential Real Estate. Increased business activity has driven up demand for office space, apartments, and housing near business hubs, leading to the development of new projects, increased property values, and job creation in the construction sector,
- Positive Demographics: With relatively high urbanization and population growth rates of 3.8% p.a and 2.0% p.a, respectively, against the global average of 1.7% p.a and 0.9% p.a, respectively, as at 2023, there is a sustained demand for more housing units in the country,
- Increasing Investor Confidence: Increase in investor confidence has greatly influenced hospitality sector and this is evident through mergers, acquisitions and expansions of hotels. Furthermore, the number of international arrivals into the country by the end of 2024 registered a 9.9% year-to-year (y/y) increase to 438,712 persons as of December 2024 from 399,302 arrivals recorded in December 2023. Notably, the Hotel Chain Development Pipelines in Africa 2024 Report ranked Nairobi at 7th position by planned number of hotels and rooms with 31 hotels and 4,268 rooms in the pipeline, and,
- Special Built Developments: There has been an increased popularity of purpose-built properties to host Student housing, medical centers, Diplomatic residentials, data centers which offer potential for growth to the Real Estate sector through alternative markets. Due to these assets classes, the industry remains resilient despite the rapidly changing technological and economic environments.
- Easing Construction Costs: According to the Architectural Association of Kenya’s status of the built environment in Kenya 2024 report, Construction costs decreased by 6.8% from 2024 to an average of Kshs 66,375 per SQM from an average of Kshs 71,200 per SQM recorded in 2023. The decrease is primarily due to the Kenyan Shilling stabilization against the US dollar and low inflation rates, however, the improvement in construction cost remains subdued due to the increase in building materials such as cement which increased by 10.7% in December 2024 to Kshs 830 from Kshs 750 recorded in December 2023. Land prices increased as well, adding to the high construction costs
Despite the above drivers, the sector’s optimal performance is expected to be hampered by the following factors in 2025:
- Existing oversupply of physical space in select sectors: With approximately 5.8 mn SQFT in the NMA commercial office market, approximately 3.0 mn SQFT in the Nairobi Metropolitan Area (NMA) retail market, with the rest of the Kenyan retail market having an oversupply of approximately 1.7 mn SQFT. This has led to prolonged vacancy rates in the respective Real Estate sectoral themes,
- Subdued REITs Market: The REITs market in Kenya continues to be subdued owing to various challenges such as the large capital requirements of Kshs 100.0 mn for trustees compared to Kshs. 10 mn for pension fund Trustees, which limits the role to banks, prolonged approval process for REITs, only a few legal entities capable of incorporating REITs, high minimum subscription amounts or offer parcels set at Kshs 0.1 mn for D-REITs and 5.0 mn for restricted I-REITs and lack of adequate knowledge of the financial asset class by investors,
- Constrained financing to developers: Constrained financing to developers as cost of borrowing remains elevated and lenders continue to demand more collateral from developers as a result of the high credit risk in the real estate sector. By Q3’2024, however, gross non-performing loans against the gross loans disbursed decreased by 14.8% on a y/y to 11.5% in Q3’2024 from 26.3% in Q3’2023 basis on the back of operational improvements such as decrease in construction cost, stabilization of the Kenyan shilling improving import affordability, and,
- Underdeveloped capital markets: It is difficult to develop pools of capital focused on projects, particularly in the private markets, to supplement government efforts in providing housing. Banks in Kenya are the primary source of funding for real estate developers, providing nearly 95.0% of funding as opposed to 40.0% in developed countries. This means that capital markets contribute only 5.0% of Real Estate development funding, compared to 60.0% in developed countries as shown below;
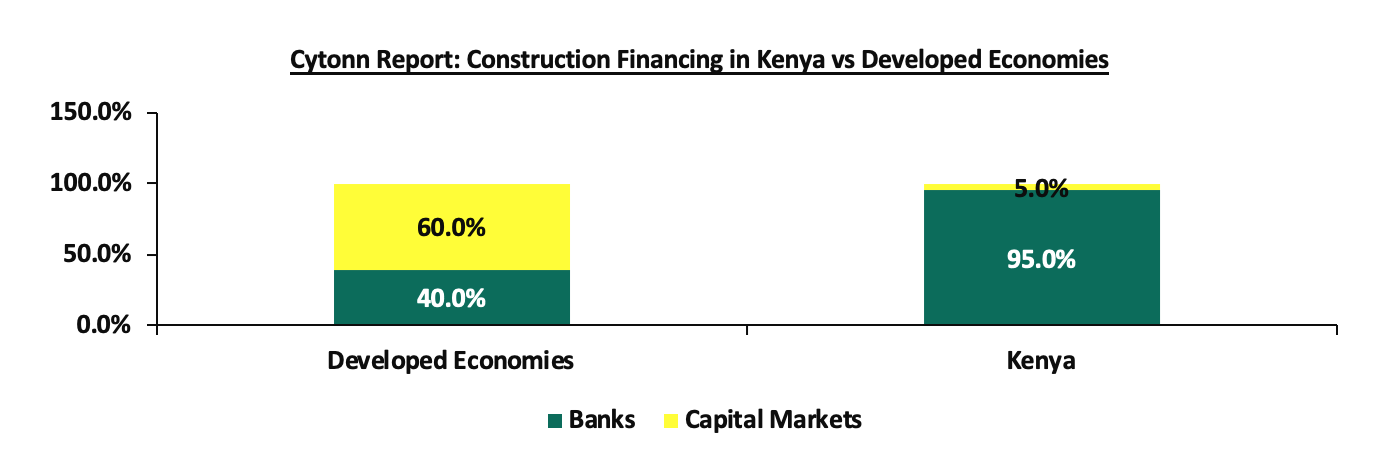
Source: World Bank, Capital Markets Authority
Sectoral Market Performance
- Residential Sector
During Q1’2025, the NMA residential sector recorded a slight increase in performance, with the average total returns to investors coming in at 6.3%, a 0.3%-point increase from 6.0% recorded in Q1’2024. The performance was attributed to a decrease in the residential average y/y price appreciation which came in at 0.8% in Q1’2025, 0.1%-points higher than the 0.7% appreciation recorded in Q1’2024, driven by increased property transactions during the year. On the other hand, the average rental yield came in at 5.5% in Q1’2025, recording a 0.1%-points increase from the 5.4% rental yield recorded in Q1’2024. This was driven by an increase in the average occupancy SQM by 3.0 % points to 91.6%, from 88.6% recorded in Q1’2024. The table below shows the NMA residential sector’s performance during Q1’2024 and Q1’2025;
|
Cytonn Report: Nairobi Metropolitan Area (NMA) Residential Sector Summary - Q1’2025/Q1’2024 |
||||||||||||
|
Segment |
Average of Price per SQM Q1'2025 |
Average of Rent per SQM Q1'2025 |
Average of Rental Yield Q1'2025 |
Average of Price Appreciation Q1'2025 |
Average of Total Returns Q1'2025 |
Average of Rental Yield Q1'2024 |
Average of Price Appreciation Q1'2024 |
Average of Total Returns Q1'2024 |
y/y change in Rental Yield (% Points) |
y/y change in Price Appreciation (% Points) |
y/y change in Total Returns (% Points) |
|
|
(All values in Kshs unless stated otherwise) |
||||||||||||
|
Detached Units |
||||||||||||
|
High End |
197,179 |
827 |
4.6% |
0.4% |
5.0% |
5.0% |
0.8% |
5.8% |
(0.4%) |
(0.4%) |
(0.8%) |
|
|
Upper Middle |
133,912 |
603 |
5.2% |
(1.1%) |
4.1% |
4.8% |
0.6% |
5.4% |
0.4% |
(1.7%) |
(1.3%) |
|
|
Lower Middle |
73,360 |
385 |
4.8% |
0.3% |
5.1% |
5.0% |
1.1% |
6.1% |
(0.2%) |
(0.8%) |
(1.0%) |
|
|
Detached Units Average |
134,817 |
605 |
4.9% |
(0.1%) |
4.7% |
4.9% |
0.8% |
5.8% |
(0.1%) |
(1.0%) |
(1.0%) |
|
|
Apartments |
||||||||||||
|
Upper Mid-End |
121,601 |
730 |
6.4% |
1.4% |
7.8% |
5.9% |
0.1% |
6.0% |
0.5% |
1.3% |
1.8% |
|
|
Lower Mid-End Suburbs |
88,082 |
468 |
6.0% |
1.6% |
7.5% |
5.7% |
0.8% |
6.5% |
0.3% |
0.8% |
1.0% |
|
|
Lower Mid-End Satellite Towns |
76,941 |
429 |
6.2% |
2.3% |
8.5% |
5.9% |
0.8% |
6.7% |
0.3% |
1.5% |
1.8% |
|
|
Apartments Average |
95,541 |
542 |
6.2% |
1.8% |
8.0% |
5.8% |
0.6% |
6.4% |
0.4% |
1.2% |
1.6% |
|
|
Residential Market Average |
115,179 |
574 |
5.5% |
0.8% |
6.3% |
5.4% |
0.7% |
6.1% |
0.2% |
0.1% |
0.3% |
|
Source: Cytonn Research
- Detached Units Performance
The table below shows the NMA residential sector detached units’ performance during Q1’2025;
|
Cytonn Report: Detached Units Summary Q1’2025 |
||||||||
|
Area |
Average of Price per SQM H1'2025 |
Average of Rent per SQM H1'2025 |
Av. OccupancyQ1'2025 |
Average of Uptake Q1'2025 |
Average of Annual Uptake H1'2025 |
Average of Rental Yield H1'2025 |
Average of Price Appreciation H1'2025 |
Total returns |
|
All values are in Kshs unless stated otherwise |
||||||||
|
High End |
|
|||||||
|
Kitisuru |
235,831 |
822 |
92.3% |
92.2% |
9.0% |
4.1% |
2.1% |
6.2% |
|
Rosslyn |
195,017 |
937 |
93.3% |
98.4% |
10.0% |
5.4% |
0.0% |
5.4% |
|
Runda |
264,213 |
1,005 |
96.0% |
96.8% |
7.5% |
5.0% |
0.0% |
5.0% |
|
Lower Kabete |
126,068 |
490 |
93.8% |
92.0% |
8.1% |
4.8% |
0.0% |
4.8% |
|
Karen |
164,766 |
879 |
92.1% |
93.7% |
8.3% |
3.9% |
(0.3%) |
3.6% |
|
Average |
197,179 |
827 |
93.5% |
94.6% |
8.6% |
4.6% |
0.4% |
5.0% |
|
Upper Middle |
||||||||
|
South B/C |
113,126 |
769 |
90.1% |
86.9% |
9.5% |
7.4% |
(0.1%) |
7.3% |
|
Runda Mumwe |
164,012 |
702 |
91.1% |
96.2% |
12.8% |
4.7% |
1.2% |
5.9% |
|
Loresho |
120,013 |
613 |
90.6% |
90.6% |
7.7% |
5.6% |
0.0% |
5.6% |
|
Ridgeways |
151,454 |
685 |
87.5% |
88.3% |
7.5% |
5.2% |
0.0% |
5.2% |
|
Langata |
114,255 |
423 |
91.5% |
87.8% |
7.0% |
4.2% |
0.3% |
4.5% |
|
Lavington |
190,104 |
623 |
92.4% |
94.7% |
9.0% |
3.8% |
(0.1%) |
3.7% |
|
Redhill & Sigona |
84,415 |
408 |
92.0% |
98.4% |
9.8% |
5.6% |
(9.2%) |
(3.7%) |
|
Average |
133,912 |
603 |
90.7% |
91.9% |
9.0% |
5.2% |
-1.1% |
4.1% |
|
Lower Middle |
|
|||||||
|
Ngong |
60,947 |
692 |
95.3% |
94.3% |
6.6% |
4.8% |
1.3% |
6.2% |
|
Juja |
73,774 |
253 |
89.8% |
93.8% |
7.1% |
4.2% |
1.5% |
5.6% |
|
Athi River |
86,221 |
402 |
90.3% |
94.4% |
8.8% |
5.0% |
0.5% |
5.5% |
|
Kitengela |
65,840 |
296 |
91.4% |
90.9% |
9.6% |
5.0% |
0.2% |
5.2% |
|
Donholm & Komarock |
93,582 |
400 |
87.5% |
89.5% |
9.0% |
4.6% |
0.0% |
4.6% |
|
Thika |
63,036 |
326 |
83.2% |
87.8% |
10.2% |
5.5% |
(0.9%) |
4.6% |
|
Syokimau/Mlolongo |
70,122 |
324 |
90.0% |
92.7% |
10.0% |
4.5% |
(0.3%) |
4.2% |
|
Average |
73,360 |
385 |
89.6% |
91.9% |
8.7% |
4.8% |
0.3% |
5.1% |
|
Grand Average |
134,817 |
605 |
91.3% |
92.8% |
8.8% |
4.9% |
(0.1%) |
4.7% |
source: Cytonn Research
The key take-outs from the table include;
- Average Total Returns – The average total returns to detached units’ investors came in at 4.7%, 0.9% lower than the 5.6% recorded in Q1’2024. The performance was driven by a 0.4%-points decrease in the average rental yield to 4.9% in Q1’2025, from 5.6% recorded in Q1’2024. The decrease in performance was attributable to a 3.7% decrease in the average rents per SQM to Kshs 605 in Q1’2025, from Kshs 628 recorded in Q1’2024,
- Segment Performance – The best-performing segment was the Lower-middle segment offering an average total return of 5.1%, attributable to a relatively high average price appreciation of 0.3%, 0.4%-points higher than the detached market average depreciation of 0.1%. The impressive performance of the segment was driven by returns from well-performing nodes such as Athirover, Ngong and Juja, which have continued to offer relatively high returns to investors, and,
- Nodal Performance – Overall, South B/C was the best-performing node, offering the highest returns at 7.3%, 2.6% points higher than the detached market average of 4.7%, driven by a relatively high rental yield of 7.4 %. The node has seen increased detached unit property investments owing to an inflow of residents brought about by the enhanced accessibility to the Nairobi CBD through various roads such as Mombasa road and the Nairobi Express way. Also, the area enjoys proximity to various amenities such as the SGR and JKIA. Ngong and kitisuru followed with an average total return of 6.2%, 1.5% points higher than the detached market average of 4.7%.
- Apartments Performance
The table below shows the NMA residential sector apartments’ performance during Q1’2025;
|
Cytonn Report: Residential Apartments Summary Q1'2025 |
||||||||
|
Area |
Average of Price per SQM Q1'2025 |
Average of Rent per SQM Q1'2025 |
Average of Occupancy Q1'2025 |
Average of Uptake Q1'2025 |
Average of Rental Yield Q1'2025 |
Average of Annual Uptake Q1'2025 |
Average of Price Appreciation |
Total Returns |
|
All values are in Kshs unless stated otherwise
|
||||||||
|
Upper Mid-End |
||||||||
|
Upperhill |
123,985 |
859 |
88.8% |
88.3% |
5.9% |
7.7% |
4.7% |
10.6% |
|
Kileleshwa |
127,397 |
738 |
96.1% |
92.9% |
6.7% |
9.6% |
1.1% |
7.7% |
|
Westlands |
132,102 |
731 |
90.5% |
92.3% |
6.4% |
12.4% |
1.1% |
7.5% |
|
Kilimani |
99,244 |
645 |
92.9% |
91.3% |
6.8% |
11.7% |
0.5% |
7.2% |
|
Parklands |
125,278 |
676 |
94.5% |
94.6% |
6.2% |
9.8% |
(0.5%) |
5.7% |
|
Average |
121,601 |
730 |
92.5% |
91.9% |
6.4% |
10.3% |
1.4% |
7.8% |
|
Lower Mid-End Suburbs |
||||||||
|
Dagoretti |
66,782 |
562 |
91.8% |
81.4% |
11.5% |
7.8% |
5.3% |
16.8% |
|
Imara Daima |
83,941 |
349 |
93.8% |
86.2% |
4.8% |
8.4% |
3.5% |
8.3% |
|
Langata |
99,739 |
649 |
93.8% |
93.0% |
6.1% |
9.1% |
1.8% |
7.9% |
|
Race Course/Lenana |
79,883 |
519 |
87.5% |
86.8% |
5.9% |
8.8% |
0.8% |
6.7% |
|
Waiyaki Way |
70,866 |
362 |
91.9% |
92.3% |
5.7% |
11.1% |
0.3% |
6.0% |
|
Kahawa West |
75,799 |
342 |
96.1% |
94.3% |
4.7% |
6.1% |
0.6% |
5.3% |
|
South B |
109,317 |
494 |
93.0% |
98.0% |
4.9% |
11.3% |
0.3% |
5.2% |
|
South C |
118,331 |
467 |
84.9% |
96.2% |
4.1% |
12.1% |
0.0% |
4.1% |
|
Average |
88,082 |
468 |
91.6% |
91.0% |
6.0% |
9.3% |
1.6% |
7.5% |
|
Lower Mid-End Satellite Towns |
||||||||
|
Athi River |
54,482 |
418 |
97.3% |
96.0% |
9.1% |
9.3% |
5.9% |
14.9% |
|
Ngong |
63,153 |
383 |
94.6% |
95.5% |
6.4% |
10.7% |
5.5% |
12.0% |
|
Kikuyu |
83,730 |
438 |
95.8% |
96.0% |
6.3% |
13.7% |
3.1% |
9.3% |
|
Syokimau |
66,577 |
354 |
87.4% |
89.8% |
5.7% |
8.4% |
2.6% |
8.3% |
|
Thindigua |
100,051 |
484 |
90.8% |
88.5% |
5.3% |
10.7% |
0.9% |
6.2% |
|
Ruaka |
104,524 |
544 |
91.2% |
90.2% |
5.3% |
10.8% |
0.9% |
6.3% |
|
Ruiru |
88,872 |
502 |
87.6% |
86.4% |
6.0% |
10.9% |
0.0% |
6.0% |
|
Rongai |
54,135 |
312 |
90.1% |
89.4% |
5.7% |
10.5% |
(0.4%) |
5.3% |
|
Average |
76,941 |
429 |
91.8% |
91.5% |
6.2% |
10.6% |
2.3% |
8.5% |
|
Apartment Grand Average |
95,541 |
542 |
92.0% |
91.5% |
6.2% |
10.1% |
1.8% |
8.0% |
Source: Cytonn Research
The key take-outs from the table include;
- Average Total Returns – The average total returns to apartments’ investors came in at 8.0%, recording a 3.6%-points increase from the 5.6% recorded during Q1’2024. The significant improved performance was driven by a 1.2%-points increase in the average rental yield to 6.2% in Q1’2025, from 5.0% recorded in Q1’2024. This was driven by slight increase in apartment property transactions during the period, attributable to 0.7% points increase in the average occupancy to 92.0% in Q1’2025 from 91.3% in Q1’2024,
- Segment Performance – The best-performing segment was the lower mid-end suburbs towns with average total returns of 8.5%, attributed to a relatively high average y/y price appreciation of 2.3% and rental yield of 6.2%. The impressive performance of the segment was driven by returns from well-performing nodes such as Athi River, Ngong and Kikuyu that have continued to offer competitive returns to investors in comparison to other segments, and
- Nodal Performance – Overall, the best-performing node was Dagorreti, offering investors average total returns of 16.8%, 8.8%-points higher than the apartment market average total return of 8.0%. Dagorreti is attracting apartment investments owing to infrastructural development with the roads such as Ngong Road, proximity to CBD favouring residents in the area, a high number of middle-class families in the area, proximity to retail centers such as the Junction mall, and proximity to international standard schools such as Riara group of schools
Notable Highlights during the week,
- Non-Salaried workers to get affordable mortgages
During the week, Kenya introduced a State-backed initiative to provide affordable mortgages of up to Kshs 6.0 mn to non-salaried workers, aiming to enhance homeownership among the informal sector, which comprises approximately 83.0% of the nation's 18.0 mn labor force. The Kenya Mortgage Guarantee Trust (KMGT) will cover up to 40.0% of defaulted mortgages, encouraging banks and savings and credit cooperative societies (Saccos) to extend credit to individuals with irregular incomes.
This initiative addresses the challenge that many workers lack the consistent monthly pay required by traditional mortgage models. Even among the 3 mn formally employed workers, 88.0% earn less than kshs 100,000 monthly, raising concerns about their ability to afford mortgage repayments. By reducing perceived risk for lenders, KMGT aims to make homeownership more accessible.
The KMGT scheme is expected to stimulate demand for affordable housing, aligning with government efforts to increase homeownership. The Affordable Housing Board reports 124,000 houses under construction, with 4,888 units expected to be ready by June 2025. These units cater to various income brackets, including social housing for those earning less than Kshs 20,000 monthly and affordable housing for incomes between Kshs 20,000 and Kshs 149,000.
- World Bank gives Kshs 560.0 mn to guarantee home loans
During the week, Kenya secured Kshs 559.6 mn from the World Bank Group to initiate a credit guarantee scheme aimed at providing affordable mortgages to non-salaried workers, commonly referred to as "hustlers." This initiative, managed by the Kenya Mortgage Guarantee Trust (KMGT), seeks to mitigate lender risk by covering up to 40% of potential mortgage defaults, encouraging financial institutions to extend home loans to informal sector workers who typically lack consistent income streams.
The KMGT operates in collaboration with the Kenya Mortgage Refinance Company (KMRC), which has been instrumental in providing affordable mortgage financing by disbursing Kshs 11.9 bn to financial institutions since its inception. Despite these efforts, Kenya's mortgage market remains underdeveloped, with only 30,015 home loans totaling Kshs 281.5 bn as of December 2023, and an average loan size of Kshs 9.4 mn—figures that highlight the challenges low- and middle-income earners face in accessing home financing.
The introduction of this credit guarantee scheme is expected to stimulate demand for affordable housing units, particularly those priced between Kshs 1.0 mn and Kshs 3.5 mn, aligning with the government's Affordable Housing Programme, which currently has 124,000 units under construction. However, the scheme's effectiveness may be tempered by economic challenges, including low and irregular incomes among informal workers and a high non-performing loan (NPL) ratio, which stood at 16.1% as of December 2024. These factors could limit the ability of potential borrowers to meet mortgage repayment obligations, despite the partial risk mitigation provided by the KMGT.
While the World Bank-funded credit guarantee scheme represents a significant step toward inclusive homeownership in Kenya, its success will depend on addressing broader economic issues and implementing complementary measures to enhance the affordability and accessibility of mortgage financing for the informal sector
- Launch of 4,888 affordable houses postponed
During the week ,the state postponed the launch of 4,888 housing units, initially scheduled for March 2025, has been postponed to May 2025 due to delays in the installation of essential fittings, notably lifts. Housing Principal Secretary Charles Hinga acknowledged the setback, stating that while final touches are being applied and the allocation process is ongoing, the realistic timeline for completion is now May 2025
This postponement underscores the broader challenges facing the AHP. The program aims to deliver 200,000 housing units annually to mitigate Kenya's substantial housing shortfall. However, as of February 2025, only 124,000 units were reported to be at various stages of construction, highlighting a significant lag behind targets. Additionally, the program has experienced low public engagement; since the introduction of a housing levy in July 2023, which deducts 1.5 percent from workers' salaries matched by employers, much of the collected funds have been invested in Treasury papers due to challenges in fund absorption within the program.
We expect that in light of these delays, it is imperative for the government to address the underlying issues causing delays in the AHP. Ensuring timely completion of housing projects, improving fund absorption mechanisms, and enhancing transparency in the allocation process are critical steps toward restoring public trust and achieving the program's ambitious goals. Additionally, fostering collaboration with private sector stakeholders may provide innovative solutions to expedite project delivery and enhance the overall effectiveness of the Affordable Housing Program
We expect that the above initiatives by KMRC and the AHP by the state , will contribute positively on improving home ownership in Kenya. The Centre for Affordable Housing Finance Africa (CAHF) estimates that Kenya faces an annual housing deficit of 80.0%. Currently, only 50,000 new houses are built each year, while the demand stands at approximately 250,000 units, leaving a shortfall of about 200,000 homes annually. The Centre for Affordable Housing Finance in Africa (CAHF) reports that 61.3% of Kenyans own homes, compared to other African countries like Angola and Algeria with 75.4% and 74.8% national home ownership rates respectively. The national homeownership rate stands at approximately 29.5% in urban areas sprawling the national average of 61.3% while 78.7% of urban dwellers rent. The government's push for affordable housing aims to improve this rate by making homes more accessible to lower and middle-income earners. The graph below shows the home ownership percentages for different countries compared to Kenya;
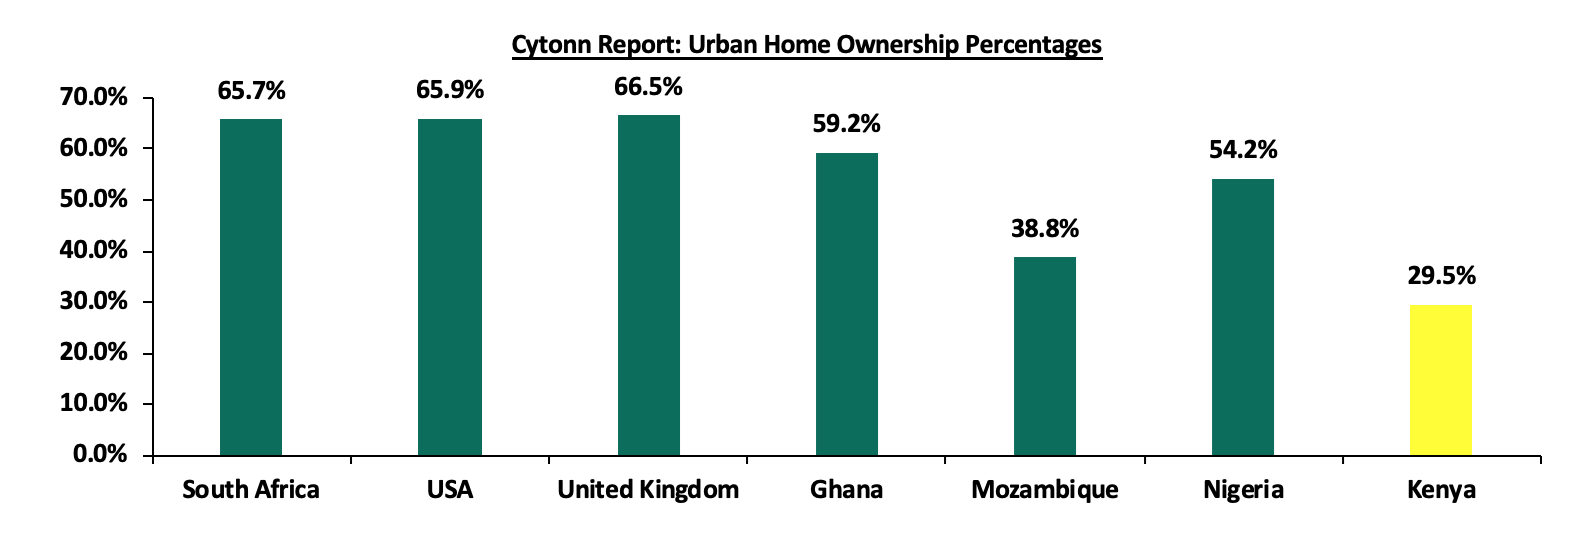
Source: Centre for Affordable Housing Finance Africa (CAHF), US Census Bureau, UK Office for National Statistics
Notable developments during Q1’2025;
- The Jogoo Road Phase I Affordable Housing Project, a 500 units residential development, was launched by President William Ruto. The project is a flagship initiative under Kenya’s Affordable Housing Program (AHP) aimed at addressing the housing deficit in urban areas. Located in Makadara Constituency, Nairobi County, the project targets low and middle-income families by offering affordable housing units in a region where demand for quality, cost-effective homes is high. This project is expected to provide a viable alternative by integrating modern housing with improved infrastructure, while also addressing past issues of displacement. The total project cost is estimated at approximately Kshs 1.0 bn. For more information, please see our Cytonn weekly #11.2025
- There was a discussions surrounding President William Ruto’s affordable housing initiative have sparked concerns about the project’s transparency, financial viability, and long-term sustainability. Critics argue that the ambitious program, which aims to address Kenya’s housing deficit by constructing low-cost units across the country, may suffer from inadequate oversight mechanisms and unclear funding structures. One major red flag involves the proposed financing model, which relies on a mandatory levy collected from workers and employers. For more information, please see our Cytonn weekly #10.2025
- The Kenyan government announced its plan to pursue an ambitious plan to secure Kshs 9.2 bn from private investors to construct 2,820 affordable homes in Stoni Athi, Machakos County, as part of its Affordable Housing Programme. This initiative aligns with the government’s goal of delivering 200,000 housing units annually to address Kenya’s pressing housing deficit, a challenge that demands hundreds of thousands of new homes each year. The National Housing Corporation (NHC) is driving this effort through a Public-Private Partnership (PPP) model, where private developers fund construction on NHC-owned land, while the government contributes infrastructure, including roads and electricity. For more information, please see our Cytonn Monthly-February 2025
- President William Ruto laid the foundation stone for the Mokowe Affordable Housing Project in Lamu County, marking a significant step in Kenya’s quest to address its housing deficit. This ambitious initiative, located in Mokowe within Lamu West Constituency, comprises 468 residential units and 75 commercial shops, reflecting a broader vision to enhance living standards and stimulate economic growth in the coastal region. Valued at Kshs 1.2 bn, the project is part of the government’s Affordable Housing Programme, which aims to construct over 200,000 units annually nationwide. For more information, please see our Cytonn Monthly-February 2025
- Mi Vida Homes announced a strategic partnership with HF Group Kenya’s banking division, to enhance homeownership and real estate investment in the country. As part of the agreement, HFC will provide up to 95.0% mortgage financing at a fixed interest rate of 9.5% for a repayment period of up to 20 years. This initiative is aimed at making homeownership more accessible and encouraging buyers to invest in property instead of renting. For more information, please see our Cytonn Monthly-January 2025
- GulfCap Real Estate broke ground for a Kshs 120.0 bn housing project in Kisumu marking a significant development in Kenya's real estate sector. Spanning 285 acres, the project aims to address the growing demand for housing in Kisumu, a city experiencing rapid urbanization and population growth. For more information, please see our Cytonn Weekly #04/2025.
We have a NEUTRAL outlook for the NMA residential sector, we expect continued vibrant performance in the residential sector within the country sustained by; i)ongoing residential developments under the Affordable Housing Agenda, aiming to reduce the housing deficit in the country currently estimated at 80.0%, ii) increased investment from local and international investors in the housing sector, iii) favorable demographics in the country, shown by high population and urbanization rates of 3.8% p.a and 2.0% p.a, respectively, leading to higher demand for housing units. However, challenges such as rising construction costs, strain on infrastructure development, and limited access to financing will continue to restrict the optimal performance of the residential sector.
- Commercial Office Sector
The table below highlights the performance of the Nairobi Metropolitan Area (NMA) Commercial Office sector over time;
|
Cytonn Report: Nairobi Metropolitan Area (NMA) Commercial Office Returns Over Time |
||||||
|
Year |
Q1'2024 |
H1'2024 |
Q3'2024 |
FY'2024 |
Q1'2025 |
∆ Q1'2023/Q1'2024 |
|
Occupancy % |
80.1% |
80.1% |
79.6% |
80.7% |
80.3% |
0.2% |
|
Asking Rents (Kshs/SQFT) |
103 |
103 |
104 |
105 |
105 |
1.7% |
|
Average Prices (Kshs/SQFT) |
12,665 |
12,677 |
12,677 |
12,614 |
12,614 |
(0.4%) |
|
Average Rental Yields (%) |
7.6% |
7.7% |
7.7% |
7.8% |
7.6% |
0.0% |
Source: Cytonn Research
- Average Asking Rents – In Q1’2025, average asking rents per SQFT in the NMA increased by 1.7% to Kshs 105 per SQFT from Kshs 103 in Q1’2024. The increase was driven by a rise in the supply of grade one offices in the area such as Purple Tower, The Atrium, Mandrake, Highway Heights, Matrix One, among others ultimately pushing the asking prices higher. On a quarter-on-quarter (q/q) basis, the performance remained quite unchanged. This can be attributed to the performance of the Kenyan Shilling, which has begun gaining ground against the US dollar and remaining moderately constant,
- Average Occupancy Rate – In Q1’2025 commercial office occupancy increased by 0.2% points to 80.3% from 80.1% recorded in Q1’2024. On q/q basis, occupancy decreased by 0.4%. On y/y basis the increase in occupancy can be linked to the decline in supply of office space in the area witnessed in 2024. However, on q/q basis the decrease can be attributed by the increase in serviced offices, where some businesses prefer leasing short-term offices rather than buying an entire office space, and,
- Average Rental Yield – The average rental yield remained stable on y/y basis. On q/q basis the performances declined slightly due to the marginal decrease in occupancy.
For submarket performance, Gigiri stood out with the best performance, boasting an average rental yield of 8.8% in Q1’2025, compared to the market average of 7.6%. Westlands and Kilimani followed, with rental yields of 8.7% and 8.2%, respectively. We attribute this performance to several factors: i) a high concentration of Grade One offices in the areas, ii) robust infrastructure developments such as roads, iii)close proximity to residential areas, iv) increasing demand for quality offices by embassies, international organizations, and multinational companies in the areas, and v) the presence of after-work amenities such as hotels and quality social venues. On the other hand, Thika Road was the least performing node with an average rental yield of 6.1% in Q1’2025, 1.5% points lower than the market average of 7.6%. The performance can be attributed to i) relatively low demand for office spaces due to its distance from key business hubs, ii) preference for more established commercial zones by corporates and multinational firms, iii) inadequate presence of high-end office developments that attract premium tenants, and, iv) offices of relatively lower quality, which are perceived as less attractive and thus command lower rents. The table below displays the performance of sub-markets in the Nairobi Metropolitan Area (NMA).
|
Cytonn Report: NMA Commercial Office Submarket Performance Q1'2025 |
|||||||||||
|
Area |
Price/SQFT Q1'2025 |
Rent/SQFT Q1'2025 |
Occupancy Q1'2025 |
Rental Yields Q1'2025 |
Price/SQFT Q1'2024 |
Rent/SQFT Q1'2024 |
Occupancy Q1'2024 |
Rental Yields Q1'2024 |
∆ in Rent |
∆ in Occupancy (% points) |
∆ in Rental Yields (% points) |
|
All values in Kshs unless stated otherwise |
|||||||||||
|
Gigiri |
14,850 |
131 |
82.6% |
8.8% |
15,000 |
128 |
80.2% |
8.2% |
2.3% |
2.4% |
0.5% |
|
Westlands |
12,448 |
119 |
81.5% |
8.7% |
12,495 |
118 |
76.3% |
8.5% |
0.6% |
5.2% |
0.2% |
|
Kilimani |
12,873 |
101 |
82.7% |
8.2% |
13,051 |
100 |
83.2% |
7.8% |
0.8% |
(0.5%) |
0.5% |
|
Karen |
14,077 |
115 |
80.3% |
8.1% |
14,254 |
118 |
80.5% |
8.0% |
(2.0%) |
(0.2%) |
0.1% |
|
Nairobi CBD |
12,206 |
92 |
86.6% |
7.9% |
12,029 |
89 |
85.6% |
7.6% |
2.6% |
1.0% |
0.2% |
|
Parklands |
11,922 |
94 |
83.0% |
7.8% |
11,875 |
92 |
84.0% |
7.8% |
2.2% |
(1.0%) |
0.0% |
|
Upperhill |
12,857 |
104 |
73.2% |
6.5% |
13,014 |
100 |
72.9% |
6.3% |
3.4% |
0.3% |
0.2% |
|
Mombasa Road |
11,325 |
80 |
72.2% |
6.5% |
11,325 |
79 |
72.2% |
6.0% |
1.3% |
0.0% |
0.5% |
|
Thika Road |
12,643 |
90 |
71.7% |
6.1% |
12,571 |
79 |
80.4% |
6.0% |
14.1% |
(8.7%) |
0.0% |
|
Average |
12,614 |
105 |
80.3% |
7.6% |
12,665 |
103 |
80.1% |
7.6% |
2.8% |
0.2% |
0.0% |
Source: Cytonn Research
For notable highlights during the quarter; please see our Cytonn Monthly – January 2025.
Our outlook for the NMA commercial office sector remains NEUTRAL, driven by factors such as i) a rising presence of multinational corporations in the country, is expected to enhance occupancy rates, ii) the increasing trend of co-working spaces, and, iii) a decrease in developments witnessed in 2024, which we predict will help alleviate the current oversupply issue. However, the sector’s performance will be limited by the persistent oversupply of office space totalling 5.7 mn SQFT in the NMA. Investment opportunity lies in Gigiri, Westlands and Kilimani offering relatively higher returns compared to the market average.
- Retail Sector
The table below shows the performance of the retail sector performance in Nairobi Metropolitan Area from Q1’2024 to Q1’2025;
Cytonn Report: Summary of Retail Sector Performance in Nairobi Metropolitan Area Q1’2024 - Q1’2025
|
Item |
Q1’2024 |
H1’2024 |
Q3'2024 |
FY'2024 |
Q1’2025 |
Y/Y 2025 ∆ |
|
(All values in Kshs unless stated otherwise) |
||||||
|
Average Asking Rents (Kshs/SQFT) |
180.0 |
185.0 |
184.7 |
182.5 |
182.5 |
1.5% |
|
Average Occupancy (%) |
79.3% |
79.5% |
81.4% |
82.0% |
81.8% |
2.5% |
|
Average Rental Yields |
8.1% |
8.2% |
8.2% |
8.4% |
8.3% |
0.2% |
Source: Cytonn Research
The key take-outs from the table include;
- Average Occupancy Rate - In Q1’2025, the retail sector witnessed a notable uptick in average occupancy rates, increasing by 2.5%-points to reach 81.8%, compared to the 79.3% recorded in the same period of 2024. This surge can be attributed to several key factors: i) vigorous expansion endeavors undertaken by both domestic and international retailers such as Naivas, QuickMart, Carrefour, and Magunas, ii) sustained demand for consumer goods and services, buoyed by favorable demographic trends, iii) adaptation to evolving market dynamics, exemplified by initiatives like Jaza Stores and Carrefour allowing purchases to be made online via platforms like Whatsapp, aligning with shifting consumer preferences, and, iv) ongoing improvements in infrastructure not only bolstering existing retail spaces but also unlocking new regions for retail growth opportunities, thus broadening the scope of the sector's expansion,
- Asking Rents - In Q1’2025, there was a notable surge in average rental rates per SQFT, climbing by 1.5% to Kshs 182.5, up from Kshs 180.0 in Q1’2024. This increase was driven by several key factors: i) the continued demand for premium retail spaces in strategic areas within the Nairobi Metropolitan Area (NMA), such as Karen, Kilimani, Westlands, and along Kiambu and Limuru roads. These locations, known for their quality offerings, attracted both local and foreign businesses seeking proximity to multinational organizations and embassies, serving an international clientele, ii) a limited supply of new retail space in prime locations, tightening availability and boosting demand for existing space, iii) continued recovery in consumer footfall and retail activity following economic stabilization efforts, and iv) the entry of renowned global brands like Adidas, Puma, Michael Kors, and Aldo into the Kenyan market, competing for prime retail spaces and further driving up rental rates, and,
- Average Rental Yield- The average rental yield for the NMA retail sector improved by 0.2%-points to 8.3% in Q1’2025, from 8.1% in Q1’2024, as a result of improved asking rents and occupancy rates.
In terms of sub-market performance, Karen, Kilimani, and Ngong Road demonstrated impressive average rental yields of 9.9%, 9.8%, and 8.7% respectively, outpacing the overall market average of 8.3%. This strong performance was largely driven by the increased demand for retail offerings in the above locations, as well as the presence of top-tier retail spaces commanding higher rents, coupled with the provision of quality infrastructure services enhancing the attractiveness for both tenants and customers. Conversely, retail spaces in Satellite towns reported the lowest average rental yield at 7.2%, influenced by several factors: i) rental rates significantly below the market average of Kshs 182 per SQFT, standing at Kshs 140 per SQFT resulting from the presence of lower quality spaces in the region, ii) inadequate infrastructure across most towns within the region, hindering accessibility and sustainability for retail spaces, and, iii) the prevalence of informal retail spaces and service stations, offering competitive rates and diverse amenities, intensifying market competition and impacting demand.
The following table illustrates the submarket performance of nodes within the Nairobi Metropolitan Area (NMA) in Q1’2025;
|
Cytonn Report: Nairobi Metropolitan Area Retail Market Performance Q1’2025 |
|||||||||
|
Area |
Rent Kshs/SQFT Q1’2025 |
Occupancy% Q1’2025 |
Rental Yield Q1’2025 |
Rent Kshs/SQFT Q1’2024 |
Occupancy% Q1’2024 |
Rental Yield Q1’2024 |
∆ in Rental Rates |
∆ in Occupancy (% points) |
Q1’2025 ∆ in Rental Yield (% points) |
|
(All values in Kshs unless stated otherwise) |
|||||||||
|
Karen |
218 |
90.9% |
9.9% |
218 |
81.0% |
9.0% |
0.0% |
9.9% |
0.9% |
|
Kilimani |
198 |
82.2% |
9.8% |
198 |
80.0% |
9.5% |
0.0% |
2.2% |
0.3% |
|
Ngong Road |
191 |
86.2% |
8.7% |
181 |
82.1% |
8.5% |
5.7% |
4.0% |
0.2% |
|
Kiambu road & Limuru Road |
187 |
76.3% |
8.7% |
205 |
74.3% |
8.9% |
(8.9%) |
2.0% |
(0.2%) |
|
Mombasa road |
165 |
85.0% |
8.6% |
169 |
78.0% |
8.0% |
(2.1%) |
7.0% |
0.6% |
|
Westlands |
239 |
79.4% |
7.6% |
213 |
80.2% |
8.8% |
12.3% |
(0.8%) |
(1.2%) |
|
Thika Road |
160 |
77.7% |
7.4% |
155 |
82.2% |
7.2% |
3.2% |
(4.5%) |
0.2% |
|
Eastlands |
161 |
78.1% |
7.3% |
146 |
77.7% |
6.4% |
10.3% |
0.4% |
0.9% |
|
Satellite towns |
140 |
82.8% |
7.2% |
139 |
80.0% |
6.8% |
0.7% |
2.8% |
0.3% |
|
Average |
182 |
81.8% |
8.3% |
180 |
79.3% |
8.1% |
6.6% |
(0.5%) |
0.2% |
Source: Cytonn Research
For notable highlights during the quarter; please see our Cytonn Monthly – February 2025 and Cytonn Monthly – January 2025.
We maintain a NEUTRAL outlook on the retail sector’s performance, which is anticipated to be influenced by several key drivers: i) continued aggressive expansion efforts by both local and foreign retailers, as they seek to secure new and existing spaces to capitalize on evolving consumer preferences and market dynamics, ii) ongoing advancements in public infrastructure, including road and railway projects, are expected to enhance accessibility to new areas for retail investments, stimulating further growth opportunities, and, iii) positive demographic trends, characterized by a growing population, are anticipated to underpin increasing demand for retail goods and services. However, the sector's growth momentum may face headwinds from certain negative factors, including: i) escalating adoption of e-commerce by retailers, which continues to erode traditional occupier demand for physical retail spaces, necessitating innovative strategies to adapt to changing consumer shopping habits, and, ii) limited access to and expensive financing from financial institutions for retail developments, coupled with the imperative for small and medium-sized enterprises (SMEs) to invest in technological advancements to enhance operational efficiency and competitiveness in the market.
- Hospitality Sector
During Q1’2025, the following Industry Reports related to the Hospitality sector was released, namely;
|
Cytonn Report: Released Industry Report related to Hospitality Sector Q1’2024 |
||
|
# |
Report |
Key Take-outs |
|
1 |
Leading Economic Indicators (LEI) December 2024 Report by the Kenya National Bureau of Statistics (KNBS) |
|
|
2 |
The Q3’2024 GDP Report by the Kenya National Bureau of Statistics (KNBS) |
|
Source; Cytonn Research
Additionally, during Q1’2025, we had the following highlights relating to the hospitality sector;
- Radisson Blu Arboretum Hotel in Nairobi announceda Kshs 1.4 bn renovation plan to upgrade its facilities and enhance guest experiences. The refurbishment will focus on modernizing guest rooms, meeting spaces, dining areas, and recreational facilities to align with contemporary hospitality standards. This initiative underscores Radisson Hotel Group's commitment to maintaining its competitive edge in Nairobi's burgeoning hospitality sector. For more information, please see our Cytonn Weekly #12/2025.
- Marriott International is broadening its footprint in Kenya’s luxury safari market through a recent agreement with Lazizi Group of Companies to developtwo exceptional tented camps: The Ritz-Carlton, Masai Mara Safari Camp and JW Marriott Mount Kenya Rhino Reserve Safari Camp. This move builds on the triumph of the JW Marriott Masai Mara Lodge, launched in 2023, and reflects Marriott’s ambition to meet the rising appetite for exclusive, nature-immersive travel experiences across Africa. For more information, please see our Cytonn Monthly – February 2025.
We maintain a NEUTRAL outlook for the hospitality sector in the upcoming quarter, with several factors expected to provide support: i) intensive marketing efforts aimed at promoting Kenya’s tourism market, which are anticipated to result in improved tourist arrivals, bolstering occupancy rates for hospitality establishments, ii) positive accolades accorded to Kenya’s tourism industry on the international stage, enhancing the country's reputation as a preferred tourist destination and attracting more visitors, iii) collaborative partnerships within the tourism sector aimed at fostering growth and innovation, leveraging synergies to capitalize on emerging opportunities, iv) supportive events such as the 2025 World Rally Championship and initiatives within the hospitality sector aimed at boosting tourism activity and enhancing guest experiences, v) direct flights from Dubai to Mombasa by FlyDubai, which is expected to increase accessibility and attract tourists from key markets, and vi) increased promotion of local tourism initiatives by the Ministry of Tourism under its Tourism Strategy 2021-2025, emphasizing domestic tourism as a key priority for stimulating sectoral growth. However, the sector may face challenges stemming from: i) cautionary statements issued by US Embassy to its citizens in Kenya in March 2025, which may impact international tourist arrivals and dampen demand for hospitality services, and ii) difficulty in accessing finance, as lenders may demand more collateral to mitigate elevated credit risk, potentially limiting investment in hospitality infrastructure and expansion projects.
- Land Sector
During the period under review, the land sector in Nairobi Metropolitan Area (NMA) recorded a price appreciation of 2.7% to Kshs 130.9 mn from 128.9 mn. This performance was supported by;
- The growing demand for land in the Nairobi Metropolitan Area (NMA) is driven by a rising population, as individuals from various regions of the country migrate annually in search of employment, education, and other opportunities,
- The fixed supply of land has intensified demand, particularly for residential and commercial purposes, leading to an increase in land prices,
- There is an expanding middle class in the NMA with disposable income, willing to invest in land as a savings and investment option,
- The government's ongoing infrastructural development projects, such as roads, sewers, railways, and water connections, are opening up more satellite towns, subsequently driving land prices upward,
- The widely held belief among the middle class that land represents a secure form of wealth has prompted many families to save specifically for land acquisition, and,
- The government’s Affordable Housing Program, under the Bottom-Up Economic Transformation Agenda (BETA), has initiated construction projects across various parts of Nairobi and the country, further increasing land values due to heightened construction activity.
Overall Performance:
Un-serviced land in Satellite Towns registered the highest capital appreciation during the period under review, with an annual capital appreciation of 4.5%, where the average selling price rose to Kshs 16.1 mn from Kshs 15.4 mn recorded in FY’2023. The performance in this segment can be attributed to several factors: i) relatively lower prices, with the average selling prices at Kshs 16.1 mn compared to the market average of Kshs 130.9 mn in the Nairobi Metropolitan Area (NMA), ii) a growing middle class willing to invest in Satellite Towns as they settle their families, iii) the anticipation of price increases once various services are introduced in these areas, and iv) the desire to settle in areas free from the city's hustle .On the other hand, land in Nairobi Suburbs under the Commercial Areas recorded the least movement with an annual capital appreciation of 1.0%, below the market average of 2.7%. This was mainly due to the high selling prices, which averaged Kshs 396.4 mn, relatively higher than the market average of Kshs 131.1 mn. The table below shows the overall performance of the sector across all land sub-sectors during Q1’2025;
|
|
Q1’2024 |
Q1’2025 |
Annualized Capital Appreciation |
|
Un-serviced land-satellite Towns |
15.4 mn |
16.1 mn |
4.5% |
|
Nairobi Suburbs- High Rise Residential Areas |
82.3 mn |
85.3 mn |
3.5% |
|
Serviced land-Satellite Towns |
18.7 mn |
19.3 mn |
3.2% |
|
Nairobi Suburbs (Low Rise & High Residential Areas) |
135.7 mn |
137.3 mn |
1.2% |
|
Nairobi Suburbs- Commercial Areas |
392.6 mn |
396.4 mn |
1.0% |
|
Average |
128.9 mn |
130.9 mn |
2.7% |
Source: Cytonn Research
Sub-markets Performance – For the unserviced satellite towns, Juja, Limuru, and Utawala emerged as the best-performing nodes with annualized capital appreciation of 6.3%, 5.7% and 4.8%, respectively. This performance can be attributed to: i) good transport network connecting these areas to Nairobi ii) a rising middle class looking to settle in these areas, iv) good proximity to retail centers such as malls, and v) relatively affordable prices compared to the market average. Additionally, land in unserviced towns presents a good opportunity for speculative investors, who invest in anticipation of price appreciation. On the other hand, Commercial Areas in Nairobi’s Suburbs registered the least average price movement, with Kilimani recording a appreciation of 0.4%. The segment had the highest price per acre, with the average selling price coming in at Kshs 396.4 mn, significantly higher than the market average of Kshs 130.9 mn. Notably, some areas in this segment, such as Kilimani, are witnessing an influx of high-rise apartments, which has made them less attractive. The table below shows NMA’s land performance by submarkets in Q1’2025;
|
Cytonn Report: Nairobi Metropolitan Area Land Performance by Submarkets – Q1’2025 |
|||
|
Location |
Price Q1’2024 |
Price Q1’2025 |
Capital Appreciation |
|
Price in Kshs per Acre |
|||
|
Satellite Towns - Unserviced Land |
|||
|
Juja |
15.0 mn |
15.9 mn |
6.3% |
|
Limuru |
23.5 mn |
24.8 mn |
5.7% |
|
Utawala |
16.7 mn |
17.5 mn |
4.8% |
|
Rongai |
16.4 mn |
17.1 mn |
4.2% |
|
Athi River |
5.2 mn |
5.3 mn |
1.3% |
|
Average |
15.4 mn |
16.1 mn |
4.5% |
|
Satellite Towns - Serviced Land |
|||
|
Rongai |
17.1 mn |
18.3 mn |
7.1% |
|
Athi River |
15.5 mn |
16.0 mn |
3.3% |
|
Ruai |
12.4 mn |
12.8 mn |
3.2% |
|
Ruiru & Juja |
28.1 mn |
20.8 mn |
1.3% |
|
Syokimau |
20.5 mn |
28.7 mn |
2.2% |
|
Average |
18.7 mn |
19.3 mn |
3.2% |
|
Nairobi Middle End Suburbs – High Rise Residential Areas |
|||
|
Kasarani |
82.2 mn |
86.7 mn |
5.2% |
|
Embakasi |
79.2 mn |
83.1 mn |
4.6% |
|
Dagoretti |
85.6 mn |
86.2 mn |
0.7% |
|
Average |
82.3 mn |
85.3 mn |
3.5% |
|
Nairobi High End Suburbs (Low- and High-Rise Areas) |
|||
|
Kileleshwa |
296.2 mn |
308.7 mn |
4.2% |
|
Ridgeways |
87.0 mn |
90.1 mn |
3.6% |
|
Runda |
87.9 mn |
89.3 mn |
1.7% |
|
Kitisuru |
95.0 mn |
96.4 mn |
1.4% |
|
Spring Valley |
176.5 mn |
175.7 mn |
(0.5%) |
|
Karen |
65.7 mn |
63.9 mn |
(2.8%) |
|
Average |
135.7 mn |
137.3 mn |
1.2% |
|
Nairobi Suburbs - Commercial Zones |
|||
|
Westlands |
413.2 mn |
419.7 mn |
1.6% |
|
Riverside |
323.0 mn |
327.4 mn |
1.4% |
|
Upperhill |
458.1 mn |
461.3 mn |
0.7% |
|
Kilimani |
375.9 mn |
377.3 mn |
0.4% |
|
Average |
392.6 mn |
396.4 mn |
1.0% |
Source: Cytonn Research
We maintain a POSITIVE outlook for the land sector in the Nairobi Metropolitan Area (NMA), considering it a dependable investment opportunity that has shown improving performance year on year. Going forward, we expect the sector's performance to be driven by several factors: i) government efforts to streamline land transactions through innovative solutions such as Ardhi Sasa, ii) continued activities by players on both the demand and supply sides, iii) growing demand for land driven by positive demographics, iv) the launch of infrastructure development projects opening up satellite towns for investment opportunities, and v) the continued rollout of the Affordable Housing Program (AHP) by the government, driving further demand for land.
- Infrastructure Sector
The Kenyan governments continues to demonstrate commitment to improve infrastructure around the country by launching and progressing several key projects across the nation, with a special focus on road networks during the year. These road projects continue to enhance connectivity that supports trading activities, draws investments in various sectors and promotes economic growth.
Key highlights during Q1’2025;
- The cabinet approved the construction of the Rironi-Mau Summit road project. This development is set to transform a critical transportation corridor in Kenya by upgrading the existing road from Rironi near Nairobi to Mau Summit in Nakuru County into a modern four-lane dual carriageway. The project, with an estimated cost of Kshs 175.0 bn, is scheduled to begin in June 2025 For more information, please see our Cytonn Weekly #11/2025,
- A US-based infrastructure investment firm Everstrong Capital initiated efforts to secure local pension funds amounting to Kshs 452.2bn for financing the construction of the 440.0 kilometer Nairobi-Mombasa Expressway. This move comes as Everstrong Capital, in partnership with CPF Capital & Advisory, seeks to channel bns of shillings from pension funds to support the ambitious infrastructure project. For more information, please see our Cytonn Weekly #6/2025, and,
- President Willian Ruto launched the upgrade of 205-Kilometer road connecting Isiolo, Kulamawe and Modogashe areas in Garba Tula during his visit to North Eastern Kenya. The upgrade is estimated to cost Kshs 21.6 bn according to Kenya National Highway Authority (KENHA). This upgrade is part of the governments border plan to connect Isiolo town and Mandera to boost access and trade with Somalia and Ethiopia. This road will connect Meru, Garissa, Isiolo, Wajir and Mandera counties and it will be a major boost to trade, economic growth and integration between the counties. Additionally, the president launched the Horn of Africa gateway development project in Garbatula Isiolo. For more information, please see our Cytonn Weekly #6/2025.
We anticipate the government continued efforts to improve infrastructure in the country more so in road and transport sector in line with its BETA agenda and economic stimulation goal. However, this may be slowed down by the reduction in allocation to state department of roads by 4.4% in the supplementary budget Q1’2025/25,to ksh 184.8 bn from the ksh193.4 bn set in the Q1’2025/25 budget. Consequently, we anticipate that going forward, there will be a decline in the number of infrastructure projects completed, while the number of stalled infrastructure projects across the country is expected to continue rising due financial constraints. Although the government acknowledges the importance of Public-Private Partnerships (PPPs) in tackling financing challenges, we believe that prioritizing PPPs is fundamental in addressing funding shortfalls. By leveraging the resources and expertise of the private sector, PPPs can support sustainable infrastructure development and stimulate economic growth.
- Real Estate Investments Trusts (REITs)
On the Unquoted Securities Platform, Acorn D-REIT and I-REIT traded at Kshs 25.4 and Kshs 22.2 per unit, respectively, as per the last updated data on 21st March 2025. The performance represented a 27.0% and 11.0% gain for the D-REIT and I-REIT, respectively, from the Kshs s 20.0 inception price. The volumes traded for the D-REIT and I-REIT came in at Kshs s 12.3 mn and Kshs 31.6 mn shares, respectively, with a turnover of Kshs 311.5 mn and Kshs 702.7 mn, respectively, since inception in February 2021. Additionally, ILAM Fahari I-REIT traded at Kshs 11.0 per share as of 21st March 2025, representing a 45.0% loss from the Kshs 20.0 inception price. The volume traded to date came in at 138,600 shares for the I-REIT, with a turnover of Kshs 1.5 mn since inception in November 2015.
REITs offer various benefits, such as tax exemptions, diversified portfolios, and stable long-term profits. However, the ongoing decline in the performance of Kenyan REITs and the restructuring of their business portfolios are hindering significant previous investments. Additional general challenges include:
- Insufficient understanding of the investment instrument among investors leading to a slower uptake of REIT products,
- Lengthy approval processes for REIT creation,
- High minimum capital requirements of Kshs 100.0 mn for REIT trustees compared to Kshs 10.0 mn for pension funds Trustees, essentially limiting the licensed REIT Trustee to banks only
- The rigidity of choice between either a D-REIT or and I-REIT forces managers to form two REITs, rather than having one Hybrid REIT that can allocate between development and income earning properties
- Limiting the type of legal entity that can form a REIT to only a trust company, as opposed to allowing other entities such as partnerships, and companies,
- We need to give time before REITS are required to list – they would be allowed to stay private for a few years before the requirement to list given that not all companies maybe comfortable with listing on day one, and,
- Minimum subscription amounts or offer parcels set at Kshs 0.1 mn for D-REITs and Kshs 5.0 mn for restricted I-REITs. The significant capital requirements still make REITs relatively inaccessible to smaller retail investors compared to other investment vehicles like unit trusts or government bonds, all of which continue to limit the performance of Kenyan REITs.
We expect Kenya’s Real Estate sector to remain on a growth trend, supported by: i) demand for housing sustained by positive demographics, such as urbanization and population growth rates of 3.8% p.a and 2.0% p.a, respectively, against the global average of 1.7% p.a and 0.9% p.a, respectively, as at 2023,, ii) activities by the government under the Affordable Housing Program (AHP) iii) heightened activities by private players in the residential sector iv) increased investment by local and international investors in the hospitality and industrial sector,v) improved infrastructure throughout the country. However, challenges such as rising construction costs, strain on infrastructure development (including drainage systems), high capital requirements for REITs, and existing oversupply in select Real Estate sectors will continue to hinder the sector’s optimal performance by limiting developments and investments.
Real Estate Performance Summary and Outlook
Below is a summary of the sectorial performance in Q1’2025 and investment opportunities:
|
Theme |
Cytonn Report: Thematic Performance and Outlook Q1’ 2025 |
Outlook |
|
Residential |
|
Neutral |
|
||
|
Commercial Office |
|
Neutral |
|
||
|
Retail |
|
Neutral |
|
||
|
Hospitality |
|
Neutral |
|
Land |
|
Positive |
Disclaimer: The views expressed in this publication are those of the writers where particulars are not warranted. This publication, which is in compliance with Section 2 of the Capital Markets Authority Act Cap 485A, is meant for general information only and is not a warranty, representation, advice or solicitation of any nature. Readers are advised in all circumstances to seek the advice of a registered investment advisor.

- Talk to us
- Kenya
- P.O Box 20695 - 00200, Nairobi, Kenya
- Cell +254709101200
- Tel +254709101200
- WhatsApp +254741676635
- United States
- +254709101200
- DOWNLOAD OUR APP
-


- Kenya
- 8th Floor, Pinetree Plaza, Kaburu Drive, Ngong Road, Nairobi, Kenya
- USA
- Suite 1150, 1775 Eye Street NW, USA, Washington DC 20006, USA
- Investments
- High Yield
- Private Equity
- Real Estate
- Real Estate
- RiverRun Estates
- Cytonn Towers
- The Ridge
- Taraji Heights
- The Alma