Cytonn Q3’2024 Markets Review
By Cytonn Research, Oct 6, 2024
Executive Summary
Global Markets Review
According to the World Bank's June 2024 Global Economic Prospects report, the global economy is projected to grow at 2.6% in 2024, matching the 2.6% growth recorded in 2023. This forecast marks a slight downward revision from earlier projections, reflecting continued economic headwinds, particularly for emerging markets. The World Bank’s growth projection is 0.6% points lower than the IMF’s 2024 forecast of 3.2%. The divergence is attributable to global inflationary pressures and continued tightening by central banks for much of 2023. However, recent developments indicate that some central banks, such as those in the United States and England, have begun to cut interest rates in response to easing inflation, which could stimulate economic activity going forward. Notably, advanced economies are expected to record a 1.5% growth in 2024, remaining unchanged from the 1.5% expansion recorded in 2023. However, emerging markets and developing economies are projected to expand by 4.0% in 2024, marginally downwards from an estimated growth of 4.2% in 2023;
Sub-Saharan Africa Regional Review
According to the World Bank, the Sub-Saharan economy is projected to grow at a moderate rate of 3.4% in 2024, which is 0.8% higher than the 2.6% growth estimate recorded in 2023. The expected recovery is primarily driven by private consumption growth as declining inflation boosts the purchasing power of household incomes. Nevertheless, the risk of debt distress remains high with more than half of countries facing unsustainable debt burdens as the region’s public debt to GDP ratio is expected to remain high at 57.0% in 2024, albeit a decline from 60.0% in 2023. The public debt is expected to remain high due to increased debt servicing costs as a result of continued currency depreciation and increased interest rates in developed economies. Additionally, many countries are providing subsidies in order to mitigate inflationary pressures, which could worsen public finance, increase public debt, and weigh down on debt sustainability;
In Q3’2024, some of the select Sub-Saharan currencies depreciated against the US Dollar, mainly attributable to the elevated inflationary pressures in the region, high debt servicing costs that continue to dwindle foreign exchange reserves, and monetary policy tightening by advanced economies. The high interest rates in developed countries have led to massive capital outflows as investors, both institutional and individual seek to take advantage of the higher returns offered in developed economies. Further, the elevated inflationary pressures in most economies in the region put pressure on the value of local currencies due to expensive importation;
Kenya Macroeconomic Review
According to the Kenya National Bureau of Statistics (KNBS) Q2’2024 Quarterly Gross Domestic Product Report, the Kenyan economy recorded a 4.6% growth in Q2’2024, slower than the 5.6% growth recorded in Q2’2023. The main contributor to Kenyan GDP remains to be the Agriculture, Fishing, and Forestry sector which grew by 4.8% in Q2’2024, lower than the 7.8% expansion recorded in Q2’2023. All sectors in Q2’2024, except Mining and Quarrying and Construction recorded positive growths, with varying magnitudes across activities. Most sectors recorded declining growth rates compared to Q2’2023 with Accommodation and Food Services, Financial & Insurance, and Construction Sectors recording the highest declines of 16.2%, 8.1%, and 5.6% points, respectively. Other sectors that recorded a contraction in growth rate, from what was recorded in Q2’2023 were Financial Services Indirectly Measured, Agriculture and Forestry, and Real Estate sectors, of 4.0%, 3.0%, and 2.1% points respectively. The slowed growth in the economy could be attributed to the still elevated fuel prices which made production more expensive and negatively impacted the business environment and the unrest caused by the anti-finance bill protests in June 2024;
Fixed Income
During the quarter, T-bills were oversubscribed, with the overall oversubscription rate coming in at 109.4%, down from 114.1% in Q3’2023. Investors’ preference for the 91-day paper persisted as they sought to avoid duration risk, with the paper receiving bids worth Kshs 189.4 bn against the offered Kshs 56.0 bn, translating to an oversubscription rate of 338.3%, lower than the oversubscription rate of 570.7% recorded in the previous year same period. Overall subscriptions for the 182-day and 364-day papers increased significantly to 77.6% and 49.6% from 27.1% and 18.4% in Q3’2023, respectively. The yields on all the papers were on an upward trajectory with the average yields on the 364-day, 182-day, and 91-day papers increasing by 3.4%, 3.5%, and 7.7% points to 15.9%, 16.7%, and 16.9%, from 13.2%, 13.2%, and 13.5%, respectively, recorded in Q3’2023. The upward trajectory in yields is mainly on the back of investors attaching higher risks amid the high risk attached to government debt, hence the need to demand higher returns to cushion against the possible loss. The acceptance rate during the period came in at 88.3%, albeit lower than the 95.5% recorded in Q3’2023, with the government accepting a total of Kshs 324.5 bn out of the Kshs 367.5 bn worth of bids received;
During the week, T-bills were oversubscribed, with the overall oversubscription rate coming in at 224.8%, a reversal from the undersubscription rate of 87.2% recorded the previous week. Investors’ preference for the shorter 91-day paper persisted, with the paper receiving bids worth Kshs 17.4 bn against the offered Kshs 4.0 bn, translating to an oversubscription rate of 433.8%, higher than the oversubscription rate of 173.0% recorded the previous week. The subscription rates for the 182-day and 364-day papers increased significantly to 202.1% and 164.0% respectively from the 54.4% and 85.7% respectively recorded the previous week. The government accepted a total of Kshs 29.2 bn worth of bids out of Kshs 54.0 bn bids received, translating to an acceptance rate of 54.2%. The yields on the government papers were on a downward trajectory, with the yields on the 364-day, 182-day, and 91-day papers decreasing by 7.1 bps, 8.9 bps, and 3.3 bps to 16.7%, 16.5%, and 15.7% respectively from 16.8%, 16.6% and 15.7% respectively recorded the previous week;
During the quarter, the government re-opened six bonds and issued two tap sales, seeking to raise Kshs 145.0 bn during the quarter. The bonds were generally oversubscribed, receiving bids worth Kshs 199.3 bn against the offered Kshs 145.0 bn, translating to an oversubscription rate of 144.5%. The government accepted Kshs 150.3 bn of the Kshs 199.3 bn worth of bids received, translating to an average acceptance rate of 80.5%. Additionally, in the primary bond market, the government is looking to raise Kshs 30.0 bn through the reopened two-year fixed coupon bonds FXD1/2016/10 and FXD1/2022/010 with the tenor to maturity of 1.8 years and 7.6 years respectively and fixed coupon rates of 15.0% and 13.5% respectively. Our expected bidding ranges for the reopened bonds are 17.0%-17.3% and 16.9%-17.2% respectively;
During the week, the Kenya National Bureau of Statistics (KNBS) released the Q2’2024 Quarterly Gross Domestic Product Report, highlighting that the Kenyan economy recorded a 4.6% growth in Q2’2024, slower than the 5.6% growth recorded in Q2’2023. The main contributor to Kenyan GDP remains to be the Agriculture, Fishing and Forestry sector which grew by 4.8% in Q2’2024, lower than the 7.8% expansion recorded in Q2’2023. All sectors in Q2’2024, except Mining and Quarrying; and Construction recorded positive growths, with varying magnitudes across activities. Most sectors recorded declining growth rates compared to Q2’2023 with Accommodation and Food Services; Financial & Insurance; and Construction Sectors recording the highest declines of 16.2%, 8.1%, and 5.6% points, respectively. Other sectors that recorded a contraction in growth rate, from what was recorded in Q2’2023 were Financial Services Indirectly Measured, Agriculture and Forestry, and Real Estate sectors, of 4.0%, 3.0%, and 2.1% points respectively;
During the week, the Kenya National Bureau of Statistics released the Q2’2024 Balance of Payment Report released by the Kenya National Bureau of Statistics (KNBS), Kenya’s balance of payments position deteriorated by 45.0% in Q2’2024, coming in at a surplus of Kshs 84.1 bn, from a surplus of Kshs 152.9 bn in Q2’2023, and a significant improvement from the Kshs 36.0 bn deficit recorded in Q1’2024;
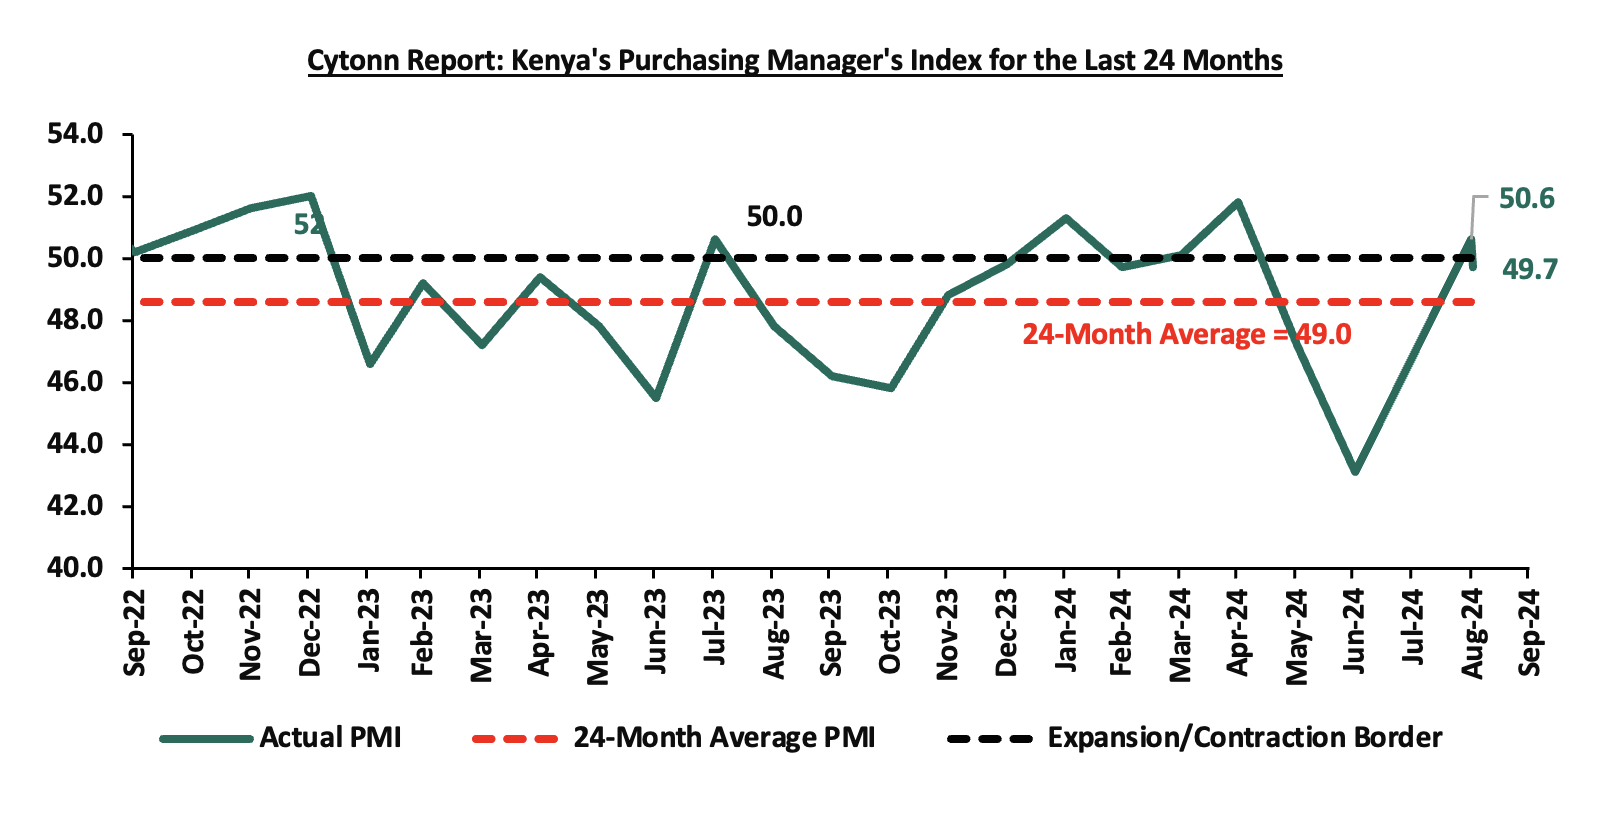
During the week, Stanbic Bank released its monthly Purchasing Manager's Index (PMI) highlighting that the index for the month of September 2024 declined, coming in at 49.7, down from 50.6 in August 2024, signaling a deterioration in business conditions. This is attributable to the slowdown in business activity and reduced intake of new business intakes, owing to challenging economic conditions. This also implied that the uptick in August was due to some recovery after disruptions by the protests;
Equities
During the quarter, the equities market recorded a mixed performance with NSE 20, NSE 25, and NSE 10 gaining by 7.2%,1.3%, and 0.7% respectively, while NASI declined by 2.2%, taking the YTD performance to gains of 23.4%, 21.4%, 17.7% and 16.4% for NSE 10, NSE 25, NSE 20 and NASI respectively. The equities market performance during the quarter was driven by gains recorded by large caps such as Bamburi, KCB Group, and Standard Chartered Bank of 40.6%, 11.0%, and 8.2%, respectively. The gains were however weighed down by losses recorded by Safaricom and BAT of 13.3%, and 2.9% respectively;
During the week, the equities market recorded a mixed performance, with NSE 10, NSE 25, and NASI gaining by 2.1%, 1.5%, and 1.1%, respectively, while NSE 20 declined by 0.3%, taking the YTD performance to gains of 26.0%, 23.5%, 17.8% and 17.5% for NSE 10, NSE 25, NASI, and NSE 20 respectively. The equities market performance was mainly driven by gains recorded by East African Breweries Limited (EABL), NCBA Group, and cooperative Bank of 5.3%, 3.6%, and 3.4% respectively. The gains were however weighed down by losses recorded by large-cap stocks such as Bamburi and Safaricom of 0.4%, and 0.3%, respectively;
Real Estate
In Q3’2024, Kenya’s Real Estate sector recorded notable growth in terms of activity compared to a similar period in 2023, attributable to continued investments flowing into the sector. During Q3’2024, the NMA residential sector recorded a slight improvement in performance, with the average total returns coming in at 6.1%, a 0.1%-point increase from 6.0% recorded in Q3’2023. The performance is primarily attributable to an increase in the residential market average y/y rental yield which came in at 5.4% in Q3’2024, a 0.1% increase from 5.3% recorded in Q3’2023. The average rental yield for the NMA retail sector was stable at 8.2%, this performance can be linked to the increase in the average rental prices by 1.6% to Kshs 185, up from Kshs 182 in Q3’2023, and an increase in the average occupancy rates by 2.7% to 81.4% from 78.7% in Q3’2024, and the increase in average sales price which rose by 3.6% to Kshs 21,381 from Kshs 20,643 in Q3’2023;
Investment Updates:
- Weekly Rates:
- Cytonn Money Market Fund closed the week at a yield of 18.14% p.a while the Cytonn Money Market Fund (USD) closed the week at a yield of 7.23%. To invest, dial *809# or download the Cytonn App from Google Play store here or from the Appstore here;
- We continue to offer Wealth Management Training every Monday, from 10:00 am to 12:00 pm. The training aims to grow financial literacy among the general public. To register for any of our Wealth Management Trainings, click here;
- If interested in our Private Wealth Management Training for your employees or investment group, please get in touch with us through wmt@cytonn.com;
- Cytonn Insurance Agency acts as an intermediary for those looking to secure their assets and loved ones’ future through insurance namely; Motor, Medical, Life, Property, WIBA, Credit and Fire and Burglary insurance covers. For assistance, get in touch with us through insuranceagency@cytonn.com;
- Cytonn Asset Managers Limited (CAML) continues to offer pension products to meet the needs of both individual clients who want to save for their retirement during their working years and Institutional clients that want to contribute on behalf of their employees to help them build their retirement pot. To more about our pension schemes, kindly get in touch with us through pensions@cytonn.com;
Real Estate Updates:
- For more information on Cytonn’s real estate developments, email us at sales@cytonn.com;
- Phase 3 of The Alma is now ready for occupation and the show house is open daily. To join the waiting list to rent, please email properties@cytonn.com;
- For Third Party Real Estate Consultancy Services, email us at rdo@cytonn.com;
- For recent news about the group, see our news section here;
Hospitality Updates:
- We currently have promotions for Staycations. Visit cysuites.com/offers for details or email us at sales@cysuites.com;
Global Economic Growth:
According to the World Bank's June 2024 Global Economic Prospects report, the global economy is projected to grow at 2.6% in 2024, matching the 2.6% growth recorded in 2023. This forecast marks a slight downward revision from earlier projections, reflecting continued economic headwinds, particularly for emerging markets. The World Bank’s growth projection is 0.6% points lower than the IMF’s 2024 forecast of 3.2%. The divergence is attributable to global inflationary pressures and continued tightening by central banks for much of 2023. However, recent developments indicate that some central banks, such as those in the United States and England, have begun to cut interest rates in response to easing inflation, which could stimulate economic activity going forward. Notably, advanced economies are expected to record a 1.5% growth in 2024, remaining unchanged from the 1.5% expansion recorded in 2023. However, emerging markets and developing economies are projected to expand by 4.0% in 2024, marginally downwards from an estimated growth of 4.2% in 2023.
The stabilization in global economic growth in 2024 as compared to 2023 is majorly attributable to;
- The recovery in global trade supported by a pickup in goods trade. Services-trade growth is expected to provide less of a tailwind this year, given that tourism has nearly recovered to pre-pandemic levels. However, the trade outlook remains lackluster compared to recent decades, partly reflecting a proliferation of trade-restrictive measures and elevated trade policy uncertainty, and,
- A decrease in inflation rates making progress toward central bank targets in advanced economies and Emerging Markets and Developing Economies (EMDEs), but at a slower pace than previously expected. Core inflation has remained stubbornly high in many economies, supported by rapid growth of services prices. As such, by the end of 2026, global inflation is expected to settle at an average rate of 2.8%, broadly consistent with central bank targets.
The global economy is showing signs of improvement, with inflationary pressures easing and several central banks moving from rate hikes to rate cuts. This shift is expected to support economic recovery, although growth remains uneven across regions.
Global Commodities Market Performance:
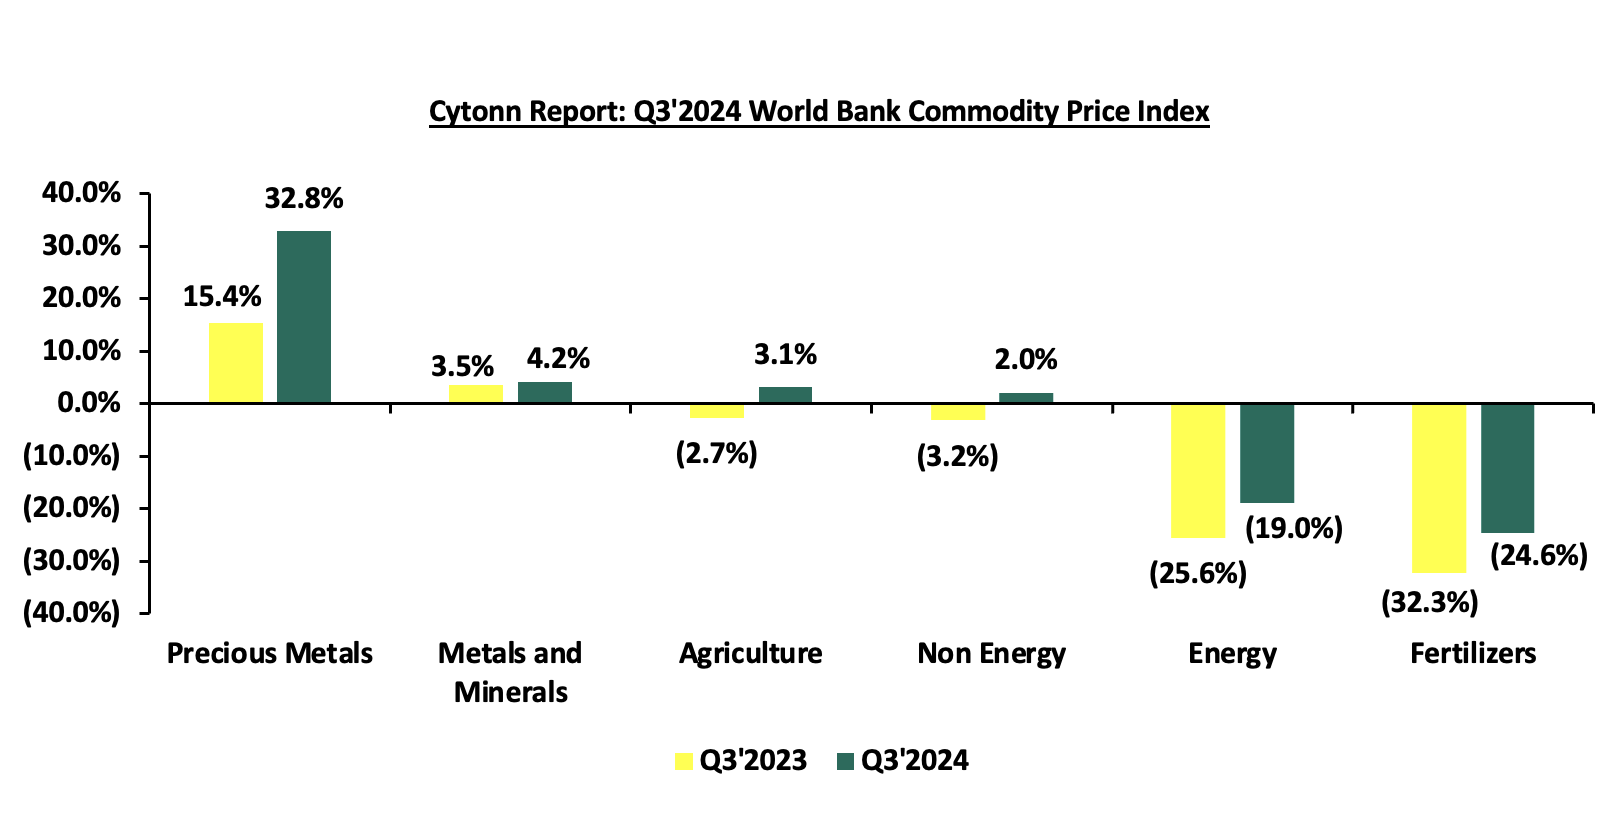
Global commodity prices registered mixed performance in Q3’2024, with prices of fertilizers declining by 24.6%, which is an improvement compared to the 32.3% decrease recorded in Q3’2023, mainly as a result of the stabilization in fertilizer trade volumes and improved availability of primary nutrients like nitrogen, phosphorus, and potassium. On the other hand, prices of Precious Metals, Metals & Minerals, Agriculture, and Non-Energy increased by 32.8%, 4.2%, 3.1%, and 2.0% respectively, on the back of increased global demand coupled with easing supply chain constraints. Below is a summary performance of various commodities;
Source: World Bank
Global Equities Market Performance:
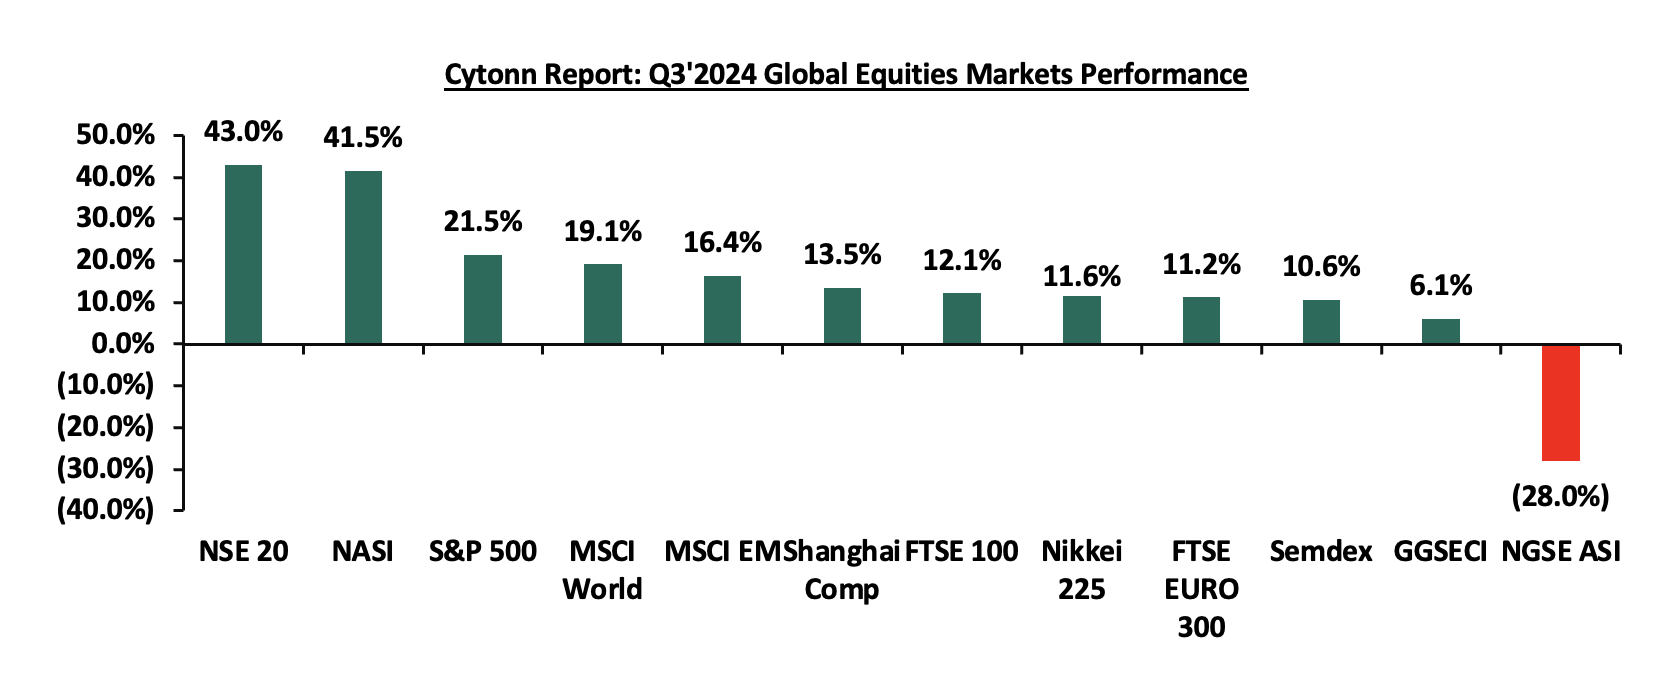
The global stock market recorded mixed performance in Q3’2024, with most indices in the developed countries recording gains during the period, largely attributable to increased investor sentiments as a result of continued economic recovery following the full reopening of the economies coupled with investor preference for the stock markets in the developed countries. Notably, NSE 20 was the best performer during the period, recording a gain at 43.0% in Q3’2024 largely driven by gains in the large-cap stocks in the financial sector following improved earnings during the period, well supported by easing inflation and a stronger Shilling. NGSE ASI was the largest decliner, recording losses of 28.0% with the performance being skewed by the weakened Nigerian Naira following a recent decision by the Central Bank of Nigeria to adopt a floating exchange rate regime. Below is a summary of the performance of key indices as at the end of Q3’2024:
*Dollarized performance
According to the World Bank, the Sub-Saharan economy is projected to grow at a moderate rate of 3.4% in 2024, which is 0.8% higher than the 2.6% growth estimate recorded in 2023. The expected recovery is primarily driven by private consumption growth as declining inflation boosts the purchasing power of household incomes. Nevertheless, the risk of debt distress remains high with more than half of countries facing unsustainable debt burdens as the region’s public debt to GDP ratio is expected to remain high at 57.0% in 2024, albeit a decline from 60.0% in 2023. The public debt is expected to remain high due to increased debt servicing costs as a result of continued currency depreciation and high interest rates in developed economies. Additionally, many countries are providing subsidies in order to mitigate inflationary pressures, which could worsen public finance, increase public debt, and weigh down on debt sustainability.
Currency Performance:
In Q3’2024, most of the select Sub-Saharan currencies depreciated against the US Dollar, primarily due to elevated inflationary pressures in the region, high debt servicing costs that continued to deplete foreign exchange reserves, and monetary policy tightening by advanced economies. High interest rates in developed countries resulted in significant capital outflows as investors, both institutional and individual, sought higher returns offered in these economies. Additionally, the rising inflation across most Sub-Saharan economies exerted pressure on local currencies due to the increasing cost of imports. However, the Kenyan Shilling emerged as the best performer among the selected currencies, appreciating by 17.7% against the USD on a year-to-date basis, closing Q3'2024 at Kshs 129.2, from Kshs 157.0 at the beginning of the year. Below is a table showing the performance of select African currencies against the US Dollar:
|
Cytonn Report: Select Sub-Saharan Africa Currency Performance vs USD |
|||||
|
Currency |
Sep-23 |
Jan-24 |
Sep-24 |
y/y change (%) |
YTD change (%) |
|
Kenyan Shilling |
148.1 |
157.0 |
129.2 |
12.8% |
17.7% |
|
South African Rand |
18.9 |
18.3 |
17.3 |
8.8% |
5.7% |
|
Senegal CFA Franc |
617.0 |
589.3 |
582.8 |
5.6% |
1.1% |
|
Botswana Pula |
13.8 |
13.3 |
13.0 |
5.4% |
2.2% |
|
Ugandan Shilling |
3755.0 |
3790.7 |
3678.0 |
2.1% |
3.0% |
|
Mauritius Rupee |
44.3 |
44.3 |
45.8 |
(3.2%) |
(3.3%) |
|
Tanzanian Shilling |
2505.0 |
2524.1 |
2730.0 |
(9.0%) |
(8.2%) |
|
Zambian Kwacha |
21.0 |
25.8 |
26.4 |
(25.8%) |
(2.3%) |
|
Ghanaian Cedi |
11.6 |
11.9 |
15.8 |
(36.4%) |
(32.4%) |
|
Malawian kwacha |
1080.0 |
1683.4 |
1733.7 |
(60.5%) |
(3.0%) |
|
Nigerian Naira |
768.0 |
881.0 |
1669.0 |
(117.3%) |
(89.4%) |
Source: Yahoo Finance
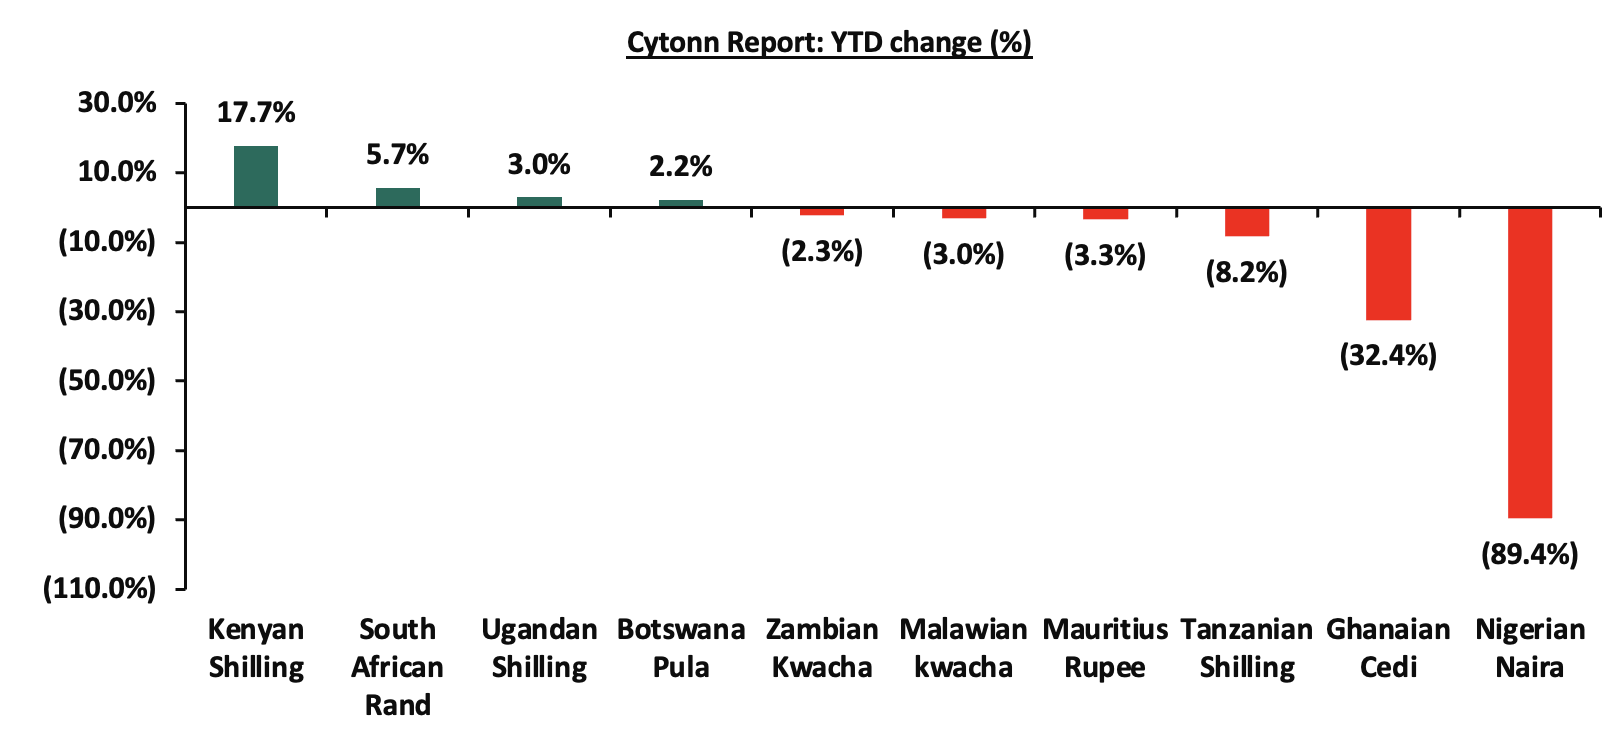
The chart below shows the year-to-date performance of different sub-Saharan African countries in Q3’2024;
Source: Yahoo Finance
Key take outs from the above table and chart include:
- The Kenyan Shilling was the largest gainer against the USD Dollar, gaining by 17.7% year to date to close at Kshs 129.2 as at the end of September from the Kshs 157.0 recorded at the beginning of the year. The shilling's strength has been supported by several factors, including the government’s Eurobond buyback in February, which alleviated debt risk. Additionally, foreign reserves have improved by 20.8%, currently standing at USD 8.2 bn—equivalent to 4.2 months of import cover—exceeding the statutory requirement of at least 4.0 months. This improvement is bolstered by increased dollar inflows into the country, including the World Bank funding of USD 1.2 bn under the Development Policy Operations (DPO), which is partly aimed at addressing the upcoming June 2024 Eurobond maturity payment. Furthermore, the US Federal Reserve's decision to cut its benchmark interest rate by 50 basis points to a range of 4.75%-5.00% has also contributed to a favorable environment for the Kenyan Shilling, and,
- The Nigerian Naira was the worst performing currency in Q3’2024, depreciating by 89.4%, mainly as a result of acute foreign-exchange scarcity and instability arising from lower crude production and a lack of economic diversification,
African Eurobonds:
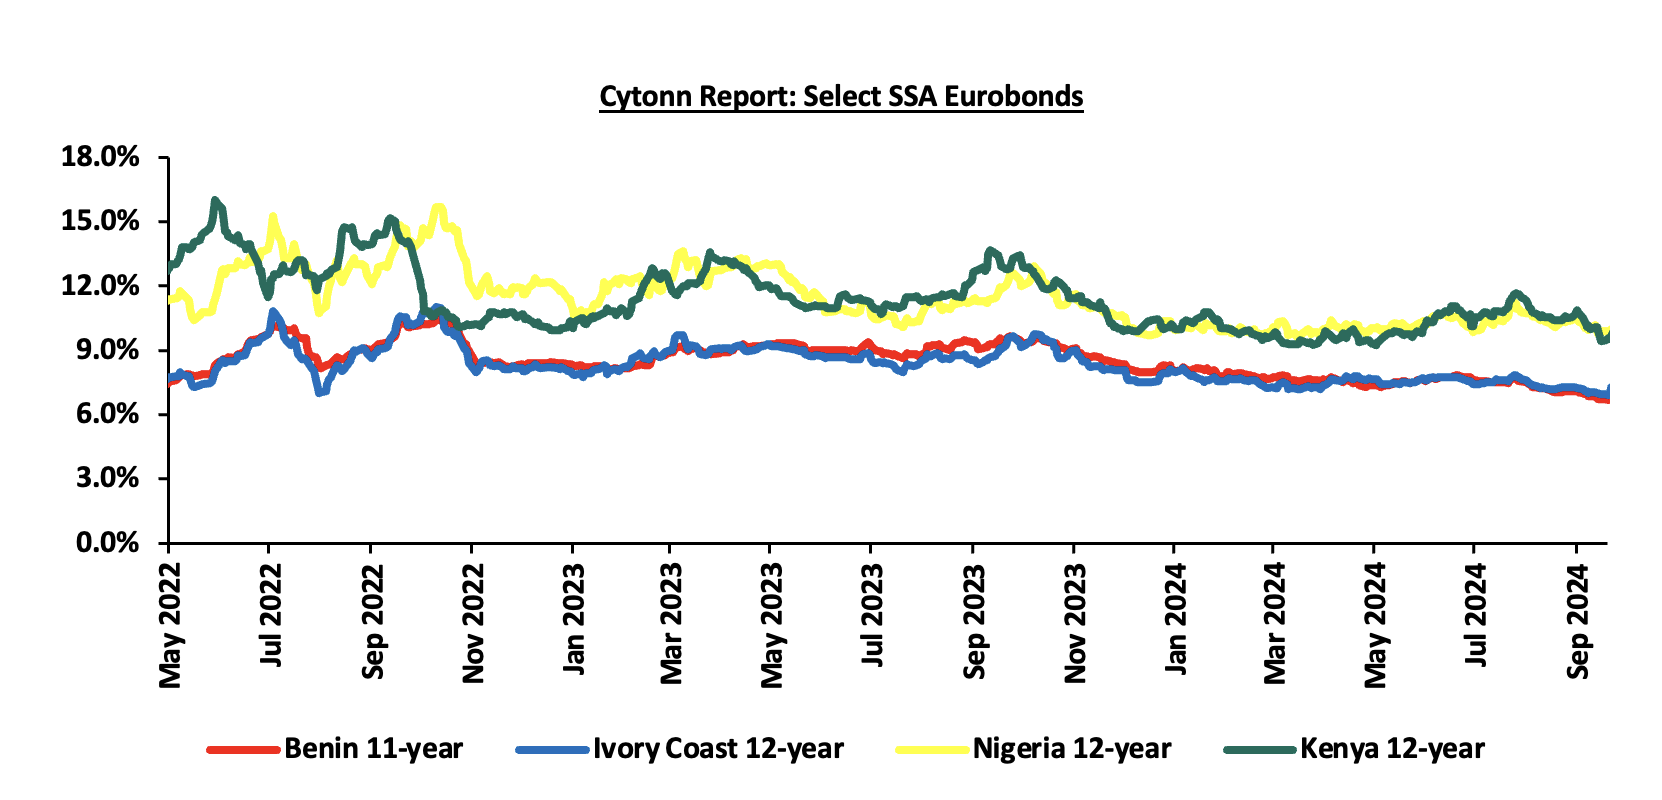
Africa’s appetite for foreign-denominated debt has increased in recent times with the latest issuers during the nine months to end of Q3’2024 being Ivory Coast, Benin, Kenya, Senegal and Cameroon raising a total of USD 2.6 bn, USD 0.8 bn, USD 1.5 bn, USD 0.8 bn and USD 0.6 bn respectively. Notably, all the bonds were oversubscribed with the high support being driven by the yield hungry investors and also the outlook of positive recovery in the regional economies. It is good to note that there was a general decline in the yields of the various bonds from different countries due to general improvement in investor sentiment as the economy recovers and the easing inflationary pressures in the region. The yields of the Ivory Coasts’ 12-year Eurobond maturing in 2032 increased marginally by 0.6% points to 6.9% as at the end of September 2024 from 7.5% recorded in December 2023. Similarly, the Yields of the Kenya’s 12-year Eurobond maturing in 2032 increased by 0.9% points to 9.5% as at the end of September 2024 from 10.4% in December 2023, partly attributable to improved investor confidence following the successful buy-back of the 2024 Eurobond maturity, increased IMF Credit funding and the strengthening of the Kenyan shilling against the dollar having gained by 17.7% on a year-to-date. Below is a graph showing the Eurobond secondary market performance of select Eurobonds issued by the respective countries:
Source: Bloomberg, CBK
Equities Market Performance:
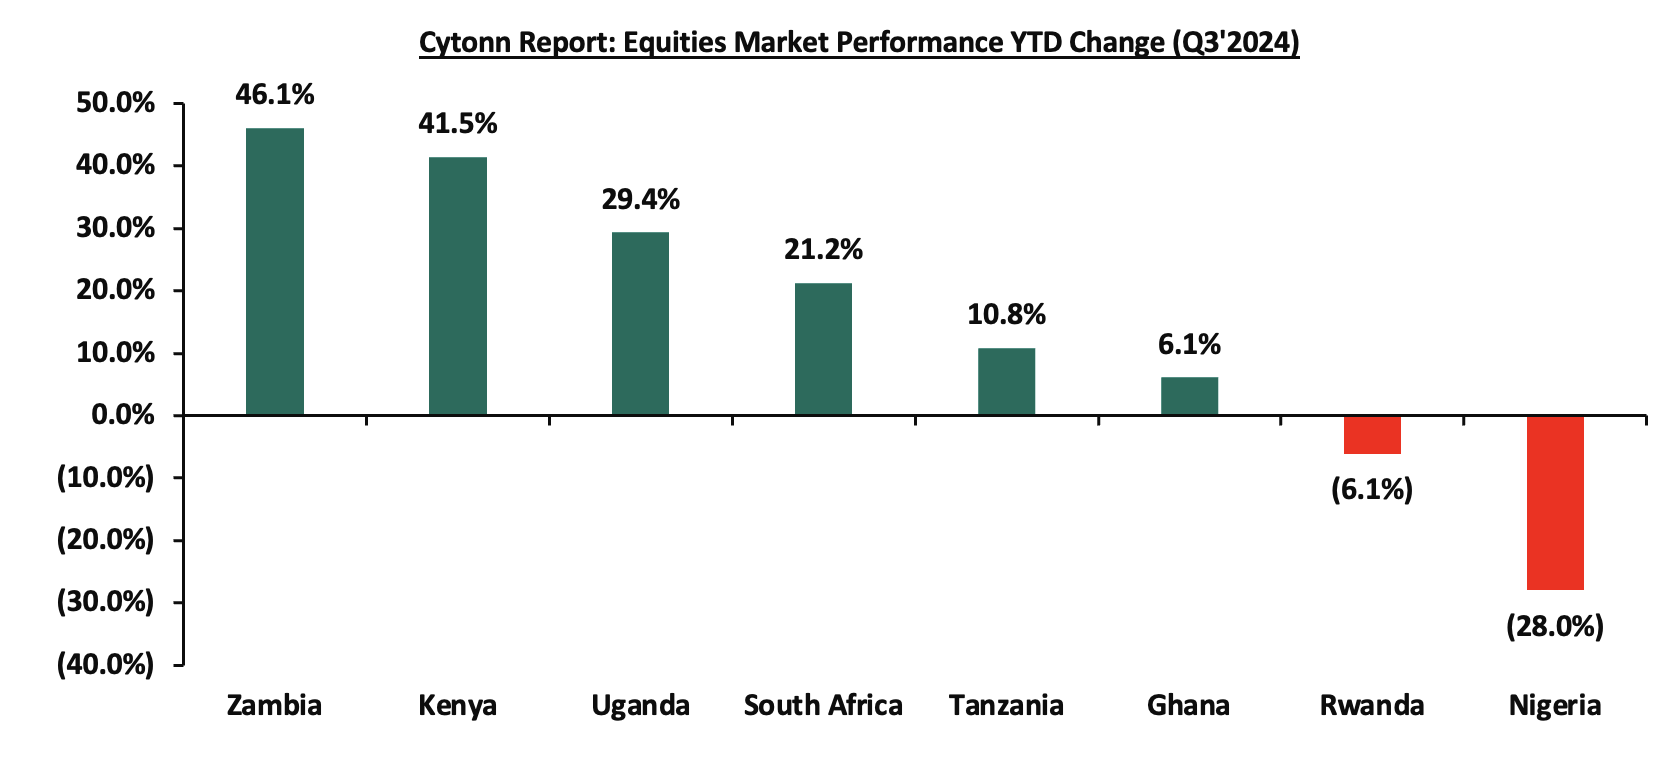
Sub-Saharan Africa (SSA) stock markets recorded mixed performance in Q3’2024, with Zambia’s stock market (LASILZ) being the best performing market gaining by 46.1% YTD increased foreign investor sentiments following improved macro-economic conditions in Zambia following debt restructuring reforms. Nigeria’s NGSEASI was the worst performing stock market, declining by 28.0% YTD, mainly attributable to increased capital flight with investors chasing higher returns from advanced economies following hiking of interest rates as well as deterioration in investor confidence in country on the back of macroeconomic uncertainties occasioned by the high inflation at 32.2% as of August 2024 and continued weakening of the Nigerian Naira which has depreciated by 89.4% on year-to-date basis in 2024. Below is a summary of the performance of key indices:
|
Cytonn Report: SSA Equities Market Performance Q3’2024 (Dollarized*) |
||||||
|
Country |
Index |
Sep-23 |
Jan-24 |
Sep-24 |
Last 12 months |
YTD Change |
|
Zambia |
LASILZ |
452.4 |
428.8 |
626.5 |
38.5% |
46.1% |
|
Kenya |
NASI |
0.6 |
0.6 |
0.8 |
28.9% |
41.5% |
|
Uganda |
USEASI |
0.3 |
0.2 |
0.3 |
18.9% |
29.4% |
|
South Africa |
JALSH |
3,826.7 |
4,136.4 |
5,015.1 |
31.1% |
21.2% |
|
Tanzania |
DARSDEI |
0.7 |
0.7 |
0.8 |
8.8% |
10.8% |
|
Ghana |
GSECI |
274.7 |
261.6 |
277.6 |
1.1% |
6.1% |
|
Rwanda |
RSEASI |
0.1 |
0.1159 |
0.11 |
(23.0%) |
(6.1%) |
|
Nigeria |
NGEASI |
86.4 |
83.4 |
60.1 |
(31.7%) |
(28.0%) |
|
*The index values are dollarized for ease of comparison |
||||||
Source: Cytonn Research, Kwayisi, Yahoo Finance
The chart below shows the YTD Performance of the sub-Saharan Equities Market;
Dollarized performance
GDP growth in the Sub-Saharan Africa region is expected to slow down, in line with the rest of the global economy. Additionally, public debt continues to be a major headwind, with high debt levels experienced in the region on the back of continued weakening of local currencies, which will make debt servicing costlier, making the region less attractive to foreign capital.
According to the Kenya National Bureau of Statistics (KNBS) Q2’2024 Quarterly Gross Domestic Product Report, the Kenyan economy recorded a 4.6% growth in Q2’2024, slower than the 5.6% growth recorded in Q2’2023. The main contributor to Kenyan GDP remains to be the Agriculture, Fishing and Forestry sector which grew by 4.8% in Q2’2024, lower than the 7.8% expansion recorded in Q2’2023. All sectors in Q2’2024, except Mining and Quarrying and Construction recorded positive growths, with varying magnitudes across activities. Most sectors recorded declining growth rates compared to Q2’2023 with Accommodation and Food Services, Financial & Insurance, and Construction Sectors recording the highest declines of 16.2%, 8.1%, and 5.6% points, respectively. Other sectors that recorded a contraction in growth rate, from what was recorded in Q2’2023 were Financial Services Indirectly Measured, Agriculture and Forestry, and Real Estate sectors, of 4.0%, 3.0%, and 2.1% points respectively. The slowed growth in the economy could be attributed to the still elevated fuel prices which made production more expensive and negatively impacted the business environment and the unrest caused by the anti-finance bill protests in June. The Kenyan Economy is projected to grow at an average of 5.3% in 2024 according to various organizations as shown below:
|
Cytonn Report: Kenya 2024 Growth Projections |
||
|
No. |
Organization |
2024 GDP Projections |
|
1 |
International Monetary Fund |
5.3% |
|
2 |
National Treasury |
5.5% |
|
3 |
World Bank |
5.2% |
|
4 |
Fitch Solutions |
5.2% |
|
5 |
Cytonn Investments Management PLC |
5.4% |
|
Average |
5.3% |
|
Source: Cytonn Research
Key to note, Kenya’s general business environment slightly deteriorated in Q3’2024, with the average Purchasing Manager’s Index for the last three months coming at 47.8, compared to 48.0 recorded in a similar period in 2023. The deterioration was mainly on the back of anti-finance bill protests which paralyzed economic activity in the month of July, with July PMI coming in at a low of 43.1. The chart below summarizes the evolution of PMI over the last 24 months. (A reading above 50.0 signals an improvement in business conditions, while readings below 50.0 indicate a deterioration):
Inflation:
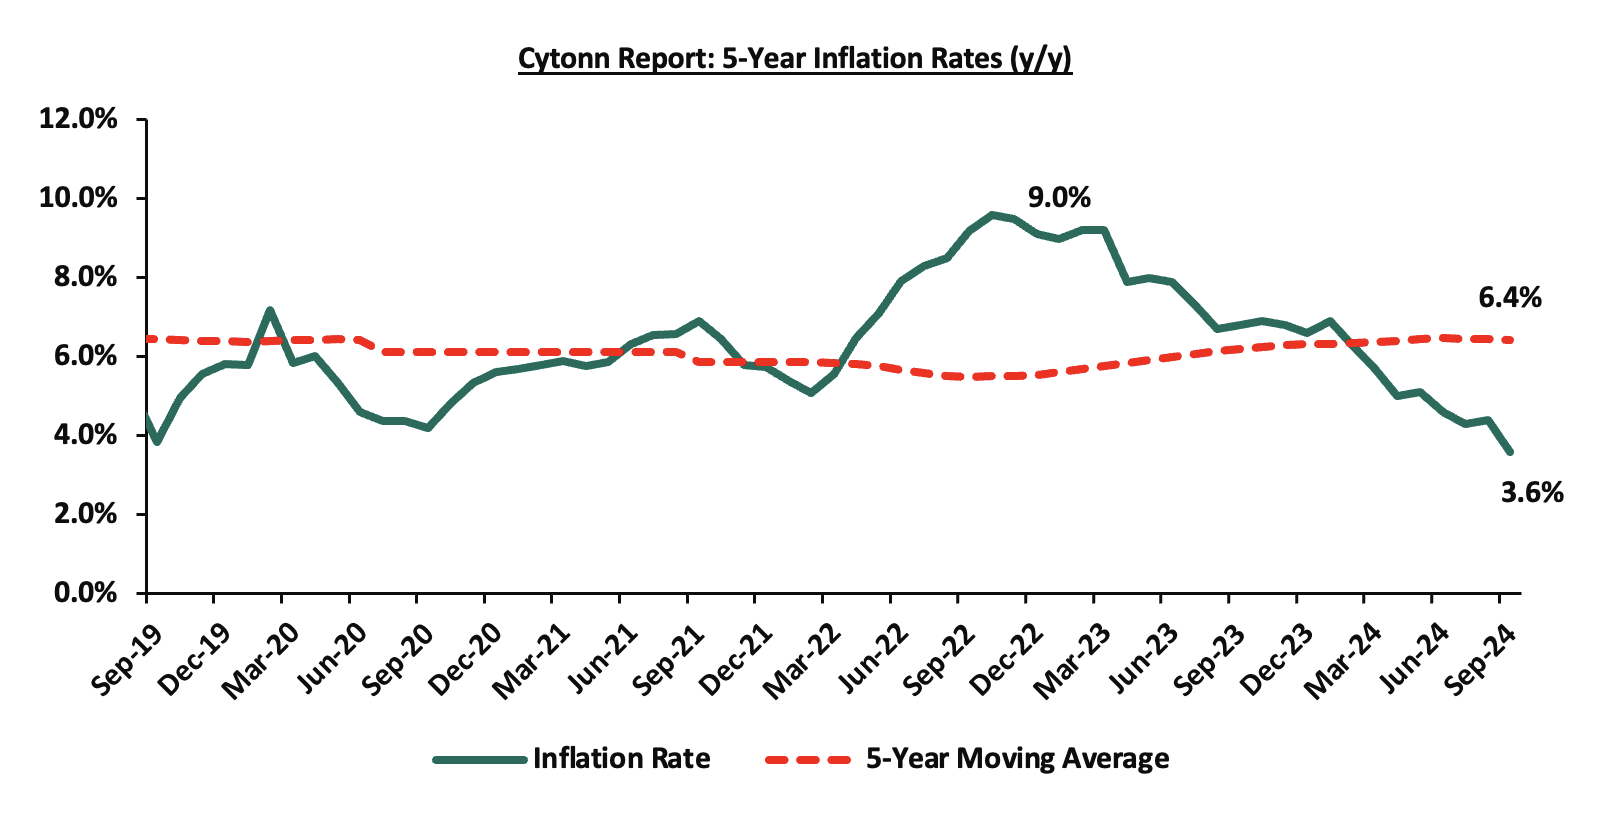
The average inflation rate decreased to 4.1% in Q3’2024, compared to 6.9% in Q3’2023, attributable to an appreciating Shilling, and stabilized fuel prices. Notably, the maximum allowed price for Super Petrol and Diesel in September remained unchanged from the prices announced for the month of August, while the maximum price allowed for Kerosene decreased by Kshs 3.4 per litre. Consequently, Super Petrol and Diesel will continue to retail at Kshs 188.8 and Kshs 171.6 per litre respectively, while Kerosene will retail at Kshs 158.3 per litre. Inflation for the month of September 2024 eased to 3.6%, from 4.4% recorded in August 2024, mainly driven by a 0.1% decrease in the Housing, water, electricity, gas and other fuels category. Below is a chart showing the inflation trend for the last five years:
For the last 15 months, Kenya’s inflation has persistently remained within the Central Bank of Kenya (CBK) target range of 2.5% - 7.5%, owing to a stronger Shilling and reduced fuel and electricity prices. The risk, however, remains the fuel prices that still remain elevated, and the monetary policy that has now begun to loosen, with the MPC on 6th August, cutting the CBR rate by 25 bps to 12.75% from 13.00%. In their meeting this month, we expect further cuts that would increase the money supply and, therefore, may drive inflation upwards.
Going forward, we expect the inflationary pressures to remain within the CBK’s preferred target, mainly on the back of stronger Shilling, and reduced fuel and electricity prices. However, the loosening monetary policy and the still elevated, though stabilizied fuel prices remain a risk for the inflation rate.
September 2024 Inflation
The y/y inflation in September 2024 decreased by 0.8% points to 3.6%, from the 4.4% recorded in August 2024. This was in line with our expectation of a decrease, but slightly above our projected range of 4.1% to 4.4%. Our decision was mainly driven by reduced electricity prices for September and the stable fuel prices for the month. The headline inflation in September 2024 was majorly driven by increase in prices of commodities in the following categories; Food & Non-Alcoholic Beverages, Housing, Water, Electricity, Gas & other fuels, and Transport by 5.1%, 2.6%, and 0.5% respectively. The table below shows a summary of both the year-on-year and month-on-month commodity indices performance:
|
Cytonn Report: Major Inflation Changes – September 2024 |
|||
|
Broad Commodity Group |
Price change m/m (September-2024/August -2024) |
Price change y/y (September-2024/September-2023) |
Reason |
|
Food and non-alcoholic beverages |
0.4% |
5.1% |
The m/m increase was supported by decrease in prices of sugar, wheat flour and milk by 2.8%, 2.1%, and 0.6%, respectively However, the decrease was mainly driven by decrease in prices of commodities such as oranges, potatoes, and fresh fish by 5.2%, 2.3% and 2.1% respectively. |
|
Transport |
0.1% |
0.5% |
The m/m increase recorded in the transport Index was mainly on the back of a 6.2 bps increase in bus fares while the prices of diesel and petrol remained unchanged from their August 2024 prices of Kshs 171.6 and Kshs 188.8 per litre respectively. |
|
Housing, water, electricity, gas and other fuels |
(0.1%) |
2.6% |
The m/m performance was mainly driven by the decrease in prices of Electricity of 200 kWh and 50 kWh by 68.8 bps and 77.0 bps respectively together with Kerosene prices which dropped by Kshs 3.4 per litre to retail at Kshs 158.4 per litre |
|
Overall Inflation |
0.2% |
3.6% |
The m/m increase was mainly attributable to the 0.4% increase in Food and non-alcoholic beverages. |
Notably, September’s overall headline inflation declined again after slightly rising in August. Furthermore, it has remained within the Central Bank of Kenya (CBK) target range of 2.5% to 7.5% for the fifteenth consecutive month. The decrease in headline inflation in September 2024 comes amid the maximum allowed price for Super Petrol and Diesel remaining unchanged from the prices announced for the previous month, while the maximum price allowed for Kerosene decreased by Kshs 3.4 per litre. Consequently, Super Petrol and Diesel will continue to retail at Kshs 188.8 and Kshs 171.6 per litre respectively, while Kerosene will retail at Kshs 158.3 per litre. The chart below shows the inflation rates for the past 5 years:
Going forward, we expect inflation to remain within the CBK’s preferred range of 2.5%-7.5%, mainly on the back of a strengthened currency, lower electricity prices and reducing fuel prices. The risk, however, lies in the fuel prices which despite their decline over the last months, still remain elevated compared to historical levels. Additionally, favourable weather conditions will also contribute to stabilizing food prices, further supporting lower inflation rates. Key to note is that the Monetary Policy Committee cut the Central Bank Rate by 25 bps to 12.75% from 13.0% in its August 2024 meeting, with the aim of easing the monetary policy and maintaining exchange rate stability. The committee is expected to meet again on Tuesday 8th October 2024, and is expected to cut the rates further on the need to support the economy. This expected further cut may hinder the easing of inflation.
The Kenyan Shilling:
The Kenyan Shilling slightly appreciated against the US Dollar by 0.3% in Q3’2024, to close at Kshs 129.2, from Kshs 129.5 as at the end of H1’2024, mainly attributable to increased foreign inflows during the quarter, and the US Fed cut in mid-September which made the dollar less attractive compared to other currencies, the Kenyan shilling included. During the week, the Kenya Shilling appreciated against the US Dollar by 1.3 bps to remain relatively unchanged from the Kshs 129.2 recorded the previous week.
We expect the shilling to be supported by:
- Diaspora remittances standing at a cumulative USD 4,645.0 mn in the 12 months to August 2024, 12.7% higher than the USD 4,120.0 mn recorded over the same period in 2023, which has continued to cushion the shilling against further depreciation. In the August 2024 diaspora remittances figures, North America remained the largest source of remittances to Kenya accounting for 56.0% in the period,
- The tourism inflow receipts which came in at USD 352.5 bn in 2023, a 31.5% increase from USD 268.1 bn inflow receipts recorded in 2022, and owing to tourist arrivals that improved by 27.2% in the 12 months to June 2024, from the arrivals recorded during a similar period in 2023, and,
- High Forex reserves currently at USD 8.2 bn (equivalent to 4.2-months of import cover), which is above the statutory requirement of maintaining at least 4.0-months of import cover, but lower than the EAC region’s convergence criteria of 4.5-months of import cover.
The shilling is however expected to remain under pressure in 2024 as a result of:
- An ever-present current account deficit which came at 0.7% of GDP in Q2’2024 from 0.9% recorded in Q1’2024, and,
- The need for government debt servicing, continues to put pressure on forex reserves given that 67.9% of Kenya’s external debt was US Dollar-denominated as of March 2024.
Monetary Policy:
The Monetary Policy Committee (MPC) met once in Q3’2024, where the Central Bank Rate was cut by 25 bps to 12.75% from the 13.00% that had been maintained in the June meeting, noting that its previous interventions had successfully mitigated exchange rate pressures, and anchored inflation with inflation coming at 4.4% and 3.6% in August and September 2024 respectively, remaining within the CBK target range of 2.5%-7.5%. Below are some of the Key highlights from the June meeting:
- The overall inflation eased by 0.3% points to 4.3% in July 2024, from 4.6% in June 2024, positioning it at below the mid-point of the preferred CBK range of 2.5%-7.5%, mainly driven by the decline in fuel inflation. Fuel inflation decreased to 4.5% in July 2024 from 6.4% in June 2024, largely attributable to a downward adjustment in pump prices and lower electricity tariffs. The food inflation remained unchanged at 5.6% in July and June 2024, attributable largely to declines in prices of key non-vegetable food items i.e. maize, sugar, and wheat flour, that offset the price increase of a few vegetables i.e tomatoes, Irish potatoes, and cabbages. The non-food non-fuel inflation slightly decreased to 3.3% in July 2024 from 3.4% in June 2024, reflecting the impact of the monetary policy measures. We expect the overall inflation to remain within the CBK’s preferred range of 2.5%-7.5%, mainly on the back of a strengthened currency, reduced fuel prices and reduced electricity prices,
- The recently released Quarterly Gross Domestic Product Report, for Q1’2024 showed continued strong performance of the Kenyan economy, with real GDP growing by 5.0%, although slower than the growth of 5.5% recorded in a similar period in 2023. This was attributable to strong growth in the agriculture sector due to favourable weather conditions that boosted crop and livestock production and resilient performance of the services sector, particularly wholesale and retail trade, accommodation and food services, financial and insurance, information and communication, and real estate. The economy is expected to continue to strengthen in 2024, supported by a resilient services sector, sustained performance in agriculture, and enhanced exports. However, this positive outlook is tempered by potential risks, including geopolitical tensions,
- Goods exports increased by 5.0% in the 12 months to June 2024, compared to a similar period in 2023, reflecting a rise in exports of agricultural commodities and re-exports. Receipts from tea and fruits and vegetables exports increased by 4.6% and 12.1% respectively, while re-exports grew by 56.5% in the period. Notably, exports increased 11.8% in the first half of 2024 compared to the same period in 2023. Imports declined by 3.3% in the 12 months to June 2024 compared to a similar period in 2023, mainly reflecting lower imports across all categories except sugar, machinery and transport equipment, crude materials, and miscellaneous manufactures. However, imports increased by 3.6% in the first six months of 2024 compared to the same period in 2023. Tourist arrivals improved by 27.2% in the 12 months to June 2024, compared to a similar period in 2023. Remittances totalled USD 4,535.5 mn in the 12 months to June 2024 and were 12.9% higher compared to USD 4,017.1 mn in a similar period in 2023. The current account deficit is estimated at 3.7% of GDP in the 12 months to June 2024, down from 4.2% of GDP in a similar period in 2023, and is projected at 4.0% of GDP in 2024, reflecting improvement in exports of agricultural products, sustained remittances, recovery in imports supported by stable exchange rate and effects of regional trade integration initiatives,
- The CBK foreign exchange reserves, which currently stand at USD 7,340 mn representing 3.8 months of import cover, continue to provide adequate cover and a buffer against any short-term shocks in the foreign exchange market,
- The banking sector remains stable and resilient, with strong liquidity and capital adequacy ratios. The ratio of gross non-performing loans (NPLs) to gross loans increased to 16.3% in June 2024 compared to 16.1% in April 2024, attributable to the 1.5% decrease in gross loans, that outpaced the 0.7% decrease in gross non-performing loans (NPLs) between the two periods. Decreases in NPLs were noted in the agriculture, real estate, manufacturing, transport and communication, trade, and building and construction sectors. Banks have continued to make adequate,
- The CEOs Survey and Market Perceptions Survey conducted ahead of the MPC meeting revealed a positive outlook on business activity for the next year. Participants of the survey expressed concerns about the impact of the recent protests on economic activities, the high cost of doing business, and the impact of geopolitical uncertainties on the economy. Despite this, they remained optimistic that economic growth would remain resilient and improve in 2024, supported by increased agricultural production, and a stable macroeconomic activity reflected in the low inflation rate and stability in the exchange rate,
- The Survey of the Agriculture Sector for July 2024 revealed an expectation by respondents that inflation was expected to remain unchanged or decrease in the next three months due to an expected rise in food supply due to expected harvests, stable exchange rate, and lower fuel prices,
- Global growth is expected to continue to recover, attributable to strong growth in the United States and improved growth in several large and emerging markets, particularly India and China. Additionally, headline inflation rates have moderated, with central banks in some major economies lowering their interest rates. Food inflation has continued to decline due to an improved supply of key food items, particularly sugar and cereals. International oil prices have moderated but the risk premium from the Middle East conflict has increased following the recent escalation,
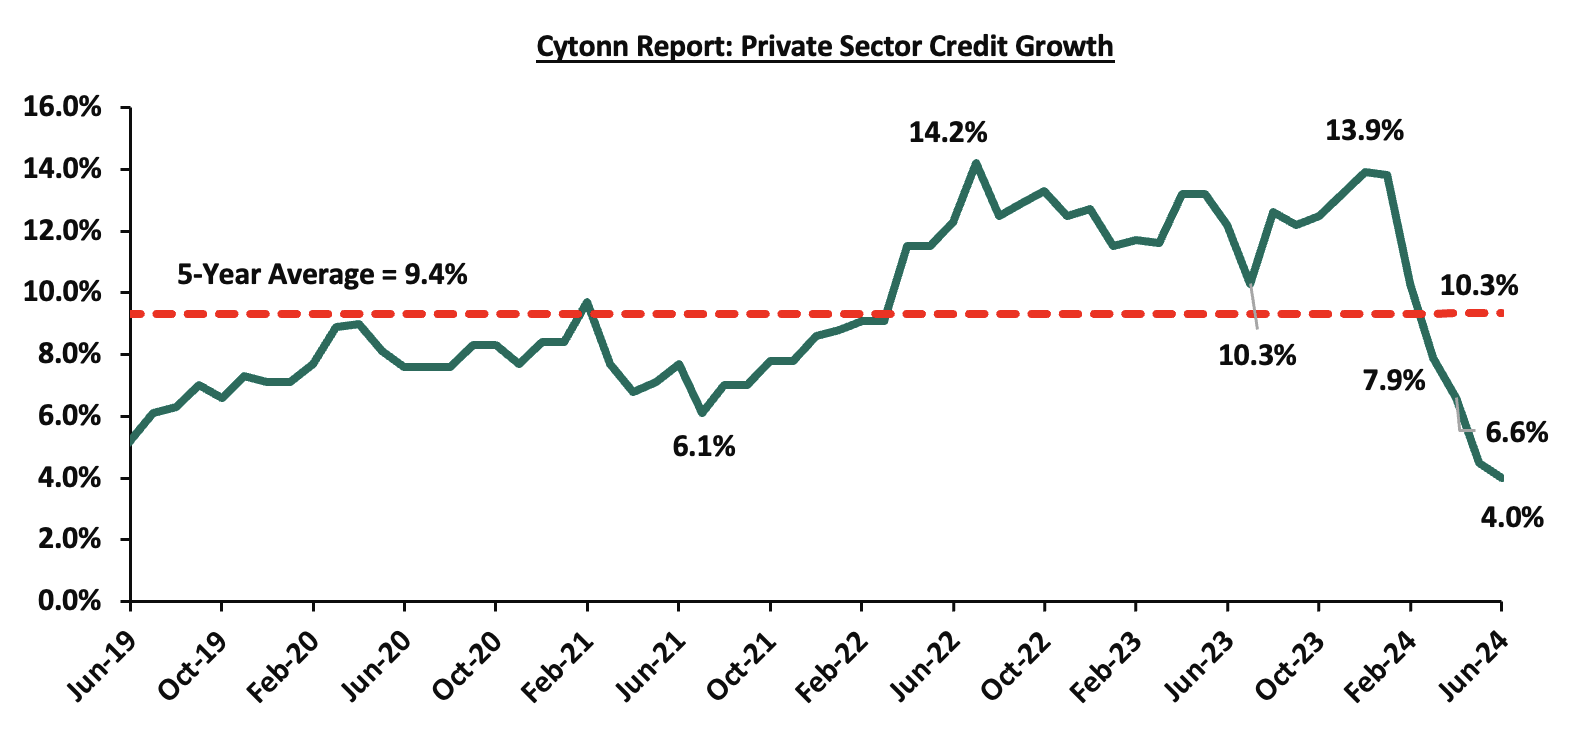
- Growth in private sector credit decreased to 4.0% in June 2024 from 4.5% in May 2024, mainly attributed to exchange rate valuation effects on foreign currency-denominated loans due to the appreciation of the Shilling. In June, local currency loans increased by 10.2%, while foreign currency loans, which make up around 26.0% of total loans, decreased by 13.3%. The chart below shows the movement of the private sector credit growth over the last five years:
- The Committee acknowledged the results of implementing the FY’2024/25 Government Budget and the FY’2024/25 Supplementary Budget I. These measures are anticipated to further support fiscal consolidation, reducing the fiscal deficit to 4.3% of GDP in FY’2024/25, from 5.6% of GDP in FY’2023/24. This medium-term fiscal consolidation is expected to decrease debt vulnerabilities and improve the debt/GDP ratio, steering it toward a more sustainable position.
The MPC noted that its previous measures have successfully reduced overall inflation to below the mid-point of the target range of 2.5%-7.5%, stabilized the exchange rate, and anchored inflationary expectations. The Committee also noted a moderation in NFNF inflation, while central banks in several major economies have started to ease their interest rates in response to easing inflationary pressures, with signs that others may soon follow suit. Consequently, the MPC concluded that there was scope for a gradual easing of monetary policy, while maintaining exchange rate stability, which we expect to gradually ease the interest rates in the country. The MPC will closely monitor the impact of its policy measures, as well as developments in the global and domestic economy, and stands ready to take further action as necessary in line with its mandate. We anticipate that the reduction in the CBR rate will start to lower borrowing costs, leading to increased spending and an uptick in the business environment as well as reduced debt servicing costs for the government, as the MPC closely monitors inflation and exchange rate stability to ensure the continuation of the current trend of stability and eased inflation. The Committee will meet again on 8th October 2024.
Fiscal Policy:
The total Kenyan budget for the FY’2024/2025 National Budget increased by 7.2% to Kshs 4.0 tn from the Kshs 3.7 tn in FY’2023/2024 while the total revenue inclusive of grants increasing by 15.9% to Kshs 3.4 tn from the Kshs 2.9 tn in FY’2023/2024. The increase is mainly due to an 18.8% increase in ordinary revenue to Kshs 2.8 tn for FY’2024/2025, from the Kshs 2.5 tn in FY’2023/2024 with the increase largely dependent on the effectiveness of the Kenya Revenue Authority in collecting taxes as well as an increase in some of the existing taxes to meet its revenue target.
However, following the withdrawal of the 2024 Finance bill that sought to increase revenue by Kshs 302.0 bn, the National Treasury, earlier than is usual, presented the Supplementary Estimates I for the Fiscal Year 2024/25 to the National Assembly.
The table below summarizes the overall change in the FY’2024/25 budget estimates.
|
Cytonn Report: FY’2024/25 Supplementary Budget Estimates I (Kshs bn) |
|||||
|
Item |
FY'2023/24 Supplementary Budget II
|
Original Approved Estimates FY’2024/25 |
Supplementary Estimates FY’2024/25 |
% Change between original and current estimates |
% Change between supplementary and 23/24 estimates |
|
Recurrent Expenditure |
1,719.9 |
1,632.1 |
1,598.0 |
(2.1%) |
(7.1%) |
|
Development Expenditure |
669.3 |
746.3 |
624.0 |
(16.4%) |
(6.8%) |
|
Ministerial National Government Expenditure |
2,389.2 |
2,378.4 |
2,222.0 |
(6.6%) |
(7.0%) |
|
Consolidated Fund Services |
1,057.7 |
1,213.5 |
1,237.2 |
2.0% |
17.0% |
|
County Equitable Allocation |
425.1 |
400.1 |
411.0 |
2.7% |
(3.3%) |
|
Total Expenditure |
3,872.0 |
3,992.0 |
3,870.2 |
(3.1%) |
(0.1%) |
Source: The National Treasury
Key take outs from the table include;
- The recurrent expenditure (Costs incurred to cover regular government expenses such as salaries, operational costs and maintenance costs) decreased by 2.1% to Kshs 1,598.0 bn in the Supplementary Estimates I from Kshs 1,632.1 bn in the original estimates, an indication of the government's initiative to cut expenditure cuts while still to boosting public services, responding to economic growth and ensuring the well-being of its citizens,
- Development expenditure (Costs incurred in order to create assets that will provide long term public infrastructure such as roads, hospitals, and schools) declined by 16.4% to Kshs 624.0 bn in the supplementary estimates from Kshs 746.3 bn in the original estimates, a detriment to the sectors such as infrastructure, energy, water and health that require heavy development financing,
- Consequently, the Ministerial National Government expenditure estimates for the FY’2024/25 Supplementary Budget I is set to decrease by 6.6% to Kshs 2,222.0 bn from Kshs 2,378.4 bn in the original estimates, translating to a reduction of Kshs 156.4 bn in expenses for the government. This decline is mainly attributed to budget rationalization aimed at reducing expenditure in various sectors and public services,
- Consolidated Fund Services (CFS) (refers to the Consolidated Fund established in the Kenya’s constitution into which development partners deposit funds before disbursing to the Exchequer accounts for projects such as servicing of public debt, and subscription to International Organizations) has increased by 2.0% to Kshs 1,237.2 bn from Kshs 1,213.5 bn in the original estimates, and,
- The County Equitable Share (allocation on national government revenue to county governments) increased by 2.7% to Kshs 411.0 bn from Kshs 400.1 bn in the original approved estimates.
For the FY’2023/2024, the government was not able to meet the revenue collection for FY’2023/24, collecting Kshs 2.4 tn, translating to a shortfall of 4.5% against its revenue target of Kshs 2.8 tn. Notably, for the FY’2024/2025, from the figures released by the National Treasury for revenue and net expenditures collected as at the end of August 2024, total revenue collected amounted to Kshs 331.6 bn, equivalent to 12.6% of the revised estimates of Kshs 2,631.4 bn for FY’2024/2025 and is 75.6% of the prorated estimates of Kshs 438.6 bn.
Going forward, we believe that the coming months’ revenue collection performance will largely depend on how quickly the country’s business climate stabilizes. We therefore expect the government to cut on its expenditure, mostly the development expenditure in order to finance the growing debt maturities and the ballooning recurrent expenditure.
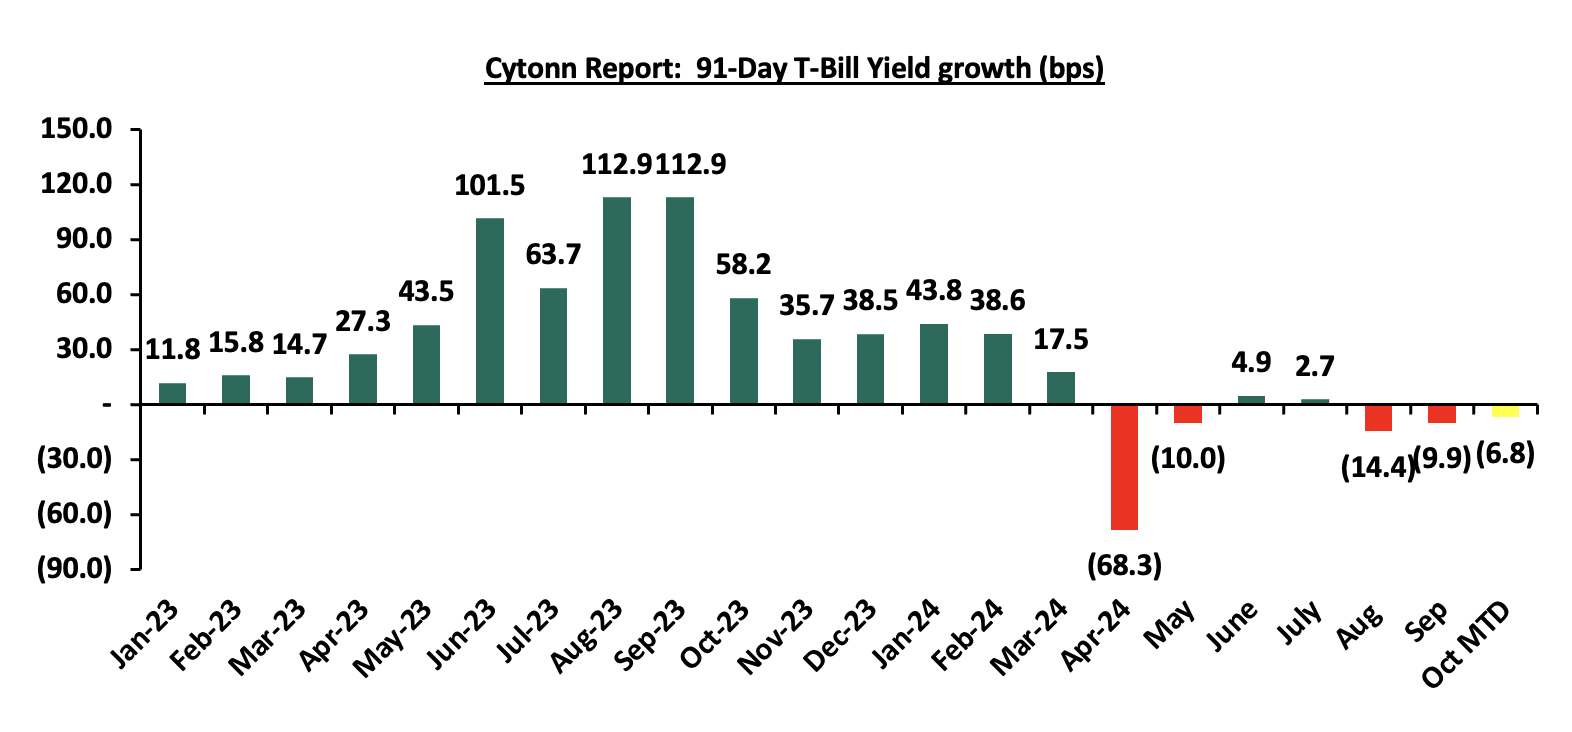
During the quarter, T-bills were oversubscribed, with the overall oversubscription rate coming in at 109.4%, down from 114.1% in Q3’2023. Investors’ preference for the 91-day paper persisted as they sought to avoid duration risk, with the paper receiving bids worth Kshs 189.4 bn against the offered Kshs 56.0 bn, translating to an oversubscription rate of 338.3%, lower than the oversubscription rate of 570.7% recorded in the previous year same period. Overall subscriptions for the 182-day and 364-day papers increased significantly to 77.6% and 49.6% from 27.1% and 18.4% in Q3’2023, respectively. The yields on all the papers were on an upward trajectory with the average yields on the 364-day, 182-day, and 91-day papers increasing by 3.4%, 3.5%, and 7.7% points to 15.9%, 16.7%, and 16.9%, from 13.2%, 13.2%, and 13.5%, respectively, recorded in Q3’2023. The upward trajectory in yields is mainly on the back of investors attaching higher risks amid the high risk attached to government debt, hence the need to demand higher returns to cushion against the possible loss. The acceptance rate during the period came in at 88.3%, albeit lower than the 95.5% recorded in Q3’2023, with the government accepting a total of Kshs 324.5 bn out of the Kshs 367.5 bn worth of bids received. The chart below shows the yield growth rate for the 91-day paper in 2023 and during the year:
During the week, T-bills were oversubscribed, with the overall oversubscription rate coming in at 224.8%, a reversal from the undersubscription rate of 87.2% recorded the previous week. Investors’ preference for the shorter 91-day paper persisted, with the paper receiving bids worth Kshs 17.4 bn against the offered Kshs 4.0 bn, translating to an oversubscription rate of 433.8%, higher than the oversubscription rate of 173.0% recorded the previous week. The subscription rates for the 182-day and 364-day papers increased significantly to 202.1% and 164.0% respectively from the 54.4% and 85.7% respectively recorded the previous week. The government accepted a total of Kshs 29.2 bn worth of bids out of Kshs 54.0 bn bids received, translating to an acceptance rate of 54.2%. The yields on the government papers were on a downward trajectory, with the yields on the 364-day, 182-day and 91-day papers decreasing by 7.1 bps, 8.9 bps and 3.3 bps to 16.7%, 16.5% and 15.7% respectively from 16.8%, 16.6% and 15.7% respectively recorded the previous week.
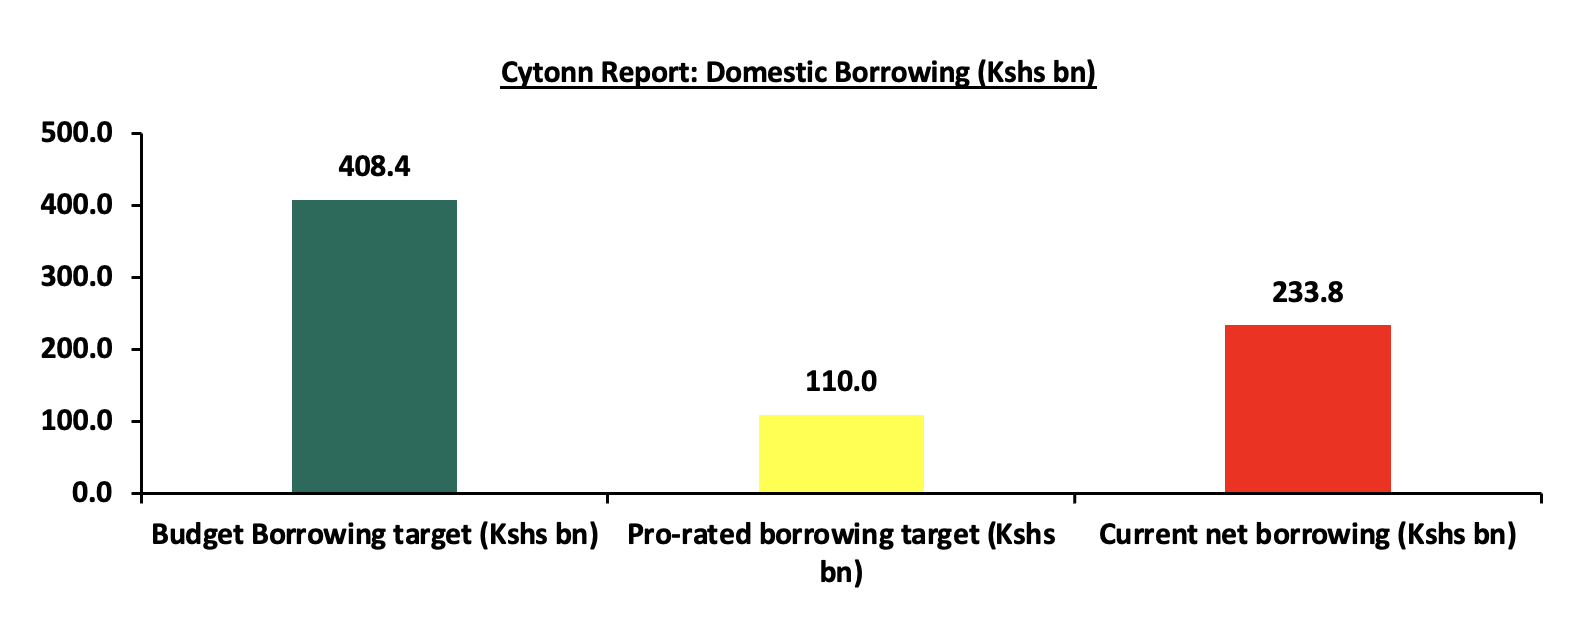
So far in the current FY’2024/25, government securities totalling Kshs 505.0 bn have been advertised. The government has accepted bids worth Kshs 504.0 bn, of which Kshs 353.7 bn and Kshs 150.3 bn were treasury bills and bonds, respectively. Total redemptions so far in FY’2024/25 equal to Kshs 270.2 bn, with treasury bills accounting for Kshs 270.2 bn. As a result, currently, the government has a domestic borrowing surplus of Kshs 233.8 bn, which is 42.7% of the total net domestic borrowing target of Kshs 408.4 bn for FY’2024/25. The chart below shows government’s current borrowing position:
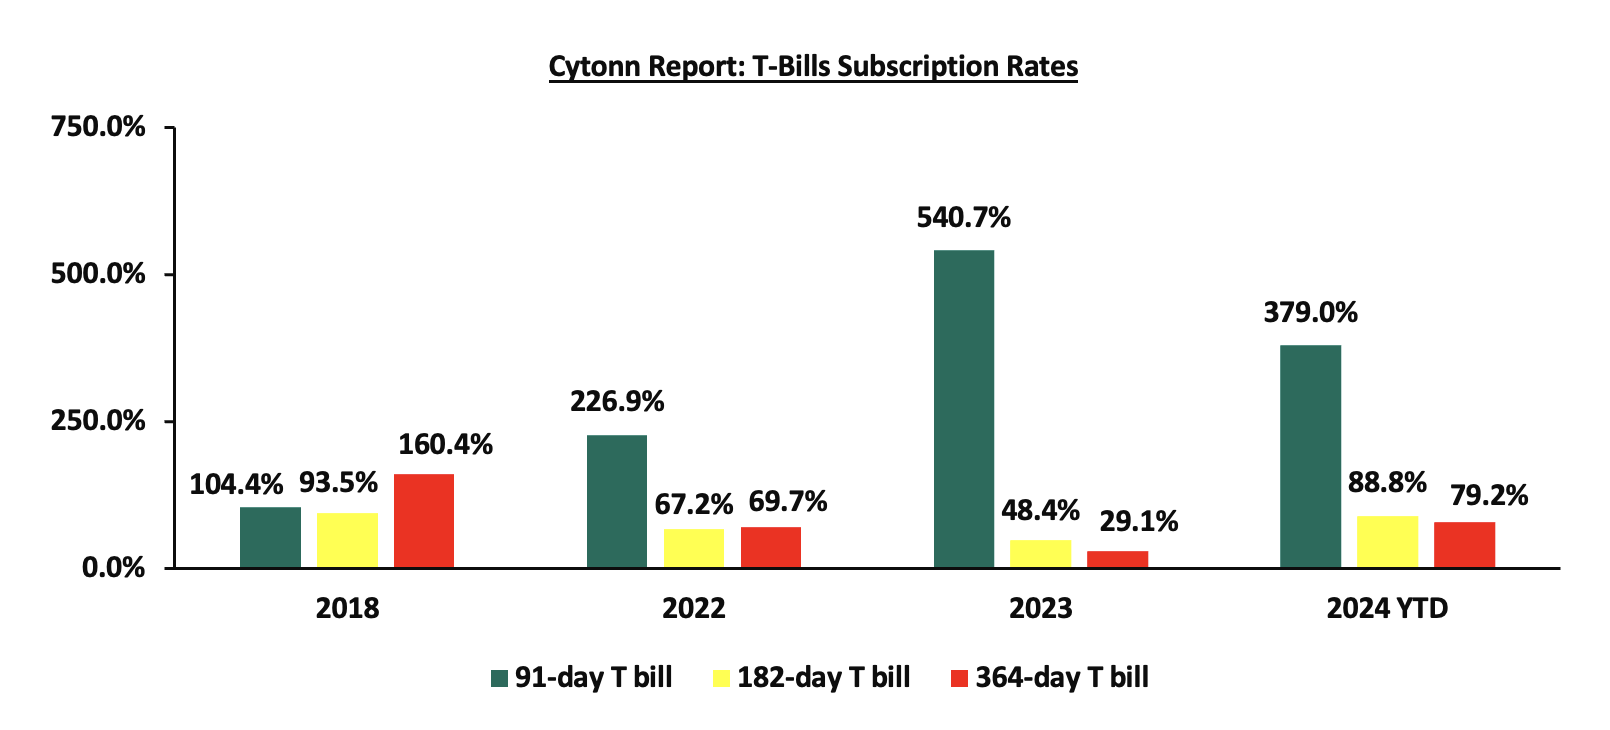
The chart below compares the overall average T-bills subscription rates obtained in 2018, 2022, 2023, and 2024 Year to Date (YTD):
Primary T-bond Auctions in Q3’2024:
During the quarter, the government re-opened six bonds and issued two tap sales, seeking to raise Kshs 145.0 bn during the quarter. The bonds were generally oversubscribed, receiving bids worth Kshs 199.3 bn against the offered Kshs 145.0 bn, translating to an oversubscription rate of 144.5%. The government accepted Kshs 150.3 bn of the Kshs 199.3 bn worth of bids received, translating to an acceptance rate of 80.5%. The table below provides more details on the bonds issued during the quarter:
|
Cytonn Report: Bond Issuances in Q3’2024 |
||||||||||
|
Issue Date |
Bond Auctioned |
Effective Tenor to Maturity (Years) |
Coupon |
Amount offered (Kshs bn) |
Actual Amount Raised (Kshs bn) |
Total bids received |
Average Accepted Yield |
Subscription Rate |
Acceptance Rate |
|
|
08/07/2024 |
FXD1/2023/002 -Tapsale |
1.2 |
17.0% |
20.0 |
0.5 |
0.5 |
17.1% |
2.4% |
99.8% |
|
|
22/07/2024 |
FXD1/2024/010 – Re-opened |
9.7 |
16.0% |
30.0 |
9.8 |
14.7 |
16.6% |
48.9% |
66.5% |
|
|
FXD1/2008/020 – Re-opened |
3.9 |
13.8% |
18.3% |
|||||||
|
19/08/2024 |
IFB1/2023.6.5 |
5.8 |
17.9% |
50.0 |
88.7 |
126.3 |
18.3% |
252.6% |
70.2% |
|
|
IFB1/2023/17 |
||||||||||
|
|
15.7 |
14.4% |
17.7% |
|||||||
|
02/09/2024 |
IFB1/2023/17- Tapsale
|
15.7
|
14.4% |
15.0 |
32.0 |
35.2 |
17.7% |
234.6% |
91.0% |
|
|
23/09/2024 |
FXD1/2016/020 - Re-opened |
12.0 |
14.0% |
30.0 |
19.3 |
22.6 |
17.3% |
75.5% |
85.1% |
|
|
FXD1/2024/010 - Re-opened |
9.5 |
16.0% |
16.9% |
|||||||
|
Q3’2024 Total |
|
|
145.0 |
150.3 |
199.3 |
|
|
|
||
|
Q3’2023 Total |
|
|
176.0 |
146.3 |
206.8 |
|
|
|
||
|
Q3’2024 Average |
9.4 |
15.5% |
|
|
|
17.5% |
144.5% |
80.5% |
||
|
Q3’2023 Average |
3.5 |
16.3% |
|
|
|
17.2% |
138.7% |
87.3% |
||
Source: CBK
In the primary bond market, the government is looking to raise Kshs 30.0 bn through the reopened two-year fixed coupon bonds FXD1/2016/10 and FXD1/2022/010 with the tenor to maturity of 1.8 years and 7.6 years respectively and fixed coupon rates of 15.0% and 13.5% respectively. Our expected bidding ranges for the reopened bonds are 17.0%-17.3% and 16.9%-17.2% respectively;
Secondary Bond Market Activity:
- Bond Turnover
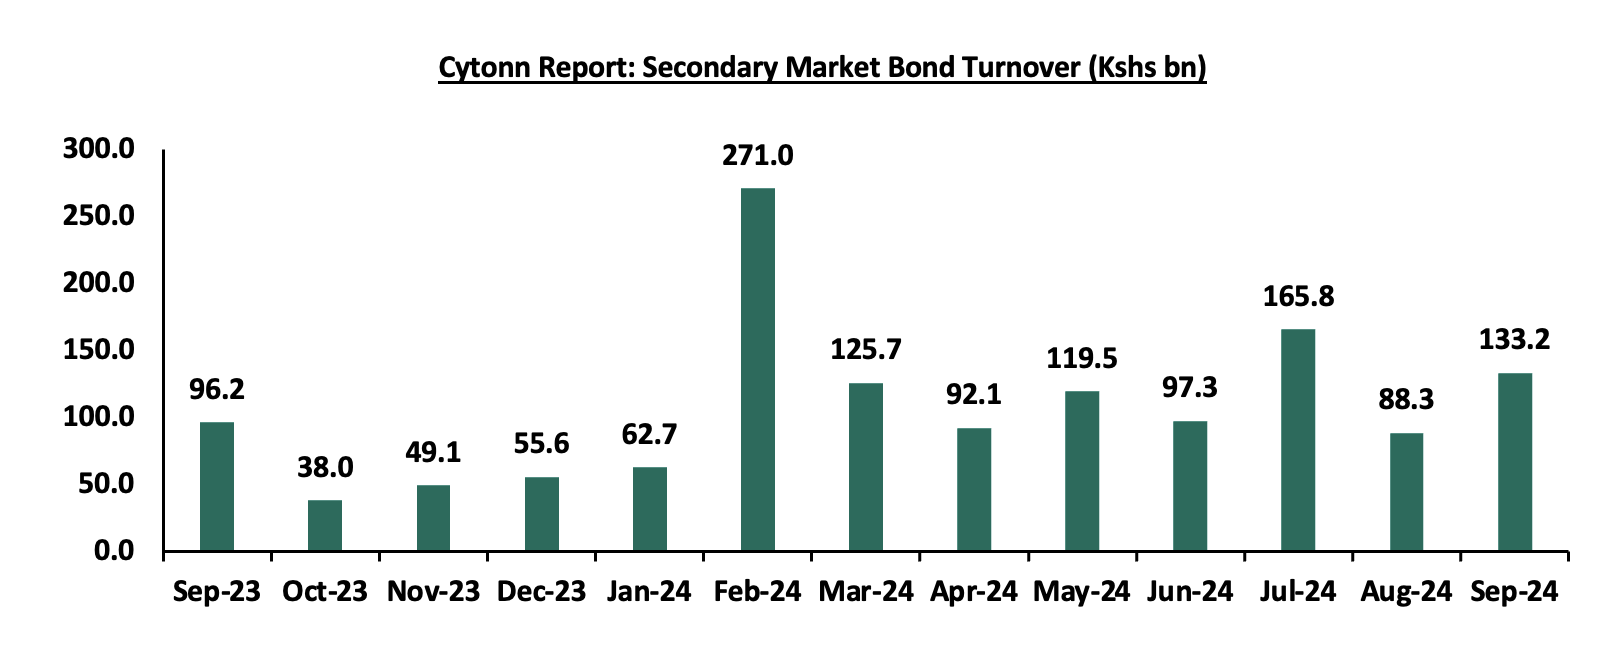
In the secondary bond market, activity increased significantly, with the turnover increasing by 84.0% to Kshs 387.4 bn, from Kshs 210.5 bn in Q3’2023, pointing towards increased activities by commercial banks in the secondary bond market. Similarly, on a year-on-year basis, the bond turnover increased by 38.4% to Kshs 133.2 in September 2024, from Kshs 96.2 bn worth of treasury bonds transacted over a similar period last year. The chart below shows the bond turnover over the past 12 months;
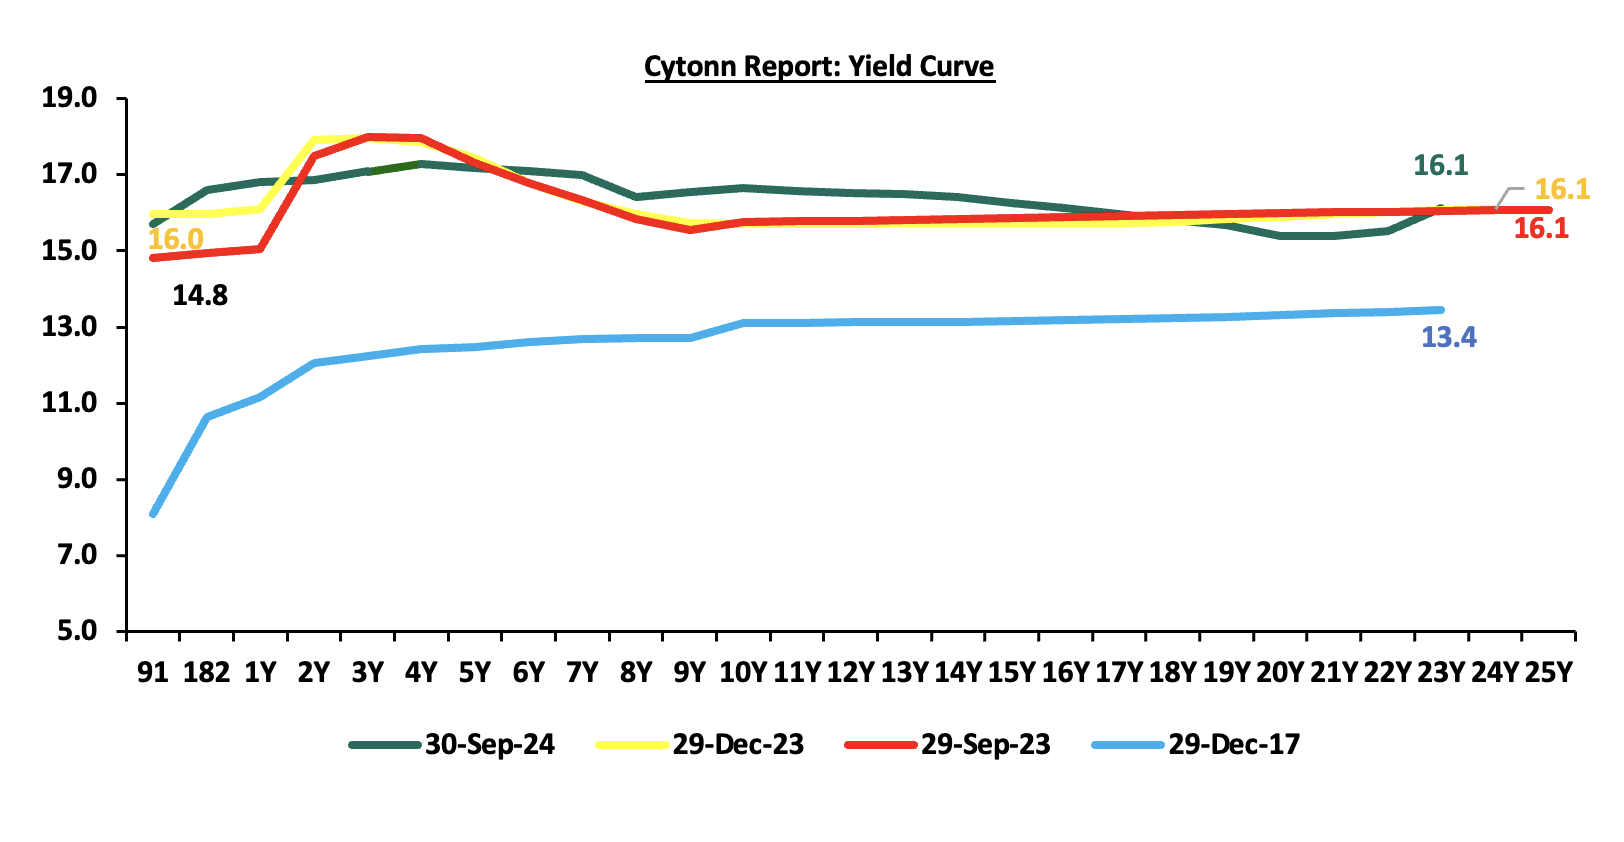
- Yield Curve
During Q3’2024, yields on the government securities were on an upward trajectory compared to the same period in 2023. We observe a humped yield curve for the medium-term bonds in the 3 to 7-year maturity range, an indication of the prevailing uncertainty in the market regarding both medium-term interest rates and inflation. Investors, apprehensive about the economic outlook in the near to medium term, are demanding higher yields for bonds in the 3 to 7-year maturity range to compensate for the perceived risks as they anticipate potential fluctuations in economic conditions in the Kenyan market on the back of the government’s debt sustainability concerns. The chart below shows the yield curve movement during the period:
Money Market Performance:
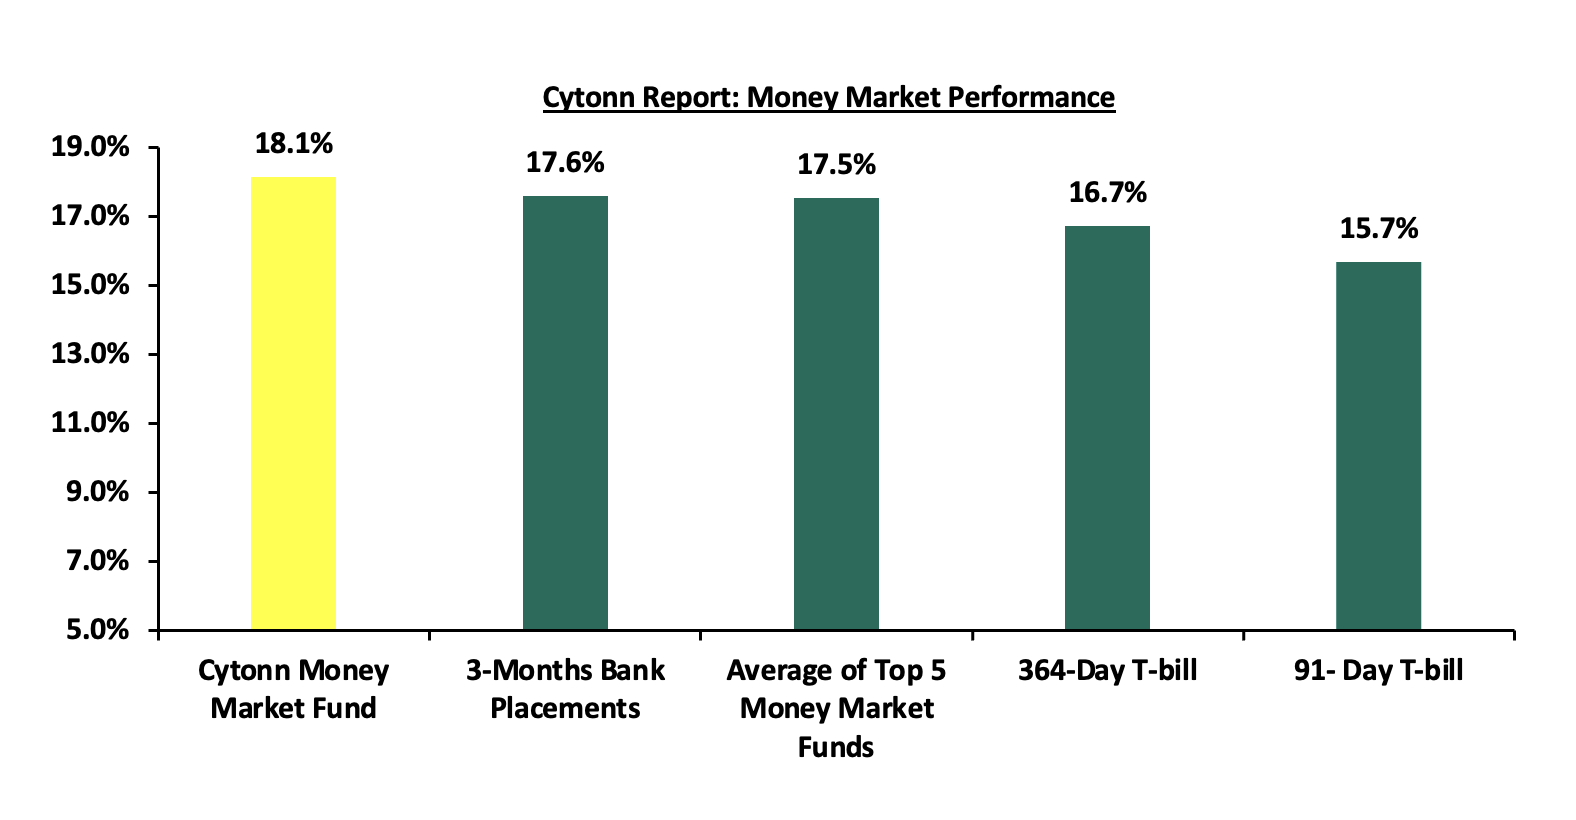
In the money markets, 3-month bank placements ended the week at 17.6% (based on what we have been offered by various banks), and the yields on the government papers were on a downward trajectory, with the yields on the 364-day and 91-day papers decreasing by 7.1 bps and 3.3 bps respectively, to 16.7% and 15.7% respectively from 16.8% and 15.7% respectively recorded the previous week. The yields on the Cytonn Money Market Fund decreased marginally by 1.0 bps to close the week at 18.1% from 18.2% the previous week, while the average yields on the Top 5 Money Market Funds decreased by 7.2 bps to 17.5% from the 17.6% recorded the previous week.
The table below shows the Money Market Fund Yields for Kenyan Fund Managers as published on 4th October 2024:
|
Cytonn Report: Money Market Fund Yield for Fund Managers as published on 4th October 2024 |
||
|
Rank |
Fund Manager |
Effective Annual Rate |
|
1 |
Cytonn Money Market Fund (Dial *809# or download the Cytonn App) |
18.1% |
|
2 |
Lofty-Corban Money Market Fund |
18.0% |
|
3 |
Etica Money Market Fund |
17.4% |
|
4 |
Arvocap Money Market Fund |
17.1% |
|
5 |
Kuza Money Market fund |
17.0% |
|
6 |
GenAfrica Money Market Fund |
16.5% |
|
7 |
Nabo Africa Money Market Fund |
16.0% |
|
8 |
Enwealth Money Market Fund |
16.0% |
|
9 |
Jubilee Money Market Fund |
15.7% |
|
10 |
Madison Money Market Fund |
15.6% |
|
11 |
Ndovu Money Market Fund |
15.5% |
|
12 |
Co-op Money Market Fund |
15.4% |
|
13 |
KCB Money Market Fund |
15.3% |
|
14 |
Mali Money Market Fund |
15.2% |
|
15 |
Sanlam Money Market Fund |
15.1% |
|
16 |
Absa Shilling Money Market Fund |
15.0% |
|
17 |
Apollo Money Market Fund |
15.0% |
|
18 |
Orient Kasha Money Market Fund |
14.8% |
|
19 |
AA Kenya Shillings Fund |
14.6% |
|
20 |
Stanbic Money Market Fund |
14.5% |
|
21 |
Genghis Money Market Fund |
14.4% |
|
22 |
Dry Associates Money Market Fund |
14.1% |
|
23 |
Old Mutual Money Market Fund |
14.0% |
|
24 |
ICEA Lion Money Market Fund |
13.8% |
|
25 |
CIC Money Market Fund |
13.7% |
|
26 |
Equity Money Market Fund |
13.3% |
|
27 |
British-American Money Market Fund |
13.1% |
|
28 |
Mayfair Money Market Fund |
11.9% |
Source: Business Daily
Liquidity:
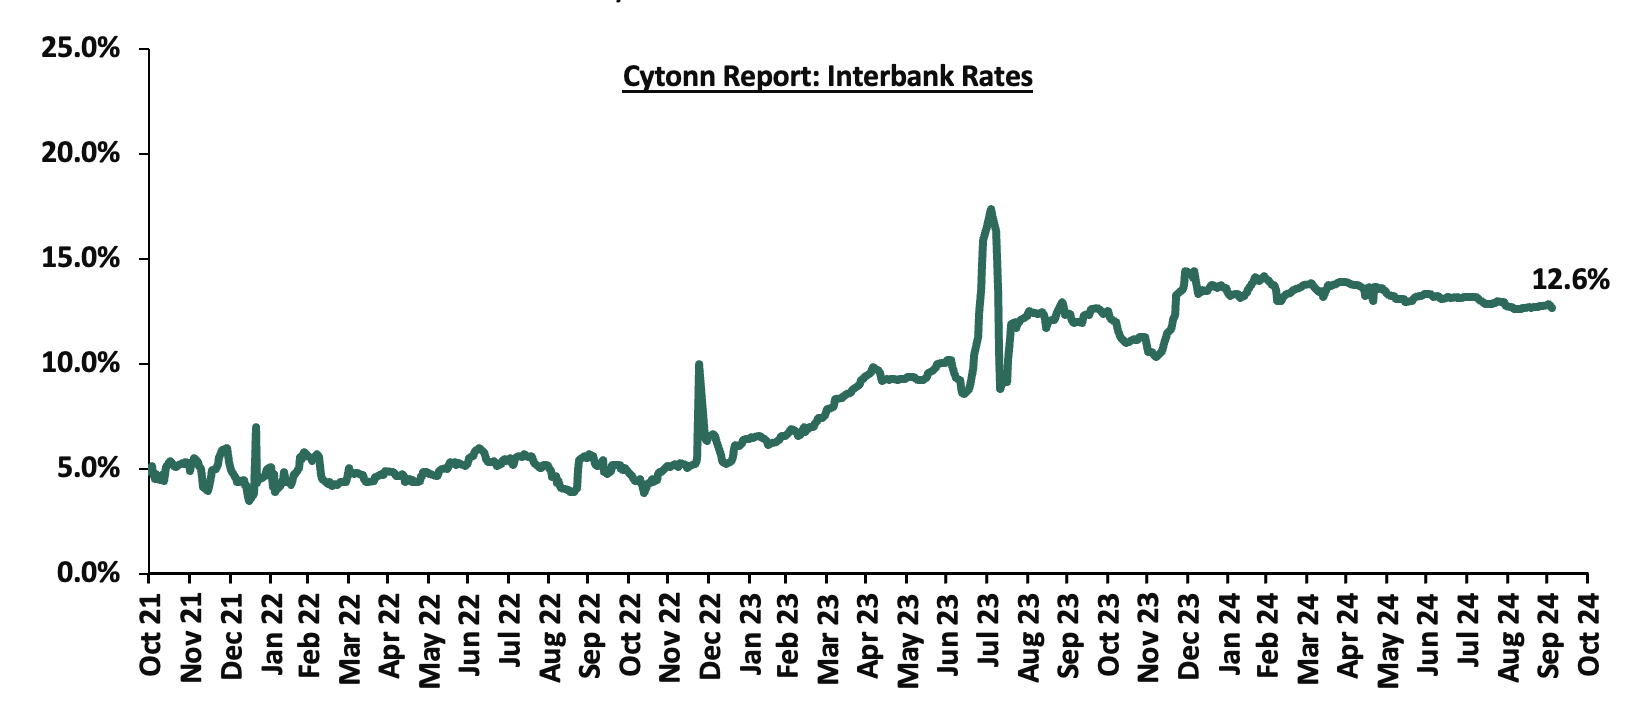
During the quarter, liquidity in the money market tightened, with the average interbank rate increasing by 1.1% points to 13.0% from 11.9% in Q3’2023, partly attributable to tax remittances that offset government payments. The average volumes traded in the interbank market increased by 15.4% to Kshs 26.0 bn, from Kshs 22.6 bn recorded in Q3’2023.
During the week, liquidity in the money markets tightened, with the average interbank rate increasing marginally by 1.8 bps to 12.8% from 12.7% recorded the previous week, partly attributable to tax remittances that offset government payments. The average interbank volumes traded decreased marginally by 1.0% to Kshs 17.9 bn from Kshs 18.1 bn recorded the previous week. The chart below shows the interbank rates in the market over the years:
Kenya Eurobonds:
During the quarter, the yields on Eurobonds were on a downward trajectory, with the 7-year Eurobond issued in 2019 decreasing the most by 2.0% points to 8.3% from 10.3% recorded at the start of the quarter. However, during the week, the yields on Kenya’s Eurobonds were on an upward trajectory, with the yields on the7-year Eurobond issued in 2024 increasing the most by 0.5% points to 9.9% from the 9.4% recorded the previous week. The table below shows the summary of the performance of the Kenyan Eurobonds as of 3rd October 2024;
|
Cytonn Report: Kenya Eurobonds Performance |
||||||
|
|
2018 |
2019 |
2021 |
2024 |
||
|
Tenor |
10-year issue |
30-year issue |
7-year issue |
12-year issue |
13-year issue |
7-year issue |
|
Amount Issued (USD) |
1.0 bn |
1.0 bn |
0.9 bn |
1.2 bn |
1.0 bn |
1.5 bn |
|
Years to Maturity |
3.4 |
23.4 |
2.6 |
7.6 |
9.7 |
6.4 |
|
Yields at Issue |
7.3% |
8.3% |
7.0% |
7.9% |
6.2% |
10.4% |
|
01-Jan-24 |
9.8% |
10.2% |
10.1% |
9.9% |
9.5% |
|
|
01-Jul-24 |
10.6% |
11.1% |
10.3% |
11.0% |
11.0% |
11.1% |
|
26-Sep-24 |
8.5% |
9.9% |
8.3% |
9.4% |
9.4% |
9.4% |
|
27-Sep-24 |
8.6% |
9.9% |
8.3% |
9.5% |
9.4% |
9.4% |
|
30-Sep-24 |
8.6% |
9.9% |
8.3% |
9.6% |
9.4% |
9.5% |
|
01-Oct-24 |
8.6% |
10.1% |
8.3% |
9.5% |
9.4% |
9.5% |
|
02-Oct-24 |
8.8% |
10.2% |
8.6% |
9.7% |
9.6% |
9.7% |
|
03-Oct-24 |
9.0% |
10.2% |
8.7% |
9.8% |
9.7% |
9.9% |
|
Weekly Change |
0.5% |
0.3% |
0.4% |
0.4% |
0.3% |
0.5% |
|
QTD Change |
(1.9%) |
(1.1%) |
(2.0%) |
(1.5%) |
(1.6%) |
(1.5%) |
|
YTD Change |
(0.8%) |
(0.0%) |
(1.4%) |
(0.1%) |
0.2% |
- |
Source: Central Bank of Kenya (CBK) and National Treasury
Kenya Shilling:
During the quarter, the Kenya Shilling gained against the US Dollar by 0.3%, to close at Kshs 129.2, from Kshs 129.5 recorded at the start of the quarter. On a year-to-date basis, the shilling has appreciated by 17.7% against the dollar, a contrast to the 26.8% depreciation recorded in 2023.
During the week, the Kenya Shilling gained against the US Dollar by 1.3 bps, to close at Kshs 129.2, from Kshs 129.2 recorded the previous week.
We expect the shilling to be supported by:
- Diaspora remittances standing at a cumulative USD 4,645.0 mn in the 12 months to August 2024, 12.7% higher than the USD 4,120.0 mn recorded over the same period in 2023, which has continued to cushion the shilling against further depreciation. In the August 2024 diaspora remittances figures, North America remained the largest source of remittances to Kenya accounting for 56.0% in the period,
- The tourism inflow receipts which came in at USD 352.5 bn in 2023, a 31.5% increase from USD 268.1 bn inflow receipts recorded in 2022, and owing to tourist arrivals that improved by 27.2% in the 12 months to June 2024, from the arrivals recorded during a similar period in 2023, and,
- Improved forex reserves currently at USD 8.2 bn (equivalent to 4.2-months of import cover), which is above the statutory requirement of maintaining at least 4.0-months of import cover, but lower than the EAC region’s convergence criteria of 4.5-months of import cover.
The shilling is however expected to remain under pressure in 2024 as a result of:
- An ever-present current account deficit which came at 3.2% of GDP in Q1’2024 from 3.0% recorded in Q1’2023, and,
- The need for government debt servicing, continues to put pressure on forex reserves given that 67.9% of Kenya’s external debt is US Dollar-denominated as of March 2024.
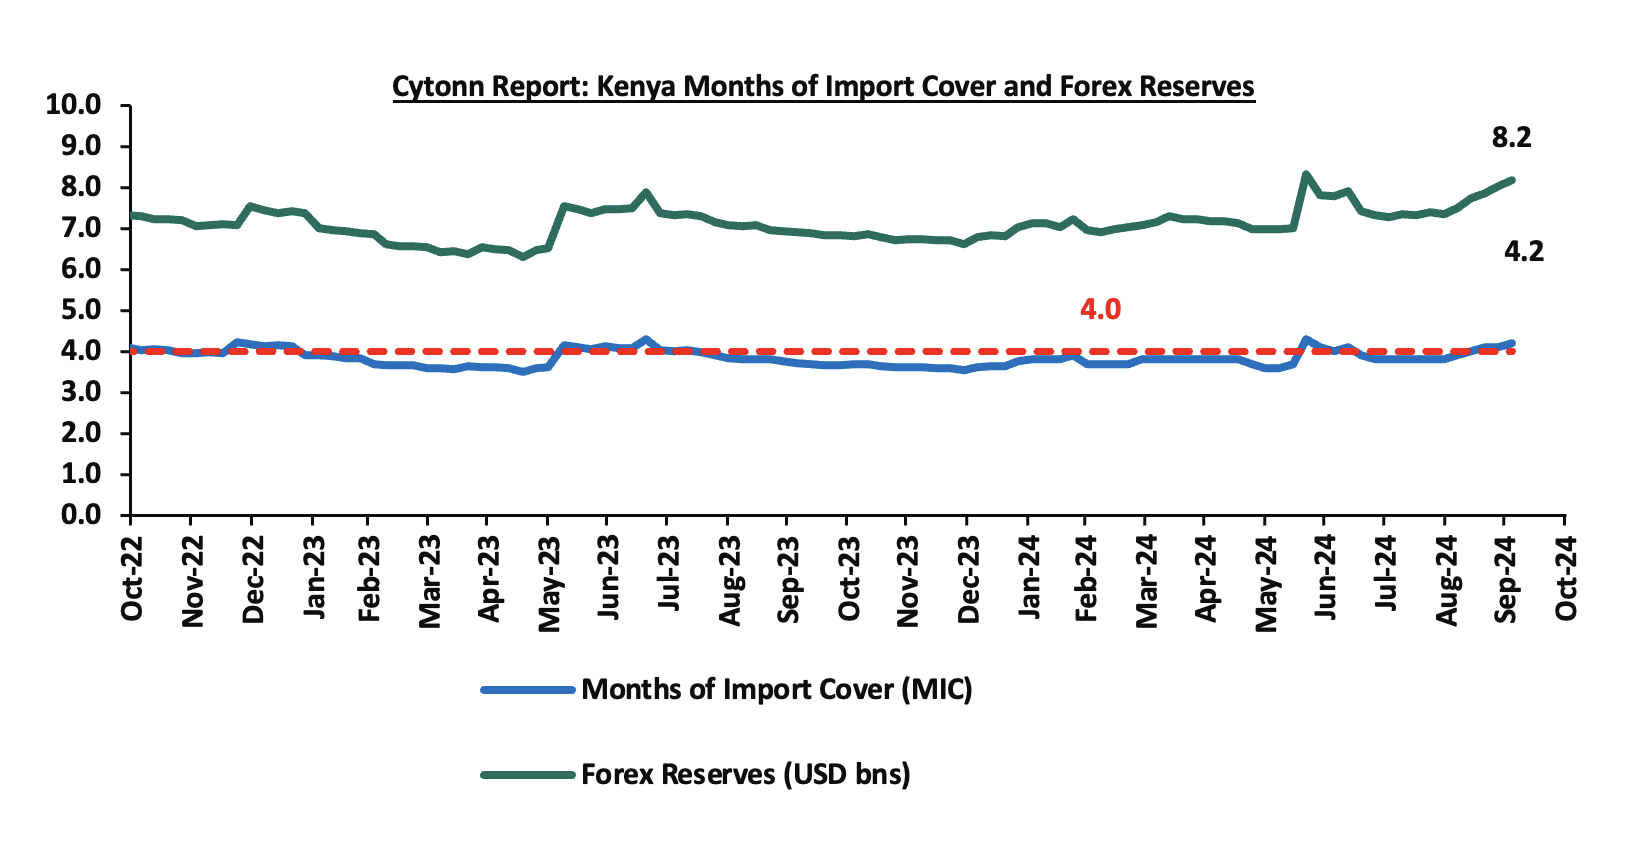
Key to note, during the quarter, Kenya’s forex reserves increased by 3.2% to close at USD 8.0 bn from the USD 7.8 recorded at the start of the quarter. Moreover, during the week, the reserves increased by 2.0% to close the week at USD 8.2 bn from the USD 8.0 bn recorded last week, equivalent to 4.2 months of import cover, an increase from the previous week’s 4.1 months, and remained above the statutory requirement of maintaining at least 4.0 months of import cover. The chart below summarizes the evolution of Kenya's months of import cover over the years:
Weekly Highlights:
- Kenya Q2’2024 GDP Growth Highlight
During the week, the Kenya National Bureau of Statistics (KNBS) released the Q2’2024 Quarterly Gross Domestic Product Report, highlighting that the Kenyan economy recorded a 4.6% growth in Q2’2024, slower than the 5.6% growth recorded in Q2’2023. The main contributor to Kenyan GDP remains to be the Agriculture, fishing and forestry sector which grew by 4.8% in Q2’2024, lower than the 7.8% expansion recorded in Q2’2023. All sectors in Q2’2024, except Mining and Quarrying; and Construction recorded positive growths, with varying magnitudes across activities. Most sectors recorded declining growth rates compared to Q2’2023 with Accommodation and Food Services; Financial & Insurance; and Construction Sectors recording the highest declines of 16.2%, 8.1%, and 5.6% points, respectively. Other sectors that recorded a contraction in growth rate, from what was recorded in Q2’2023 were Financial Services Indirectly Measured, Agriculture and Forestry and Real Estate sectors, of 4.0%, 3.0% and 2.1% points respectively.
The key take-outs from the report include;
- Sectoral Contribution to Growth - The biggest gainer in terms of sectoral contribution to GDP was the Accommodation and Food Services sector, increasing by 0.3% points to 1.5% in Q2’2024 from 1.2% in Q2’2023, while the Construction sector was the biggest loser, declining by 0.4% points to 5.1% in Q2’2024, from 5.5% in Q2’2023. Real Estate was the second largest contributor to GDP at 10.3% in Q2’2024, up from 10.2% recorded in Q2’2023, indicating sustained growth. The Accommodation and Food Services sector recorded the highest growth rate in Q2’2024 growing by 26.6%, slower than the 42.8% growth recorded in Q2’2023.
- The chart below shows the top contributors to GDP by sector in Q2’2024:
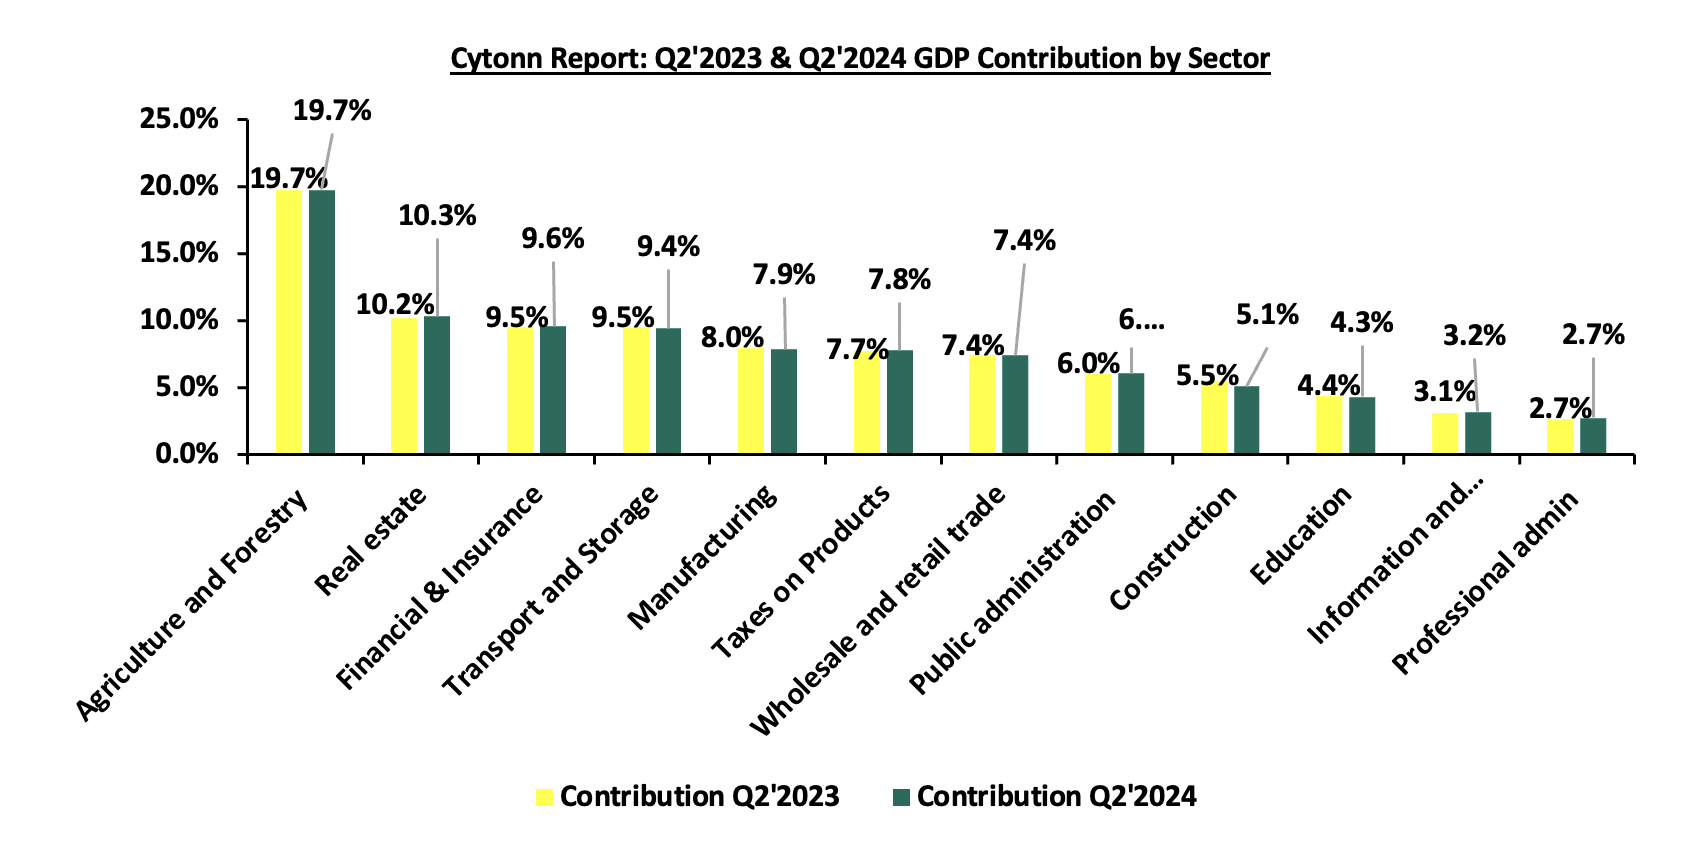
Source: KNBS Q2’2023 and Q2’2024 GDP Report
- Slowed growth in the Agricultural Sector: Agriculture and Forestry recorded a growth of 4.8% in Q2’2024. The performance was a decrease of 3.0% points, from the expansion of 7.8% recorded in Q2’2023,
- Reduced growth in the Financial and Insurance Services Sector: The Financial and Insurance sector registered a growth decline of 8.1% points to 5.1% in Q2’2024 compared to 13.2% in Q2’2023, attributable to the rise in cost of credit during the period. However, the contribution to GDP increased marginally to 9.6%, from 9.5% in Q2’2023,
- Decelerated growth in the electricity supply sector - The Electricity and Water Supply sector recorded a slowed growth of 1.0% in Q2’2024 compared to a 2.8% growth in a similar period of review in 2023, with, the sectoral contribution to GDP marginally decreasing by 0.1% points in Q2’2024, to 2.2% from 2.3% recorded in Q2’2023. The slowed growth in the sector was due to a decline in total electricity generation, which decreased by 1.5% to 3,041.5 mn KWh from 3,088.6 mn Kwh. The sector’s growth was supported by an increase in hydroelectric power,
- Significant growth in the Accommodation and Food Service sector: Accommodation and Food Services sector is the only sector that recorded double-digit growth in Q2’2024, having expanded by 26.6%, albeit slower than the 42.8% recorded in Q2’2023. Additionally, the contribution to GDP increased by 0.3% points, to 1.5% in Q2’2024, compared to 1.2% recorded in Q2’2023.
The chart below shows the different sectoral GDP growth rates for Q2’2024
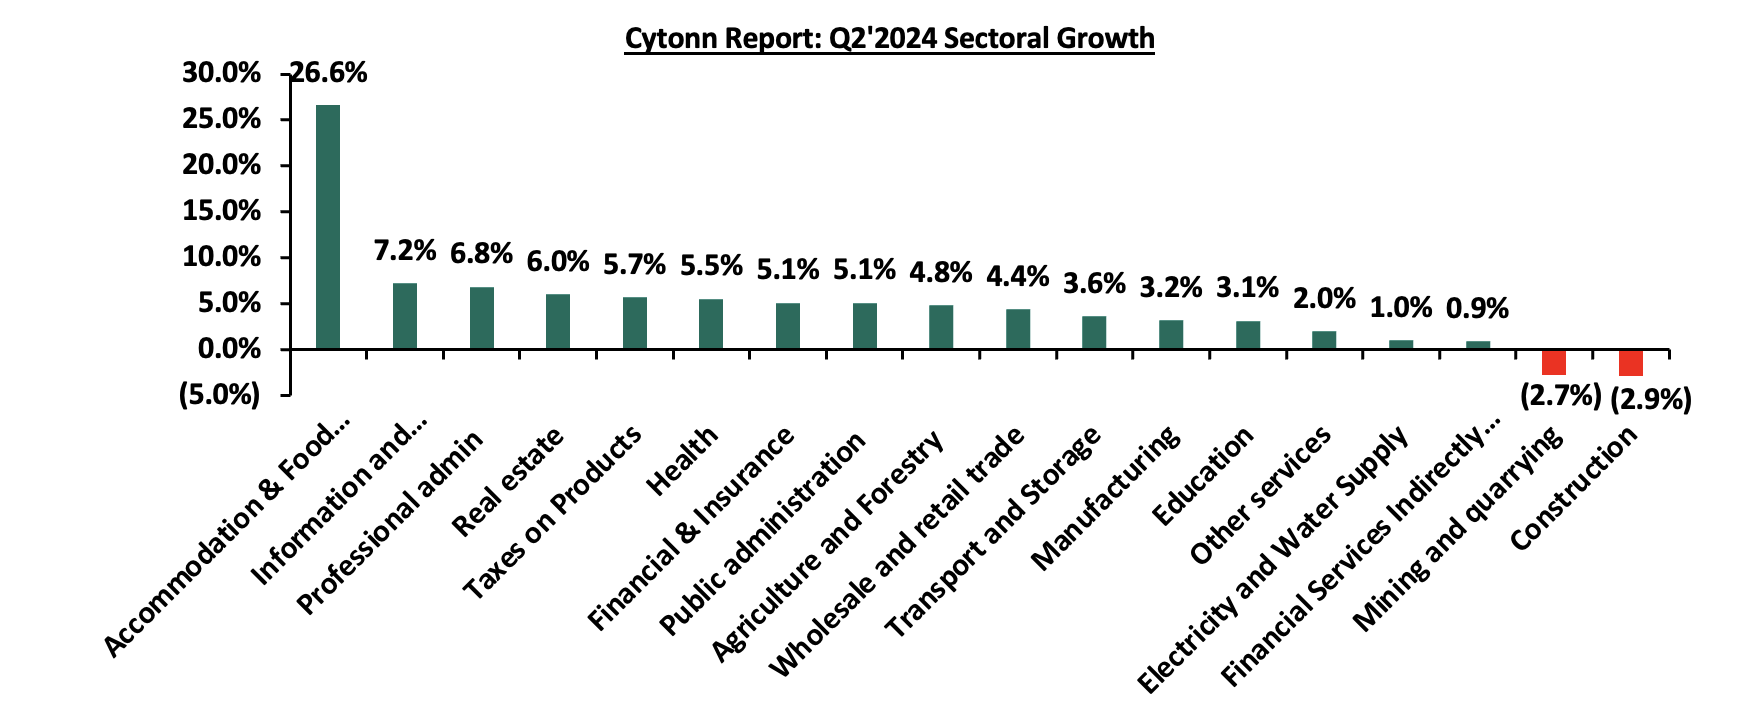
Source: KNBS Q2’2024 GDP Report
In the near term, we expect the economy to grow at a slower pace given the restrained business activity resulting from the challenging economic environment, driven by increasing taxes and elevated costs of living. However, recent economic developments, including the Central Bank of Kenya's (CBK) decision to lower the Central Bank Rate (CBR) in its August 2024 meeting by 25.0 bps to 12.75% and the anticipated further reduction in the October 2024 and subsequent meetings, will provide a more accommodative monetary policy stance. This shift, combined with the significant easing of inflation, currently at 3.6% as of September 2024, and a stronger Shilling is expected to alleviate some pressure on the cost of credit, thereby improving access to affordable borrowing. The lower CBR is likely to support investment spending by both individuals and businesses, contributing positively to economic activity. Inflation remains well within the CBK's target range of 2.5%-7.5%, and while risks of rising fuel prices persist due to global geopolitical tensions, the overall inflation outlook is more favorable. Despite this, consumer purchasing power remains somewhat constrained, which may limit demand for goods and services, moderating economic growth. On a positive note, the agricultural sector, Kenya's largest contributor to GDP, is expected to continue supporting growth due to favorable rainfall, while easing inflationary pressures and a strengthening Shilling provide further optimism for the economic outlook.
- Kenya Q2’2024 Balance of Payments Highlight
During the week, the Kenya National Bureau of Statistics released the Q2’2024 Balance of Payment Report released by the Kenya National Bureau of Statistics (KNBS), Kenya’s balance of payments position deteriorated by 45.0% in Q2’2024, coming in at a surplus of Kshs 84.1 bn, from a surplus of Kshs 152.9 bn in Q2’2023, and a significant improvement from the Kshs 36.0 bn deficit recorded in Q1’2024.
Balance of Payments
Kenya’s balance of payment (BoP) position deteriorated by 45.0% in Q2’2024, with a surplus of Kshs 84.1 bn, from a surplus of Kshs 152.9 bn in Q2’2023, and a significant improvement from the Kshs 36.0 bn deficit recorded in Q1’2024. The y/y negative performance in BoP was mainly driven by a 40.0% decline in the financial account balance to a surplus of Kshs 198.3 bn in Q2’2024, from a surplus of Kshs 330.7 bn in Q2’2023. The performance was however supported by a 34.5% improvement in the current account balance to a deficit of Kshs 104.1 bn from a deficit of Kshs 159.0 bn in Q2’2023. The table below shows the breakdown of the various balance of payments components, comparing Q2’2023 and Q2’2024:
|
Cytonn Report: Kenya Balance of Payments |
|||
|
Item |
Q2’2023 |
Q2’2024 |
Y/Y % Change |
|
Current Account Balance |
(159.0) |
(104.1) |
34.5% |
|
Capital Account Balance |
4.9 |
8.0 |
64.4% |
|
Financial Account Balance |
330.7 |
198.3 |
(40.0%) |
|
Net Errors and Omissions |
(23.7) |
(18.1) |
23.5% |
|
Balance of Payments |
152.9 |
84.1 |
(45.0%) |
All values in Kshs bns
Key take-outs from the table include;
- The current account deficit (value of goods and services imported exceeds the value of those exported) narrowed by 34.5% to Kshs 104.1 bn from Kshs 159.0 bn in Q2’2023. The y/y narrowing of the current account was brought about by the 3.7% narrowing in Merchandise trade deficit to Kshs 341.2 bn in Q2’2024, from Kshs 354.3 bn in Q2’2023 driven by the 10.9% growth in merchandise exports to Kshs 276.2 bn, from Kshs 249.1 bn in Q2’2023 which outpaced the 2.3% increase in merchandise imports to Kshs 617.5 bn from Kshs 603.4 bn recorded in a similar period in 2023,
- The capital account balance (shows capital transfers receivable and payable between residents and non-residents, including the acquisition and disposal of non-produced non-financial items), which includes foreign direct investments (FDIs), increased by 64.4% to a surplus of Kshs 8.0 bn in Q2’2024 up from a surplus of Kshs 4.9 bn in Q2’2023,
- The financial account balance (the difference between the foreign assets purchased by domestic buyers and the domestic assets purchased by foreign buyers) recorded a surplus of Kshs 198.3 bn in Q2’2024, a decrease of 40.0% from the surplus of Kshs 330.7 bn recorded in Q2’2023. During the review period, the government did not receive credit and loans from the International Monetary Fund (IMF),
- Consequently, the Balance of Payments (BoP) position deteriorated to a surplus of Kshs 84.1 bn in Q2’2024, from a surplus of Kshs 152.9 bn recorded in Q2’2023.
Current Account Balance
Kenya’s current account deficit narrowed by 34.5% to Kshs 104.1 bn in Q2’2024 from the Kshs 159.0 bn deficit recorded in Q2’2023. The y/y contraction registered was driven by:
- The narrowing of the merchandise trade account deficit (the value of import goods exceeds the value of export goods, resulting in a negative net foreign investment) by 3.7% to Kshs 341.2 bn in Q2’2024, from Kshs 354.3 bn recorded in Q2’2023,
- A 59.1% improvement in the secondary trade balance to a surplus of Kshs 43.6 bn from a surplus of Kshs 27.4 bn in Q2’2023, and,
- The narrowing of the primary income deficit (the earnings that residents of a country receive from their investments abroad and the compensation they receive for providing labor to foreign entities) by 34.6% to Kshs 45.6 bn in Q2’2024, from Kshs 69.8 bn recorded in Q2’2023.
The table below shows the breakdown of the various current account components on a year-on-year basis, comparing Q2’2024 and Q2’2023:
|
Cytonn Report: Current Account Balance |
|||
|
Item |
Q2’2023 |
Q2’2024 |
Y/Y % Change |
|
Merchandise Trade Balance |
(354.3) |
(341.2) |
3.7% |
|
Services Trade Balance |
27.4 |
43.6 |
59.1% |
|
Primary Income Balance |
(69.8) |
(45.6) |
34.6% |
|
Secondary Income (transfer) Balance |
237.7 |
239.2 |
0.6% |
|
Current Account Balance |
(159.0) |
(104.1) |
34.5% |
All values in Kshs bns
Kenya's balance of payments deteriorated in Q2’2024, mainly on the back of a 40.0% decline in the financial account to a surplus of Kshs 198.3 bn in Q2’2024, from a surplus of Kshs 330.7 bn in Q2’2023 reflecting significant outflows of financing from the country. This follows the depletion of reserve assets by Kshs 33.2 bn, and the government did not receive credit and loans from the International Monetary Fund (IMF) during the period under review. The current account deficit (value of goods and services imported exceeds the value of those exported) narrowed by 34.5% to Kshs 104.1 bn from Kshs 159.0 bn in Q2’2023. The y/y narrowing of the current account was brought about by the 3.7% narrowing in Merchandise trade deficit to Kshs 341.2 bn in Q2’2024, from Kshs 354.3 bn in Q2’2023 driven by the 10.9% growth in merchandise exports to Kshs 276.2 bn, from Kshs 249.1 bn in Q2’2023 which outpaced the 2.3% increase in merchandise imports to Kshs 617.5 bn from Kshs 603.4 bn recorded in a similar period in 2023. Additionally, the secondary income balance saw a marginal increase, bolstered by strong growth in diaspora remittances. Looking ahead, the outlook for Kenya's current account is optimistic, as continued growth in key export sectors and sustained diaspora remittances are expected to further improve the current account balance. Efforts to diversify exports and enhance value addition in agricultural products, along with prudent fiscal and monetary policies, will be crucial in sustaining this positive trajectory. Furthermore, the ongoing strengthening of the Kenyan Shilling against most trading currencies is expected to lower the import bill hence narrowing the current account deficit. We expect that the current administration’s focus on fiscal consolidation will improve the balance of payments performance by minimizing the costs of servicing external debts. Additionally, the favorable weather conditions and government intervention through subsidy programs are set to boost agricultural production in the country, thereby increasing the export of agricultural products, and supporting the current account. We anticipate that the balance of payments will continue being stable with the help of multiple trade agreements, such as the one between Kenya and the EU and the one among the EAC, SADC, and COMESA, as the agreements will boost the amount and variety of exports that are needed and offer more opportunities to sell them.
- Stanbic Bank’s September 2024 Purchasing Manager’s Index (PMI)
During the week, Stanbic Bank released its monthly Purchasing Manager's Index (PMI) highlighting that the index for the month of September 2024 declined, coming in at 49.7, down from 50.6 in August 2024, signaling a deterioration in business conditions. This is attributable to the slowdown in business activity and reduced intake of new business intakes, owing to challenging economic conditions.
The businesses surveyed saw a small decline in their activity by the end of the quarter, which matched a drop in new orders. This business activity reduction was attributed to reduced cashflows for the various firms which led to them taking less work. The pace of contraction was, however, marginal, with most respondents continuing to see improved sales and higher customer turnout.
The service sector also recorded reduced activity, majorly on the back of contraction in activity in agriculture, wholesale, and retail segments. Manufacturing and construction firms, however, registered higher sales. Input prices rose, albeit at a modest pace, supported by a slight reduction in average lead times. The modest rise in input prices was mainly attributable to the stable but elevated fuel prices, with the prices for the maximum allowed price for Super Petrol and Diesel remaining unchanged from the prices announced for August 2024, while the maximum price allowed for Kerosene decreased by Kshs 3.4 per litre. Consequently, Super Petrol and Diesel retailed at Kshs 188.8 and Kshs 171.6 per litre respectively, while Kerosene retailed at Kshs 158.3 per litre in September. However, overall inflationary pressures were relatively mild compared to historical trends. Notably, the y/y inflation in September 2024 declined by 0.8% points to 3.6%, from the 4.4% recorded in August 2024. This led to the weakest uptick in total business expenses in the current four-month inflation sequence.
In September, Kenyan businesses reported expansion in their purchasing activity for the second month running, with respondents attributing this to the storing up of stocks amid hopes that sales would strengthen. This is attributable to the continued rise in activity following the conclusion of political demonstrations, which has enabled businesses to resume operations and fulfill new orders.
Employment levels remained stable in September, as businesses found little need to hire new staff or replace those who left voluntarily. This was largely due to reduced capacity pressures, with survey data showing minimal changes in the amount of unfinished business after a period of accumulation. This is after the decline in employment numbers in August 2024.
Additionally, confidence in future activity levels declined even further in September. In fact, optimism reached its lowest point since the series began in 2024, with just 4.0% of respondents anticipating growth over the next 12 months. The chart below summarizes the evolution of PMI over the last 24 months:
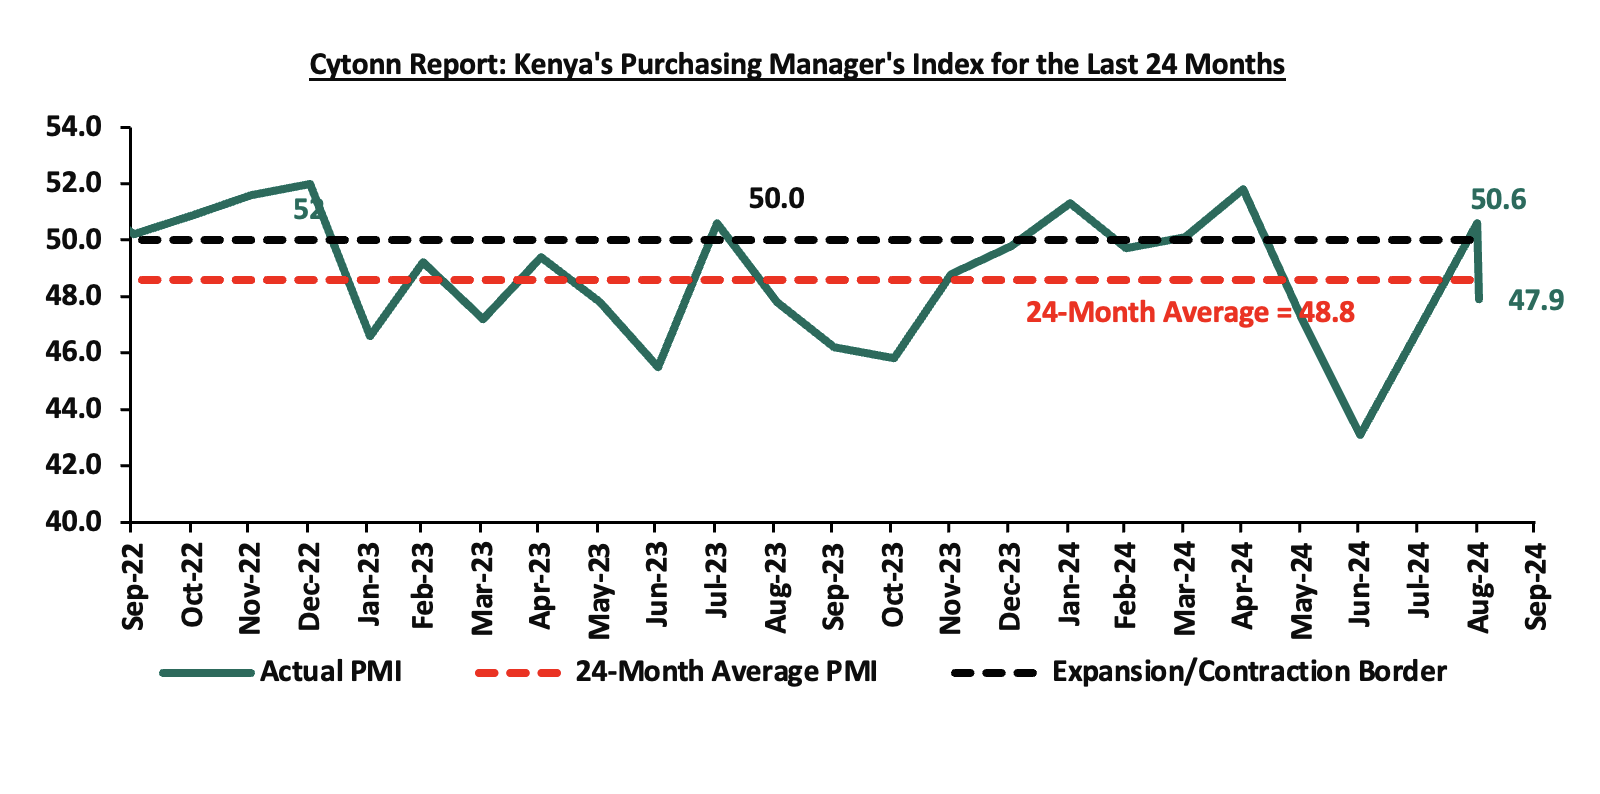
Going forward, we anticipate that the business environment will improve in the short to medium term as a result of the improving economic environment driven by lower interest rates following the easing monetary policy, the stability of the Kenyan Shilling against the USD, and the easing inflation, which is currently at its lowest in years. However, we expect businesses to be weighed down by the high cost of living coupled with the high taxation, which is set to increase input costs.
Q3’2024 Highlights:
- During the quarter, the global ratings agency, Fitch Ratings announced its revision of Kenya’s credit score, downgrading it to B- from a credit rating of B while also revising the outlook to stable, from a negative outlook affirmed on 16th February 2024. Their decision comes on the back of the government's decision to forgo proposed tax increases through the Finance Bill 2024 and rely on expenditure cuts, significantly impacting Kenya's fiscal trajectory and financing needs. The downgrade follows Moody’s downgrading Kenya’s IDR to Caa1 from a credit rating of B3 while maintaining a negative outlook on July 8th Please see our Cytonn Weekly 32/2024,
- During the quarter, Stanbic Bank released its monthly Purchasing Managers Index (PMI) highlighting that the index for the month of July 2024 sharply deteriorated, coming in at 43.1, below the 50.0 neutral for the second consecutive month, down from 47.2 in June 2024, signaling a deterioration in the operating conditions across Kenya. Please see our Cytonn Weekly 32/2024,
- During the quarter, the Monetary Policy Committee (MPC) met to review the outcome of its previous policy decisions against a backdrop of an improved global outlook for growth, easing in inflation in advanced economies as well as heightened geopolitical tensions. The MPC decided to lower the CBR rate by 25.0 bps to 12.75%, from 13.00% which was in line with our expectation for the MPC to lower the CBR rate. Please see our Cytonn Weekly 32/2024,
- During the quarter, The Energy and Petroleum Regulatory Authority (EPRA) released their monthly statement on the maximum retail fuel prices in Kenya, effective from 15th August 2024 to 14th September 2024. Notably, the maximum allowed price for Super Petrol, Diesel and Kerosene remained unchanged from the prices announced for the previous period. Consequently, Super Petrol, Diesel, and Kerosene will continue to retail at Kshs 188.8, Kshs 171.6, and Kshs 161.8 per litre respectively. Please see our Cytonn Weekly 33/2024,
- Additionally, during the quarter, the National Treasury gazetted the revenue and net expenditures for the first month of FY’2024/2025, ending 31st July 2024, highlighting that the total revenue collected as at the end of July 2024 amounted to Kshs 174.4 bn, equivalent to 6.6% of the revised estimates of Kshs 2,631.4 bn for FY’2024/2025 and is 79.5% of the prorated estimates of Kshs 219.3 bn. Please see our Cytonn Weekly 33/2024,
- Also, during the quarter, S&P Global Ratings announced its revision of Kenya’s long-term sovereign credit rating, downgrading it to B-, and a stable outlook from a credit rating of B and a negative outlook, on the back of the government's decision to forgo proposed tax increases through the Finance Bill 2024 and rely on expenditure cuts, significantly impacting Kenya's fiscal trajectory and financing needs. Please see our Cytonn Weekly 34/2024,
- During the quarter, the Kenya National Bureau of Statistics (KNBS) released the Q1’2024 Quarterly Gross Domestic Product Report, highlighting that the Kenyan economy recorded a 5.0% growth in Q1’2024, slower than the 5.5% growth recorded in Q1’2023. The main contributor to Kenyan GDP remains to be the Agriculture, Fishing, and Forestry sector which grew by 6.1% in Q1’2024, lower than the 6.4% expansion recorded in Q1’2023. All sectors in Q1’2024, except Mining and Quarrying, recorded positive growths, with varying magnitudes across activities. Most sectors recorded a decline compared to Q1’2023 with Accommodation and Food Services, Mining & Quarrying, and Construction Sectors recording the highest declines of 19.1%, 3.8%, and 2.9% points, respectively. Other sectors that recorded a contraction in growth rate, from what was recorded in Q1’2023 were the Transport and Storage, Other Services, and Public Administration sectors of 2.8%, 2.1%, and 1.8% points respectively. Please see our Cytonn Weekly 27/2024,
- During the quarter, the Kenya National Bureau of Statistics released the Q1’2024 Quarterly Balance of Payment & International Trade Report highlighting that Kenya’s balance of payments position improved by 126.4% in Q1’2024, coming in at a surplus of Kshs 33.8 bn, from a deficit of Kshs 127.8 bn in Q1’2024, and a significant improvement from the Kshs 134.8 bn deficit recorded in FY’2023. Please see our Cytonn Weekly 27/2024,
- During the quarter, Stanbic Bank released its monthly Purchasing Manager's Index (PMI) highlighting that the index for the month of June 2024 sharply deteriorated, coming in at 47.2, below the 50.0 neutral, down from 51.8 in May 2024, signaling a deterioration in the operating conditions across Kenya. Please see our Cytonn Weekly 27/2024,
- During the quarter, the global ratings agency, Moody’s announced its revision of Kenya’s credit score, downgrading it by one scale to Caa1 from a credit rating of B3 while maintaining a negative outlook, on the back of the government's decision to forgo proposed tax increases through the Finance Bill 2024 and rely on expenditure cuts, significantly impacting Kenya's fiscal trajectory and financing needs. Please see our Cytonn Weekly 28/2024,
- During the quarter, the Kenya Revenue Authority (KRA) released the annual revenue performance for FY’2023/24, highlighting that revenue mobilization for the period grew by a notable 11.1% up from 6.4% growth in the previous financial year, after KRA collected Kshs 2.4 tn compared to Kshs 2.2 tn in the previous financial year. This translates to a performance rate of 95.5% against the target. Please see our Cytonn Weekly 28/2024,
- During the quarter, the Central Bank of Kenya (CBK) released the annual bank supervision report for FY’2023, highlighting that the banking sector registered a decrease in profitability during the year, with profit before tax decreasing by 8.8% to Kshs 219.2 bn in 2023 from the Kshs 240.4 bn recorded in 2022. The sector’s capital and reserves increased by 6.8% to Kshs 980.2 bn in 2023, from Kshs 917.6 bn in 2022. The report also reviewed the various developments in the banking sector, including regulatory changes in the banking sector, macroeconomic conditions, and sector performance. Please see our Cytonn Weekly 29/2024,
- During the quarter, Cameroon announced the issuance of a USD 550.0 mn Eurobond with a tenor of 7 years at a coupon rate of 9.5% and a yield of 10.75%, becoming the fifth country in the Sub-Saharan Africa (SSA) region, following Ivory Coast, Benin, Senegal, and Kenya to tap into the international capital markets in 2024. The bond was undersubscribed, with the undersubscription rate coming in at 98.9%, receiving USD 550.0 mn (332.2 bn CFA Francs) of the CFA 336.0 bn offered The issuance was conducted through a private placement, with Citigroup Global Markets Ltd serving as the sole placement agent and arranger alongside Cygnum Capital Middle East. Please see our Cytonn Weekly 30/2024, and,
- During the quarter, the National Treasury presented the Supplementary Estimates I for the Fiscal Year 2024/25 to the National Assembly. This presentation outlined plans to adjust the FY 2024/25 Budget Estimates to align with the Revised Fiscal Framework and implement expenditure cuts. Please see our Supplementary Budget Estimates I FY’2024/25 Note,
- Also, during the quarter, the global ratings agency, Fitch Ratings announced its revision of Kenya’s credit score, downgrading it to B- from a credit rating of B while also revising the outlook to stable, from a negative outlook affirmed on 16th February 2024. Their decision comes on the back of the government's decision to forgo proposed tax increases through the Finance Bill 2024 and rely on expenditure cuts, significantly impacting Kenya's fiscal trajectory and financing needs. The downgrade follows Moody’s downgrading Kenya’s IDR to Caa1 from a credit rating of B3 while maintaining a negative outlook on July 8th Please see our Cytonn Weekly 30/2024.
Rates in the Fixed Income market have been on an upward trend given the continued high demand for cash by the government and the occasional liquidity tightness in the money market. The government is 112.7% ahead of its prorated net domestic borrowing target of Kshs 110.0 bn, having a net borrowing position of Kshs 233.8 bn. However, we expect a downward readjustment of the yield curve in the short and medium term, with the government looking to increase its external borrowing to maintain the fiscal surplus, hence alleviating pressure in the domestic market. As such, we expect the yield curve to normalize in the medium to long-term and hence investors are expected to shift towards the long-term papers to lock in the high returns.
Market Performance:
During the quarter, the equities market recorded a mixed performance with NSE 20, NSE 25, and NSE 10 gaining by 7.2%,1.3% and 0.7% respectively, while NASI declined by 2.2%, taking the YTD performance to gains of 23.4%, 21.4%, 17.7% and 16.4% for NSE 10, NSE 25, NSE 20 and NASI respectively. The equities market performance during the quarter was driven by gains recorded by large caps such as Bamburi, KCB Group, and Standard Chartered Bank of 40.6%, 11.0%, and 8.2%, respectively. The gains were however weighed down by losses recorded by Safaricom and BAT of 13.3%, and 2.9% respectively;
Equities turnover declined by 13.0% in Q3’2024 to USD 134.8 mn, from USD 119.3 mn in Q3’2023. Foreign investors remained net sellers in Q3’2024 with a net selling position of USD 4.6 mn, from a net selling position of USD 25.9 mn recorded in Q3’2023.
During the week, the equities market recorded a mixed performance, with NSE 10, NSE 25, and NASI gaining by 2.1%, 1.5%, and 1.1%, respectively, while NSE 20 declined by 0.3%, taking the YTD performance to gains of 26.0%, 23.5%, 17.8% and 17.5% for NSE 10, NSE 25, NASI, and NSE 20 respectively. The equities market performance was mainly driven by gains recorded by East African Breweries Limited (EABL), NCBA Group, and cooperative Bank of 5.3%, 3.6%, and 3.4% respectively. The gains were however weighed down by losses recorded by large-cap stocks such as Bamburi and Safaricom of 0.4%, and 0.3%, respectively.
During the week, equities turnover declined by 3.4% to USD 7.8 mn from USD 8.1 mn recorded the previous week, taking the YTD turnover to USD 490.3 mn. Foreign investors became remained net buyers, with a net buying position of USD 1.0 mn, from a net buying position of USD 1.2 mn recorded the previous week, taking the YTD net buying position to USD 3.2 mn.
The market is currently trading at a price to earnings ratio (P/E) of 5.3x, 55.1% below the historical average of 11.8x, and a dividend yield of 7.0%, 2.4% points above the historical average of 4.6%. Key to note, NASI’s PEG ratio currently stands at 0.7x, an indication that the market is undervalued relative to its future growth. A PEG ratio greater than 1.0x indicates the market may be overvalued while a PEG ratio less than 1.0x indicates that the market is undervalued.
The charts below indicate the historical P/E and dividend yields of the market;
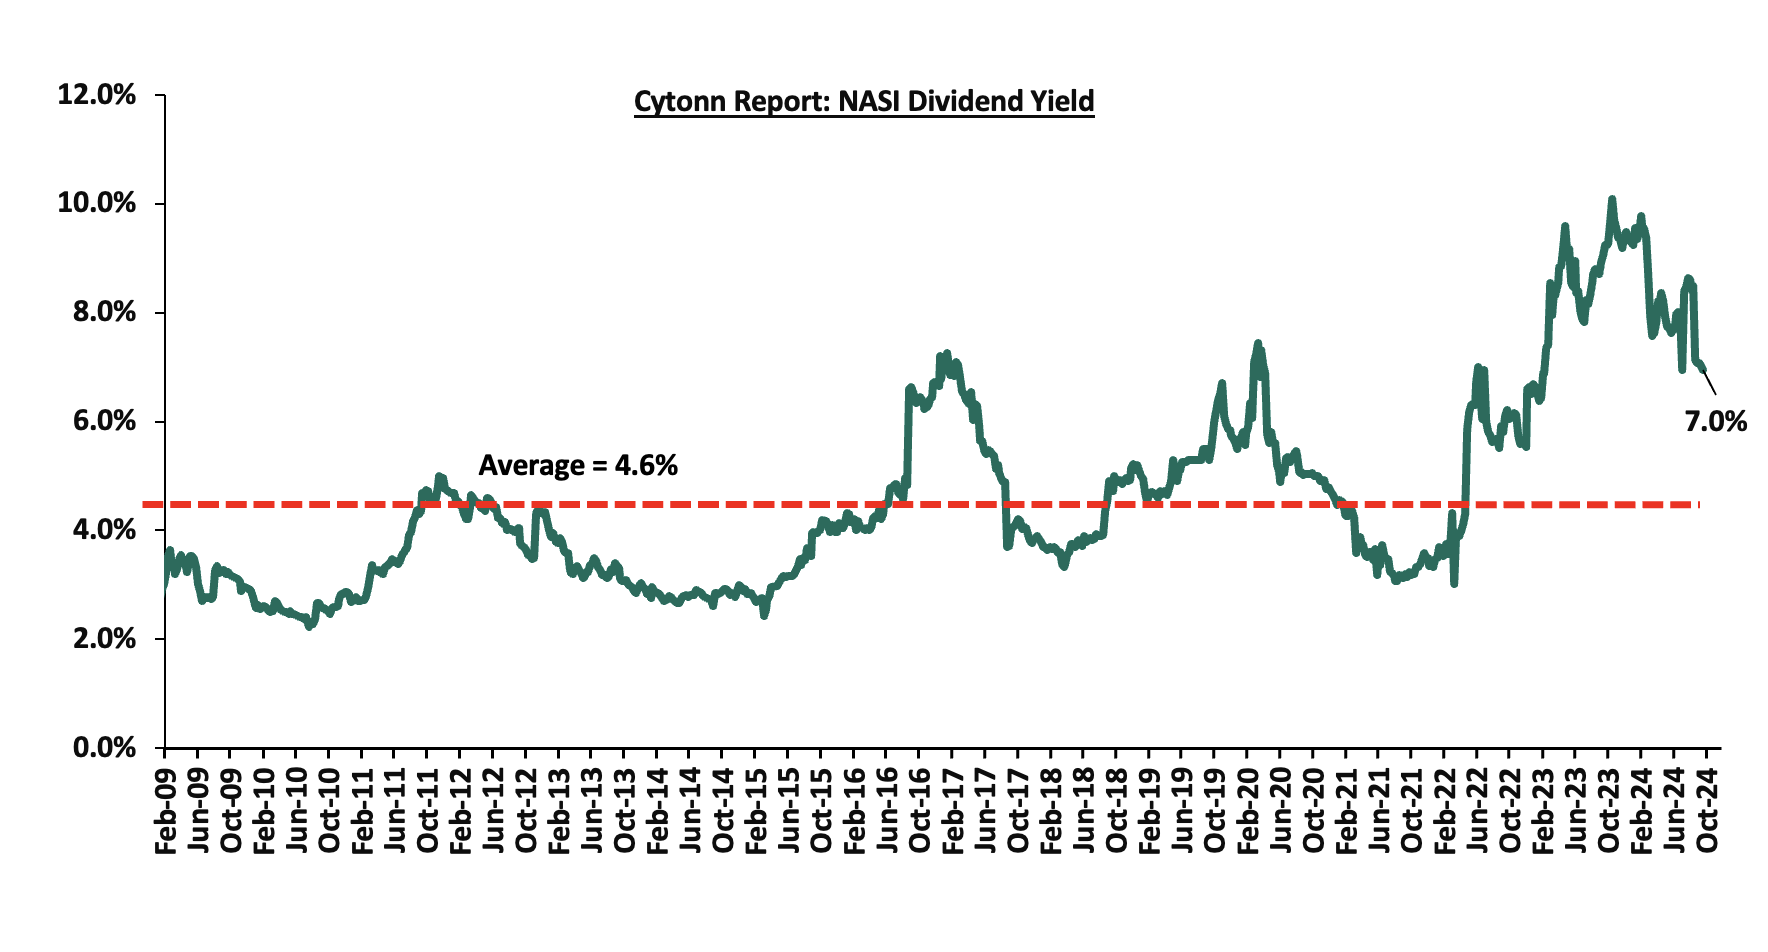
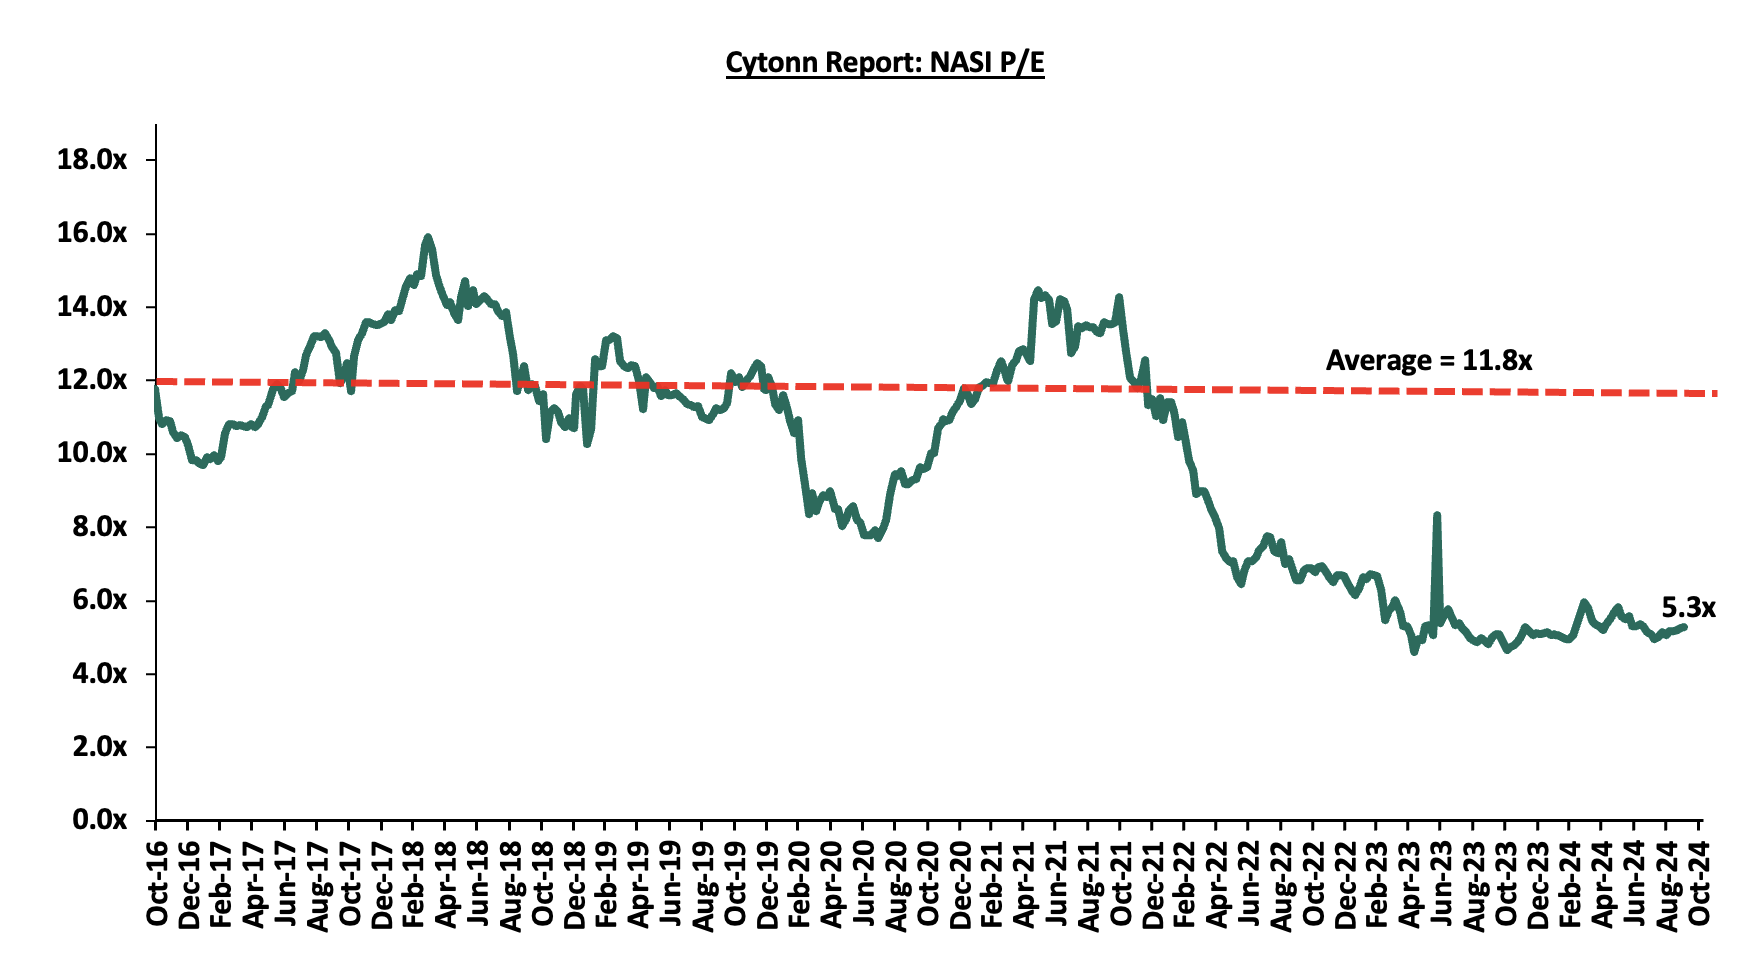
Listed Banks’ FY’2023 and Q2’2024 Performance
During the third quarter of 2024, the listed banking sector released their H1’2024 results, recording y/y earnings growth of 14.3% in their core EPS in H1’2024. The performance in H1’2024 was supported by a 17.6% growth in net interest income coupled with a 13.6% growth in non-funded income. For more information, please see our H1’2024 Banking Sector Reports.
Key Q3’2024 Highlights:
During Q3’2024;
- During the quarter, Amsons Industries (K) Limited announced its intention to acquire 100% of the ordinary shares of Bamburi Cement Plc with a par value of Kshs 5.0 each for a cash consideration. The offer placed is of a total value of Kshs 23.6 bn, translating to a purchase price of Kshs 65.0 per share. This offer has been made in accordance with the Capital Markets (Takeovers & Mergers) Regulations, 2002. This acquisition, if successful, will make Amsons Industries (K) Limited the sole owner of Bamburi Cement Plc. For more information, please see our Cytonn Weekly #28/2024 ,
- British American Tobacco Kenya Plc released their H1’2024 financial results, recording a 24.3% decline in Profits after Tax (PAT) to Kshs 2.1 bn, from Kshs 2.8 bn recorded in H1’2023. The decline in PAT was majorly attributed to the 6.5% decrease in Gross Sales to Kshs 19.6 bn in H1’2024 from Kshs 21.0 bn recorded in H1’2023. For more details, please see our Cytonn Weekly #30/2024 ,
- During the quarter, I&M Group Holdings released their H1’2024 financial results, recording a 21.1% increase in Profit After Tax (PAT) to Kshs 6.1 bn, from Kshs 5.0 bn in H1’2023. The performance was mainly driven by a 35.2% increase in Net Interest Income to Kshs 16.5 bn, from Kshs 12.2 bn in H1’2023, but was weighed down by a 10.9% decrease in Non-Interest Income to Kshs 6.2 bn from Kshs 6.9 bn recorded over a similar period in 2023, taking the Total Operating Income to Kshs 22.7 bn, from Kshs 19.1 bn in H1’2023. For more information, please see our Cytonn Weekly #34/2024,
- Standard Chartered Bank of Kenya released H1’2024 financial results, noting a 48.9% increase in Profit After Tax (PAT) to Kshs 10.3 bn, from Kshs 6.9 bn in H1’2023. The performance was mainly driven by a 24.9% increase in Total Operating Income to Kshs 26.1 bn, from Kshs 20.9 bn in H1’2023, attributable to the 36.1% increase in Net Non-Interest Income to Kshs 9.6 bn from Kshs 7.0 bn recorded in H1’2023. For more information, please see our Cytonn Weekly #34/2024,
- NCBA Bank released their H1’2024 Financial results, recording a 5.0% in Profit After Tax (PAT) to Kshs 9.8 bn, from Kshs 9.3 bn recorded in H1’2023. The performance was mainly driven by a 7.9% increase in Net non-Interest Income to Kshs 14.9 bn in H1’2024, from Kshs 13.8 bn recorded in H1’2023, but was weighed down by a 4.4% decrease in Net Interest Income to Kshs 16.5 bn from Kshs 17.2 bn recorded in H1’2023. For more information, please see our Cytonn Weekly #34/2024,
- KCB Group announced their H1’2024 financial results, recording an 86.4% increase in Profit After Tax (PAT) to Kshs 29.9 bn, from Kshs 16.1 bn in H1’2023. The performance was mainly driven by a 34.8% increase in net interest income to Kshs 61.3 bn in H1’2024, from Kshs 45.5 bn in H1’2023, coupled with a 20.8% increase in net non-interest income to Kshs 33.3 bn from Kshs 27.6 bn in H1’2023. For more information, please see our Cytonn Weekly #34/2024,
- HF Group released their H1’2024 financial results, recording a 46.3% increase in Profit After Tax (PAT) to Kshs 0.3 bn, from Kshs 0.2 bn recorded in H1’2023. The performance was mainly driven by a 12.5% increase in Total Operating income to Kshs 2.0 bn in H1’2024, from Kshs 1.8 bn in H1’2023 which outpaced the 8.9% increase in Total Operating expenses to Kshs 1.8 bn, from Kshs 1.6 bn in H1’2023. For more information, please see our Cytonn Weekly #34/2024,
- Liberty Kenya Holdings released their H1’2024 results, having fully implemented the new IFRS 17 reporting system. Liberty Kenya Holdings’ Profit After Tax (PAT) increased by 196.7% to Kshs 0.6 bn, from Kshs 0.2 bn recorded in H1’2023, mainly driven by an 851.9% increase in Net insurance income to Kshs 0.5 bn, from Kshs 0.1 bn in H1’2023, and further supported by a 39.2% increase in Net investment income to Kshs 1.0 bn, from Kshs 0.7 bn in H1’2023. For more information, please see our Cytonn Weekly #34/2024,
- CIC Group released their H1’2024 results. CIC’s Profit After Tax (PAT) increased marginally by 0.6% to remain relatively flat at the Kshs 0.7 bn, recorded in H1’2023. The performance was mainly driven by a 35.7% increase in Net investment income to Kshs 1.8 bn in H1’2024, from Kshs 1.3 bn in H1’2023, and further supported by a 21.4% increase in Net income from insurance service to Kshs 1.0 bn, from Kshs 0.9 bn in H1’2023. However, the performance was weighed down by the 61.5% increase in net expenses from reinsurance contracts to Kshs 1.4 bn, from Kshs 0.9 bn in H1’2024. For more information, please see our Cytonn Weekly #34/2024,
- Equity Group released its H1’2024 financial results, with its Core Earnings per Share (EPS) increasing by 12.5% to Kshs 7.8 from Kshs 7.0 in H1’2024, mainly driven by the 17.2% growth in total operating income to Kshs 97.1 bn, from Kshs 82.9 bn in H1’2023. Cooperative Bank of Kenya released its H1’2024 financial results, with its Core Earnings per Share (EPS) increasing by7.0% to Kshs 2.2, from Kshs 2.1 in H1’2023, driven by the 10.9% increase in total operating income to Kshs 39.2 bn, from Kshs 35.4 bn in H1’2023. For more information, please see our Cytonn Weekly #33/2024,
- Sanlam Kenya Holdings released their H1’2024 results, recording a significant 264.1% increase in Profit After Tax to Kshs 0.3 bn, from the Kshs 0.2 bn loss recorded in H1’2023. The performance was mainly driven by a significant 316.9% increase in insurance investment revenue to Kshs 2.3 bn, from Kshs 0.6 bn in H1’2023, and supported by a 57.5% decrease in Net expenses from reinsurance contracts held to Kshs 0.1 bn in H1’2024, from Kshs 0.5 bn in H1’2023. For more information, please see our Cytonn Weekly #33/2024 ,and,
- Stanbic Holdings PLC released their H1’2024 Financial Results for the period ending 30th June 2024, recording a 2.3% increase in Profit After Tax (PAT) to Kshs 7.2 bn, from Kshs 7.1 bn recorded in H1’2023. The performance was mainly driven by a 4.2% increase in Net-Interest Income to Kshs 12.6 bn in H1’2024, from Kshs 12.1 bn recorded in H1’2023, but was weighed down by a 15.1% decrease in Non-Interest Income to Kshs 7.6 bn from Kshs 8.9 bn recorded in H1’2023. For more information, please see our Cytonn Weekly #33/2024.
Universe of Coverage:
|
Cytonn Report: Equities Universe of Coverage |
|||||||||||
|
Company |
Price as at 27/09/2024 |
Price as at 04/10/2024 |
w/w change |
m/m change |
q/q change |
YTD Change |
Target Price* |
Dividend Yield |
Upside/ Downside** |
P/TBv Multiple |
Recommendation |
|
Jubilee Holdings |
172.0 |
163.0 |
(5.2%) |
6.7% |
3.2% |
(11.9%) |
260.7 |
8.3% |
68.2% |
0.3x |
Buy |
|
Equity Group |
43.5 |
44.5 |
2.4% |
6.8% |
(7.1%) |
30.1% |
60.2 |
9.2% |
44.5% |
0.9x |
Buy |
|
Diamond Trust Bank |
49.3 |
49.5 |
0.5% |
8.7% |
(3.5%) |
10.6% |
65.2 |
10.2% |
41.9% |
0.2x |
Buy |
|
CIC Group |
2.1 |
2.1 |
(1.0%) |
1.5% |
12.6% |
(9.6%) |
2.8 |
6.2% |
41.5% |
0.7x |
Buy |
|
Co-op Bank |
13.3 |
13.7 |
3.4% |
(1.5%) |
(3.3%) |
20.7% |
17.2 |
11.3% |
36.9% |
0.6x |
Buy |
|
NCBA |
42.6 |
44.2 |
3.6% |
(0.8%) |
(2.6%) |
13.6% |
55.2 |
11.2% |
36.2% |
0.8x |
Buy |
|
Stanbic Holdings |
118.5 |
118.5 |
0.0% |
(2.1%) |
3.6% |
11.8% |
145.3 |
13.0% |
35.6% |
0.8x |
Buy |
|
ABSA Bank |
14.1 |
14.2 |
0.4% |
(1.7%) |
1.3% |
22.5% |
17.3 |
11.0% |
33.3% |
1.1x |
Buy |
|
KCB Group |
35.0 |
35.2 |
0.6% |
9.3% |
(28.8%) |
60.4% |
46.7 |
0.0% |
32.5% |
0.5x |
Buy |
|
Standard Chartered Bank |
206.3 |
211.3 |
2.4% |
4.4% |
8.9% |
31.8% |
235.2 |
13.7% |
25.1% |
1.4x |
Buy |
|
Britam |
6.0 |
6.0 |
0.3% |
8.0% |
(0.6%) |
17.1% |
7.5 |
0.0% |
24.6% |
0.8x |
Buy |
|
I&M Group |
23.6 |
23.5 |
(0.6%) |
6.6% |
(0.3%) |
34.4% |
26.5 |
10.8% |
23.8% |
0.5x |
Buy |
|
*Target Price as per Cytonn Analyst estimates **Upside/ (Downside) is adjusted for Dividend Yield *** Dividend Yield is calculated using FY’2023 Dividends |
|||||||||||
We are “Neutral” on the Equities markets in the short term due to the current tough operating environment and huge foreign investor outflows, and, “Bullish” in the long term due to current cheap valuations and expected global and local economic recovery. With the market currently being undervalued for its future growth (PEG Ratio at 0.7x), we believe that investors should reposition towards value stocks with strong earnings growth and that are trading at discounts to their intrinsic value. We expect the current foreign investors’ sell-offs to continue weighing down the equities outlook in the short term.
In Q3’2024, Kenya’s Real Estate sector recorded notable growth in terms of activity compared to the similar period in 2023, attributable to various factors. Some of the key factors that have continued to shape the performance of the Real Estate sector include;
- The government's ongoing focus on the Affordable Housing Program has been a major driver of growth. By incentivizing public-private partnerships and allocating resources for large-scale housing projects, the program has stimulated both residential construction and infrastructure development Currently, the AHP pipeline boasts an estimated total of 746,795 housing units under construction by both government and the private sector,
- Continuous improvements in infrastructure, such as new roads, bridges, and utilities, have opened up previously inaccessible areas for real estate development. This has led to increased property value and demand in urban and peri-urban areas. The government has continually prioritized infrastructural development in efforts aimed at positioning the country as a regional hub through the implementation of several key projects including, Makupa Bridge, Nairobi Expressway, and Nairobi Western and Eastern Bypasses among others. Notable projects delivered in 2024 include phase two of the Dongo Kundu bypass project,
- Kenya Mortgage Refinance Company (KMRC) has continued to drive the availability and affordability of home loans to Kenyans by providing single-digit fixed rate, and long-term finance to Primary Mortgage Lenders (PMLs) such as banks and SACCOs. Recently, KMRC, broadened its refinancing services to include non-shareholders, such as SACCOs and microfinance institutions. This is a strategic move to improve access to affordable mortgages, particularly for low and middle-income earners, a key target of Kenya's affordable housing agenda,
- The retail landscape has seen a surge in growth, with both domestic and international retailers like Naivas, QuickMart, China Square, and Carrefour aggressively expanding their market presence. These retailers are capitalizing on the opportunities created by the exit of distressed chains like Choppies, Nakumatt, Tuskys, and Uchumi. Furthermore, the influx of global brands such as Adidas, Puma, Aldo, and Michael Kors is poised to further fuel the sector's growth and development,
- Kenya continues to enjoy recognition as a regional business hub. As a result, foreign entities have continued to open business operations in Kenya, boosting the demand for both commercial and residential Real Estate. Increased business activity has driven up demand for office space, apartments, and housing near business hubs, leading to the development of new projects, increased property values, and job creation in the construction sector,
- With relatively high urbanization and population growth rates of 3.7% p.a and 2.0% p.a, respectively, against the global average of 1.7% p.a and 0.9% p.a, respectively, as at 2023, there is a sustained demand for more housing units in the country, and Real Estate in general,
- Increase in investor confidence has greatly influenced the hospitality sector and this is evident through mergers, acquisitions and expansions of hotels. Furthermore, the number of international arrivals into the country registered a 13.0% year-to-year (y/y) increase to 149,922 persons as of June 2024 from 132,297 arrivals recorded in June 2023. Notably, the Hotel Chain Development Pipelines in Africa 2024 Report ranked Nairobi at 7th position by planned number of hotels and rooms with 31 hotels and 4,268 rooms in the pipeline, and,
- There has been an increased popularity of purpose-built properties to host Student housing, medical centers, diplomatic residentials, and data centers which offer the potential for growth to the Real Estate sector through alternative markets. Due to these asset classes, the industry remains resilient despite the rapidly changing technological and economic environments
However, some of the challenges impeding the performance of the sector include;
- Rising Construction costs increased by 17.6% in H1’2024 to an average of Kshs 83,731 per SQM from an average of Kshs 71,200 per SQM recorded in 2023. The rise is primarily due to the hike in prices of key construction materials such as cement, steel, paint, aluminum, and PVC on the back of rising inflation. These higher costs are expected to impede development activities in the sector,
- Existing oversupply of physical space in select sectors. With approximately 5.8 mn SQFT in the NMA commercial office market, approximately 3.0 mn SQFT in the Nairobi Metropolitan Area (NMA) retail market, with the rest of the Kenyan retail market having an oversupply of approximately 1.7 mn SQFT. This has led to prolonged vacancy rates in the respective Real Estate sectoral themes,
- The REITs market in Kenya continues to be subdued owing to various challenges such as the large capital requirements of Kshs 100.0 mn for trustees compared to Kshs 10.0 mn for pension funds Trustees which limits the role of banks, prolonged approval process for REITs, only a few legal entities capable of incorporating REITs, high minimum subscription amounts or offer parcels set at Kshs 0.1 mn for D-REITs and 5.0 mn for restricted I-REITs and lack of adequate knowledge of the financial asset class by investors,
- Constrained financing to developers as credit financiers continue to tighten their lending requirements and demand more collateral from developers as a result of the high credit risk in the real estate sector. This is evidenced by an increase in Gross non-performing loans in the building and construction sector which increased by 18.0% on a y/y to Kshs 43.8 bn in Q1’2024 from Kshs 35.9 bn in Q1’2023,
- Underdeveloped capital markets compound difficulties for developers in realizing pools of capital focused on projects, particularly in the private markets, to supplement government efforts in providing housing. Banks in Kenya are the primary source of funding for real estate developers, providing nearly 95.0% of funding as opposed to 40.0% in developed countries. This means that capital markets contribute only 5.0% of Real Estate development funding, compared to 60.0% in developed countries as shown below;
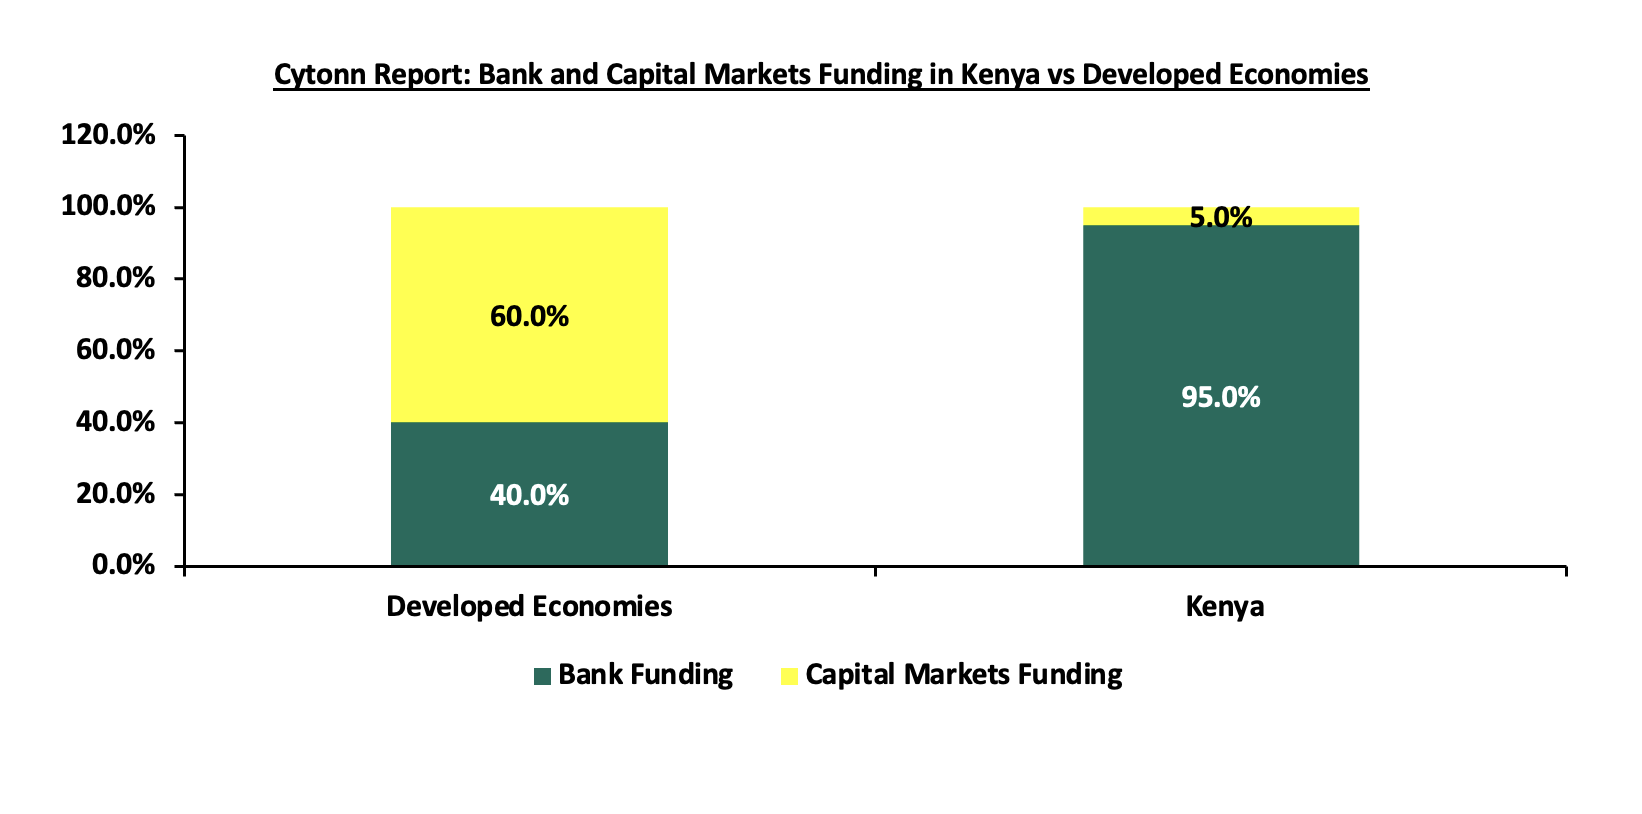
Source: World Bank, Capital Markets Authority (CMA)
Sectoral Market Performance:
- Residential Sector
During Q3’2024, the NMA residential sector recorded a slight improvement in performance, with the average total returns coming in at 6.1%, a 0.1%-point increase from 6.0% recorded in Q3’2023. The performance is primarily attributable to an increase in the residential market average y/y rental yield which came in at 5.4% in Q3’2024, a 0.1% increase from 5.3% recorded in Q3’2023. The table below shows the NMA residential sector’s performance during Q3’2024 and Q3’2023;
|
(All values in Kshs unless stated otherwise) |
|||||||||||||
|
Cytonn Report: Nairobi Metropolitan Area (NMA) Residential Sector Summary - Q3’2024/Q3’2023 |
|||||||||||||
|
Segment |
Average of Price per SQM Q3'2024 |
Average of Rent per SQM Q3'2024 |
Average of Rental Yield Q3'2024 |
Average of Price Appreciation Q3'2024 |
Average of Total Returns Q3'2024 |
Average of Rental Yield Q3'2023 |
Average of Price Appreciation Q3'2023 |
Average of Total Returns Q3'2023 |
y/y change in Rental Yield (% Points) |
y/y change in Price Appreciation (% Points) |
y/y change in Total Returns (% Points) |
||
|
Detached Units |
|||||||||||||
|
High End |
197,784 |
818 |
4.8% |
0.6% |
5.5% |
5.1% |
0.7% |
5.8% |
(0.3%) |
(0.1%) |
(0.3%) |
||
|
Upper Middle |
140,007 |
603 |
4.9% |
0.7% |
5.6% |
4.6% |
1.0% |
5.5% |
0.3% |
(0.3%) |
0.1% |
||
|
Lower Middle |
75,858 |
377 |
5.2% |
0.9% |
6.1% |
5.0% |
1.0% |
6.0% |
0.2% |
0.1% |
0.1% |
||
|
Detached Units Average |
137,883 |
599 |
5.0% |
0.7% |
5.7% |
4.9% |
0.9% |
5.8% |
0.1% |
(0.2%) |
(0.1%) |
||
|
Apartments |
|||||||||||||
|
Upper Mid-End |
122,497 |
663 |
5.9% |
0.7% |
6.6% |
5.5% |
0.3% |
5.8% |
0.4% |
0.4% |
0.8% |
||
|
Lower Mid-End Suburbs |
88,707 |
479 |
5.4% |
0.8% |
6.2% |
5.8% |
0.6% |
6.4% |
(0.4%) |
0.2% |
(0.2%) |
||
|
Lower Mid-End Satellite Towns |
76,300 |
421 |
6.1% |
0.6% |
6.7% |
5.6% |
0.9% |
6.5% |
0.5% |
(0.3%) |
0.2% |
||
|
Apartments Average |
95,835 |
521 |
5.8% |
0.7% |
6.5% |
5.6% |
0.6% |
6.2% |
0.2% |
0.1% |
0.3% |
||
|
Residential Market Average |
116,859 |
560 |
5.4% |
0.7% |
6.1% |
5.3% |
0.8% |
6.0% |
0.1% |
(0.1%) |
0.1% |
||
- Detached Units Performance
The table below shows the NMA residential sector detached units’ performance during Q3’2024;
|
All values are in Kshs unless stated otherwise |
||||||||
|
Cytonn Report: Residential Detached Units Summary Q3'2024 |
||||||||
|
Area |
Average of Price per SQM Q3'2024 |
Average of Rent per SQM Q3'2024 |
Average of Occupancy Q3'2024 |
Average of Uptake Q3'2024 |
Average of Annual Uptake Q3'2024 |
Average of Rental Yield Q3'2024 |
Average of Price Appreciation Q3'2024 |
Total Returns |
|
High End |
||||||||
|
Kitisuru |
229,486 |
815 |
91.3% |
95.0% |
10.5% |
4.3% |
1.2% |
5.4% |
|
Runda |
237,068 |
1,073 |
90.0% |
90.0% |
8.4% |
5.0% |
0.8% |
5.7% |
|
Karen |
187,272 |
755 |
92.0% |
93.7% |
11.6% |
4.6% |
0.7% |
5.3% |
|
Rosslyn |
195,018 |
903 |
92.9% |
98.2% |
11.2% |
5.5% |
0.4% |
6.0% |
|
Lower Kabete |
140,076 |
544 |
92.9% |
91.4% |
9.1% |
4.7% |
0.2% |
4.8% |
|
Average |
197,784 |
818 |
91.8% |
93.7% |
10.2% |
4.8% |
0.6% |
5.5% |
|
Upper Middle |
||||||||
|
Ridgeways |
168,283 |
655 |
87.5% |
88.3% |
8.3% |
4.5% |
1.2% |
5.8% |
|
Loresho |
136,975 |
613 |
90.6% |
90.6% |
8.6% |
5.2% |
1.1% |
6.3% |
|
Langata |
113,737 |
423 |
91.1% |
87.1% |
7.6% |
4.1% |
1.0% |
5.0% |
|
Lavington |
190,105 |
623 |
91.2% |
93.1% |
9.8% |
3.8% |
0.8% |
4.6% |
|
Runda Mumwe |
163,300 |
702 |
91.1% |
96.2% |
13.6% |
5.0% |
0.7% |
5.7% |
|
Redhill & Sigona |
93,628 |
451 |
91.3% |
97.0% |
10.8% |
5.7% |
0.7% |
6.4% |
|
South B/C |
114,018 |
756 |
86.9% |
86.3% |
10.6% |
5.8% |
(0.3%) |
5.5% |
|
Average |
140,007 |
603 |
89.9% |
91.2% |
9.9% |
4.9% |
0.7% |
5.6% |
|
Lower Middle |
||||||||
|
Ngong |
60,617 |
692 |
94.4% |
93.5% |
7.3% |
4.8% |
1.7% |
6.5% |
|
Athi River |
85,946 |
429 |
88.6% |
93.8% |
9.8% |
5.3% |
1.5% |
6.8% |
|
Juja |
71,596 |
255 |
89.0% |
92.3% |
8.1% |
4.3% |
1.3% |
5.6% |
|
Syokimau/Mlolongo |
75,678 |
324 |
89.0% |
91.9% |
11.2% |
4.6% |
0.8% |
5.4% |
|
Thika |
63,318 |
323 |
83.2% |
87.8% |
11.6% |
5.9% |
0.6% |
6.5% |
|
Kitengela |
65,698 |
295 |
91.1% |
90.4% |
10.7% |
4.9% |
0.5% |
5.4% |
|
Rongai |
90,342 |
326 |
96.9% |
94.4% |
11.4% |
5.7% |
0.4% |
6.1% |
|
Donholm & Komarock |
93,671 |
369 |
87.5% |
88.1% |
9.9% |
6.1% |
0.3% |
6.4% |
|
Average |
75,858 |
377 |
90.0% |
91.5% |
10.0% |
5.2% |
0.9% |
6.1% |
|
Detached Grand Average |
137,883 |
599 |
90.6% |
92.1% |
10.0% |
5.0% |
0.7% |
5.7% |
Source: Cytonn Research
The Key take-outs from the table include;
- Average Total Returns –The average total return came in at 5.7%, translating to a 0.1% decrease from 5.8% recorded in Q3’2023. However, rental yields came in at 5.0%, representing a 0.1%-point decrease from the 4.9% recorded in Q3’2023. The decrease in performance is attributable to a slight decrease in selling prices per SQM at Kshs 137,883, from 137,991 respectively recorded in Q3’2023,
- Segment Performance - The best-performing segment was the lower middle segment with an average total return of 6.1% attributable to relatively high rental yields of 5.2% which is driven by returns from well-performing nodes such as Athi River, Thika, and Ngong which posted relatively high returns at 6.8%, 6.5%, and 6.5% respectively, and,
- Nodal Performance – Overall, Athi River, Ngong, and Thika were the best-performing nodes offering an average total return of 6.8%, 6.5%, and 6.5% which is higher than the detached market average of 5.7%, driven by a relatively higher price appreciation of 1.5%, 1.7%, and 0.6% respectively. Ngong is witnessing major development supported by its close proximity to the CBD and enhanced connectivity via Ngong Road. Athi River and Thika are experiencing high housing demand due to accessibility to CBD through the Nairobi Expressway and Thika Superhighway respectively. Additionally, the areas continue to offer relatively affordable housing options with average rent per SQM of Kshs 429 and Kshs 323 compared to the market average of Kshs 599.
- Apartments Performance
The table below shows the NMA residential sector apartments’ performance during Q3’2024;
|
All values are in Kshs unless stated otherwise |
||||||||
|
Cytonn Report: Residential Apartments Summary Q3'2024 |
||||||||
|
Area |
Average of Price per SQM Q3'2024 |
Average of Rent per SQM Q3'2024 |
Average of Occupancy Q3'2024 |
Average of Uptake Q3'2024 |
Average of Annual Uptake Q3'2024 |
Average of Rental Yield Q3'2024 |
Average of Price Appreciation FY'2023 |
Total Returns |
|
Upper Mid-End |
||||||||
|
Kilimani |
111,699 |
702 |
92.8% |
91.5% |
14.7% |
6.4% |
1.2% |
7.5% |
|
Parklands |
130,150 |
672 |
93.7% |
94.3% |
10.9% |
5.9% |
1.0% |
6.9% |
|
Loresho |
123,802 |
477 |
93.7% |
80.0% |
7.0% |
4.3% |
0.8% |
5.1% |
|
Upperhill |
104,309 |
651 |
88.3% |
88.0% |
10.1% |
5.8% |
0.5% |
6.2% |
|
Kileleshwa |
126,435 |
730 |
96.1% |
92.9% |
11.5% |
6.6% |
0.4% |
7.0% |
|
Westlands |
138,590 |
748 |
90.5% |
92.0% |
15.4% |
6.3% |
0.3% |
6.5% |
|
Average |
122,497 |
663 |
92.5% |
89.8% |
11.6% |
5.9% |
0.7% |
6.6% |
|
Lower Mid-End Suburbs |
||||||||
|
Dagoretti |
87,233 |
692 |
82.2% |
81.4% |
8.6% |
6.1% |
1.7% |
7.8% |
|
Kahawa West |
76,259 |
317 |
95.4% |
94.4% |
8.2% |
5.0% |
1.3% |
6.3% |
|
South C |
118,513 |
458 |
84.9% |
96.2% |
14.0% |
4.7% |
1.2% |
5.9% |
|
South B |
108,971 |
485 |
93.0% |
98.0% |
13.2% |
5.2% |
1.0% |
6.2% |
|
Waiyaki Way |
70,761 |
490 |
91.5% |
86.6% |
13.7% |
5.3% |
0.9% |
6.2% |
|
Imara Daima |
68,947 |
337 |
95.9% |
89.1% |
9.5% |
5.6% |
0.8% |
6.5% |
|
Langata |
99,519 |
447 |
93.4% |
92.6% |
10.5% |
5.2% |
0.2% |
5.3% |
|
Race Course/ Lenana |
79,453 |
604 |
86.4% |
89.4% |
13.0% |
6.0% |
(0.3%) |
5.7% |
|
Average |
88,707 |
479 |
90.3% |
91.0% |
11.3% |
5.4% |
0.8% |
6.2% |
|
Lower Mid-End Satellite Towns |
||||||||
|
Syokimau |
74,878 |
369 |
87.9% |
89.3% |
10.9% |
5.5% |
2.3% |
7.7% |
|
Rongai |
53,025 |
244 |
89.7% |
87.4% |
12.7% |
5.3% |
1.0% |
6.3% |
|
Kikuyu |
82,709 |
447 |
95.8% |
96.0% |
15.0% |
6.3% |
0.8% |
7.1% |
|
Ruaka |
112,787 |
534 |
90.9% |
89.7% |
14.6% |
6.1% |
0.6% |
6.7% |
|
Ngong |
64,696 |
406 |
94.6% |
95.8% |
14.6% |
6.2% |
0.3% |
6.5% |
|
Athi River |
57,136 |
449 |
95.6% |
98.9% |
11.7% |
7.1% |
0.2% |
7.3% |
|
Ruiru |
88,872 |
502 |
87.1% |
86.4% |
12.6% |
5.9% |
(0.8%) |
5.1% |
|
Average |
76,300 |
421 |
91.7% |
91.9% |
13.1% |
6.1% |
0.6% |
6.7% |
|
Apartment Grand Average |
95,835 |
521 |
91.5% |
90.9% |
12.0% |
5.8% |
0.7% |
6.5% |
The key take-outs from the table include;
- Average Total Returns – The average total return came in at 6.5%, representing a 0.3% increase from 6.2% recorded in Q3’2023. In Q3’2024 the average selling and rental prices remained stable at Kshs 95,835 per SQM and Kshs 521 per SQM respectively, from Kshs 95, 663 per SQM and Kshs 504 registered in Q3’2023. Average rental yields came in at 5.8%, 0.2% higher than the 5.6% recorded in Q3’2023 driven by a 4.3% increase in occupancy to 91.5% in Q3’2024, from 87.2% registered in Q3’2023,
- Segment Performance – The best-performing segment was the lower mid-end satellite towns with the average total return coming in at 6.7%, attributed to a higher average rental yield of 6.1% against the sector average of 5.8%. The segment’s performance is boosted by nodes such as Syokimau, Athi River, Kikuyu, and Ruaka, with total returns of 7.7%, 7.3%, 7.1%, and 6.7% respectively which have become highly attractive for investment, and,
- Nodal Performance – Dagoretti, Syokimau, and Kilimani, were the best-performing nodes with total average returns of 7.8%, 7.7 %, and 7.5%, respectively attributable to higher average appreciations of 1.7%, 2.3%, and 1.2% respectively against the market average of 0.7%. The nodes’ performance is attributable to the enhanced accessibility of these subject areas from the CBD, the presence of various retail outlets in Kilimani, and enhanced proximity to other residential areas making these areas attractive to residential development. On the other hand, Athi River, Kikuyu, and Kileleshwa followed closely in the nodal performance with total average returns of 7.3%, 7.1%, and 7.0% respectively.
Weekly Highlights:
- Centum Two Rivers apartment handover
During the week, Centum Real Estate completed the handover of over 24 four-bedroom luxury apartment units as part of its phase two Loft residence project at the Two Rivers mixed-use development. The luxury apartment units were sold for between Kshs 36.0 mn and Kshs 52.0 mn, marking a significant milestone for the firm, which also has developments in Nairobi, Kilifi, and Entebbe, Uganda. Phase 1 of the project was completed in February last year, with 32 units sold at prices starting from Kshs 55.0 mn. The project was funded through a Kshs 3.0 bn bond issued by Centum Re, a subsidiary of Centum Company, which is listed on the Nairobi Securities Exchange (NSE). In addition, Centum reported that 21.0% of buyers used mortgage financing while 79.0% made milestone cash payments.
We expect Centum Real Estate’s success with the Loft residence project to reinforce the growing trend of mixed-use developments (MUDs) in Nairobi and beyond. These projects, which integrate residential, commercial, and sometimes retail or office spaces, are increasingly appealing to both developers and investors due to the efficiency and value they offer. By combining multiple property types in one location, MUDs create synergies that attract a variety of tenants and buyers, contributing to higher occupancy rates and better returns on investment.
- Madison and HF Group Financing deal
During the week, Madison Life Assurance, in partnership with HF Group, announced the availability of affordable financing options for individuals looking to purchase and build homes at VillaKazi Homes in Athi River, Machakos County. VillaKazi Homes is a master-planned, fully serviced, mixed-use real estate development spanning 100 acres, with a project value of Kshs 3.0 bn. The development will feature over 700 residential units, as well as commercial centers, and will be completed in four phases.
HFC will provide project management, sales, marketing, and end-user buyer financing for the development. Additionally, under the partnership, HFC will offer affordable loans with a fixed interest rate of 9.5% on the project cost. The pricing for plots starts at Kshs 2.8 mn, with financing of up to 70.0% available through HFC.
We expect that the partnership to provide affordable financing for VillaKazi Homes will significantly boost homeownership, particularly in Kenya’s growing satellite towns like Athi River. By offering accessible loans, more middle-income buyers will have the opportunity to own homes, addressing the rising demand for affordable housing options.
Notable highlights during Q3’2024 were;
- The Kenya Mortgage Refinance Company (KMRC) broadened its refinancing services to include non-shareholders, such as SACCOs and microfinance institutions. This is a strategic move to improve access to affordable mortgages, particularly for low- and middle-income earners, a key target of Kenya's affordable housing agenda. For more information, please see our Cytonn Weekly #39/2024, and,
For more notable highlights during Q3’2024, please see our Cytonn Monthly August 2024 and Cytonn Monthly July 2024,
Our outlook for the NMA residential sector remains NEUTRAL, as we foresee increased activity from in the industry supported by: i) housing demand fueled by population growth and high urbanization rates, ii) government infrastructure development projects, iii) government initiatives, particularly the Affordable Housing Agenda which is being rolled out countrywide. However, growth in the sector remains hindered by rising construction costs, a challenging macroeconomic climate, and limited financing options for developers.
- Commercial Office Sector
The table below highlights the performance of the Nairobi Metropolitan Area (NMA) Commercial Office sector over time;
|
All figures in Kshs unless stated otherwise |
|||||||||
|
Cytonn Report: Nairobi Metropolitan Area (NMA) Commercial Office Returns Over Time |
|||||||||
|
Year |
Q1'2023 |
H1'2023 |
Q3'2023 |
FY'2023 |
Q1'2024 |
H1'2024 |
Q3'2024 |
∆ Q3'2023/ Q3'2024 |
|
|
Occupancy % |
79.8% |
80.8% |
79.9% |
80.3% |
80.1% |
80.1% |
79.6% |
(0.3%) |
|
|
Asking Rents (Kshs/SQFT) |
97 |
98 |
100 |
103 |
103 |
103 |
104 |
3.8% |
|
|
Average Prices (Kshs/SQFT) |
12,238 |
12,238 |
12,265 |
12,673 |
12,665 |
12,677 |
12,677 |
3.4% |
|
|
Average Rental Yields (%) |
7.6% |
7.9% |
7.4% |
7.7% |
7.6% |
7.7% |
7.7% |
0.3% |
|
Source: Cytonn Research
The key take-outs from the table include
- Average Asking Rents – In Q3’2024, average asking rents per SQFT in the NMA increased by 3.8% to Kshs 104 from Kshs 100 in Q3’2023. We attribute this increase to the rise in the supply of Grade A offices in the market during the review period. New Grade A offices added to the pipeline during this period between Q3’2023 and Q3’2024, include Eneo, Karen Green, The Cube, and the Piano, thereby driving up the asking prices for commercial office spaces. Additionally, we expect more commercial office spaces in the market once the following projects are completed; Highway Heights, The Atrium, Purple Tower, and Mandrake in Westlands. On a q/q basis, the asking rents have increased by 3.8% attributable to an improvement in the Kenyan economy which grew by 4.6% as of Q2’2024, and an increase in high-quality office spaces in the market,
- Average Occupancy Rate – In Q3’2024, commercial office occupancy showed a slight decrease of 0.3% points to 79.6% from 79.9% recorded in Q3’2023. This decrease can be attributed to the increased supply of new office spaces in the market. On a quarter-on-quarter basis, occupancy decreased by 0.5% point to 79.6% from 80.1% reflecting slower activities in the market and,
- Average Rental Yield – The average rental yields showed resilience with 0.3%-points increase, coming at 7.7% in Q3’2024 from 7.4% in Q3’2023. This is attributable to an increase in rental prices by 3.8% to Kshs 104 from Kshs 100. On q/q basis, performances remained unchanged as well.
For submarket performance, Westlands emerged as the top performer, achieving an average rental yield of 8.6% in Q3’2024, surpassing the market average of 7.7%. Gigiri and Kilimani also performed strongly, with rental yields of 8.4% and 7.8%, respectively. This performance can be attributed to several factors: i) a high concentration of Grade A offices in these areas, ii) robust infrastructure developments such as roads like the Nairobi Express Way and the expanded Waiyaki Way, iii) increasing demand for high-quality offices driven by embassies, international organizations, and multinational companies, and iv) availability of after-work amenities like hotels and quality social venues. In contrast, Mombasa Road was the least performing node with an average rental yield of 6.1% in Q3’2024, 1.6% points lower than the market average of 7.7%. This lower performance can be attributed to: i) its reputation as an industrial center, which diminishes its appeal to office businesses aiming to attract clients, ii) the general perception that the area is less ideal for businesses, iii) intense competition from other neighbourhoods such as the CBD and Upperhill, and (iv) offices of relatively lower quality, which are perceived as less attractive and thus command lower rents, as evidenced by a 72.2% occupancy rate, 7.4% lower than the market average of 79.6%. The table below displays the performance of sub-markets in the Nairobi Metropolitan Area (NMA).
|
Cytonn Report: NMA Commercial Office Submarket Performance Q3'2024 |
|||||||||||
|
Area |
Price/SQFT Q3'2024 |
Rent/SQFT Q3'2024 |
Occupancy Q3'2024 |
Rental Yields Q3'2024 |
Price/SQFT Q3'2023 |
Rent/SQFT Q3'2023 |
Occupancy Q3'2023 |
Rental Yields Q3'2023 |
∆ in Rent |
∆ in Occupancy (% points) |
∆ in Rental Yields (% points) |
|
Westlands |
12,448 |
119 |
76.3% |
8.6% |
12146 |
114 |
75.2% |
8.4% |
3.8% |
1.1% |
0.1% |
|
Gigiri |
14,850 |
127 |
81.6% |
8.4% |
13,500 |
115 |
82.2% |
8.5% |
10.4% |
(0.6%) |
(0.1%) |
|
Kilimani |
13,051 |
102 |
82.7% |
7.8% |
12,356 |
98 |
83.4% |
7.9% |
3.5% |
(0.6%) |
(0.0%) |
|
Parklands |
11,922 |
94 |
83.0% |
7.8% |
11,662 |
93 |
83.6% |
8.0% |
1.3% |
(0.7%) |
(0.2%) |
|
Karen |
14,315 |
115 |
80.9% |
7.8% |
13,431 |
116 |
79.7% |
8.3% |
(1.0%) |
1.2% |
(0.5%) |
|
Nairobi CBD |
12,206 |
92 |
85.2% |
7.7% |
11,971 |
87 |
85.0% |
7.6% |
5.1% |
0.1% |
0.1% |
|
Upperhill |
13,014 |
100 |
73.4% |
6.7% |
12,605 |
98 |
76.1% |
7.1% |
2.0% |
(2.7%) |
(0.4%) |
|
Thika Road |
12,571 |
88 |
76.6% |
6.3% |
12,571 |
79 |
80.1% |
6.0% |
12.4% |
(3.5%) |
0.2% |
|
Mombasa Road |
11,325 |
80 |
72.2% |
6.1% |
11,325 |
71 |
67.9% |
5.2% |
11.5% |
4.3% |
0.8% |
|
Average |
12,677 |
104 |
79.6% |
7.7% |
12,265 |
100 |
79.6% |
7.7% |
5.4% |
(0.3%) |
0.0% |
|
All Values are in Kshs unless stated otherwise |
|||||||||||
Source: Cytonn Research
Notable highlights in Q3’2024 include;
- Within the month, The Kenya Ports Authority (KPA) announced plans to construct a multistoried office tower away from Mombasa Port in a bid to ease congestion, improve security, and rent out offices and conference rooms to earn additional revenue. The complex will comprise approximately 40,000 SQM of office space for KPA staff, four times the space they are using now. For more details, please see our Cytonn weekly #39/2024.
For more highlights during the quarter, please see our Cytonn Monthly – July 2024.
The commercial office sector in Nairobi Metropolitan Area (NMA) remains NEUTRAL, impacted by several key dynamics: i) the increasing presence of multinational companies in Kenya is likely to drive up occupancy levels, ii) co-working spaces are gaining in popularity in the region. However, the sector continues to face challenges due to a significant oversupply of office space, currently standing at 5.8 mn SQFT. Despite these challenges, there are attractive investment opportunities in areas such as Westlands, Gigiri, and Kilimani, which offer returns that exceed the market average.
- Retail Sector
The table below shows the performance of the retail sector performance in Nairobi Metropolitan Area from Q1’2023 to Q3’2024;
|
All values in Kshs unless stated otherwise |
|||||||||
|
Cytonn Report: Summary of Retail Sector Performance in Nairobi Metropolitan Area Q1’2023 - Q3’2024 |
|||||||||
|
Item |
Q1’2023 |
H1’2023 |
Q3'2023 |
FY'2023 |
Q1'2024 |
H1'2024 |
Q3'2024 |
Y/Y 2024 ∆ |
|
|
Average Asking Rents (Kshs/SQFT) |
176 |
177 |
182 |
182 |
180 |
182 |
185 |
1.6% |
|
|
Average Occupancy (%) |
78.0% |
79.2% |
78.7% |
78.7% |
79.3% |
79.8% |
81.4% |
2.7% |
|
|
Average Rental Yields |
8.0% |
8.2% |
8.2% |
8.3% |
8.1% |
7.9% |
8.2% |
0.0% |
|
Source: Cytonn Research
The key take-outs from the table include;
- Average Occupancy Rate – During Q3’2024, the retail sector experienced a slight increase in average occupancy rates, rising by 2.7 % points to reach 81.4%, up from 78.7% in the same period in 2023. This growth can be attributed to several key factors: i) ongoing expansion by both local and global retailers, such as Naivas, Jaza Stores, QuickMart, Carrefour, China Square, and Panda Mart, ii) the rise of new shopping centers like Business Bay Square (BBS) Mall in Eastleigh, which has drawn a variety of smaller retailers, effectively filling crucial retail spaces, iii) continued demand for consumer products and services, fueled by favourable demographic trends, iv) response to shifting market conditions, with efforts from Jaza Stores and Carrefour enabling online shopping via platforms like WhatsApp to meet changing consumer preferences, v) ongoing infrastructure development, which has both improved existing retail spaces and created new opportunities for retail expansion, broadening the sector's footprint,
- Asking Rents – In Q3’2024, average rental rates per SQFT saw a slight rise, increasing by 1.6% to Kshs 185, up from Kshs 182 in Q3’2023. Several key factors contributed to this slight increase: i) the launch of upscale retail spaces like the Global Trade Centre (GTC) mall and Business Bay Square (BBS) Mall, which commanded premium rents due to their superior facilities and offerings, ii) ongoing demand for high-end retail spaces in prime locations within the Nairobi Metropolitan Area (NMA), including Karen, Kilimani, Westlands, and along Kiambu and Limuru roads. These strategic locations, known for their quality amenities, attracted both local and international businesses aiming to be near multinational corporations and embassies, catering to a global clientele, iii) the entry of prominent international brands like Adidas, Michael Kors, Puma, and Aldo into the Kenyan market, increasing competition for top-tier retail spaces and driving up rental prices, and,
- Average Rental Yield- The average rental yield for the NMA retail sector was stable at 8.2% in both periods, this stagnation was attributable to the increase in the average rental prices by 1.6% to Kshs 185, up from Kshs 182 in Q3’2023, increase in the average occupancy rates by 2.7% to 81.4% from 78.7% in Q3’2024, and the increase in average sales price which rose by 3.6% to Kshs 21,381 from Kshs 20,643 in Q3’2023, matching the rental prices increase and the average occupancy increase.
In terms of sub-market performance, Kilimani, Karen, and Kiambu Road & Limuru Road displayed impressive average rental yields of 9.8%, 9.7%, and 8.9%, respectively, surpassing the overall market average of 8.2%. This strong performance was mainly driven by the growing demand for retail services in these key areas, the availability of premium retail spaces commanding higher rents, and the provision of high-quality infrastructure, which increased the appeal for both tenants and customers.
Conversely, retail spaces in Thika Road reported the lowest average rental yield at 6.3%, influenced by several factors: i) rental rates in Thika Road were significantly below the market average of Kshs 185 per SQFT, standing at Kshs 160 per SQFT due to oversupply of retail space from numerous malls along Thika Road thereby creating an excess in supply, reducing demand and rental rates, ii) there is oversaturation of retail businesses which increases competition among malls and retail spaces forcing landlords to lower rents to attract customers, iii) increased e-commerce reduces demand for physical retail spaces along Thika Road, iv) certain retail spaces suffer from insufficient foot traffic, particularly outside peak hours or in less popular malls.
The following table illustrates the submarket performance of nodes within the Nairobi Metropolitan Area (NMA) in Q3’2024;
|
(All values in Kshs unless stated otherwise) |
|||||||||||
|
Nairobi Metropolitan Area Retail Market Performance Q3’2024 |
|||||||||||
|
Area |
Prices Kshs /SQFT Q3’2024 |
Rent Kshs /SQFT Q3’2024 |
Occupancy% Q3’2024 |
Rental Yield Q3’2024 |
Prices Kshs /SQFT Q3’2023 |
Rent Kshs /SQFT Q3’2023 |
Occupancy% Q3’2023 |
Rental Yield Q3’2023 |
∆ in Rental Rates |
∆ in Occupancy (% points) |
∆ in Rental Yield (% points) |
|
Kilimani |
20,000 |
198 |
82.2% |
9.8% |
19,200 |
192 |
82.3% |
9.9% |
3.0% |
(0.1%) |
(0.1%) |
|
Karen |
23,600 |
218 |
87.5% |
9.7% |
22,400 |
217 |
85.0% |
10.0% |
0.4% |
2.5% |
(0.3%) |
|
Kiambu road & Limuru Road |
20,667 |
201 |
76.3% |
8.9% |
20,667 |
202 |
74.0% |
8.7% |
(0.6%) |
2.4% |
0.2% |
|
Ngong Road |
23,013 |
191 |
86.2% |
8.7% |
21,250 |
170 |
81.0% |
7.8% |
12.3% |
5.2% |
0.9% |
|
Mombasa road |
19,571 |
169 |
82.9% |
8.6% |
19,571 |
168 |
78.7% |
8.0% |
0.4% |
4.2% |
0.5% |
|
Eastlands |
20,500 |
161 |
78.1% |
7.3% |
20,500 |
160 |
71.7% |
6.2% |
0.4% |
6.4% |
1.1% |
|
Satellite towns |
19,600 |
140 |
82.8% |
7.2% |
19,200 |
139 |
79.8% |
6.9% |
0.7% |
3.0% |
0.3% |
|
Westlands |
25,000 |
239 |
79.4% |
7.1% |
22000 |
216 |
77.6% |
9.1% |
10.6% |
1.8% |
(2.0%) |
|
Thika Road |
20,473 |
160 |
79.3% |
6.3% |
21,000 |
165 |
80.7% |
7.5% |
(2.8%) |
(1.3%) |
(1.2%) |
|
Average |
21,381 |
185 |
81.4% |
8.2% |
20,643 |
182 |
78.7% |
8.2% |
1.6% |
2.7% |
0.0% |
Source: Cytonn Research
The notable highlight in the month of September was;
- French retailer Carrefour Supermarket opened its latest store in Ruiru, Kiambu county marking its 24thoutlet in the country. The retail store is situated at the newly developed Nord Mall, Ruiru town, Kiambu. The company aims to continue offering a wide selection of household products to the residents around Ruiru town with items ranging from appliances, furniture, stationary, and groceries among many other items. For more information, please see our Cytonn Weekly #38/2024
For notable highlights during the quarter; please see our Cytonn Monthly – August 2024.
We maintain a NEUTRAL outlook on the retail sector’s performance for 2024, influenced by several factors: i) Continued expansion by local and international retailers, driven by evolving consumer preferences and market trends, ii) Infrastructure improvements, including ongoing road and railway projects, are set to increase accessibility to key retail zones, unlocking further investment opportunities, and iii) Favorable demographic trends, such as a growing urban population, will sustain demand for retail goods and services. However, growth could face challenges from: i) Oversupply issues, with around 3.0 min SQFT of retail space available in Nairobi and an additional 1.7 mn SQFT countrywide, leading to low occupancy rates and rental yields, ii) E-commerce adoption, increasingly shifting retail demand online, pushing brick-and-mortar outlets to adapt, and iii) Limited financing options for retail developments, along with high costs, are likely to hinder investment, especially for small and medium-sized enterprises (SMEs) that need to adopt technology to stay competitive
- Hospitality Sector
During Q3’2024, Industry Reports related to the Hospitality sector were released as follows;
|
Cytonn Report: Released Industry Report related to Hospitality Sector Q3’2024 |
||
|
# |
Report |
Key Take-outs |
|
1. |
Leading Economic Indicators (LEI) July 2024 Report |
|
|
2. |
Q1’2024 Quarterly Economic Review Central Bank of Kenya (CBK) |
|
|
3. |
Leading Economic Indicators (LEI) June 2024 Report by the Kenya National Bureau of Statistics (KNBS) |
|
|
4. |
2024 Economic Survey by Kenya Bureau of Statistics |
|
Source; Cytonn Research
We maintain a neutral outlook for the hospitality sector in the coming quarter, supported by several key drivers: i) Aggressive marketing campaigns promoting Kenya’s tourism, expected to boost tourist arrivals and improve occupancy rates at hospitality venues, ii) International recognition of Kenya’s tourism industry, enhancing its status as a leading tourist destination and drawing more global visitors, iii) Strategic partnerships within the tourism sector, fostering innovation and collaboration to capitalize on new opportunities, iv) Events and initiatives aimed at increasing tourism activity and improving guest experiences, and v) Direct flights from Dubai to Mombasa by FlyDubai, expected to enhance accessibility and attract tourists from key markets, vi) Domestic tourism promotion under the Ministry of Tourism Strategy 2021-2025 strategy, prioritizing local tourism growth. However, challenges may arise from: i) Financing difficulties, as stricter lending criteria could limit access to capital for expanding hospitality infrastructure
- Industrial Sector
Notable highlights in the quarter include;
- Taita-Taveta County is set to achieve an economic milestone with the approval of a Kshs 11.0 bn steel plant by Devki Steel Mills Limited which will be completed within eight months. The plant is set to be constructed in Manga area, Voi. Narendra Raval of Devki Steel Mills was officially handed a 500-acre parcel of land to commence the construction of the plant. For more information, please see our Cytonn monthly August 2024.
For more notable highlights during Q3’2024 please see our Cytonn Monthly –July.
We expect that the Kenyan industrial Real Estate sector to continue on an upward trajectory mainly driven by: i)Kenya’s continued recognition as a regional hub, hence attracting both local and international investors, ii) support from the government, as evidenced by the establishment of Special Economic Zones (SEZ) and Export Processing Zones (EPZ), iii) increasing demand for quality warehousing spaces due to continued growth in the E-commerce business in the country iv) the growing establishment of data centers in the country, v) increasing demand for cold storage facilities around Nairobi Metropolitan Area (NMA) driven by consumption by the middle class.
- Infrastructure
During the week, Superior Homes, a Real Estate developer, unveiled the first roadside truck stopover complex along the Northern Corridor at Sultan Hamud on the Nairobi-Mombasa highway. The complex, dubbed Supastop, is expected to cost approximately Kshs 350.0 mn and aims to promote road safety while providing a secure resting point for long-distance truck drivers and travellers who park along the route daily. Sultan Hamud is strategically located at the center of a 145-kilometer stretch between Mtito Andei and Salama, making it a significant parking spot for long-distance trucks traveling to or from Mombasa. The project is anticipated to be completed in partnership with the Northern Corridor Transit and Transport Coordination Authority, aiming to provide safe and decent accommodation facilities for long-distance drivers.
We expect that the unveiling of the Supastop truck stopover complex will significantly enhance road safety and convenience for long-distance truck drivers and travellers along the Nairobi-Mombasa highway. The strategic location of Sultan Hamud as a central parking spot for trucks is likely to increase traffic and boost economic activity in the area, opening it up to further investment opportunities in retail and accommodation spaces.
Key highlights during Q3’2024;
- President Willian Ruto launched upgrading of link roads in Suna East Constituency in Migori county during his Nyanza area tour. Upon completion, the roads are expected to further Migori’s business vibrancy, improve livelihoods, and unlock the region’s economic potential. Further, the president launched the construction of Rusinga Ring Road in Homa Bay County. The road will ease the transportation pressures in the area, promote business in the area, and contribute to economic growth by providing improved accessibility and basic services which will attract investments and create jobs for the locals. Please see our Cytonn Monthly August,
- President William Ruto launched the tarmacking of the 25-kilometre Rukuriri-Kathageri-Kanyaumbora road in Embu County. Upon completion, the road is expected to further Embu’s agricultural vibrancy, improve livelihoods, and unlock the region’s economic potential. For more information, please see our Cytonn weekly #32/2024,
- The Dongo Kundu Bypass was officially opened to the public following its handover by the contractor to the government. This Kshs 40 bn project, undertaken by the China Civil Engineering Construction Corporation (CCECC), began in 2018 and features a 17.5-kilometer road with three bridges. For more information, please see our Cytonn weekly #32/2024, and,
- The president, oversaw ground breaking for the tarmacking of 65.0-Kilometre-long link roads in Sombogo, Kitutu Chache, and tarmacking of Metembe-Ngenyi/Bobaracho-Ititi/Rioma-Nyaore/Marani-Nyakoe Roads in Marani, Kisii County. For more information, please see our Cytonn weekly #33/2024.
For more notable highlights during Q3’2024 please see our Cytonn Monthly – August 2024, and Cytonn Monthly –July.
We anticipate that Kenya's infrastructure sector will continue to play a vital role in driving economic growth, supported by the government's commitment to building and rehabilitating key infrastructure such as roads, bridges, railways, and airports. These improvements are expected to enhance the efficient movement of people, goods, and services, which will, in turn, boost demand for real estate properties in remote areas and satellite towns.
- Land Sector
During the period under review, the land sector in Nairobi Metropolitan Area (NMA) recorded a price appreciation of 3.9% to Kshs 130.8 mn from 129.0 mn. This performance was bolstered by;
- The growing demand for land in the Nairobi Metropolitan Area (NMA) is driven by a rising population, as individuals from various regions of the country migrate annually in search of employment, education, and other opportunities,
- The fixed supply of land has intensified demand, particularly for residential and commercial purposes, leading to an increase in land prices,
- There is an expanding middle class in the NMA with disposable income, willing to invest in land as a savings and investment option,
- The government's ongoing infrastructural development projects, such as roads, sewers, railways, and water connections, are opening up more satellite towns, subsequently driving land prices upward,
- The widely held belief among the middle class that land represents a secure form of wealth has prompted many families to save specifically for land acquisition, and,
- The government’s Affordable Housing Program, under the Bottom-Up Economic Transformation Agenda (BETA), has initiated construction projects across various parts of Nairobi and the country, further increasing land values due to heightened construction activity.
Overall Performance:
Un-serviced land in Satellite Towns registered the highest capital appreciation during the period under review, with an annual capital appreciation of 9.5%, where average selling prices rose to Kshs 17.9 mn from Kshs 16.4 mn recorded in Q3’2023. The performance in this segment can be attributed to several factors: i) relatively lower prices, with the average selling prices at Kshs 17.9 mn compared to the market average of Kshs 130.8 mn in the Nairobi Metropolitan Area (NMA), ii) a growing middle class willing to invest in Satellite Towns as they settle their families, iii) the anticipation of price increases once various services are introduced in these areas, and iv) the desire to settle in areas free from the city's hustle and pollution. On the other hand, land in Nairobi Suburbs under the Commercial Areas recorded the least movement with an annual capital appreciation of 0.6%, below the market average of 3.9%. This was mainly due to the high selling prices, which averaged Kshs 394.9 mn, relatively higher than the market average of Kshs 130.8 mn The table below shows the overall performance of the sector across all land sub-sectors during Q3’2024;
|
Cytonn Report: Summary of the Performance Across All regions Q3’2024 |
|||
|
|
Q3'2023 |
Q3'2024 |
Annualized Capital Appreciation |
|
Un-serviced land - Satellite Towns |
16.4 mn |
17.9 mn |
9.5% |
|
Serviced Land - Satellite Towns |
18.3 mn |
19.2 mn |
5.4% |
|
Nairobi Middle End Suburbs – High Rise Residential Areas |
82.3 mn |
84.5 mn |
2.5% |
|
Nairobi High End Suburbs (Low- and High-Rise Areas) |
135.7 mn |
137.5 mn |
1.3% |
|
Nairobi Suburbs- Commercial Areas |
392.6 mn |
394.9 mn |
0.6% |
|
Average |
129.0 mn |
130.8 mn |
3.9% |
Source: Cytonn Research
Sub-markets Performance – For the unserviced satellite towns, Rongai, Juja, and Utawala emerged as the best-performing nodes with annualized capital appreciation of 19.1%, 6.9%, and 6.6%, respectively. This performance can be attributed to: i) close proximity to several transport routes, ii) a high concentration of higher learning institutions, driving the demand for student accommodation, iii) a rising middle class looking to settle in these areas, iv) good proximity to retail centers such as malls, and v) relatively affordable prices compared to the market average. Additionally, land in unserviced towns presents a good opportunity for speculative investors, who invest in anticipation of price appreciation. On the other hand, Commercial Areas in Nairobi’s Suburbs registered the least price movement, with Upperhill recording a correction of 0.4%. The segment had the highest price per acre, with the average selling price coming in at Kshs 394.9 mn, significantly higher than the market average of Kshs 130.8 mn. Notably, some areas in this segment, such as Kilimani, are witnessing a proliferation of high-rise apartments, which has made them less attractive. The table below shows NMA’s land performance by submarkets in Q3’2024;
|
Price in Kshs per Acre |
|||
|
Cytonn Report: Nairobi Metropolitan Area Land Performance By Submarkets – Q3’2024 |
|||
|
Location |
Price Q3'2023 |
Price Q3'2024 |
Capital Appreciation |
|
Satellite Towns - Unserviced Land |
|||
|
Rongai |
21.4 mn |
25.5 mn |
19.1% |
|
Juja |
15.0 mn |
16.0 mn |
6.9% |
|
Utawala |
16.7 mn |
17.8 mn |
6.6% |
|
Limuru |
23.5 mn |
25.0 mn |
6.4% |
|
Athi River |
5.2 mn |
5.2 mn |
0.0% |
|
Average |
16.4 mn |
17.9 mn |
9.5% |
|
Satellite Towns - Serviced Land |
|||
|
Athi River |
14.4 mn |
16.2 mn |
12.6% |
|
Syokimau |
17.2 mn |
18.8 mn |
9.3% |
|
Ruai |
12.5 mn |
13.1 mn |
4.7% |
|
Rongai |
19.1 mn |
19.6 mn |
2.4% |
|
Ruiru & Juja |
28.1 mn |
28.6 mn |
1.7% |
|
Average |
18.3 mn |
19.2 mn |
5.4% |
|
Nairobi Middle End Suburbs – High Rise Residential Areas |
|||
|
Embakasi |
79.2 mn |
82.7 mn |
4.2% |
|
Kasarani |
82.2 mn |
84.7 mn |
3.0% |
|
Dagoretti |
85.6 mn |
86.0 mn |
0.5% |
|
Average |
82.3 mn |
84.5 mn |
2.5% |
|
Nairobi High End Suburbs (Low and High Rise Areas) |
|||
|
Ridgeways |
87.0 mn |
91.3 mn |
5.0% |
|
Kileleshwa |
301.9 mn |
309.0 mn |
2.3% |
|
Kitisuru |
95.0 mn |
96.1 mn |
1.2% |
|
Runda |
87.9 mn |
88.9 mn |
1.2% |
|
Spring Valley |
176.5 mn |
175.5 mn |
(0.6%) |
|
Karen |
65.7 mn |
64.2 mn |
(2.4%) |
|
Average |
135.7 mn |
137.5 mn |
1.3% |
|
Nairobi Suburbs - Commercial Zones |
|||
|
Westlands |
413.2 mn |
418.1 mn |
1.2% |
|
Riverside |
323.0 mn |
326.5 mn |
1.1% |
|
Kilimani |
375.9 mn |
379.1 mn |
0.9% |
|
Upperhill |
458.1 mn |
456.1 mn |
(0.4%) |
|
Average |
392.6 mn |
394.9 mn |
0.6% |
Source: Cytonn Research
We maintain a POSITIVE outlook for the land sector in the Nairobi Metropolitan Area (NMA), considering it a dependable investment opportunity that has shown resilience year on year, with long-term potential to hedge against macroeconomic factors such as inflation. Going forward, we expect the sector's performance to be driven by several factors: i) government efforts to streamline land transactions through innovative solutions such as Ardhi Sasa, ii) continued activities by players on both the demand and supply sides, iii) growing demand for land driven by positive demographics, iv) the launch of infrastructure development projects opening up satellite towns for investment opportunities, and v) the continued rollout of the Affordable Housing Program (AHP) by the government, driving further demand for land.
- Real Estate Investments Trusts (REITs)
- REIT Weekly Performance
On the Unquoted Securities Platform, Acorn D-REIT and I-REIT traded at Kshs 25.4 and Kshs 22.2 per unit, respectively, as per the last updated data on 27th September 2024 2024. The performance represented a 27.0% and 11.0% gain for the D-REIT and I-REIT, respectively, from the Kshs 20.0 inception price. The volumes traded for the D-REIT and I-REIT came in at Kshs 12.3 mn and Kshs 31.6 mn shares, respectively, with a turnover of Kshs 311.5 mn and Kshs 702.7 mn, respectively, since inception in February 2021. Additionally, ILAM Fahari I-REIT traded at Kshs 11.0 per share as of 27th September 2024, 2024, representing a 45.0% loss from the Kshs 20.0 inception price. The volume traded to date came in at 138,600 for the I-REIT, with a turnover of Kshs 1.5 mn since inception in November 2015.
- Weekly highlight:
- ILAM Fahari’s Sale of Bay Holdings
During the week, ILAM Fahari, a Real Estate Investment Trust (REIT), completed the sale of one of its properties, Bay Holdings, located in the Nairobi Industrial Area at the intersection of Enterprise and Bamburi Roads. The property sold with a carrying value of Kshs 160.0 mn, was acquired in June 2016 at Kshs 216.1 mn. It features a gross leasable area of 33,265 SQFT, along with a covered parking area. The property was fully occupied by three anchor tenants: Imperial Bank, Packard Limited, and Mat-Han Equipment.
This sale is part of ICEA Lion Asset Management's strategic move to dispose of its non-core assets. The company had last year also placed another property, Highway House, on the market with an asking price of Kshs 45.1 mn, a premium over its last valuation of Kshs 30.0 mn. However, the sale price for Bay Holdings represents a loss compared to the Kshs 108.7 mn acquisition price from June 2016. Following this transaction, ILAM Fahari is expected to retain two assets: Greenspan Mall in Donholm and Starling Park Properties, with an estimated combined worth of Kshs 2.9 bn.
We expect that the decision to sell Bay Holdings, despite the loss on the acquisition price, suggests ILAM Fahari REIT is focused on rebalancing its portfolio. This move could be driven by the need to free up capital for more strategic investments or reduce exposure to underperforming assets. Reinvesting the proceeds into high-performing assets or new growth opportunities is likely a priority, particularly in the retail and mixed-use sectors.
Notable highlights during Q3’2024 included;
- Acorn Project Two LLP, a special purpose vehicle of Acorn Holdings announced an early redemption of Kshs 2.6 bn in outstanding notes maturing on 8th November 2024 under the Kshs 5.7 bn medium-term note (MTN) Programme, effective 4th October 2024. The notice highlighted that the notes will be redeemed at an amount equal to the nominal value of the notes, together with accrued but unpaid interest from the preceding interest payment date up to and including the early redemption date. Additionally, in connection with early redemption, the notes will be delisted from the fixed-income securities market segment of the Nairobi Securities Exchange. For more information, please see our Cytonn Weekly #38/2024, and,
- Acorn Holdings, a Real Estate developer, completed the acquisition of a 0.79-acre piece of land in Eldoret along Makasembo Road, near the Moi Teaching & Referral Hospital and Moi University Medical School. The company had earlier hinted at this move in their semi-annual report 2024 after identifying Eldoret and Kakamega as the first tier two areas to host its student hostel developments, upon acquisition of land. The company is expected to launch a Kshs 1.6 bn two-hostel project under their Qwetu and Qejani brands, with each having a total of 514 rooms and 510 rooms respectively, and a combined bed capacity of 2,291. For more information, please see our Cytonn Weekly #36/2024,
For other notable highlights during the quarter, please see our Cytonn Monthly – August 2024 and Cytonn Monthly – July 2024.
REITs offer various benefits, such as tax exemptions, diversified portfolios, and stable long-term profits. However, the ongoing decline in the performance of Kenyan REITs and the restructuring of their business portfolios are hindering significant previous investments. Additional general challenges include: i) insufficient understanding of the investment instrument among investors leading to a slower uptake of REIT products, ii) lengthy approval processes for REIT creation, iii) high minimum capital requirements of Kshs 100.0 mn for REIT trustees compared to Kshs 10 mn for pension funds Trustees, (iv) limiting the type of entity that can form a REIT to only a trust company, and v) minimum subscription amounts or offer parcels set at Kshs 0.1 mn for D-REITs and 5.0 Mn for restricted I-REITs. The significant capital requirements still make REITs relatively inaccessible to smaller retail investors compared to other investment vehicles like unit trusts or government bonds, all of which continue to limit the performance of Kenyan REITs
Real Estate Performance Summary and Outlook
Below is a summary of the sectorial performance in Q3’2024 and investment opportunities:
|
Theme |
Cytonn Report: Thematic Performance and Outlook Q3’2024 |
Outlook |
|
Residential |
|
Neutral |
|
||
|
Commercial Office |
|
Neutral |
|
||
|
Retail |
|
Neutral |
|
||
|
Hospitality |
|
Neutral |
|
Land |
|
Positive |
Disclaimer: The views expressed in this publication are those of the writers where particulars are not warranted. This publication, which is in compliance with Section 2 of the Capital Markets Authority Act Cap 485A, is meant for general information only and is not a warranty, representation, advice or solicitation of any nature. Readers are advised in all circumstances to seek the advice of a registered investment advisor.

- Talk to us
- Kenya
- P.O Box 20695 - 00200, Nairobi, Kenya
- Cell +254709101200
- Tel +254709101200
- WhatsApp +254741676635
- United States
- +254709101200
- DOWNLOAD OUR APP
-


- Kenya
- 8th Floor, Pinetree Plaza, Kaburu Drive, Ngong Road, Nairobi, Kenya
- USA
- Suite 1150, 1775 Eye Street NW, USA, Washington DC 20006, USA
- Investments
- High Yield
- Private Equity
- Real Estate
- Real Estate
- RiverRun Estates
- Cytonn Towers
- The Ridge
- Taraji Heights
- The Alma