Cytonn Annual Markets Review - 2024
By Research Team, Jan 5, 2025
Executive Summary
Global Markets Review
According to the World Bank's June 2024 Global Economic Prospects report, the global economy is projected to grow at 2.6% in 2024, matching the growth rate recorded in 2023. This forecast marks a slight downward revision from earlier projections, reflecting continued economic headwinds, particularly in the emerging markets. The World Bank’s growth projection is 0.6 percentage points lower than the IMF’s 2024 forecast of 3.2%. The lower growth is attributable to global inflationary pressures and continued tightening by central banks for much of 2024. However, recent developments indicate that some central banks, such as those in the United States and England, have cut interest rates in response to easing inflation, which could stimulate economic activity going forward. Notably, advanced economies are expected to record a 1.5% growth in 2024, remaining unchanged from the 1.5% expansion recorded in 2023. However, emerging markets and developing economies are projected to expand by 4.0% in 2024, lower than 4.2% growth in 2023;
Sub-Saharan Africa Regional Review
According to the World Bank, the Sub-Saharan economy is projected to grow at a moderate rate of 3.0% in 2024, which is 0.6% higher than the 2.4% growth recorded in 2023. The expected recovery is primarily driven by private consumption growth as declining inflation boosts the purchasing power of household incomes. Nevertheless, the risk of debt distress remains high with more than half of countries facing unsustainable debt burdens as the region’s public debt to GDP ratio is expected to remain high at 57.0% in 2024, albeit a decline from 60.0% in 2023. The public debt is expected to remain high due to increased debt servicing costs as a result of continued currency depreciation for most countries in the region and high interest rates. Additionally, many countries are providing subsidies in order to mitigate inflationary pressures, which could worsen public finance, increase public debt, and weigh down on debt sustainability;
In 2024, most of the select Sub-Saharan currencies depreciated against the US Dollar, mainly attributable to the elevated inflationary pressures in the region, high debt servicing costs that continue to dwindle foreign exchange reserves, and monetary policy tightening by advanced economies. The high interest rates in developed countries have led to massive capital outflows from the region as investors, both institutional and individual seek to take advantage of the higher returns offered in developed economies. Further, the elevated inflationary pressures in most economies in the region puts pressure on the value of local currencies due to expensive importation;
Kenya Macro Economic Review
According to the Kenya National Bureau of Statistics (KNBS) Q2’2024 Quarterly Gross Domestic Product Report, the Kenyan economy recorded a 4.6% growth in Q2’2024, slower than the 5.6% growth recorded in Q2’2023. For the sectoral performance, Agriculture, Fishing and Forestry sector grew by 4.8% in Q2’2024, lower than the 7.8% expansion recorded in Q2’2023. All sectors in Q2’2024, except Mining and Quarrying and Construction recorded positive growths, with varying magnitudes across activities. Most sectors recorded declining growth rates compared to Q2’2023 with Accommodation and Food Services, Financial & Insurance, and Construction Sectors recording the highest declines of 16.2%, 8.1%, and 5.6% points, respectively. The slowed growth in the economy could be attributed to the high fuel prices which made production more expensive and negatively impacted the business environment and the unrest caused by the anti-finance bill protests in June;
In 2024, the Kenyan economy is projected to grow at an average of 5.3%, down from 5.6% in 2023. The slower growth is primarily driven by reduced private sector activity and ongoing fiscal consolidation efforts by the government, which have limited public spending. Additionally, political instability during the year, fueled by anti-finance bill protests and opposition against the current regime, has undermined investor confidence and disrupted economic activities. This instability is expected to further weigh on economic growth;
Fixed Income
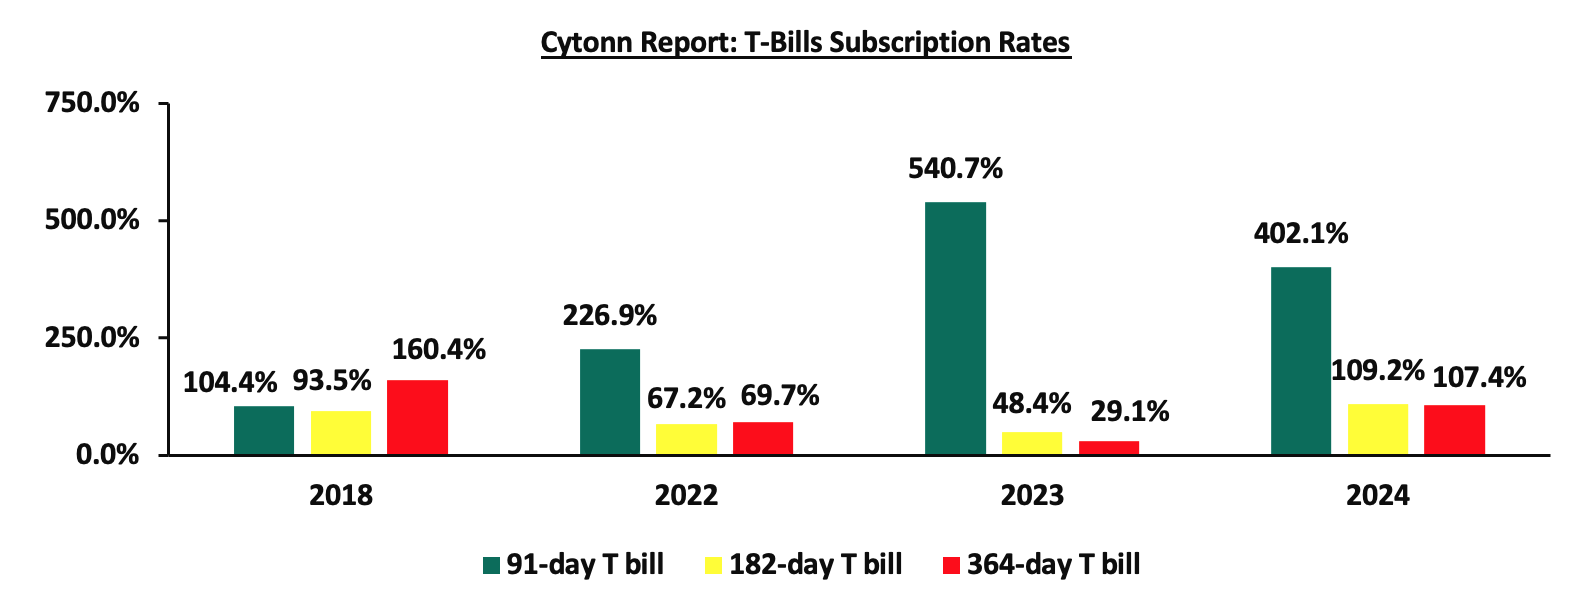
During the year, T-bills were oversubscribed, with the overall subscription rate coming in at 153.3%, up from 120.0% in FY’2023. Investors’ preference for the 91-day paper persisted as they sought to avoid duration risk, with the paper receiving bids worth Kshs 847.4 bn against the offered Kshs 212.0 bn, translating to an oversubscription rate of 399.7%, albeit lower than the oversubscription rate of 529.1% recorded in FY’2023. Overall subscription rates for the 364-day and 182-day papers came in at 103.0% and 104.9%, higher than the 29.0% and 48.5%, respectively, recorded in FY’2023. The average yields on the 364-day, 182-day, and 91-day papers were on an upward trajectory with the 182-day yields increasing the most by 330.6 bps to 15.7%, from 12.4% in 2023, while the 364-day and 91-day increased by 327.1 bps and 300.6 bps to 16.0% and 15.2% in 2024, from 12.8% and 12.2% in 2023, respectively. However, on y/y basis, the yields on the government papers registered significant decline in 2024 with the 91-day paper decreasing the most by 6.0% to close the year at 9.9% from the 15.9% recorded at the close of FY’2023, while the yields on the 182-day and 364-day decreased by 5.9% and 4.5% to close the year at 10.0% and 11.4%, from the 16.0% and 15.9%, respectively, recorded at the end of FY’2023. The year-on-year decline in yields is primarily driven by investors perceiving lower risks due to eased inflation, currency appreciation, and improved liquidity positions. As a result, there is less demand for higher returns to compensate for potential losses. The average acceptance rate during the period came in at 77.3%, albeit lower than the 92.5% recorded in FY’2023, with the government accepting a total of Kshs 1,507.3 bn out of the Kshs 1,949.4 bn worth of bids received. Notably, the decline in the government papers yields accelerated in December 2024 compared to November 2024, with the yields on the 91-day paper decreasing by 274.3 bps, compared to 190.8 bps decline that was recorded in November 2024, as the government manages the borrowing costs amid budgetary pressures;
Primary T-bond auctions in 2024 were generally oversubscribed, with bonds receiving bids worth Kshs 1,137.9 bn against the offered Kshs 665.0 bn, translating to an oversubscription rate of 171.1%, higher than the oversubscription rate of 128.5% recorded in 2023. The government accepted Kshs 867.8 bn of the Kshs 1,137.9 bn worth of bids received, translating to an acceptance rate of 76.3%. Additionally, in the primary bond market, the government is looking to raise Kshs 30.0 bn through the reopened fifteen year and twenty-five-year fixed coupon bonds; FXD1/2018/15 and FXD1/2022/25 with tenors to maturity of 8.3 years and 22.8 years respectively. The bonds will be offered at fixed coupon rates of 12.7% and 14.2% respectively. Our bidding range for the reopened bonds are 13.45%-13.85% and 15.65%-16.00% for the FXD1/2018/15 and FXD1/2022/25 respectively;
During the week, T-bills were undersubscribed for the fourth consecutive week, with the overall undersubscription rate coming in at 65.4%, higher than the undersubscription rate of 20.3% recorded the previous week. Investors’ preference for the shorter 91-day paper persisted, with the paper receiving bids worth Kshs 8.0 bn against the offered Kshs 4.0 bn, translating to an oversubscription rate of 199.7%, significantly higher than the undersubscription rate of 56.1% recorded the previous week. The subscription rates for the 182-day paper increased to 60.8% from the 4.4% recorded the previous week, while the subscription rate for the 364-day paper decreased to 16.3% from 21.9% recorded the previous week. The government accepted a total of Kshs 15.7 bn worth of bids out of Kshs 15.7 bn bids received, translating to an acceptance rate of 100.0%. The yields on the government papers recorded a mixed performance, with the yields on the 182-day paper increasing marginally by 0.4 bps to 10.03% from 10.02% recorded the previous week, while the yields on the 364-day and 91-day papers declined by 3.8 bps and 6.9 bps respectively to 11.37% and 9.83% from the 11.41% and 9.89% respectively recorded the previous week.
During the week, KNBS released the y/y inflation for December 2024 highlighting that inflation increased slightly by 0.2% points to 3.0%, from the 2.8% recorded in November 2024. This was however in contrary with our projection to a range of 2.4% to 2.7%, where our projection was mainly driven by expectations of reduced fuel prices in December, coupled with the stability of the Kenyan Shilling. The headline inflation in December 2024 was majorly driven by increase in prices of commodities in the following categories; Food & Non-Alcoholic Beverages, and Transport sector by 4.8% and 0.2% respectively. However, the commodity prices in Housing, Water, Electricity, Gas & other fuels declined by 0.2%;
Equities
During the year, the Kenyan equities market was on an upward trajectory, with NSE 10 gaining the most by 42.9%, while NSE 25, NASI and NSE 20 gained by 42.5%,34.3% and 33.3%, respectively. The equities market performance was driven by gains recorded by large-cap stocks such as KCB Group, SCBK, Absa Bank, Diamond Trust Bank Kenya, Bamburi, and EABL of 89.5%, 74.6%, 56.3%, 54.2%, 52.8%, and 51.0% respectively. The performance was, however, weighed down by losses by large-cap stocks such BAT of 11.5%.
In the banking sector, the Kenya listed banks recorded a weighted average increase in the core earnings per share of 24.6% in Q3’2023, compared to a weighted average increase of 11.2% in Q3’2023, while in the Insurance sector, the listed insurers recorded a weighted average increase in core earnings per share of 39.6% in H1’2024, significantly higher compared to the weighted decline of 235.5%, in H1’2023. During the year, 9 companies issued profit warnings, as compared to 15 companies in 2023, and 11 companies in 2022 an indication that the operating environment became slightly better in 2024 compared to the previous years. Some of the companies that issued profit warnings include Express Kenya and Kakuzi Plc. Additionally, during the year, the Nairobi Securities Exchange admitted the Linzi Sukuk on the NSE Unquoted Securities Platform (USP) making the product the first Shari’ah compliant product to be admitted on the platform. The NSE also delisted Acorn Green Bond and ILAM FAHARI-I REIT from the Nairobi Securities Exchange. Four companies remained suspended at the Nairobi Securities Exchange, namely, Deacons (East Africa) PLC, ARM Cement PLC, Mumias Sugar Co. Ltd. and Kenya Airways.
Additionally, during the year, HF Group released the results of its earlier approved rights issue, announcing that the rights were oversubscribed, with the oversubscription rate coming in at 138.3% having received offers worth Ksh 6.4 bn against the offered Ksh 4.6 bn. Notably, the Group accepted 474.2 million shares under the entitlement option against the offered 769.2 million, translating to an acceptance rate of 61.7%.
Additionally, during the year, Amsons Industries (K) Limited and Savannah Clinker made offers to acquire Bamburi Cement PLC. Later, the Capital Markets Authority (CMA) notified the shareholders of Bamburi Cement PLC and the public that Savannah clinker limited had withdrawn its competing offer on 4th December 2024 and that it had declined to extend the offer period by 60 days to enable the competing offer to respond to any inquiries. The sale of Bamburi Cement Plc shares to Amsons Industries (K) Limited, was approved by CMA without modifications;
Real Estate
In 2024, the general Real Estate sector continued to witness considerable growth in activity in terms of property transactions and development activities. Consequently, the sector’s activity contribution to Gross Domestic Product (GDP) grew by 6.0 % to Kshs 281.6 bn in Q2’2024, from Kshs 265.8 bn recorded during the same period in 2023. In addition, the sector contributed 10.3% to the country’s GDP, 0.2% points decrease from 10.5% recorded in Q2’2023. Cumulatively, the Real Estate and construction sectors contributed 18.9% to GDP, a 2.3% points improvement from 16.6% in Q2’2023. The Nairobi Metropolitan Area (NMA) residential sector recorded a slight downtrend in performance, with the average total returns to investors coming in at 5.8%, a 0.3%-point decline from 6.1% recorded in FY’2023. The performance was attributed to a decrease in the residential average y/y price appreciation which came in at 0.3% in FY’2024, 0.3%-points lower than the 0.6% appreciation recorded in FY’2023, driven by a tough economic environment during the year. On the other hand, the average rental yield came in at 5.4% in FY’2024, recording a 0.1%-points decline from the 5.5% rental yield recorded in FY’2023;
In statutory reviews, during the week, Nairobi's City Hall announced revised land rates effective January 1, 2025, aiming to align charges with current property values and enhance revenue collection transparency. Under the new structure, annual rates will be determined by land size and value. Plots under 0.1 ha will incur a fee of Kshs 2,560, those between 0.1 and 0.2 ha Kshs 3,200, plots ranging from 0.2 to 0.4 ha Kshs 4,000, and those exceeding 0.4 ha Kshs 4,800. Additionally, residential, commercial, and agricultural properties will be taxed at 0.1% of their land value annually;
In the Real Estate Investments Trusts, Centum Investment Company is set to introduce Kenya's first dollar-denominated Income Real Estate Investment Trust (I-REIT) at its Two Rivers development in Nairobi. This strategic move aims to attract international investors seeking exposure to Kenya's real estate market while mitigating currency risk. The proposed I-REIT will focus on income-generating properties within the Two Rivers precinct, including office spaces, retail outlets, and residential units. By denominating the fund in U.S. dollars, Centum seeks to provide a hedge against the volatility of the Kenyan shilling, offering more stable returns for foreign investors;
On the Unquoted Securities Platform, Acorn D-REIT and I-REIT traded at Kshs 25.4 and Kshs 22.2 per unit, respectively, as per the last updated data on 31st October 2024. The performance represented a 27.0% and 11.0% gain for the D-REIT and I-REIT, respectively, from the Kshs s 20.0 inception price. Additionally, ILAM Fahari I-REIT traded at Kshs 11.0 per share as of 31st October 2024, representing a 45.0% loss from the Kshs 20.0 inception price. The volume traded to date came in at 138,600 shares for the I-REIT, with a turnover of Kshs 1.5 mn since inception in November 2015;
Investment Updates:
- Weekly Rates: Cytonn Money Market Fund closed the week at a yield of 16.84% p.a. To invest, dial *809# or download the Cytonn App from Google Play store here or from the Appstore here;
- We continue to offer Wealth Management Training every Monday, from 10:00 am to 12:00 pm. The training aims to grow financial literacy among the general public. To register for any of our Wealth Management Trainings, click here;
- If interested in our Private Wealth Management Training for your employees or investment group, please get in touch with us through wmt@cytonn.com;
- Cytonn Insurance Agency acts as an intermediary for those looking to secure their assets and loved ones’ future through insurance namely; Motor, Medical, Life, Property, WIBA, Credit and Fire and Burglary insurance covers. For assistance, get in touch with us through insuranceagency@cytonn.com;
- Cytonn Asset Managers Limited (CAML) continues to offer pension products to meet the needs of both individual clients who want to save for their retirement during their working years and Institutional clients that want to contribute on behalf of their employees to help them build their retirement pot. To more about our pension schemes, kindly get in touch with us through pensions@cytonn.com;
Hospitality Updates:
- We currently have promotions for Staycations. Visit cysuites.com/offers for details or email us at sales@cysuites.com;
Global Economic Growth:
According to the World Bank's June 2024 Global Economic Prospects report, the global economy is projected to grow at 2.6% in 2024, matching the growth rate recorded in 2023. This forecast marks a slight downward revision from earlier projections, reflecting continued economic headwinds, particularly in the emerging markets. The World Bank’s growth projection is 0.6 percentage points lower than the IMF’s 2024 forecast of 3.2%. The lower growth is attributable to global inflationary pressures and continued tightening by central banks for much of 2024. However, recent developments indicate that some central banks, such as those in the United States and England, have cut interest rates in response to easing inflation, which could stimulate economic activity going forward. Notably, advanced economies are expected to record a 1.5% growth in 2024, remaining unchanged from the 1.5% expansion recorded in 2023. However, emerging markets and developing economies are projected to expand by 4.0% in 2024, lower than 4.2% growth in 2023. The expected slowed down in global economic growth in 2024 as compared to 2023 is majorly attributable to;
- The elevated global inflationary pressures which have necessitated the hiking of interest rates by some central banks around the world with the aim of anchoring inflation. The global inflation is forecasted to ease slightly to 6.9% in 2024, from 8.7% in 2023,
- Tight global financial conditions occasioned by high cost of borrowing which have increased risks of debt distress in emerging economies. Although some central banks, including the U.S. Federal Reserve and Bank of England, have begun easing monetary policies, global financial conditions remain tight due to the lagging impact of past rate hikes, which continue to raise borrowing costs and heighten debt distress risks, especially in emerging economies, and,
- Persistent supply chain constraints worsened by the ongoing Russia-Ukraine conflict which has impacted global fuel and food prices. Consequently, the high energy prices have increased inflationary pressures as well as contributed to currency depreciation as dollar demand increases especially in Emerging Markets and Developing Economies.
The global economy is expected to remain subdued in the short term mainly as a result of persistent inflationary pressures as well as tightening of monetary policies which are expected to weigh down on economic activity. Furthermore, the global economy’s future performance is majorly dependent on how soon the inflationary pressures will ease, which will see central banks ease their monetary policies hence boosting economic activity.
Global Commodities Market Performance:
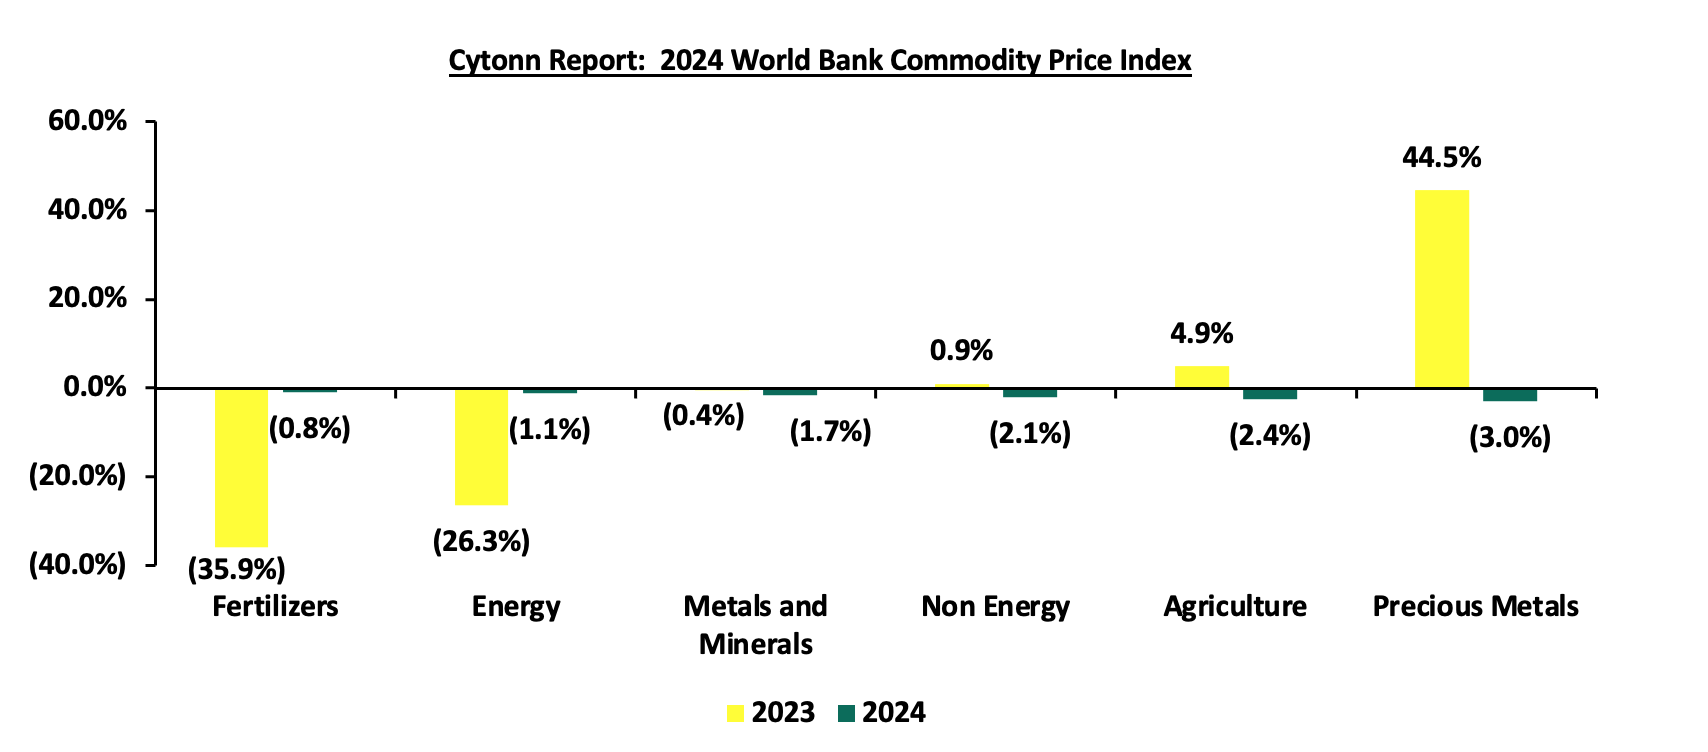
Global commodity prices were on a downward trajectory in 2024, with prices of precious metals decreasing the most by 3.0% compared to the 44.5% increase recorded in 2023, mainly as a result of reduced demand from key markets, particularly China, and increased global production. Similarly, prices of agricultural commodities decreased by 2.4% in 2024, compared to a 4.9% increase in the same period last year, while prices of Non-Energy commodities, Metals & Minerals, Energy, and Fertilizers declined by 2.1%, 1.7%, 1.1%, and 0.8% respectively, on the back of ample supply due to strong harvests and increased production, coupled with subdued global demand. The chart below shows a summary of the performance of various commodities.
Global Equities Market Performance:
The global stock market recorded mixed performance in 2024, with most indices in the developed countries recording gains during the period, largely attributable to increased investor sentiments as a result of continued economic recovery following the full reopening of the economies coupled with investor preference for the stock markets in the developed countries. Notably, NASI was the best performer during the period, recording a gain at 61.8% in 2024 largely driven by gains in the large-cap stocks in the financial sector and a much stronger Shilling. NGSE ASI was the largest decliner, recording losses of 20.9% with the performance being skewed by the weakening of the Nigerian Naira following a recent decision by the Central Bank of Nigeria to adopt a floating exchange rate regime. Below is a summary of the performance of key indices as at the end of 2024;
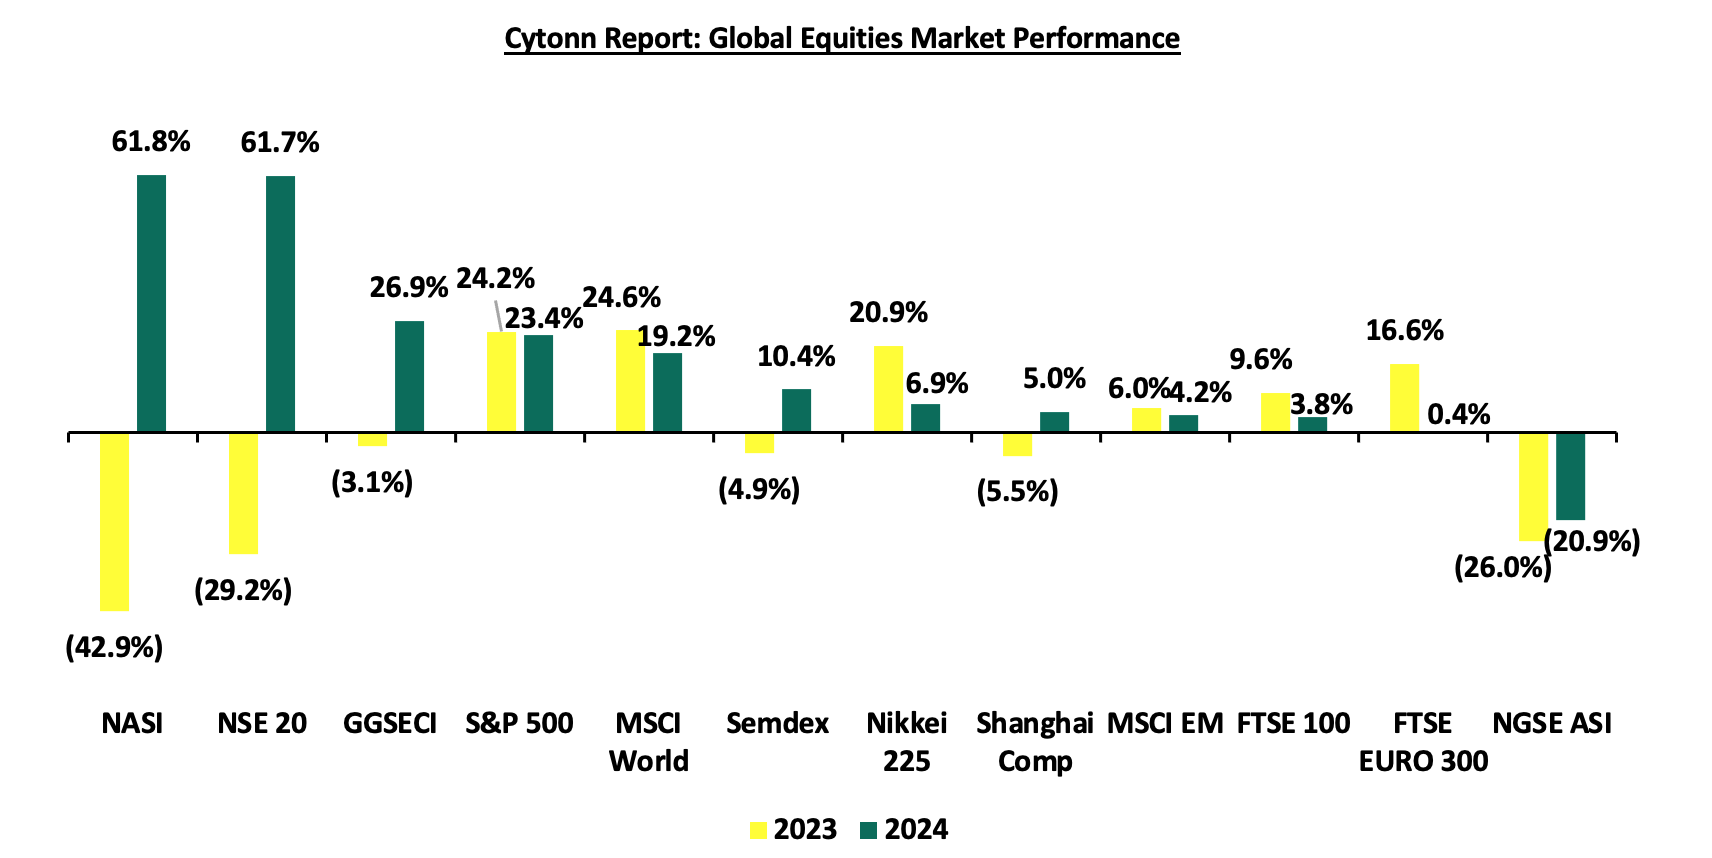
*The index values are dollarized for ease of comparison
According to the World Bank, the Sub-Saharan African economy is projected to grow at a rate of 3.0% in 2024, 0.6% points higher than the 2.4% recorded in 2023. Notably, the projection was revised downwards from the earlier forecast of 3.4%. The downward revision of the regional growth by the IMF is mainly due to the destruction of Sudan's economy in a civil war, weak external demand, tight global financial conditions and high inflationary pressures in most countries. Additionally, public debt is expected to remain high due to increased debt serving costs as a result of continued currency depreciation in the region and high interest rates in developed economies. The decline in the region’s economic growth is attributable to;
- The heightened inflationary pressures following the Russia-Ukraine conflict which has prompted higher interest rates worldwide leading to slowing international demand, elevated spreads, and ongoing exchange rate pressures,
- Rising risk of debt distress in the region is expected to weigh down on the region’s growth due to increased debt-serving costs as a result of continued currency depreciation and high interest rates in developed economies, and,
- High interest rates in developed economies have led to a decline in foreign capital in the region further fueling the economic decline in the SSA.
Currency Performance
In 2024, most of the select Sub-Saharan currencies depreciated against the US Dollar, mainly attributable to the elevated inflationary pressures in the region, high debt servicing costs that continue to dwindle foreign exchange reserves, and monetary policy tightening by advanced economies. The high interest rates in developed countries have led to massive capital outflows from the region as investors, both institutional and individual seek to take advantage of the higher returns offered in developed economies. Further, the elevated inflationary pressures in most economies in the region puts pressure on the value of local currencies due to expensive importation. The table below shows the performance of select African currencies against the USD;
|
Cytonn Report: Select Sub-Saharan Africa Currency Performance vs USD |
|||||
|
Currency |
Dec-22 |
Dec-23 |
Dec-24 |
2023 y/y change (%) |
2024 y/y change (%) |
|
Kenyan Shilling |
123.4 |
156.5 |
129.3 |
(26.8%) |
17.4% |
|
Tanzanian Shilling |
2334.0 |
2540.0 |
2394.8 |
(8.8%) |
5.7% |
|
Ugandan Shilling |
3683.0 |
3815.0 |
3670.3 |
(3.6%) |
3.8% |
|
South African Rand |
17.4 |
18.3 |
18.7 |
(5.1%) |
(2.3%) |
|
Malawian kwacha |
1026.6 |
1683.4 |
1734.0 |
(64.0%) |
(3.0%) |
|
Botswana Pula |
12.8 |
13.4 |
13.9 |
(5.1%) |
(3.9%) |
|
Senegal CFA Franc |
601.3 |
602.8 |
638.9 |
(0.2%) |
(6.0%) |
|
Mauritius Rupee |
44.4 |
44.5 |
47.5 |
(0.2%) |
(6.7%) |
|
Zambian Kwacha |
19.0 |
25.7 |
27.9 |
(35.2%) |
(8.4%) |
|
Ghanaian Cedi |
8.6 |
11.9 |
14.7 |
(38.5%) |
(23.7%) |
|
Nigerian Naira |
448.1 |
899.4 |
1535.3 |
(100.7%) |
(70.7%) |
Key take outs from the table include:
- The Kenya Shilling appreciated the most by 17.4% in 2024 to close at Kshs 129.3 against the US Dollar, compared to Kshs 156.5 recorded at the beginning of the year, driven by improved forex reserves currently at USD 9.0 bn (equivalent to 4.6-months of import cover), which is above the statutory requirement of maintaining at least 4.0-months of import cover and the EAC region’s convergence criteria of 4.5-months of import cover coupled with the successful issuance of a USD 1.5 billion Eurobond in February 2024 to refinance the maturing June 2024 Eurobond which reduced Kenya's immediate repayment risks, and,
- The Nigerian Naira was the worst performer during the year, depreciating by 29.1% against the dollar, attributable to the deteriorated macroeconomic environment, evidenced by its elevated inflation, with the December 2024 inflation rate coming in at a record of 34.6% compared to 28.9% recorded in December 2023. Further, the recent decision by the Central Bank of Nigeria to adopt floating exchange rate regime, where the currency value of the Naira is allowed to vary according to the foreign exchange market hence making the overvalued naira to undergo a massive devaluation, broadly aligning the currency with its black-market rate.
African Eurobonds:
Africa’s appetite for foreign-denominated debt has increased in recent times with the latest issuers during year being Ivory Coast, Benin, Kenya, Senegal and Cameroon raising a total of USD 2.6 bn, USD 0.8 bn, USD 1.5 bn, USD 0.8 bn and USD 0.6 bn respectively. Notably, all the bonds were oversubscribed with the high support being driven by the yield hungry investors and also the outlook of positive recovery in the regional economies. It is good to note that there was a general decline in the yields of the various bonds from different countries due to general improvement in investor sentiment as the economy recovers and the easing inflationary pressures in the region. The yields of the Benin’s 13-year Eurobond maturing in 2032 decreased marginally by 0.9% points to 7.2% as at the end of December 2024 from 8.0% recorded at the beginning of the year. Similarly, the yields of the Kenya’s 10-year Eurobond maturing in 2028 decreased by 1.4% points to 9.0% as at the end of December 2024 from 10.4% at the beginning of the year, partly attributable to improved investor confidence following the successful buy-back of the 2024 Eurobond maturity, increased IMF Credit funding and the strengthening of the Kenyan shilling against the dollar. Below is a graph showing the Eurobond secondary market performance of select Eurobonds issued by the respective countries.

Equities Market Performance:
Sub-Saharan Africa (SSA) stock markets recorded mixed performance in 2024, with the Nairobi All Share Index (NASI) being best performing market gaining by 61.8% in 2024 largely driven by gains in the large-cap stocks in the financial sector following improved earnings during the period, well supported by easing inflation and a stronger Shilling. In addition, the improved macroeconomic environment supported by the IMF financial assistance has continued to accelerate investor confidence in the country. Notably, Nigeria all share index declined by 20.9% in 2024, due to the aggressive depreciation of the Nigerian Naira against the dollar having depreciated by 29.1% in 2024 which has resulted to increased capital outflows in the country. Additionally, the reduction in oil production in Nigeria has led to the contraction of many key sectors of the economy considering that the country’s economy is highly dependent on crude oil exports. Below is a summary of the performance of the key SSA indices;
|
Cytonn Report: Equities Market Performance |
||||||
|
Country |
Index |
Dec-22 |
Dec-23 |
Dec-24 |
2023 y/y change (%) |
2024 y/y change (%) |
|
Kenya |
NASI |
1.0 |
0.6 |
1.0 |
(42.9%) |
61.8% |
|
Uganda |
USEASI |
0.3 |
0.2 |
0.3 |
(32.0%) |
45.4% |
|
Zambia |
LASILZ |
389.5 |
420.6 |
577.1 |
8.0% |
37.2% |
|
Ghana |
GSECI |
195.5 |
254.5 |
330.7 |
30.2% |
29.9% |
|
Tanzania |
DARSDEI |
0.8 |
0.7 |
0.9 |
(15.6%) |
25.3% |
|
South Africa |
JALSH |
4,317.1 |
4,137.9 |
4,494.3 |
(4.2%) |
8.6% |
|
Rwanda |
RSEASI |
0.1 |
0.1 |
0.1 |
(15.7%) |
(7.1%) |
|
Nigeria |
NGEASI |
114.6 |
84.9 |
67.1 |
(26.0%) |
(20.9%) |
|
*The index values are dollarized for ease of comparison |
||||||
The tough macroeconomic environment experienced in the region is expected to slow down economic growth. As such, subdued GDP growth rate in Sub-Saharan Africa is expected to continue in 2024, in line with the rest of the global economy. Elevated inflation rates, debt sustainability concerns, and supply chain constraints in the region are expected to persist in 2024, and this will continue to weigh down its economic growth. Additionally, the continued weakening of local currencies will even make debt servicing costlier, and this will lead to increased perceived risks in the region, resulting in reduced investor confidence in the region.
Economic Growth:
According to the Kenya National Bureau of Statistics (KNBS) Q2’2024 Quarterly Gross Domestic Product Report, the Kenyan economy recorded a 4.6% growth in Q2’2024, slower than the 5.6% growth recorded in Q2’2023. The main contributor to Kenyan GDP remains to be the Agriculture, Fishing and Forestry sector which grew by 4.8% in Q2’2024, lower than the 7.8% expansion recorded in Q2’2023. Most sectors recorded lower growth rates compared to Q2’2023 with Accommodation and Food Services and Financial & Insurance recording growth of 26.6%, 5.1%, compared to, 42.8%, 13.2% growth in Q2”2023 respectively. The slowed growth in the economy could be attributed to the still elevated fuel prices which made production more expensive and negatively impacted the business environment and the unrest caused by the anti-finance bill protests in June. The Kenyan Economy is projected to grow at an average of 5.3% in 2024 according to various organizations as shown below:
|
Cytonn Report: Kenya 2024 Growth Projections |
||
|
No. |
Organization |
2024 GDP Projections |
|
1 |
International Monetary Fund |
5.3% |
|
2 |
National Treasury |
5.5% |
|
3 |
World Bank |
5.2% |
|
4 |
Fitch Solutions |
5.2% |
|
5 |
Cytonn Investments Management PLC |
5.4% |
|
Average |
5.3% |
|
Source: Cytonn Research
In 2024, the Kenyan economy is projected to grow at an average of 5.3%, lower than the growth of 5.6% observed in 2023. The slower growth is primarily attributable to reduced private sector activity and ongoing fiscal consolidation efforts by the government, which have limited public spending. Additionally, political instability during the year, fueled by anti-finance bill protests and opposition against the current regime, has undermined investor confidence and disrupted economic activities. This instability is expected to further weigh on economic growth.
Business conditions in the Kenyan private sector recorded an improvement during the year, with the average Stanbic Bank Monthly Purchasing Managers’ Index (PMI) for the first eleven months averaging at 49.5, 1.5 points higher than the average of 48.0 recorded during a similar period in 2023. Similarly, PMI for the month of November 2024 came in at 50.9, up from 50.4 in October 2024 signaling an uptick of the business environment for the second consecutive month. This was majorly attributable to stable fuel prices and a decrease in borrowing costs, which resulted to the increase sales to its strongest performance in six months. The chart below shows the trend of Kenya’s Purchasing Managers index for the last 24 months;
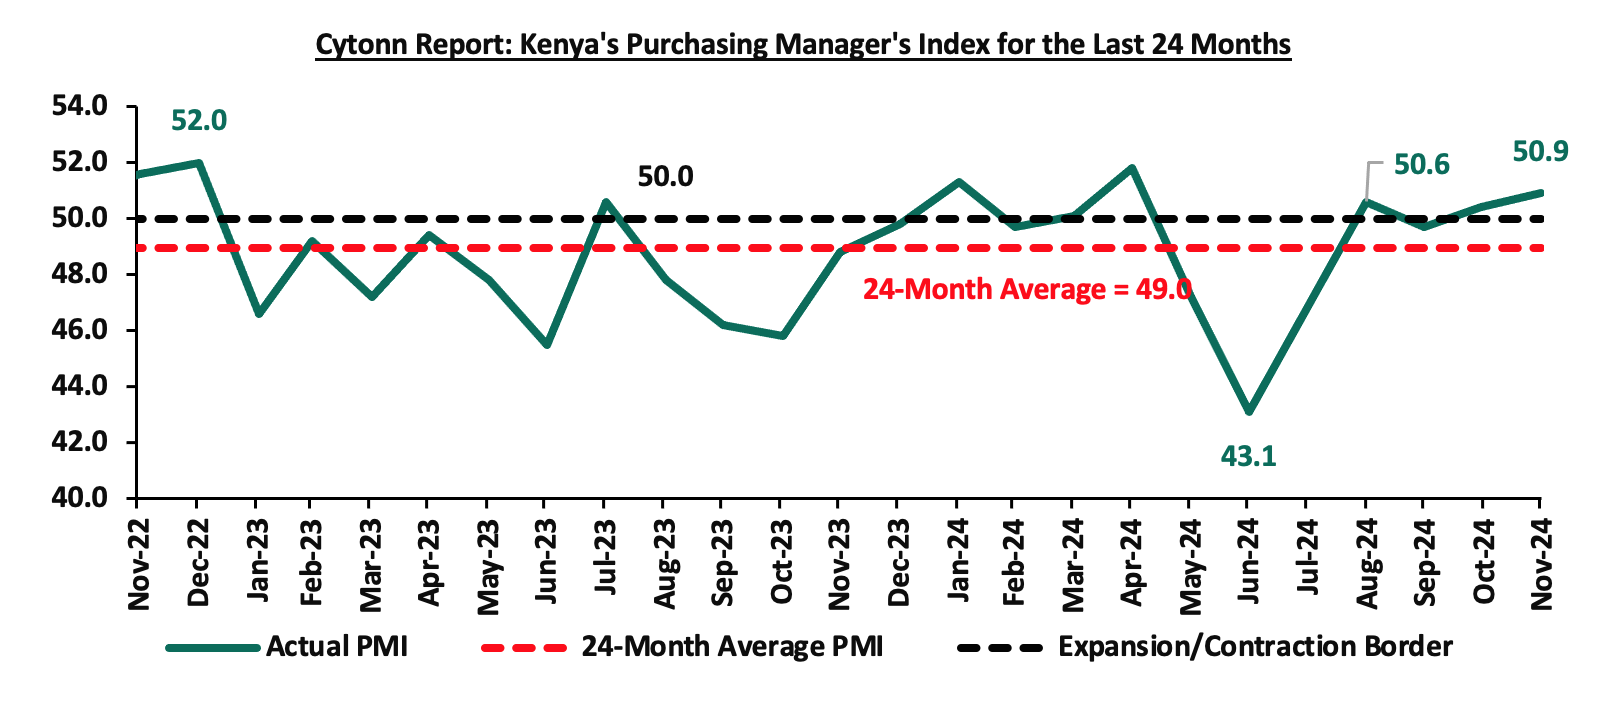
Source: Stanbic PMI
Kenyan Shilling:
The Kenya Shilling appreciated by 17.4% against the US Dollar to close at Kshs 129.3 in 2024, compared to Kshs 156.5 at the end of 2023, a contrast to the 26.8% depreciation recorded in 2023. The chart below highlights the performance of the Kenyan Shilling against the US Dollar in 2024;
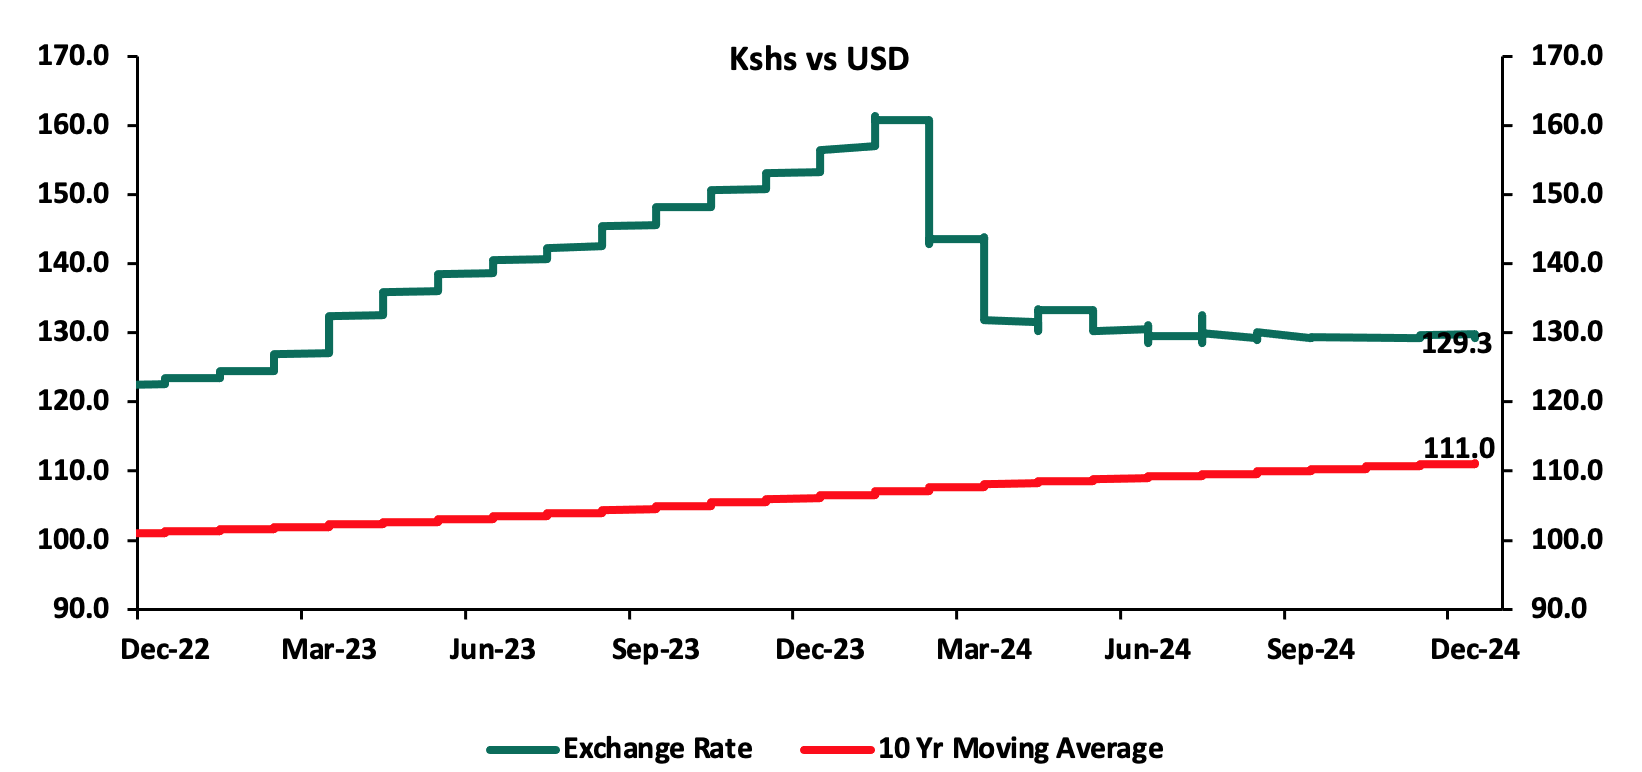
Source: Central Bank of Kenya
The appreciation of the Kenyan shilling in 2024 was driven by;
- Improved diaspora remittances standing at a cumulative USD 4,872.0 mn in the 12 months to November 2024, 16.7% higher than the USD 4,175.0 mn recorded over the same period in 2023. In the November 2024 diaspora remittances figures, North America remained the largest source of remittances to Kenya accounting for 53.4% in the period,
- CBK’s supportive activities in the money market, such as repurchase agreements and selling of dollars,
- Foreign loan disbursements, with the government receiving a total USD 3.1 bn out of the committed USD 3.6 bn from International Monetary Fund (IMF) as of November 2024 under the 38-month Extended Fund Facility (EFF) and Extended Credit Facility (ECF), as well as USD 180.4 mn out of the committed USD 541.3 mn from the Resilience Sustainability Facility (RSF) following the completion of the second review in November 2024, and,
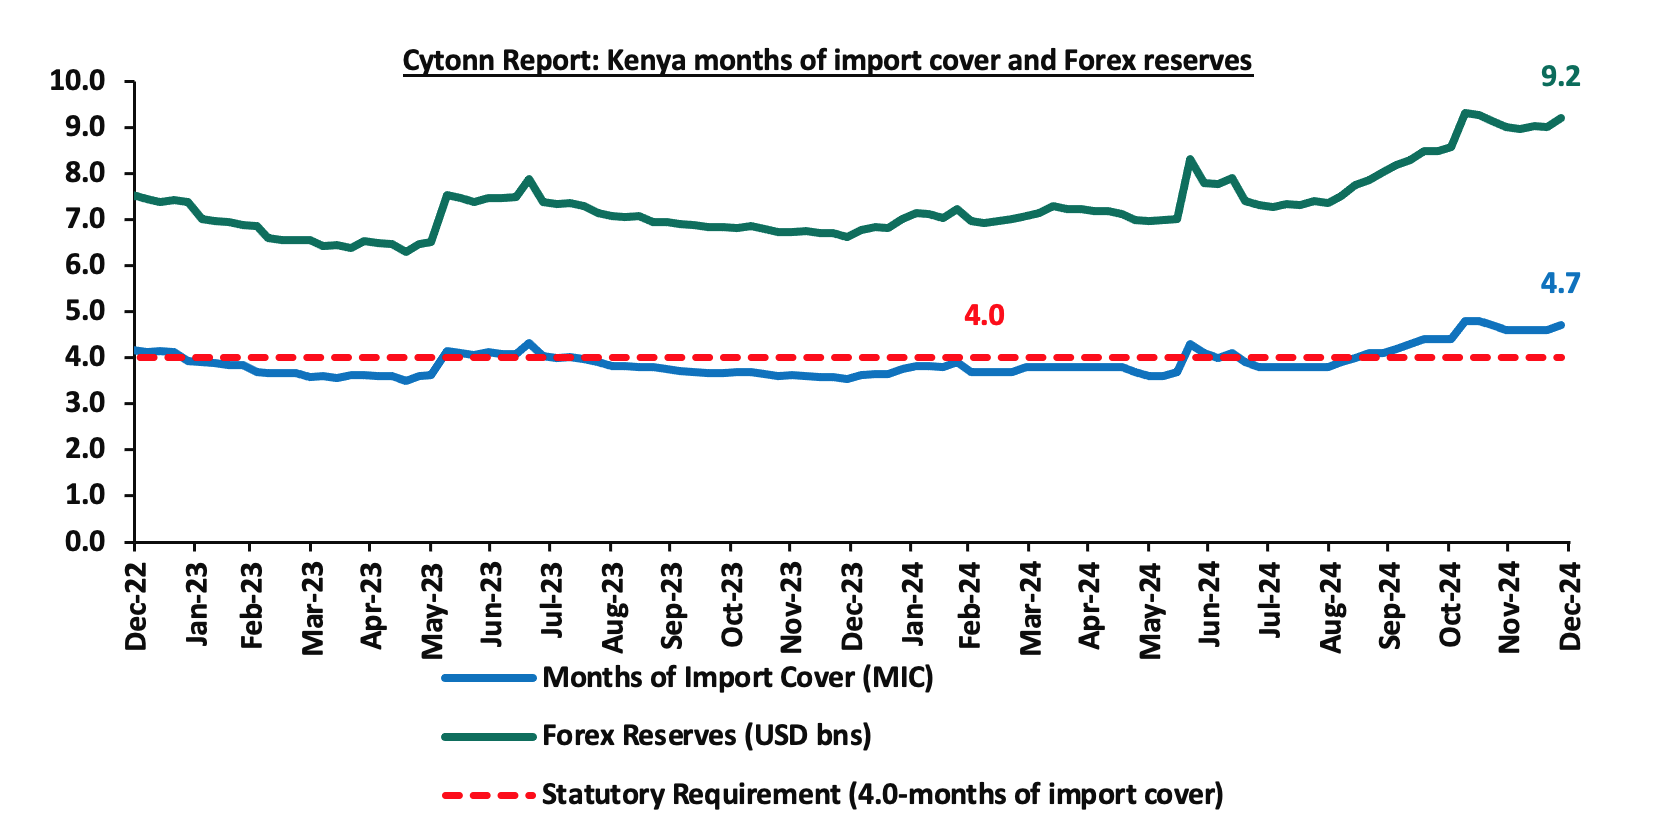
- Improved forex reserves currently at USD 9.2 bn (equivalent to 4.7-months of import cover), which is above the statutory requirement of maintaining at least 4.0-months of import cover and the EAC region’s convergence criteria of 4.5-months of import cover. The following is a graph showing Kenya months of import cover and forex reserves for the last 10 years;
Source: Central Bank of Kenya
The shilling was however weighed down by:
- An ever-present current account deficit which came at 3.8% of GDP in Q2’2024 from 3.7% recorded in a similar period last year. Key to note, the current account deficit narrowed by 34.5% to Kshs 104.1 bn from Kshs 159.0 bn in Q2’2023. The y/y narrowing of the current account was brought about by the 3.7% narrowing in Merchandise trade deficit to Kshs 341.2 bn in Q2’2024, from Kshs 354.3 bn in Q2’2023 driven by the 10.9% growth in merchandise exports to Kshs 276.2 bn, from Kshs 249.1 bn in Q2’2023 which outpaced the 2.3% increase in merchandise imports to Kshs 617.5 bn from Kshs 603.4 bn recorded in a similar period in 2023, and,
- The need for government debt servicing, continues to put pressure on forex reserves given that 67.2% of Kenya’s external debt is US Dollar-denominated as of June 2024.
The Kenyan shilling gained by 17.4% in 2024 to close the year at Kshs 129.3. We expected the shilling to remain within a range of Kshs 183.2 and Kshs 189.6 against the USD by the end of 2024 with a bias towards a 16.4% depreciation by the end of the year. The shilling’s appreciation against the USD dollar overshot our projection due to the aggressive mechanism by the CBK to allow the currency exchange rate reach an equilibrium hence hitting its true value as well the USD 1.5 bn Eurobond buyback in February. Read on our outlook on Performance of Kenya Currency. Looking ahead, we expect the currency to continue to remain steady in the short term with CBK's interventions and favorable foreign exchange inflows likely to play a crucial role in mitigating excessive volatility.
Inflation:
The inflation rate for the year 2024 averaged at 4.5%, compared to 7.7% recorded in 2023. Notably, the y/y inflation in December 2024 increased slightly by 0.2% points to 3.0%, from the 2.8% recorded in November 2024. The headline inflation in December 2024 was majorly driven by increases in prices of commodities in the following categories; Food & Non-Alcoholic Beverages, and Transport sector by 4.8% and 0.2% respectively. However, the commodity prices in Housing, Water, Electricity, Gas & other fuels declined by 0.2%.
Going forward, we expect inflation to remain within the CBK’s preferred range of 2.5%-7.5%, mainly on the back of a stronger currency and stable fuel prices. Additionally, favourable weather conditions will also contribute to stabilizing of food prices, further supporting lower inflation rates. The risk, however, lies in the fuel prices which despite their decline over the last months, still remain elevated compared to historical levels. Key to note is that the Monetary Policy Committee cut the Central Bank Rate by 75.0 bps to 11.25% from 12.00% in its December 2024 meeting. This cut in the Central Bank Rate is likely to elevate inflationary pressures as consumer spending rises leading to demand- pull inflation. The committee is expected to lower rates further , though gradually, to provide further support for the economy.
Monetary Policy:
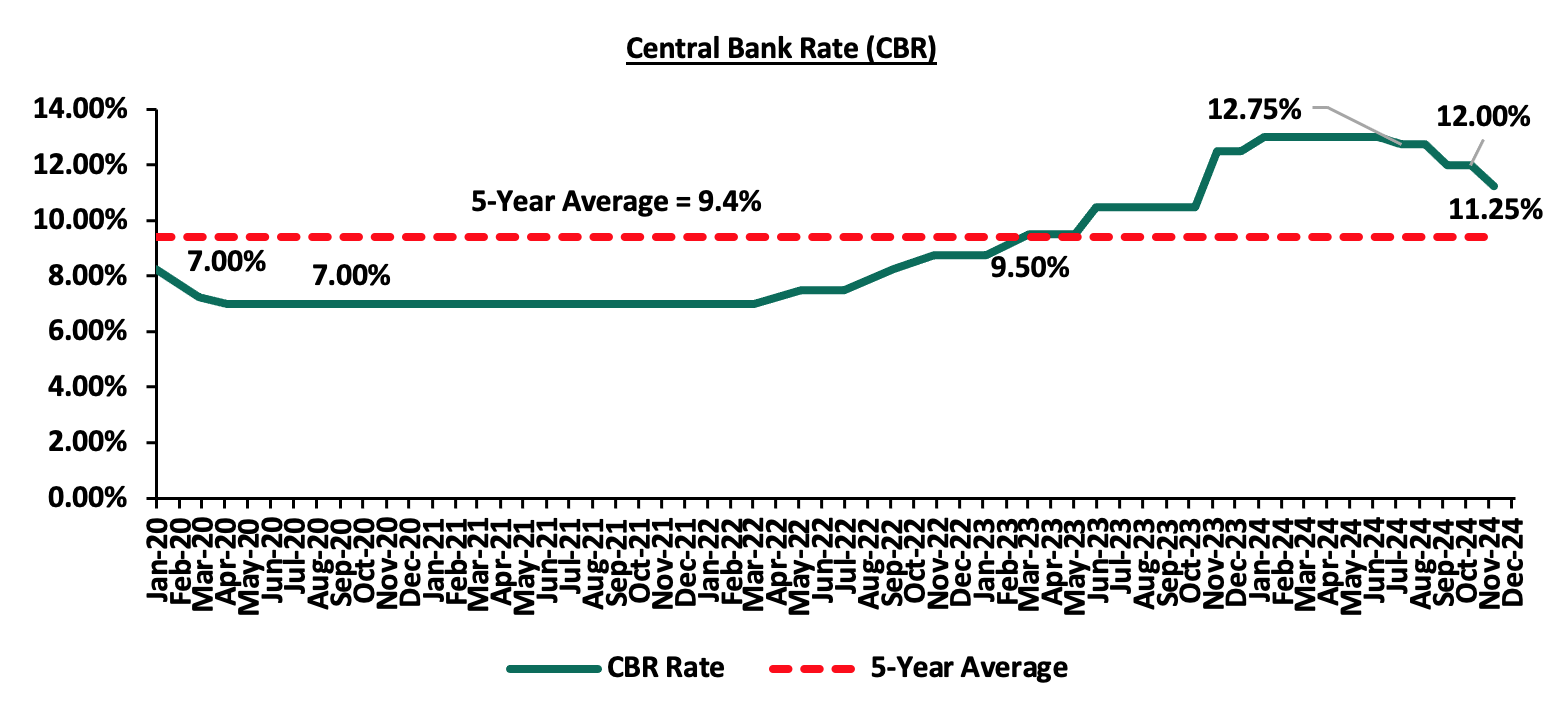
During the year the Monetary Policy Committee (MPC) met 6 times where it raised the Central Bank Rate (CBR) to 13.00% from 12.50% in the first meeting held in February. The MPC then retained the rate in its April and June sittings, in a bid to stabilize the currency and anchor inflation. In August, the MPC initiated a series of rate cuts, lowering the CBR by 25.0 bps to 12.75%, followed by a further reduction of 75.0 bps to 12.00% in October on the back of a strengthened and stable currency, easing inflation which fell below the mid-point of the CBK’s target of a range 0f 2.5% - 7.5%. In its latest meeting held in December, the MPC lowered the CBR rate by 75.0 bps to 11.25%, from 12.00% which was in line with our expectation for the MPC to lower the CBR rate. Our expectation to cut the rate was mainly on the back of rate cuts by some major economies, a stable exchange rate, anchored inflationary pressures, with inflation coming in at 2.8% in November 2024, marginally up from 2.7% in October 2024, as well as the need to support the economy by adopting an accommodative policy that will ease financing activities. In total, MPC lowered the rates in 2024 by 1.75%, from 13.00% in February to 11.25% in December. We expect the MPC to continue lowering the rates in the short to medium term therefore lowering borrowing costs, leading to increased spending and an uptick in the business environment as well as reduced debt servicing costs for the government, and anchoring private sector credit growth, noting that its previous measures have successfully reduced overall inflation to below the mid-point of the target range of 2.5% - 7.5%, stabilized the exchange rate, and anchored inflationary expectations. The following is a graph highlighting the Central Bank Rate for the last 5 years;
Source: Central Bank of Kenya
2024 Key Highlights:
- FY’2024/2025 Budget Policy Statement
- On 13 June 2024, the National Treasury presented Kenya’s FY’2024/2025 National Budget to the National Assembly highlighting that the total budget estimates for FY’2024/25 increased by 3.1% to Kshs 4.0 tn from the Kshs 3.9 tn in FY’2023/2024 while the total revenue inclusive of grants increased by 15.2% to Kshs 3.4 tn from the Kshs 2.9 tn in FY’2023/2024. The increase is mainly due to an 18.5% increase in ordinary revenue to Kshs 2.9 tn for FY’2024/2025, from the Kshs 2.5 tn in FY’2023/24. For more information, please read our Budget Review Note.
- On July 12, 2024, the National Treasury presented the Supplementary Estimates I for the Fiscal Year 2024/25 to the National Assembly. This presentation outlined plans to adjust the FY’2024/25 Budget Estimates to align with the Revised Fiscal Framework and implement expenditure cuts, following the withdrawal of Finance Bill 2024 which sought to raise Kshs 344.3 bn. The recurrent expenditure (Costs incurred to cover regular government expenses such as salaries, operational costs and maintenance costs) decreased by 2.1% to Kshs 1,598.0 bn in the Supplementary Estimates I from Kshs 1,632.1 bn in the original estimates, an indication of the government's initiative to cut expenditure cuts while still boosting public services, responding to economic growth and ensuring the well-being of its citizens. For more information please see our Supplementary Budget Estimates I Note
- Credit Facilities extended to Kenya
- The Executive Board of the International Monetary Fund (IMF) concluded the 2023 Article IV consultation with Kenya together with the sixth reviews and augmentations of access of USD 941.2 mn (Kshs 151.3 bn) under the Extended Fund Facility (EFF) and the Extended Credit Facility (ECF) arrangements, and the first review under the 20-month Resilience and Sustainability Facility (RSF) arrangement, approved in July 2023. Please see our Cytonn Weekly 03/2024,
- The International Monetary Fund (IMF) team and Kenyan authorities reached a staff-level agreement for the seventh reviews of Kenya’s economic program supported by the IMF’s Extended Fund Facility (EFF) and Extended Credit Facility (ECF), and the second Review under the Resilience Sustainability Facility (RSF). Notably, the discussions considered Kenya’s request for an augmentation under the EFF/ECF arrangement and the RSF, which if approved by the IMF executive board, will lead to a potential total commitment of more than USD 3.6 bn during the program's duration. Furthermore, the IMF team and Kenyan authorities agreed on a set of comprehensive policies and reforms needed to complete the seventh review, entailing corrective measures to safeguard debt sustainability, and fiscal discipline following a slip in FY’2023/24 budget, where the government in expected to miss out on its revenue targets. Please see our Cytonn Weekly 24/2024, and,
- The International Monetary Fund (IMF) Executive Board completedthe seventh and eighth reviews under the Extended Fund Facility (EFF) and Extended Credit Facility (ECF), alongside a review under the Resilience Sustainability Facility (RSF). This decision enables the immediate disbursement of approximately USD 606.1 mn to support Kenya’s efforts to stabilize its economy, address fiscal challenges, and enhance resilience to climate-related shocks. The IMF’s approval allows Kenya to receive USD 485.8 mn under the EFF/ECF arrangements, aimed at reducing Kenya’s debt vulnerabilities, safeguarding funds for social and developmental priorities, and supporting broader economic reforms and USD 120.3 mn under the RSF, which focuses on reinforcing Kenya's climate-related initiatives and catalysing additional private sector climate finance. Please see our Cytonn Monthly October 2024 for more information.
- FY’2023/2024 KRA Revenue Performance
In July 2024, the Kenya Revenue Authority (KRA) released the annual revenue performance for FY’2023/24, highlighting that revenue mobilization for the period grew by a notable 11.1% up from 6.4% growth in the previous financial year, after KRA collected Kshs 2.4 tn compared to Kshs 2.2 tn in the previous financial year. This translates to a performance rate of 95.5% against the target. Please see our Cytonn Weekly 28/2024,
- Balance of Payments
Kenya National Bureau of Statistics released the Q2’2024 Balance of Payment Report, noting that Kenya’s balance of payments position deteriorated by 45.0% in Q2’2024 with a reduction of the surplus to Kshs 84.1 bn, from a surplus of Kshs 152.9 bn in Q2’2023 but was a significant improvement from the Kshs 36.0 bn deficit recorded in Q1’2024. Please see our Cytonn Weekly 37/2024,
- Current account
Kenya’s current account deficit narrowed by 34.5% to Kshs 104.1 bn in Q2’2024 from the Kshs 159.0 bn deficit recorded in Q2’2023. The y/y contraction registered was driven by the narrowing of the merchandise trade account deficit (the value of import goods exceeds the value of export goods, resulting in a negative net foreign investment) by 3.7% to Kshs 341.2 bn in Q2’2024, from Kshs 354.3 bn recorded in Q2’2023, a 59.1% improvement in the secondary trade balance to a surplus of Kshs 43.6 bn from a surplus of Kshs 27.4 bn in Q2’2023, and, the narrowing of the primary income deficit (the earnings that residents of a country receive from their investments abroad and the compensation they receive for providing labour to foreign entities) by 34.6% to Kshs 45.6 bn in Q2’2024, from Kshs 69.8 bn recorded in Q2’2023.
- Credit Ratings
- On July 8th 2024, the global ratings agency, Moody’s announced its revision of Kenya’s credit score, downgrading it to Caa1 from a credit rating of B3 while maintaining a negative outlook, on the back of on the back of of the government's decision to forgo proposed tax increases through the Finance Bill 2024 and rely on expenditure cuts, significantly impacting Kenya's fiscal trajectory and financing needs. The downgrade of Kenya's rating indicates a greatly reduced ability to implement fiscal consolidation measures focused on revenue, which are necessary to improve debt affordability and reduce overall debt. Please see our Cytonn Weekly 30/2024.
- On 2nd August 2024 the global ratings agency, Fitch Ratings announced its revision of Kenya’s credit score, downgrading it to B- from a credit rating of B while also revising the outlook to stable, from a negative outlook affirmed on 16th February 2024. Their decision comes on the back of the government's decision to forgo proposed tax increases through the Finance Bill 2024 and rely on expenditure cuts, significantly impacting Kenya's fiscal trajectory and financing needs. The downgrade follows Moody’s downgrading Kenya’s IDR to Caa1 from a credit rating of B3 while maintaining a negative outlook on July 8th Please see our Cytonn Weekly 32/2024, and,
- On 23rd August 2024 S&P Global Ratings announced its revision of Kenya’s long-term sovereign credit rating, downgrading it to B-, and a stable outlook from a credit rating of B and a negative outlook, on the back of the government's decision to forgo proposed tax increases through the Finance Bill 2024 and rely on expenditure cuts, significantly impacting Kenya's fiscal trajectory and financing needs. Please see our Cytonn Weekly 34/2024. For more information, see our, Cytonn Q3'2024 Markets Review. Below is a summary of the credit rating on Kenya by various rating agencies;
|
Cytonn Report: Kenya’s Credit Ratings |
||||||
|
Rating Agency |
Previous Rating |
Previous Outlook |
Current Rating |
Current Outlook |
Meaning |
Date Released |
|
Moody's Rating |
B3 |
Negative |
Caa1 |
Negative |
Substantial credit risks |
8th July, 2024 |
|
Fitch Ratings |
B |
Negative |
B- |
Stable |
Highly Speculative |
2nd August 2024 |
|
S&P Global |
B |
Negative |
B- |
Stable |
Extremely high risk, very vulnerable to default |
23rd August 2024 |
Source: Fitch Ratings, S&P Global, Moody’s
2024 Returns by Various Asset Classes:
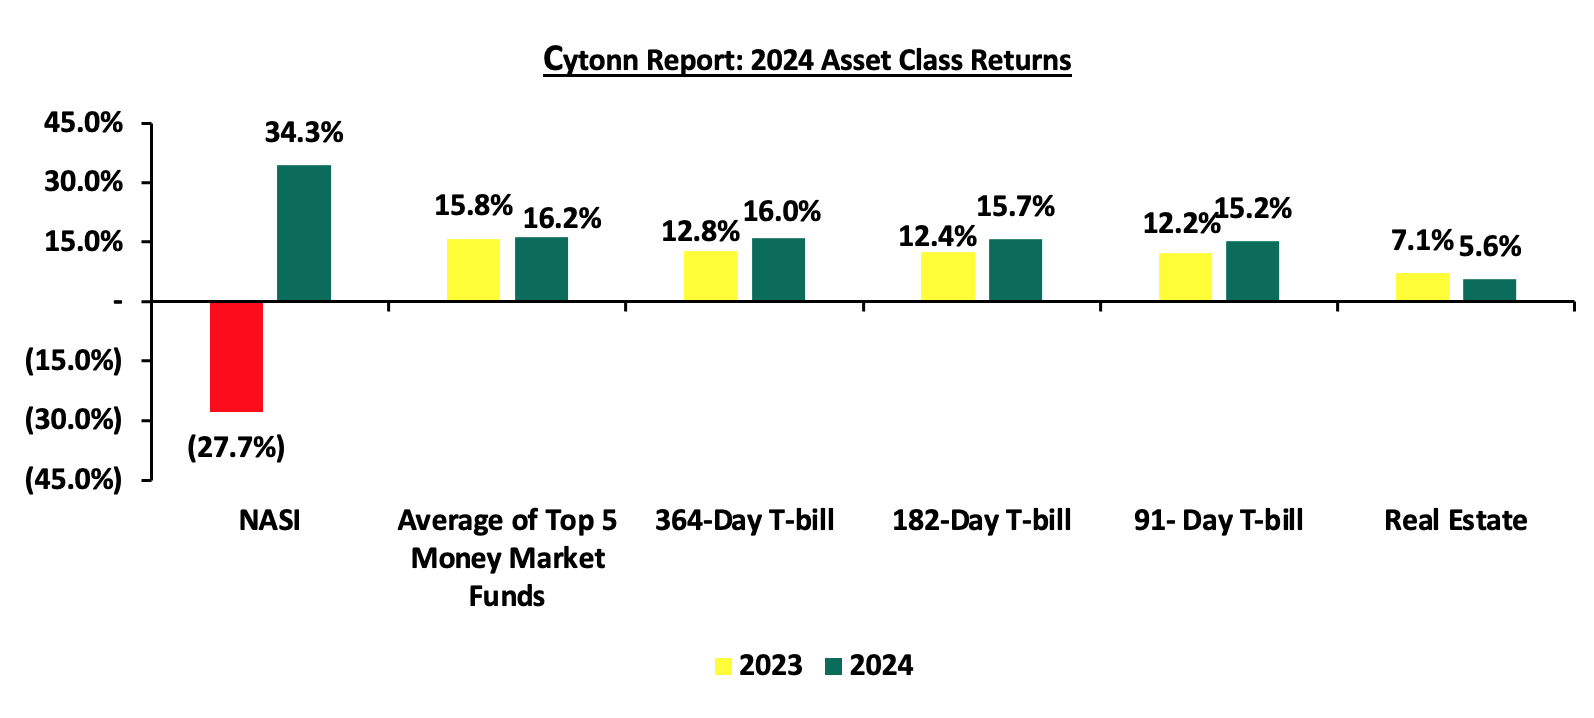
The returns by the various asset classes recorded mixed performances in 2024, in comparison to a similar period last year, with the NASI and the average of the top five money market funds (MMFs), being on upward trajectories. For the equities class, NASI registered a 34.3% gain in 2024, a significant improvement from the 27.7% loss recorded in 2023, as the average of top 5 MMFs recorded a yield of 16.2%, 0.5% points higher than the 15.8% average recorded in 2023. Additionally, the 364-day, 182-day and 91-day Government papers recorded average yields of 16.0%, 15.7% and 15.2%, respectively, higher than the average yields of 12.8%, 12.4% and 12.2%, respectively recorded in 2023, while the average Real Estate yield also decreased by 1.5% points to 5.6% in 2024, from 7.1% recorded in 2023. The graph below shows the summary of returns by various asset classes (Average top 5 MMF, Fixed Income, Real Estate and Equities).
The table below shows the macro-economic indicators that we track, indicating our expectations for each variable at the beginning of 2024 versus the experience;
|
Cytonn Report: Macro-Economic & Business Environment Outlook |
||||
|
Macro-Economic Indicators |
2025 Outlook |
Effect |
2024 Experience |
Effect |
|
Government Borrowing |
|
Negative |
· The government’s domestic debt stood at Kshs 5.6 tn as of September 2024, 8.0% higher than external debt that came in at Kshs 5.2 tn in the same period. Notably, domestic debt recorded an 10.9% increase from the year’s opening position of Kshs 5.0 tn relative to a 14.1% decline in external debt from the year’s opening position of Kshs 6.1 tn. The higher growth in domestic debt indicates the government’s preference for domestic borrowing in line with our expectation of aggressive borrowing in the domestic front during the year, · The government is 161.6% ahead its prorated borrowing target of Kshs 212.1 bn having borrowed Kshs 554.8 bn of the Kshs 408.4 bn borrowing target for the FY’2023/24, · Kenya’s debt to GDP ratio came in at an estimated 71.8% as of June 2024, 21.8% points above the IMF recommended threshold of 50.0% for developing nations, and 1.8% points increase on a Year on year basis from 70.8% recorded in June 2023, · The government tapped into the international markets for debt, to raise cash and buy back the 10-year Eurobond of USD 2.0 bn through the issuance of a new USD 1.5 bn Eurobond successfully redeeming the 10-year Eurobond due in June 2024. · Total revenue collected as at the end of November 2024 amounted to Kshs 940.9 bn, equivalent to 35.8% of the revised estimates of Kshs 2,631.4 bn for FY’2024/2025 and is 85.8% of the prorated estimates of Kshs 1,096.4 bn, indicating an underperformance in revenue collection, · We foresee that the collected revenue will fall short of covering the government’s deficit. Consequently, we predict that the government will intensify its domestic borrowing to compensate for the fiscal deficit, projected to be 4.1% of GDP for the FY’2024/25 budget. |
Negative |
|
Exchange Rate |
|
Negative |
· The Kenya Shilling appreciated by 17.4% against the US Dollar to close at Kshs at Kshs 129.3 in 2024, compared to Kshs 156.5 at the end of 2023. We note that the continuous appreciation of the shilling during the year was caused by CBK’s aggressive efforts to support the shilling, improved diaspora remittances standing at a cumulative USD 4,872.0 mn in the 12 months to November 2024 and improved forex reserves. · The forex reserves increased by 35.8% to USD 9.2 bn from USD 6.8 bn at year opening, with the former translating to 4.7 months of import cover, meeting the CBK’s statutory requirement to endeavor to maintain at least 4.0 months of import cover
|
Positive |
|
Interest Rates |
|
Neutral |
· In the first half of 2024, yields on government securities were on an upward trajectory primarily due to the government’s amplified borrowing needs and investors’ pursuit of higher returns to mitigate the impact of the inflation rates observed in the first half of the year. The second half of the year saw a decline in yields as a result of lower interest rates. · During the year, the MPC lowered the central bank rate by a cumulative 1.7% points to 11.25% from 13.00%, with the Kenya Shilling having gained and stabilized against the USD and inflation eased closing the year at 3.0% · Notably, the government's ability to meet coupon payments and successfully redeem the 10-year Eurobond in June 2024 provided much-needed confidence in Kenya's fiscal management. |
Positive |
|
Inflation |
|
Neutral |
· Having averaged at 4.5% in 2024, the inflation rate was within the government’s target range of 2.5% - 7.5%. Notably, on a monthly basis, the inflation rate came in at 3.0% in December 2024, marking the eighteenth consecutive month that the inflation rate remained within the government’s target range, · Going forward, we expect inflation to remain within the CBK’s preferred range of 2.5%-7.5%, mainly on the back of a strengthened currency and stable fuel prices. Additionally, favourable weather conditions will also contribute to stabilizing food prices, further supporting lower inflation rates. The risk, however, lies in the fuel prices which despite their decline over the last months, still remain elevated compared to historical levels. Key to note is that the Monetary Policy Committee cut the Central Bank Rate by 75.0 bps to 11.25% from 12.00% in its December 2024 meeting, with the aim of easing the monetary policy, while maintaining exchange rate stability, and will meet again in February 2025. This cut in the Central Bank Rate is likely to elevate inflationary pressures as consumer spending rises leading to demand- pull inflation. |
Positive |
|
GDP |
|
Neutral |
· With the economy having grown at average of 4.8% in the first two quarters of 2024. Given the growth momentum observed during the year, Kenya’s GDP growth is currently below the projected growth of 5.3%. The slower growth is primarily driven by reduced private sector activity and ongoing fiscal consolidation efforts by the government, which have limited public spending. Additionally, political instability during the year, fueled by anti-finance bill protests and opposition against the current regime, has undermined investor confidence and disrupted economic activities. This instability is expected to further weigh on economic growth |
Neutral |
|
Investor Sentiment |
|
Neutral |
· With the appreciation of the Kenyan shilling and reducing debt sustainability concerns, companies trading in the Nairobi Securities Exchange (NSE) have recorded relatively high trade volumes throughout the year, · The NSE has experienced capital inflows and repatriation with the NSE equity turnover increasing by 22.0% to close the year at USD 0.8 bn in 2024 from USD 0.6 bn recorded in 2023, · Further, the government's ability to meet coupon payments and successfully redeem the 10-year Eurobond in June 2024 provided much-needed confidence in Kenya's fiscal management, boosting investor confidence · Majority of companies are trading at higher prices relative to the year opening prices, signaling overvaluation |
Positive |
|
Security |
|
Positive |
· The country witnessed heightened political tensions in June and July following the mass demonstrations against the Finance Bill 2024 resulting in business disruption in several parts of the country. However, the government withdrew the Bill, restoring peace in the country in the second half of 2024. Despite this, the current regime still faces opposition fueling political instability in the country. |
Negative |
Since the beginning of the year, the notable changes we have seen out of the seven metrics that we track, fall under three metrics, namely; the GDP, investor sentiment, and Security. Key to note, economic growth remained neutral, while investor sentiments and security changed from neutral and positive respectively to positive and negative respectively. In conclusion, macroeconomic fundamentals showed mixed performance during the year with most metrics on upward trajectories. We expect a slight recovery in 2024 supported by the improving economic conditions in the country evidenced by momentum in GDP growth and declining inflation with the rate remaining within target range of 2.5% to 7.5% for the eighteenth consecutive month, driven by the improvement of the business conditions and stabilization of the Kenyan currency.
T-Bills & T-Bonds Primary Auction:
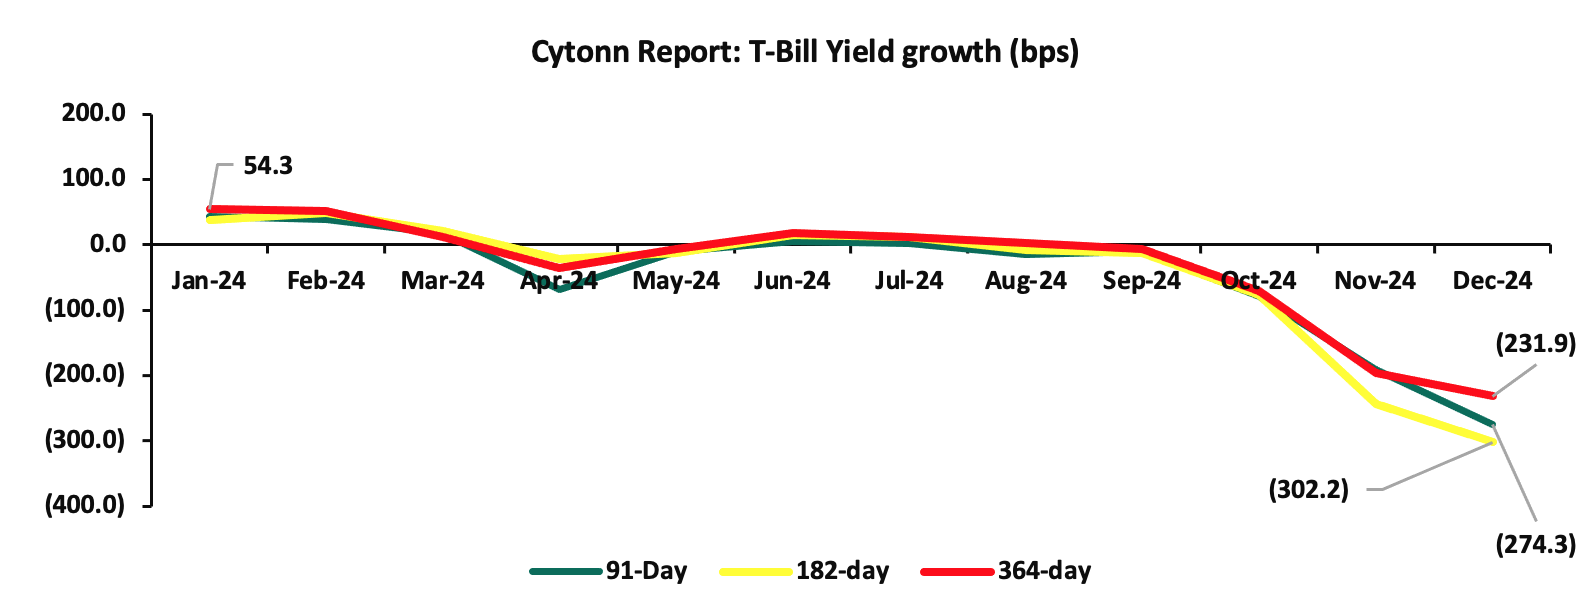
During the year, T-bills were oversubscribed, with the overall subscription rate coming in at 153.3%, up from 120.0% in FY’2023. Investors’ preference for the 91-day paper persisted as they sought to avoid duration risk, with the paper receiving bids worth Kshs 847.4 bn against the offered Kshs 212.0 bn, translating to an oversubscription rate of 399.7%, albeit lower than the oversubscription rate of 529.1% recorded in FY’2023. Overall subscription rates for the 364-day and 182-day papers came in at 103.0% and 104.9%, higher than the 29.0% and 48.5%, respectively, recorded in FY’2023. The average yields on the 364-day, 182-day, and 91-day papers were on an upward trajectory with the 182-day yields increasing the most by 330.6 bps to 15.7%, from 12.4% in 2023, while the 364-day and 91-day increased by 327.1 bps and 300.6 bps to 16.0% and 15.2% in 2024, from 12.8% and 12.2% in 2023, respectively. However, on y/y basis, the yields on the government papers registered significant decline in 2024 with the 91-day paper decreasing the most by 6.0% to close the year at 9.9% from the 15.9% recorded at the close of FY’2023, while the yields on the 182-day and 364-day decreased by 5.9% and 4.5% to close the year at 10.0% and 11.4%, from the 16.0% and 15.9%, respectively, recorded at the end of FY’2023. The year-on-year decline in yields is primarily driven by investors perceiving lower risks due to eased inflation, currency appreciation, and improved liquidity positions. As a result, there is less demand for higher returns to compensate for potential losses. The average acceptance rate during the period came in at 77.3%, albeit lower than the 92.5% recorded in FY’2023, with the government accepting a total of Kshs 1,507.3 bn out of the Kshs 1,949.4 bn worth of bids received. Notably, the decline in the government papers yields accelerated in December 2024 compared to November 2024, with the yields on the 91-day paper decreasing by 274.3 bps, compared to 190.8 bps decline that was recorded in November 2024, as the government manages the borrowing costs amid budgetary pressures. The chart below shows the yields growth rate for the 91-day, 182-day and 365-day papers during the year;
During the week, T-bills were undersubscribed for the fourth consecutive week, with the overall undersubscription rate coming in at 65.4%, higher than the undersubscription rate of 20.3% recorded the previous week. Investors’ preference for the shorter 91-day paper persisted, with the paper receiving bids worth Kshs 8.0 bn against the offered Kshs 4.0 bn, translating to an oversubscription rate of 199.7%, significantly higher than the undersubscription rate of 56.1% recorded the previous week. The subscription rates for the 182-day paper increased to 60.8% from the 4.4% recorded the previous week, while the subscription rate for the 364-day paper decreased to 16.3% from 21.9% recorded the previous week. The government accepted a total of Kshs 15.7 bn worth of bids out of Kshs 15.7 bn bids received, translating to an acceptance rate of 100.0%. The yields on the government papers recorded a mixed performance, with the yields on the 182-day paper increasing marginally by 0.4 bps to 10.03% from 10.02% recorded the previous week, while the yields on the 364-day and 91-day papers declined by 3.8 bps and 6.9 bps respectively to 11.37% and 9.83% from the 11.41% and 9.89% respectively recorded the previous week.
The chart below compares the overall average T- bills subscription rates obtained in 2018, 2022, 2023 and FY’2024;
Primary T-Bond Auctions in FY’2024
Primary T-bond auctions in 2024 were generally oversubscribed, with bonds receiving bids worth Kshs 1,137.9 bn against the offered Kshs 665.0 bn, translating to an oversubscription rate of 171.1%, higher than the oversubscription rate of 128.5% recorded in 2023. The government accepted Kshs 867.8 bn of the Kshs 1,137.9 bn worth of bids received, translating to an acceptance rate of 76.3%.
Additionally, in the primary bond market, the government is looking to raise Kshs 30.0 bn through the reopened fifteen year and twenty-five-year fixed coupon bonds; FXD1/2018/15 and FXD1/2022/25 with tenors to maturity of 8.3 years and 22.8 years respectively. The bonds will be offered at fixed coupon rates of 12.7% and 14.2% respectively. Our bidding range for the reopened bonds are 13.45%-13.85% and 15.65%-16.00% for the FXD1/2018/15 and FXD1/2022/25 respectively
Secondary Bond Market Activity:
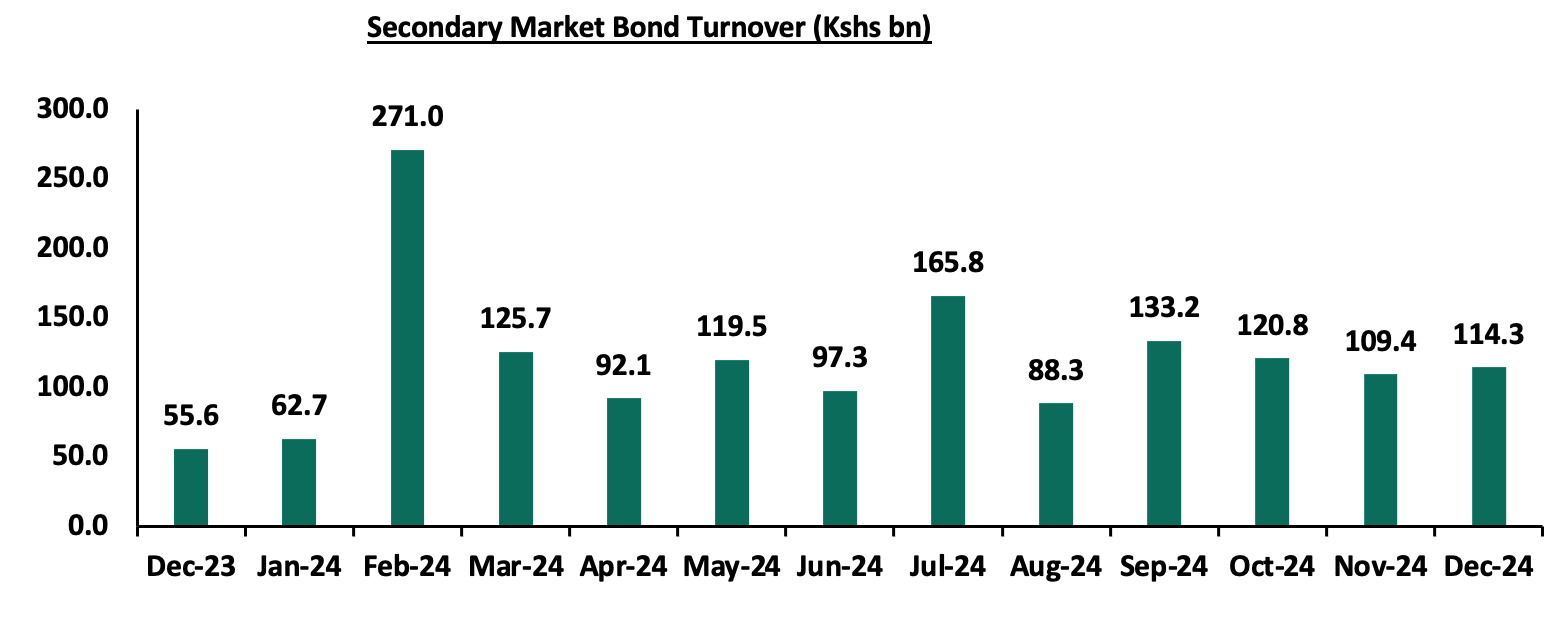
The secondary bond turnover increased by 4.5% to Kshs 114.3 bn in December 2024, from Kshs 109.4 bn recorded in November 2024, pointing towards increased activities by commercial banks in the secondary bonds market for the month of December. Similarly, on a year-on-year basis, the bond turnover increased by 105.5% from Kshs 55.6 bn worth of treasury bonds transacted over a similar period last year. The chart below shows the bond turnover over the past 12 months to December 2024;
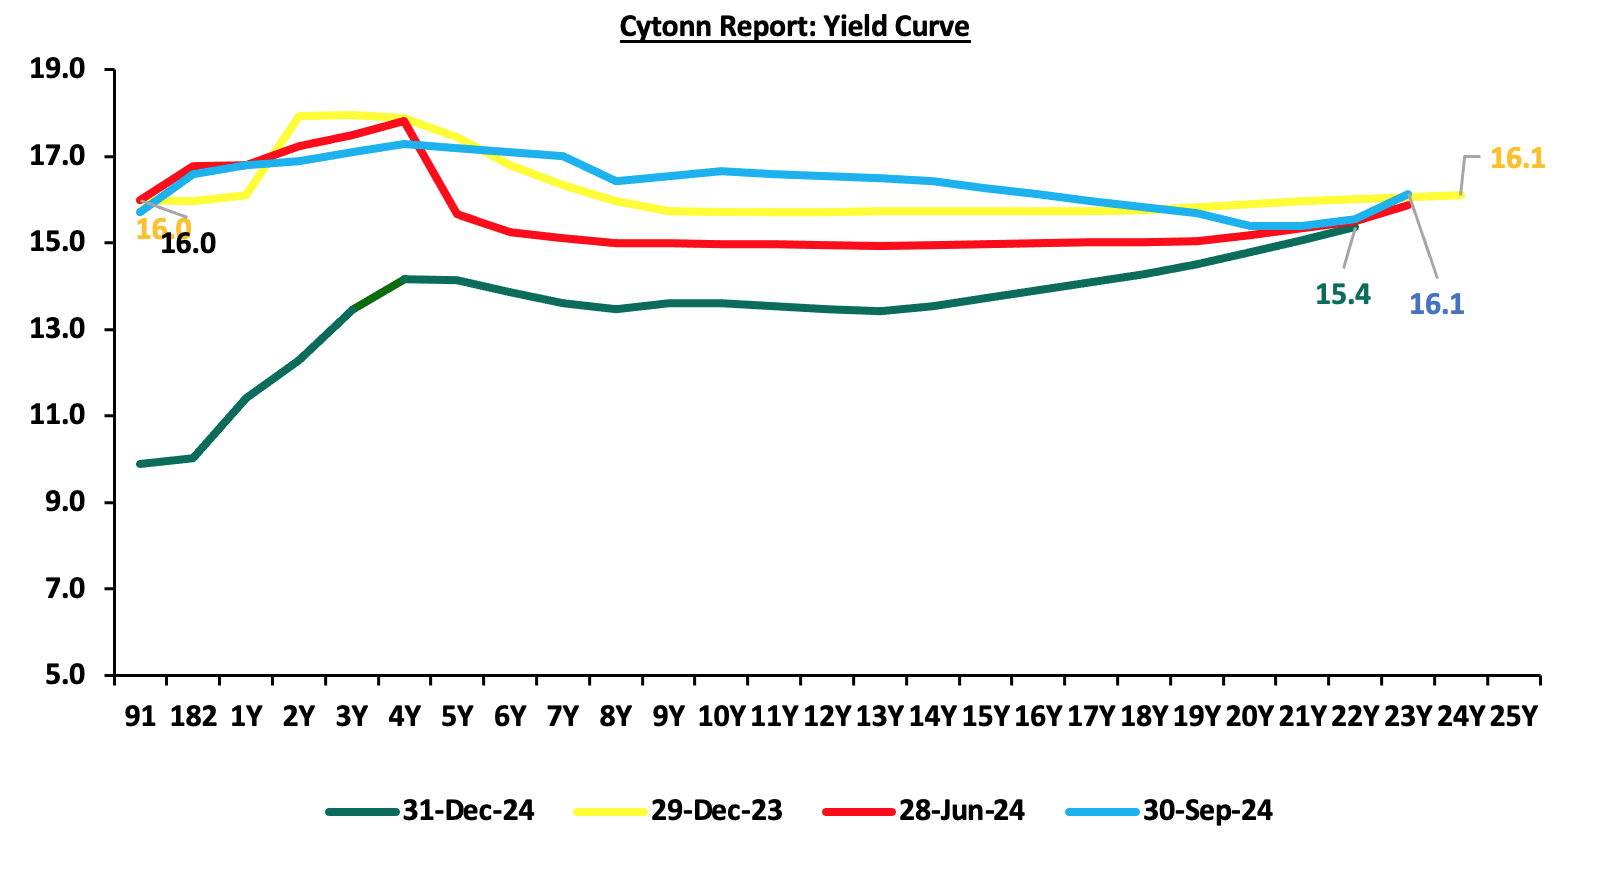
In 2024, the yield curve experienced a downward adjustment compared to 2023, primarily driven by decreased government borrowing, local currency appreciation, and eased inflation. These factors reduced the need for investors to demand higher yields as compensation for inflation and currency depreciation risks, resulting in an overall decline across the yield curve. Notably, the yield curve is adjusting from a humped yield curve observed at close of 2023 towards a normal upward sloping curve, with long-term bonds registering highest yields. The chart below is the yield curve movement during the period;
Money Market Performance:
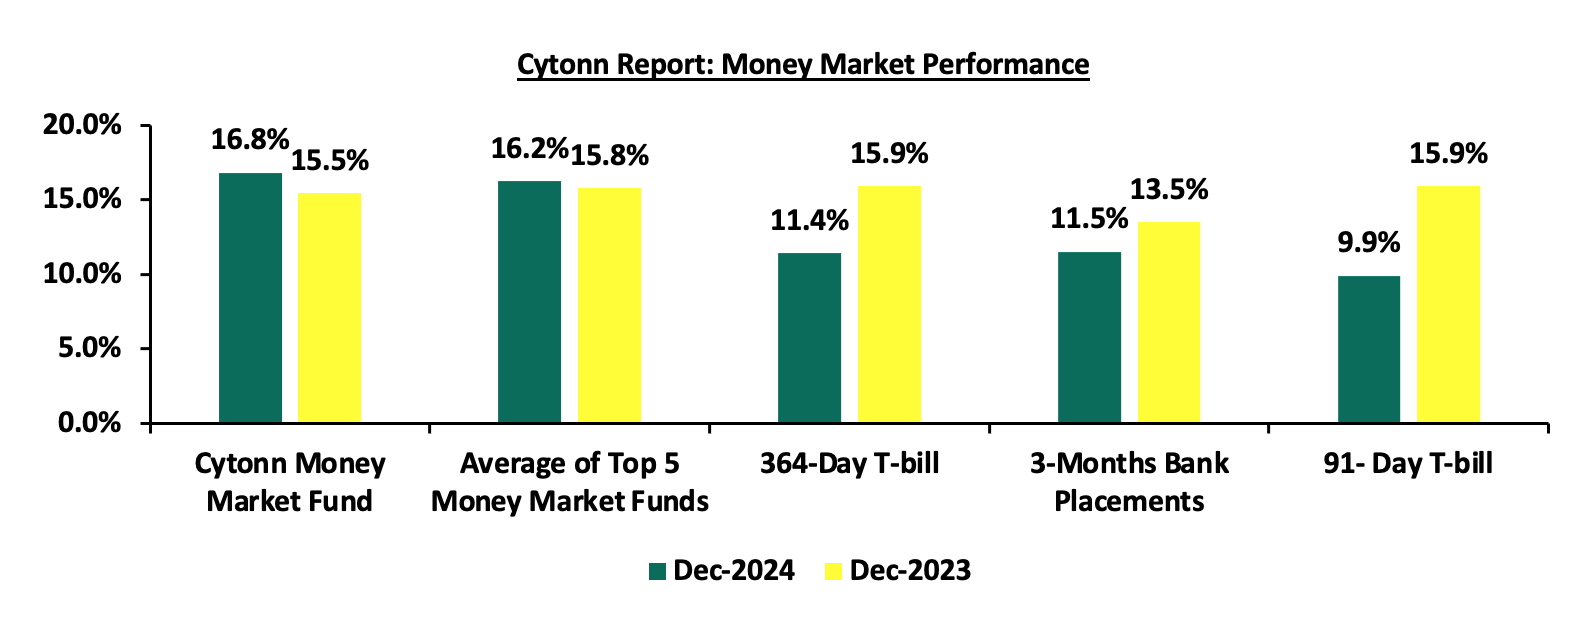
The 3-month bank placements recorded 11.5% at the end of FY’2024, 2.0% points lower than the 13.5%recorded at the end of FY’2023 (based on what we have been offered by various banks). The 91-day and 364-day papers decreased by 6.0% points and 4.5% to 9.9% and 11.4% at the end of 2024, from 15.9% and 15.9% at the end of FY’2023 respectively, while the average Top 5 Money Market Funds increased by 0.5% points to 16.2%, from 15.8% at the end of FY’2023. The yield on the Cytonn Money Market (CMMF) increased by 1.4% points to 16.8% at the end of FY’2024, from 15.5% recorded at the end of FY’2023.
During the week, 3-month bank placements ended the week at 11.5% (based on what we have been offered by various banks), and yields on the government papers decreased, with the yields on the 364-day and 91-day papers decreased by 3.8 bps and 6.9 bps to 11.4% and 9.8% respectively from 11.4% and 9.9% respectively recorded the previous week. The yield on the Cytonn Money Market Fund remained unchanged at the 16.8% recorded the previous week, while the average yields on the Top 5 Money Market Funds decreased by 6.0 bps to close the week at 16.2%, from 16.3% recorded the previous week. The table below shows the Money Market Fund Yields for Kenyan Fund Managers as published on 3rd January 2025:
|
Cytonn Report: Money Market Fund Yield for Fund Managers as published on 3rd January 2025 |
||
|
Rank |
Fund Manager |
Effective Annual Rate |
|
1 |
Cytonn Money Market Fund (Dial *809# or download the Cytonn App) |
16.8% |
|
2 |
Lofty-Corban Money Market Fund |
16.5% |
|
3 |
Gulfcap Money Market Fund |
16.3% |
|
4 |
Etica Money Market Fund |
16.1% |
|
5 |
Kuza Money Market fund |
15.9% |
|
6 |
Ndovu Money Market Fund |
15.5% |
|
7 |
Orient Kasha Money Market Fund |
15.5% |
|
8 |
Arvocap Money Market Fund |
15.4% |
|
9 |
Mali Money Market Fund |
15.2% |
|
10 |
Faulu Money Market Fund |
14.5% |
|
11 |
Sanlam Money Market Fund |
14.1% |
|
12 |
Madison Money Market Fund |
14.0% |
|
13 |
Dry Associates Money Market Fund |
13.9% |
|
14 |
Genghis Money Market Fund |
13.9% |
|
15 |
Jubilee Money Market Fund |
13.8% |
|
16 |
Enwealth Money Market Fund |
13.6% |
|
17 |
GenAfrica Money Market Fund |
13.5% |
|
18 |
Co-op Money Market Fund |
13.3% |
|
19 |
KCB Money Market Fund |
13.3% |
|
20 |
Nabo Africa Money Market Fund |
13.3% |
|
21 |
Apollo Money Market Fund |
13.1% |
|
22 |
British-American Money Market Fund |
13.0% |
|
23 |
Old Mutual Money Market Fund |
13.0% |
|
24 |
ICEA Lion Money Market Fund |
12.9% |
|
25 |
CIC Money Market Fund |
12.7% |
|
26 |
Absa Shilling Money Market Fund |
12.7% |
|
27 |
Ziidi Money Market Fund |
12.4% |
|
28 |
Mayfair Money Market Fund |
12.3% |
|
29 |
AA Kenya Shillings Fund |
11.7% |
|
30 |
Stanbic Money Market Fund |
11.2% |
|
31 |
Equity Money Market Fund |
8.7% |
Source: Business Daily
Liquidity:
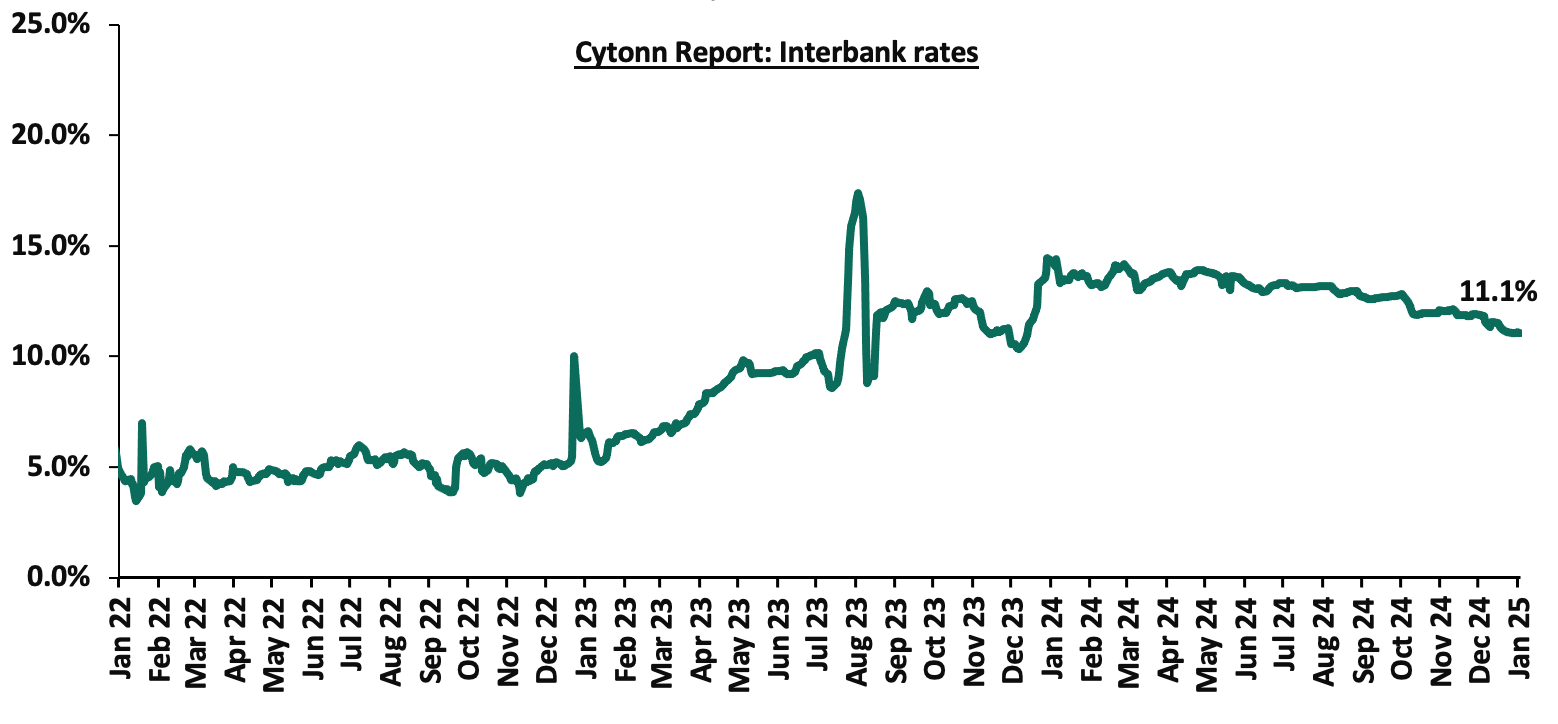
During the year, liquidity levels tightened as evidenced by the increase in the average interbank rate by 3.2% points to 13.0%, from 9.8% in 2023. The tightened liquidity is partly due to tax remittances which offset government payments. However, the average volumes traded in the interbank market increased by 19.1% to Kshs 26.7 bn in 2024, from Kshs 21.6 bn recorded in 2023.
During the week, liquidity in the money markets eased, with the average interbank rate decreasing marginally by 2.0 bps, to remain relatively unchanged at 11.1% recorded the previous week, partly attributable to government payments that offset tax remittances. The average interbank volumes traded decreased by 35.2% to Kshs 22.3 bn from Kshs 34.4 bn recorded the previous week. The chart below shows the interbank rates in the market over the years:
Kenya Eurobonds:
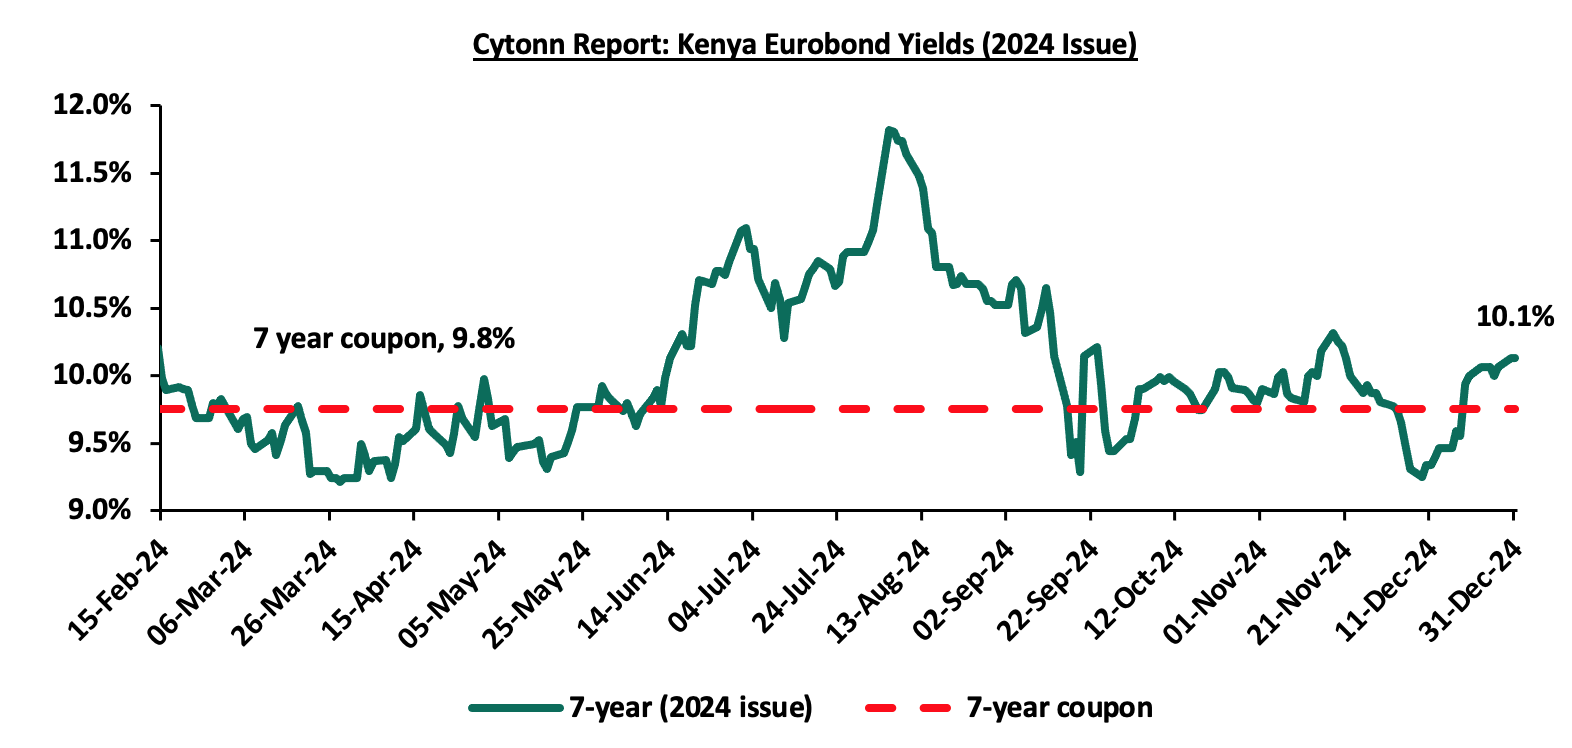
Yields on the 7-Year Eurobond issued in 2024, set to mature in 2031, decreased by 0.1% points to close the year at 10.1%, from 10.2% recorded in February 2024 when it was issued.
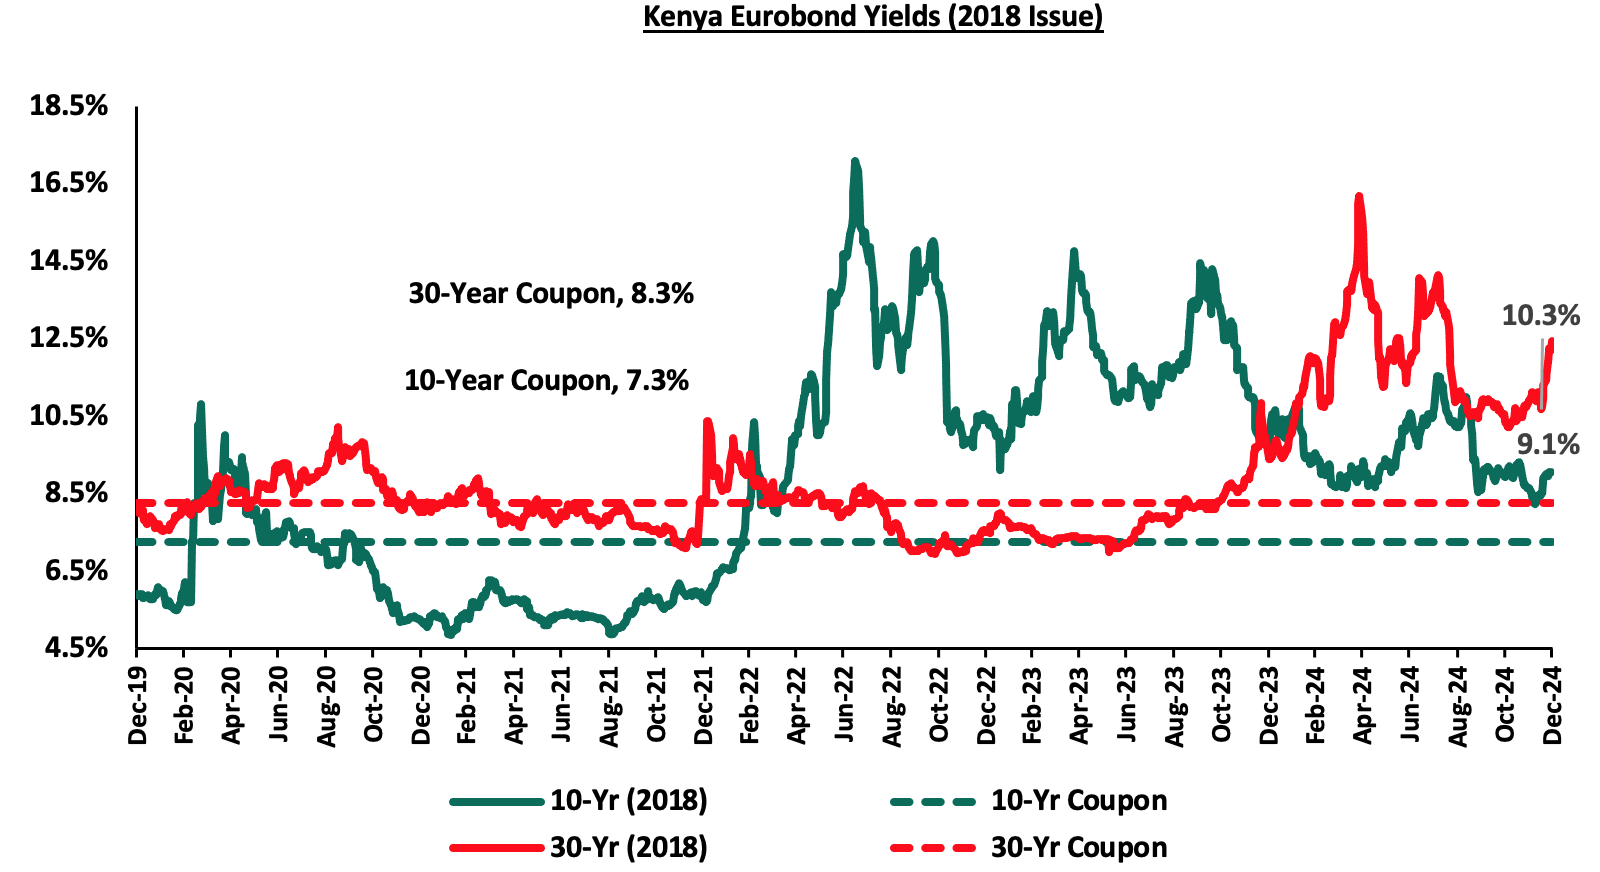
For the 2018 Eurobond issue, the yields on the 10-year Eurobond decreased by 0.8% points to close the year at 9.1% from 9.8% recorded at the start of 2024, while the yields on the 30-year Eurobond increased by 0.1% points to close the year at 10.3% from 10.2% recorded at the beginning of the year.
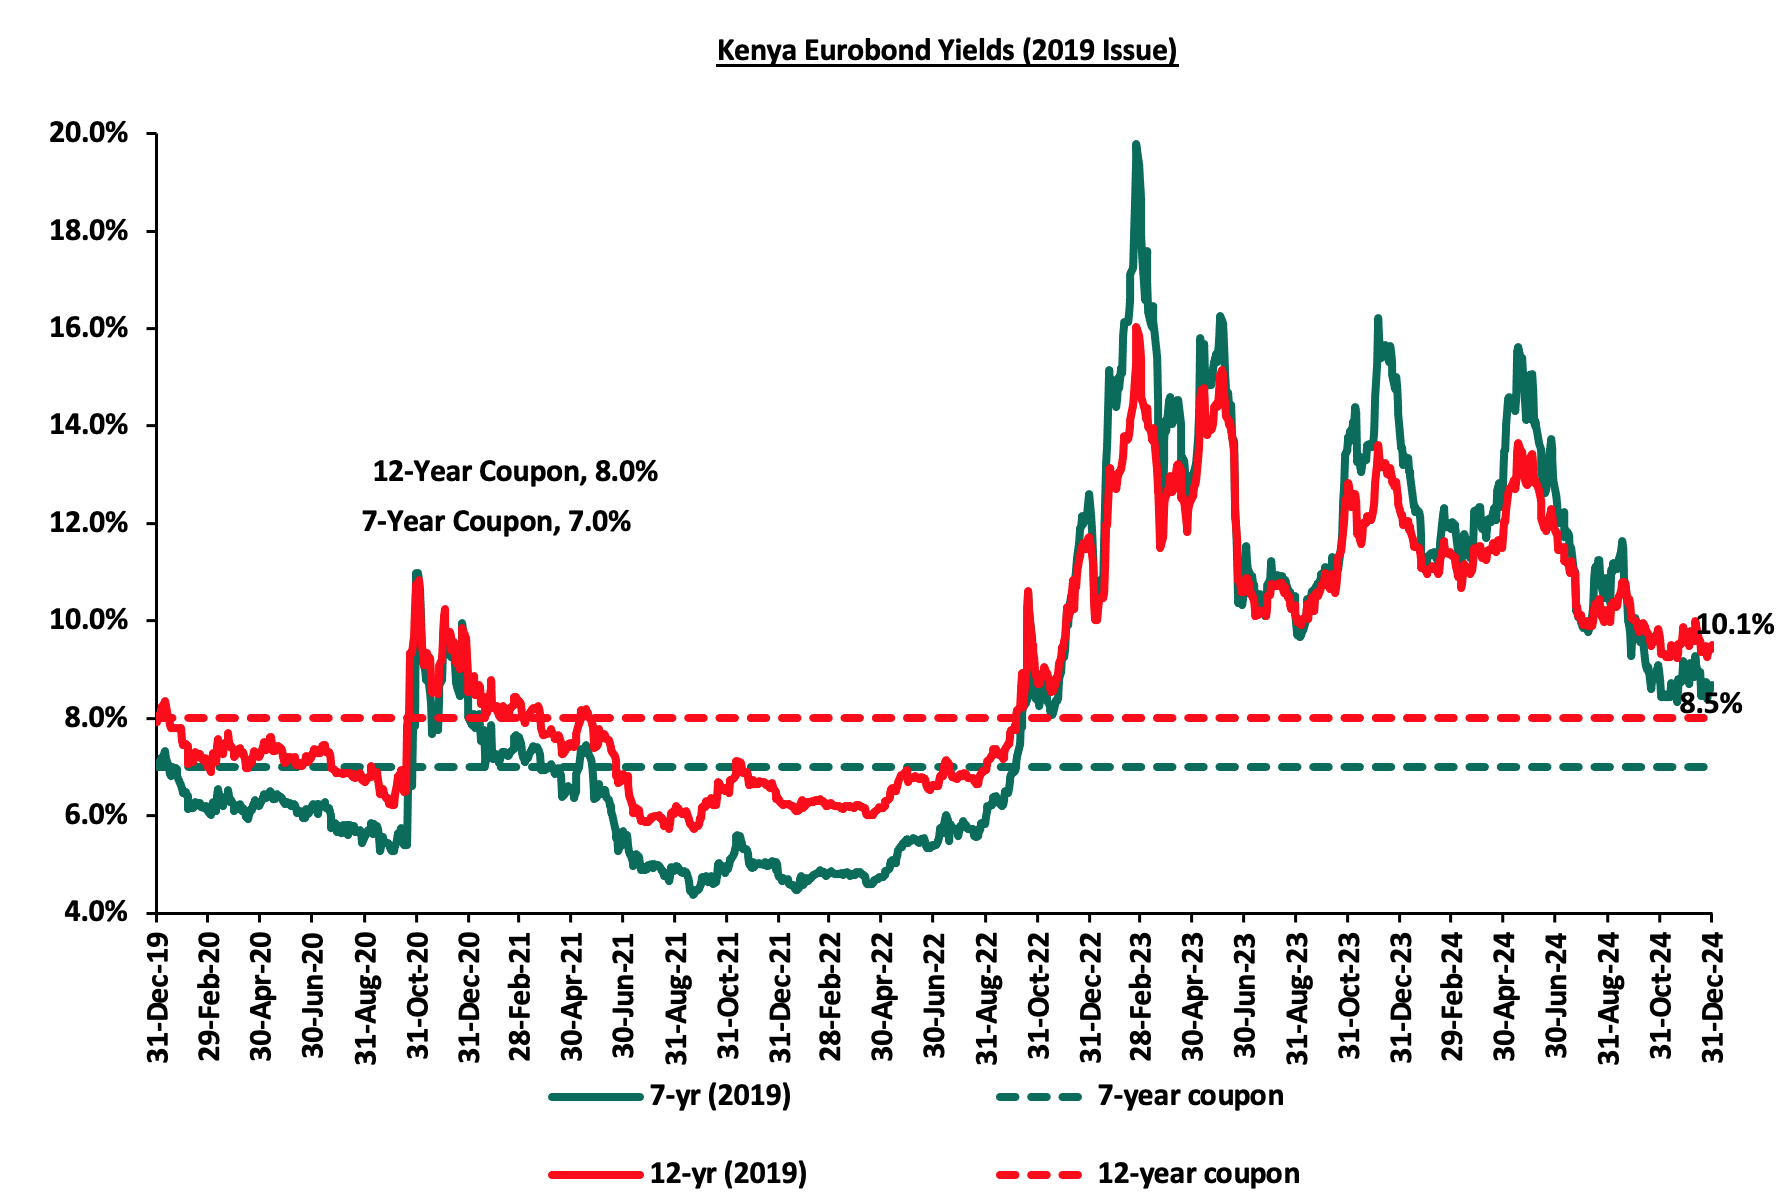
For the 2019 Dual-tranche Eurobond issue, the yields on the 7-year Eurobond decreased by 1.6% points to close the year at 8.5%, from 10.1% recorded at the start of 2024, while the yields on the 12-year Eurobond increased by 0.2% points, to close the year at 10.1% from 9.9% at the beginning of 2024.
The yields on the 12-Year Eurobond issued in 2021, set to mature in 2033, increased by 0.6% points to close the year at 10.1% from 9.5% recorded at the start of the year;

During the year, the yields on Eurobonds recorded mixed performance, with the yields on the 13-year Eurobond issued in 2021 increasing the most by 60.3 bps to 10.1% from 9.5% recorded at the start of the year, while the with the yields on the 7-year Eurobond issued in 2019 decreased the most by 162.4 bps to 8.5% from 10.1% recorded at the start of the year.
However, during the week, the yields on Eurobonds were on an upward trajectory, with the yields on the 7-year Eurobond issued in 2019 increasing the most by 21.6 bps, to 8.5% from 8.3% recorded the previous week. The table below shows the summary of the performance of the Kenyan Eurobonds as of 2nd January 2025:
|
Cytonn Report: Kenya Eurobonds Performance |
||||||
|
|
2018 |
2019 |
2021 |
2024 |
||
|
Tenor |
10-year issue |
30-year issue |
7-year issue |
12-year issue |
13-year issue |
7-year issue |
|
Amount Issued (USD) |
1.0 bn |
1.0 bn |
0.9 bn |
1.2 bn |
1.0 bn |
1.5 bn |
|
Years to Maturity |
3.2 |
23.2 |
2.4 |
7.4 |
9.5 |
6.1 |
|
Yields at Issue |
7.3% |
8.3% |
7.0% |
7.9% |
6.2% |
10.4% |
|
01-Jan-24 |
9.8% |
10.2% |
10.1% |
9.9% |
9.5% |
|
|
29-Nov-24 |
8.6% |
10.1% |
8.0% |
9.7% |
10.1% |
9.8% |
|
26-Dec-24 |
9.0% |
10.2% |
8.3% |
9.9% |
10.0% |
10.0% |
|
27-Dec-24 |
9.1% |
10.3% |
8.5% |
10.1% |
10.1% |
10.1% |
|
30-Dec-24 |
9.1% |
10.3% |
8.5% |
10.1% |
10.1% |
10.1% |
|
31-Dec-24 |
9.1% |
10.3% |
8.5% |
10.1% |
10.1% |
10.1% |
|
01-Jan-25 |
9.1% |
10.3% |
8.5% |
10.1% |
10.1% |
10.1% |
|
02-Jan-25 |
9.1% |
10.3% |
8.5% |
10.1% |
10.1% |
10.1% |
|
Weekly Change |
0.1% |
0.0% |
0.2% |
0.1% |
0.1% |
0.1% |
|
MoM Change |
0.4% |
0.2% |
0.5% |
0.4% |
0.0% |
0.3% |
|
YoY Change |
(0.8%) |
0.1% |
(1.6%) |
0.2% |
0.6% |
- |
Source: Central Bank of Kenya (CBK)
Weekly Highlights
- Inflation Highlight December 2024
The y/y inflation in December 2024 increased slightly by 0.2% points to 3.0%, from the 2.8% recorded in November 2024. This was however in contrary with our projection to a range of 2.4% to 2.7%, where our decision was mainly driven by reduced fuel prices in December, with maximum allowed price for Super Petrol, Diesel and Kerosene decreasing by Kshs 4.4, Kshs 3.0 and Kshs 3.0 respectively, coupled with the stability of the Kenyan Shilling having recorded a 0.3% month-to-date appreciation as of 27th December 2024 to Kshs 129.3 from Kshs 129.6. The headline inflation in December 2024 was majorly driven by increase in prices of commodities in the following categories; Food & Non-Alcoholic Beverages, and Transport sector by 4.8% and 0.2% respectively. However, the commodity prices in Housing, Water, Electricity, Gas & other fuels declined by 0.2%. The table below shows a summary of both the year-on-year and month-on-month commodity indices performance:
|
Cytonn Report: Major Inflation Changes – December 2024 |
|||
|
Broad Commodity Group |
Price change m/m (December-2024/ November -2024) |
Price change y/y (December-2024/December-2023) |
Reason |
|
Food and non-alcoholic beverages |
0.7% |
4.8% |
The m/m increase was mainly driven by the increase in prices of commodities such as maize flour sifted, Fortified maize flour and tomatoes by 7.0%, 5.8% and 1.8% respectively. However, the increase was weighed down by decrease in prices of Mangoes, Potatoes and Cabbages by 6.2%, 5.0%, and 2.8%, respectively |
|
Transport |
1.8% |
0.2% |
The slight m/m increase recorded in the transport index came despite prices of Super Petrol and Diesel decreasing by 2.4% and 1.8% to sell at Kshs 176.3 and Kshs 165.1 respectively, from Kshs 180.7 and 168.1 respectively |
|
Housing, water, electricity, gas and other fuels |
0.2% |
(0.2%) |
The slight m/m increase was mainly driven by an increase in prices of 50 kWh of electricity and 200 kWh of electricity by 0.6% and 0.5% respectively. The increase was however weighed down by decrease in prices of Kerosene by 2.0% to sell at Kshs 148.4, from Kshs 145.4 |
|
Overall Inflation |
0.6% |
3.0% |
The m/m increase was mainly attributable to the 0.7% increase in Food and non-alcoholic beverages. |
Notably, December’s overall headline inflation increased slightly for the second consecutive month, remaining within the CBK’s preferred range of 2.5%-7.5% for the eighteenth consecutive month. The increase in headline inflation in December 2024 comes despite the decrease in maximum allowed price for Super Petrol, Diesel and Kerosene by Kshs 4.4, Kshs 3.0 and Kshs 3.0 per litre respectively to retail at Kshs 176.3, Kshs. 165.1 and Kshs 148.4 per litre respectively, from Kshs 180.7, Kshs. 165.1 and Kshs. 145.4 per litre respectively the last month. Key to note, the Kenya Shilling also recorded a 0.3% month on month gain as of 31st December 2024 to Kshs 129.3 from Kshs 129.7 recorded as of the end of November 2024, and a 17.4% year-on-year gain from the Kshs 156.5 recorded at the end of 2023. The chart below shows the inflation rates for the past 5 years:
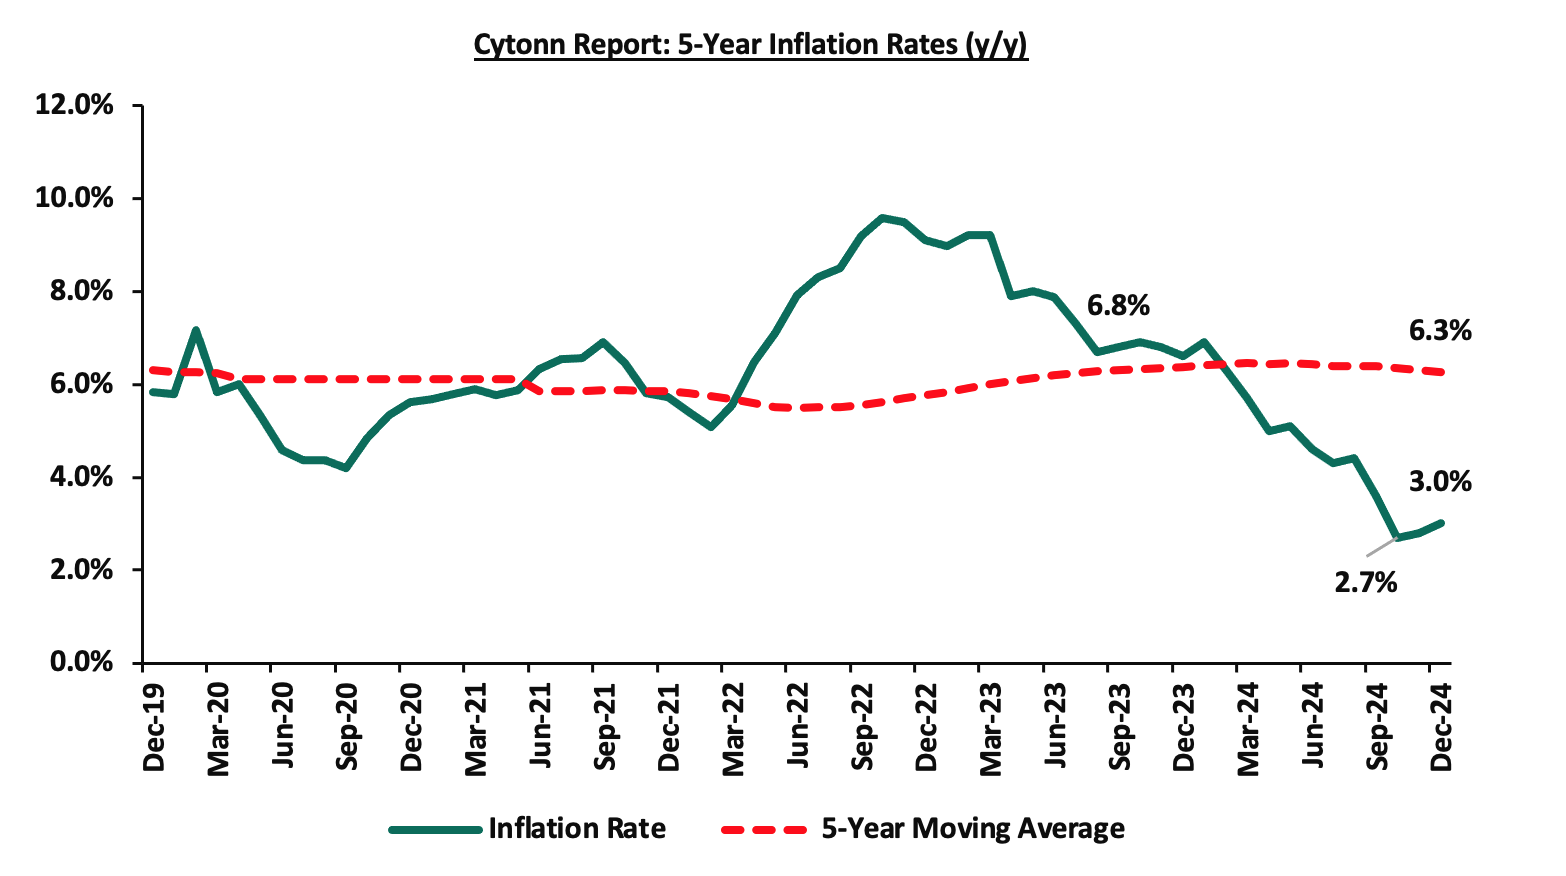
Going forward, we expect inflation to remain within the CBK’s preferred range of 2.5%-7.5%, mainly on the back of a strengthened currency and stable fuel prices. Additionally, favourable weather conditions will also contribute to stabilizing food prices, further supporting lower inflation rates. The risk, however, lies in the fuel prices which despite their decline over the last months, still remain elevated compared to historical levels. Key to note is that the Monetary Policy Committee cut the Central Bank Rate by 75.0 bps to 11.25% from 12.00% in its December 2024 meeting, with the aim of easing the monetary policy, while maintaining exchange rate stability, and will meet again in February 2025. This cut in the Central Bank Rate is likely to elevate inflationary pressures as consumer spending rises leading to demand- pull inflation.
Rates in the Fixed Income market have been on a downward trend given the continued low demand for cash by the government and the improved liquidity in the money market. The government is 161.6% ahead of its prorated net domestic borrowing target of Kshs 212.2 bn, and 35.8% ahead of the total FY’2024/25 net domestic borrowing target of Kshs 408.4 bn, having a net borrowing position of Kshs 554.8 bn. However, we expect a continued downward readjustment of the yield curve in the short and medium term, with the government looking to increase its external borrowing to maintain the fiscal surplus, hence alleviating pressure in the domestic market. As such, we expect the yield curve to normalize in the medium-term and hence investors are expected to shift towards the long-term papers to lock in the high returns.
Market Performance
In 2024, the Kenyan equities market was on an upward trajectory with NSE 10 gaining the most by 42.9%, while NSE 25, NASI and NSE 20 gained by 42.5%,34.3% and 33.3%, respectively. Below is a summary of the 2024 annual performance of some of the large-cap stocks in the Kenyan stock market:
|
Cytonn Report: Kenya Equities Performance - Large Cap Gainers and Losers 2024 |
||
|
No |
Company |
Share Price Performance 2024 |
|
1 |
KCB Group |
89.5% |
|
2 |
Standard Chartered Bank |
74.6% |
|
3 |
Absa Bank |
56.3% |
|
4 |
Diamond Trust Bank |
54.2% |
|
5 |
Bamburi |
52.8% |
|
6 |
East Africa Breweries |
51.0% |
|
7 |
Co-operative Bank |
44.9% |
|
8 |
Equity Group |
41.2% |
|
9 |
Stanbic |
29.2% |
|
10 |
NCBA |
24.1% |
|
11 |
Safaricom |
24.0% |
|
12 |
BAT |
(11.5%) |
During the week, the equities market was on an upward trajectory, with NSE 20 gaining the most by 5.4% while NSE 10, NSE 25 and NASI gained by 4.7%,4.0% and 3.2%, respectively. The equities market performance was mainly driven by gains recorded by large-cap stocks such as Co-operative Bank, ABSA Bank, and KCB Group of 11.0%, 9.2% and 7.1%, respectively. The performance was however weighed down by losses recorded by large-cap stocks such as Diamond Trust Bank Kenya, BAT and EABL of 1.8%, 1.2%, and 0.6% respectively.
During the year, equities turnover gained by 22.0% to close the year at USD 0.8 bn, from USD 0.6 bn recorded in 2023. Foreign investors remained net sellers, with a net outflow of USD 16.9 mn, compared to net outflows of USD 92.0 mn recorded in 2023. The foreign-investor outflows during the year can be largely attributed to investors fleeing emerging markets such as Kenya, to advanced economies such as United States and United Kingdom following interest rate hikes as well as increased concerns about macroeconomic deterioration in emerging markets.
During the week, equities turnover increased significantly by 97.3% to USD 4.2 mn from USD 2.1 mn recorded the previous week, taking the YTD turnover to USD 2.5 mn. Additionally, foreign investors remained net sellers for the third week, with a net selling position of USD 0.6 mn, from a net selling position of USD 0.9 mn recorded the previous week, taking the YTD net selling position to USD 0.1 mn.
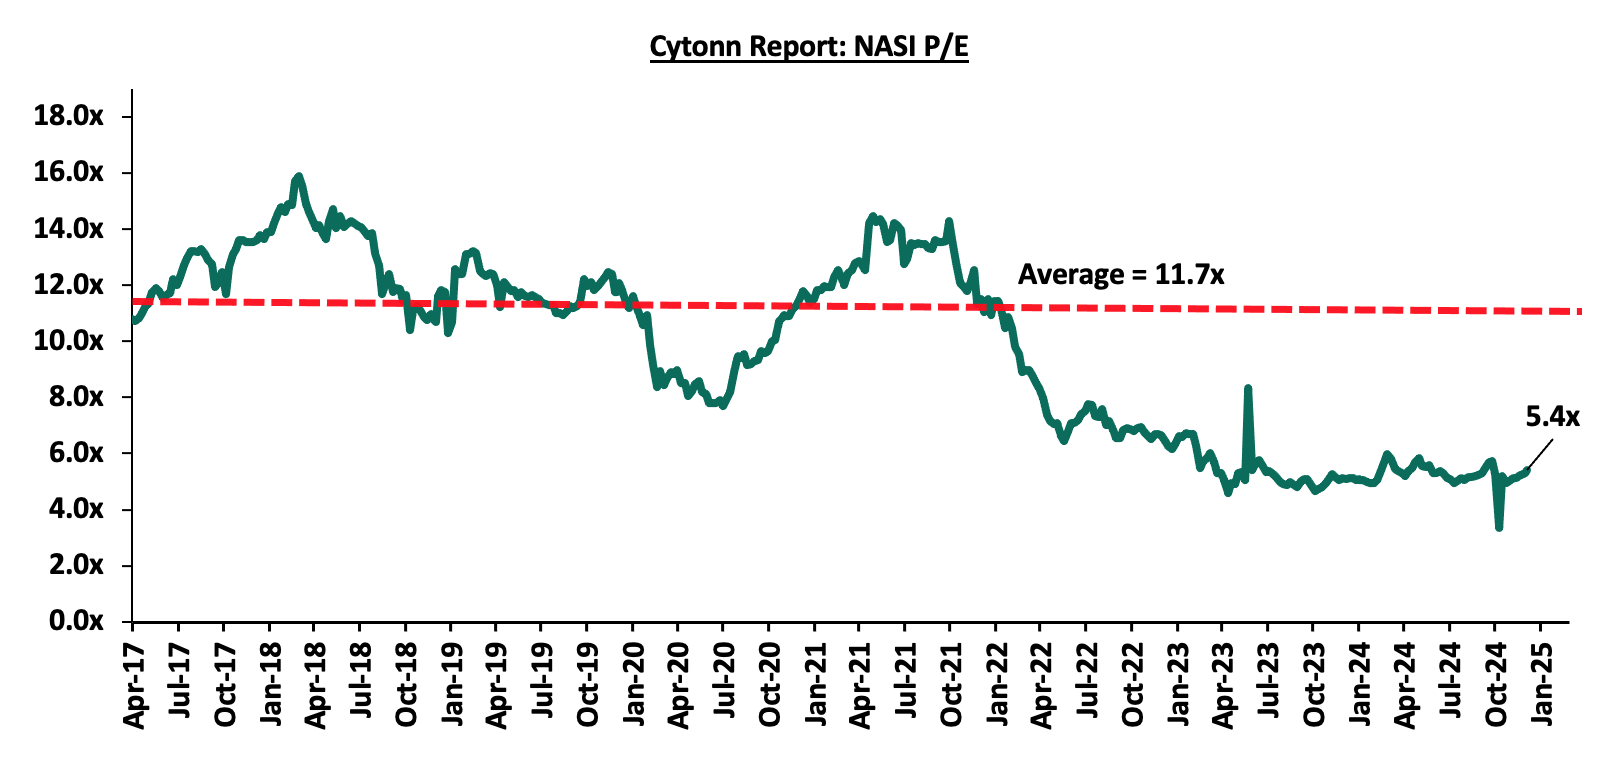
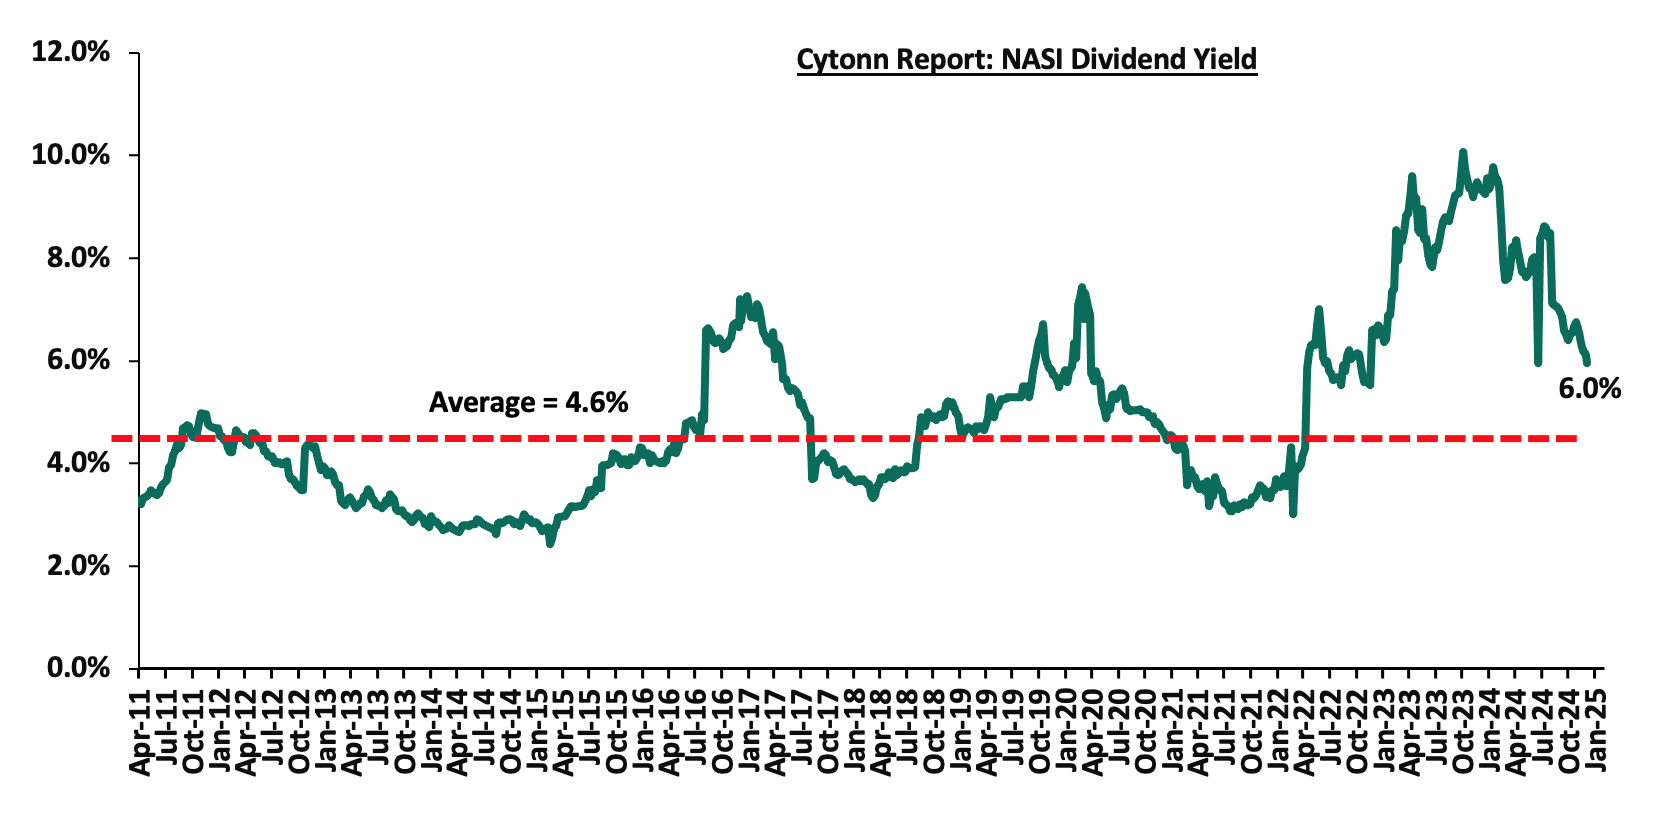
The market is currently trading at a price-to-earnings ratio (P/E) of 5.4x higher than 5.1x recorded at the end of 2023, and is 53.7% below the 15-year historical average of 11.7x. NASI’s P/E ratio remained boosted for the majority of the year, mainly attributable to a rise in price of large-cap stocks such as Safaricom whose price rose by 24.0% during the year. Safaricom continues to be a key part of Kenyan equities portfolios, accounting for 39.0% of Nairobi Stock Exchange (NSE’s) market capitalization, and has dominated both the market turnover and determines the direction of the market given its weight and liquidity in the Nairobi Securities Exchange. On the other hand, the dividend yield is currently at 6.0%, 1.3% points above the historical average of 4.6%.
Key to note, NASI’s PEG ratio currently stands at 0.7 an indication that the market is undervalued relative to its future earnings growth. The charts below indicate the market’s historical P/E and dividend yield:
2024 Key Highlights
- Banking Sector Earnings
According to the Q3’2024 banking results core earnings per share (EPS) for the listed banks recorded a weighted growth of 24.6% in Q3’2024, compared to a weighted growth of 11.2% recorded in Q3’2023, an indication of sustained performance supported by improved operating environment experienced in Q3’2024 on the back of easing inflationary pressures and a strengthening Shilling. The table below highlights the performance of the banking sector, showing the performance using several metrics, and the key take-outs of the performance.
|
Cytonn Report: Kenyan Listed Banks Performance Q3’2024 |
|||||||||||||||
|
Bank |
Core EPS Growth |
Interest Income Growth |
Interest Expense Growth |
Net Interest Income Growth |
Net Interest Margin |
Non-Funded Income Growth |
NFI to Total Operating Income |
Growth in Total Fees & Commissions |
Deposit Growth |
Growth in Government Securities |
Loan to Deposit Ratio |
Loan Growth |
Return on Average Equity |
COF |
YIEA |
|
HF Group |
104.6% |
23.0% |
43.6% |
2.6% |
(0.3%) |
10.9% |
33.9% |
24.0% |
2.7% |
45.5% |
84.2% |
(0.7%) |
5.2% |
6.8% |
11.6% |
|
Standard Chartered Bank |
62.7% |
24.0% |
91.7% |
17.0% |
10.1% |
73.5% |
36.4% |
30.4% |
(4.8%) |
22.4% |
53.2% |
5.4% |
31.6% |
1.7% |
11.7% |
|
KCB Group |
49.0% |
30.8% |
44.0% |
23.9% |
7.0% |
18.3% |
35.1% |
10.7% |
(7.1%) |
(2.1%) |
67.8% |
0.5% |
22.4% |
4.6% |
11.3% |
|
I&M Group |
21.3% |
43.5% |
51.2% |
37.4% |
8.3% |
(11.5%) |
26.5% |
15.1% |
2.8% |
13.6% |
68.0% |
(2.1%) |
16.8% |
6.6% |
15.1% |
|
Absa Bank Kenya |
19.8% |
24.3% |
43.8% |
17.7% |
10.2% |
13.0% |
26.2% |
1.1% |
(0.7%) |
(8.5%) |
88.5% |
(5.9%) |
26.4% |
4.6% |
14.3% |
|
Equity Group |
13.1% |
13.3% |
17.7% |
11.0% |
7.7% |
5.8% |
43.1% |
9.5% |
9.0% |
6.8% |
60.8% |
(5.4%) |
23.7% |
4.2% |
11.7% |
|
Diamond Trust Bank Kenya |
12.6% |
15.6% |
25.9% |
6.1% |
5.3% |
5.7% |
31.3% |
17.0% |
(3.5%) |
0.1% |
62.2% |
(4.9%) |
11.8% |
6.1% |
10.9% |
|
Stanbic Holdings |
9.3% |
48.6% |
147.4% |
4.8% |
6.8% |
(17.8%) |
35.3% |
(3.1%) |
7.3% |
82.7% |
66.7% |
(12.8%) |
22.2% |
6.7% |
12.9% |
|
Co-operative Bank of Kenya |
4.4% |
25.2% |
50.6% |
12.3% |
8.0% |
8.2% |
37.7% |
1.7% |
18.7% |
14.3% |
74.2% |
0.9% |
20.0% |
5.9% |
13.3% |
|
NCBA Group |
3.1% |
22.3% |
53.7% |
(3.1%) |
5.8% |
5.2% |
46.5% |
6.9% |
(6.0%) |
(11.1%) |
58.9% |
(1.7%) |
23.3% |
7.6% |
13.0% |
|
Q3'24 Mkt Weighted Average* |
24.6% |
25.5% |
52.9% |
14.7% |
7.9% |
14.5% |
36.9% |
10.0% |
2.3% |
10.4% |
66.3% |
(2.3%) |
23.5% |
4.9% |
12.5% |
|
Q3'23 Mkt Weighted Average** |
11.2% |
29.7% |
47.9% |
21.3% |
7.0% |
17.0% |
37.7% |
27.7% |
24.4% |
(4.3%) |
70.6% |
19.1% |
21.1% |
3.7% |
9.9% |
|
*Market cap weighted as at 13/12/2024 |
|||||||||||||||
|
**Market cap weighted as at 21/09/2023 |
|||||||||||||||
Key takeaways from the table include:
- The listed banks recorded an 24.6% growth in core Earnings per Share (EPS) in Q3’2024, compared to the weighted average growth of 11.2% in Q3’2023, an indication of sustained performance supported by improved operating environment experienced in Q3’2024 on the back of easing inflationary pressures and a strengthening Shilling. The performance during the period was mainly supported by a 14.7% weighted average growth in net interest income, coupled with a 14.5% weighted average growth in non-funded income,
- Investments in government securities investments by listed banks increased in Q3’2024, having recorded a market-weighted average growth of 10.4%, from the 4.3% decline recorded in Q3’2023, with 7 of the 10 listed banks recording an increase in government securities investments,
- The listed banks’ Net loans and advances to customers recorded a weighted average decline of 2.3% in Q3’2024, a significant decline from the 19.1% growth recorded in Q3’2023, an indication of decreased lending attributable to the elevated credit risk following high default rates on the back of high borrowing costs,
- Interest income recorded a weighted average growth of 25.5% in Q3’2024, compared to 29.7% in Q3’2023. Similarly, interest expenses recorded a market-weighted average growth of 52.9% in Q3’2024 compared to a growth of 47.9% in Q3’2023. Consequently, net interest income recorded a weighted average growth of 14.7% in Q3’2024, albeit lower than the 21.3% growth recorded in Q3’2023,
- Notably, non-funded income growth softened during the quarter, as evidenced by non-funded income weighted average growth of 14.5% in Q3’2024 compared to a weighted average growth of 17.0% in Q3’2023. The performance was largely attributable to the decrease in foreign exchange income recorded by the banks during the period as a result of decreased dollar demand in the country following the appreciation of the Shilling. Additionally, listed banks recorded a weighted average growth of 10.0% in total fees and commissions income in Q3’2024 compared to a weighted growth of 27.7% in Q3’2023, and,
- The listed banks recorded a 23.5% weighted average return on average equity (ROaE), 2.4% points above the 21.1% ROaE registered in Q3’2023. Additionally, the entire banking sector’s Return On Equity (ROE) stood at 9% as of September 2024, a 1.1% points decrease from the 26.0% recorded in June 2024. On a global level, the Kenyan banking sector continues to record high profitability compared to other economies in the world, as highlighted in the chart below:
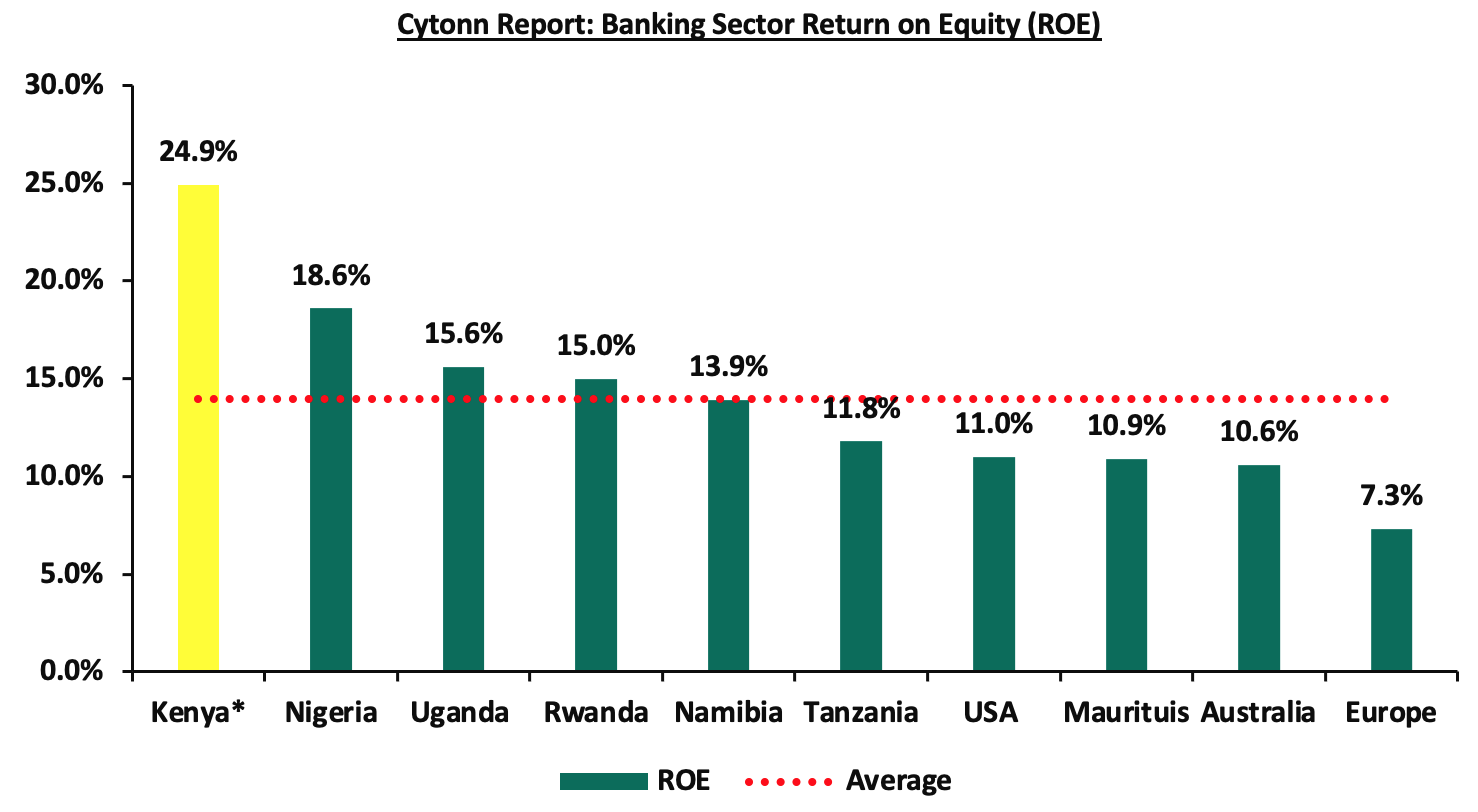
For more information, see our Kenya Listed Banks Q3’2023 Report.
- Insurance Sector Earnings:
During the year, Kenya listed insurers released their H1’2024 results, recording a weighted average increase in core earnings per share of 39.6% in H1’2024, significantly higher compared to the weighted decline of 235.5%, in H1’2023. The table below highlights the performance of the listed insurance sector, showing the performance using several metrics, and the key take-outs of the performance;
|
Cytonn Report: Listed Insurance Companies H1’2024 Earnings and Growth Metrics |
||||||||
|
Insurance |
Core EPS Growth |
Net Premium growth |
Claims growth |
Loss Ratio |
Expense Ratio |
Combined Ratio |
ROaE |
ROaA |
|
Liberty |
196.7% |
403.1% |
(295.6%) |
70.6% |
104.4% |
175.0% |
6.7% |
1.4% |
|
Sanlam |
164.1% |
28.4% |
15.6% |
89.6% |
74.3% |
163.9% |
28.0% |
0.8% |
|
Jubilee Insurance |
22.7% |
28.4% |
15.6% |
89.6% |
74.3% |
163.9% |
4.8% |
1.3% |
|
Britam |
22.6% |
7.4% |
14.6% |
76.2% |
69.1% |
145.3% |
8.0% |
2.0% |
|
CIC |
0.6% |
(0.4%) |
(6.9%) |
81.0% |
29.1% |
110.1% |
7.9% |
1.3% |
|
*H1'2024 Weighted Average |
39.6% |
51.7% |
(18.2%) |
81.1% |
68.2% |
149.4% |
7.3% |
1.6% |
|
**H1'2023 Weighted Average |
(235.5%) |
6.7% |
(3.6%) |
57.8% |
56.4% |
114.2% |
3.2% |
1.0% |
|
*Market cap weighted as at 18/10/2024 |
|
|||||||
|
**Market cap weighted as at 27/10/2023 |
|
|||||||
The key take-outs from the above table include;
- Core EPS growth recorded a weighted growth of 39.6%, significantly higher compared to the weighted decline of 235.5%, in H1’2023. The improved growth in earnings was attributable to increased premiums during the period following continued recovery by the sector from the impacts of the COVID-19 pandemic, coupled with higher yields from government papers,
- The premiums grew at a significantly quicker pace of 51.7% in H1’2024, compared to a growth of 6.7% in H1’2023, while claims declined at a higher rate of 18.2% in H1’2024, from the 3.6% decline recorded in H1’2023 on a weighted average basis,
- The loss ratio across the sector increased to 81.1% in H1’2024 from 57.8% in H1’2023,
- The expense ratio increased to 68.1% in H1’2024, from 56.4% in H1’2023, owing to an increase in net premiums,
- The insurance core business still remains unprofitable, with a combined ratio of 149.4% as of H1’2024, higher than the 114.2% in H1’2023, and,
- On average, the insurance sector delivered a Return on Average Equity (ROaE) of 7.3%, an increase from a weighted Return on Average Equity of 3.2% in H1’2023.
For more information, see our Kenya H1’2023 Listed Insurance Report.
Other Key Results
Safaricom Limited released the H1’2025 results, recording an decrease in core earnings per share of 17.7% to Kshs 0.7 in H1’2025, from Kshs 0.9 in H1’2024. The decrease was largely attributable to a 34.6% increase in operating expenses to Kshs 114.4 bn from Kshs 84.9 bn recorded in H1’2024, which outpaced the 15.1% growth in total revenue to Kshs 189.4 bn in H1’2025, from Kshs 164.6 bn in H1’2024. . The group achieved a 15.1% year-on-year (YoY) growth in total revenue, reaching Kshs 189.4 billion, up from Kshs 164.6 billion recorded in H1’2024 with the profit after tax decreasing by 63.2% to Kshs 10.0 bn in H1’2025, from Kshs 27.2 bn.
During the year, 9 companies issued profit warnings to investors, compared to 15 companies in 2023 and 11 companies in 2022. The decreased in number of companies that issued profit warning in 2024 is an indication of improving economic conditions brought about by the continued appreciation of the Kenyan Shilling against other global currencies and reduced rate of inflation. The situation was however weighed down by the reduction in purchasing power of consumers occasioned by the high cost of living and increased taxes in addition to disruption of the global supply chain due to the challenging geopolitics resulting in high production costs. Companies are required to issue profit warnings if they project a more than 25.0% decline in profits year-on-year. Below is the summary of the said companies:
|
Cytonn Report: Companies that issued profit warnings |
||||
|
No |
2024 |
2023 |
2022 |
2021 |
|
1 |
Express Kenya |
Car & General |
Bamburi Cement PLC |
Centum Plc |
|
2 |
Kakuzi Plc |
Centum Plc |
Centum Investments Co Plc |
Umeme Limited |
|
3 |
Total Energies Kenya Plc |
Crown Paints Kenya |
Crown Paints Kenya PLC |
Williamson Tea Kenya PLC |
|
4 |
WPP Scangroup Plc |
Eveready |
Flame Tree Group Holdings Ltd |
WPP ScanGroup PLC |
|
5 |
Sasini Plc |
Express Kenya |
Kakuzi Plc |
|
|
6 |
Eaagads Limited |
Kakuzi Plc |
Liberty Kenya Holdings Ltd |
|
|
7 |
Bamburi Cement PLC |
Kenya Airways |
Nairobi Securities Exchange PLC |
|
|
8 |
Umeme Limited |
KPLC |
Sameer Africa plc |
|
|
9 |
Limuru Tea PLC |
Longhorn Publishers Plc |
Sanlam Plc |
|
|
10 |
|
Nation Media Group |
The Limuru Tea Kenya Plc |
|
|
11 |
|
Sameer Africa Plc |
|
|
|
12 |
|
Sanlam Plc |
|
|
|
13 |
|
Sasini Plc |
|
|
|
14 |
|
Unga Plc |
|
|
|
15 |
|
WPP Scan Group |
|
|
The key highlights from the tale include:
- Limuru Tea Plc was the first company in 2024 to issue a profit warning ahead of the release of its financials for the year ended 31st December 2023, indicating that the expected decline in earnings was due to the importation cost of fertilizer which was adversely impacted by the depreciation of the Kenya Shilling against the US Dollar,
- Umeme Limited issued a profit in January 2024 ahead of the release of its financials for the year ended 31st December 2023 indicating that the expected decline in its net profits was mainly due to the increased amortisation charge for the year .The Company aligned amortisation of its non-current assets to the shorter of the remaining duration of its Electricity Distribution Concession or the underlying useful life of the assets that generate economic benefits to the Company in order to comply with International Financial Reporting Standards (IFRS),
- Eaagads Limited issued a profit warning in March 2024 ahead of the release of its financials for the 11 months ended 29th February 2024 noting that the expected decline in its earnings was mainly due to by decrease in the volume of coffee offered to the market,
- Bamburi cement Plc issued a profit warning in April 2024 stating that the expected decline in its full-year profit 2023 was due one-off settlement of outstanding tax liabilities and legal disputes in Hima Cement Limited in Uganda (“Hima Cement”) as part of closure of the sale transaction thereby impacting 2023 results,
- Sasini Plc issued a profit warning in August 2024 ahead of release of its half-year financials. The decline in its earnings was mainly due to several extenuating circumstances in the global macro environment; the global economic situation and continuing geopolitical disruptions in the business value chain,
- WPP ScanGroup Ltd issued a profit warning in November 2024 for the financial year ending 31st December 2024, indicating the expected decline in its earnings is mainly due to foreign exchange losses driven by the significant appreciation of the Kenyan Shilling versus the reported gains in 2023,
- Kakuzi Plc also issued a profit warning for the financial year 2024, indicating that the expected decline in earnings is mainly a result of lower turnover from Avocado exports arising from a lower crop and supply chain disruptions due to the prevailing Middle East geopolitical tensions. The Red Sea route to European markets is effectively closed. The longer journey times, around the Cape, has resulted in significant quantities of spoilt fruit with low market returns,
- Total Energies Kenya Plc also issued a profit warning in December for the year ending 31st December 2024 indicating that the expected decline in earnings is mainly attributable to the high interest rates leading to increased finance costs, compounded by a challenging and volatile business environment,
- Express Kenya Plc also issued a profit warning for the financial year ending 31st December 2024, indicating that the expected decline in earnings is mainly attributable to the decrease in demand for the warehousing operations and low economic activities occasioned by the tough economic environment during the year,
Below is a summary of the number of companies that issued profit warnings over the last 9 years:
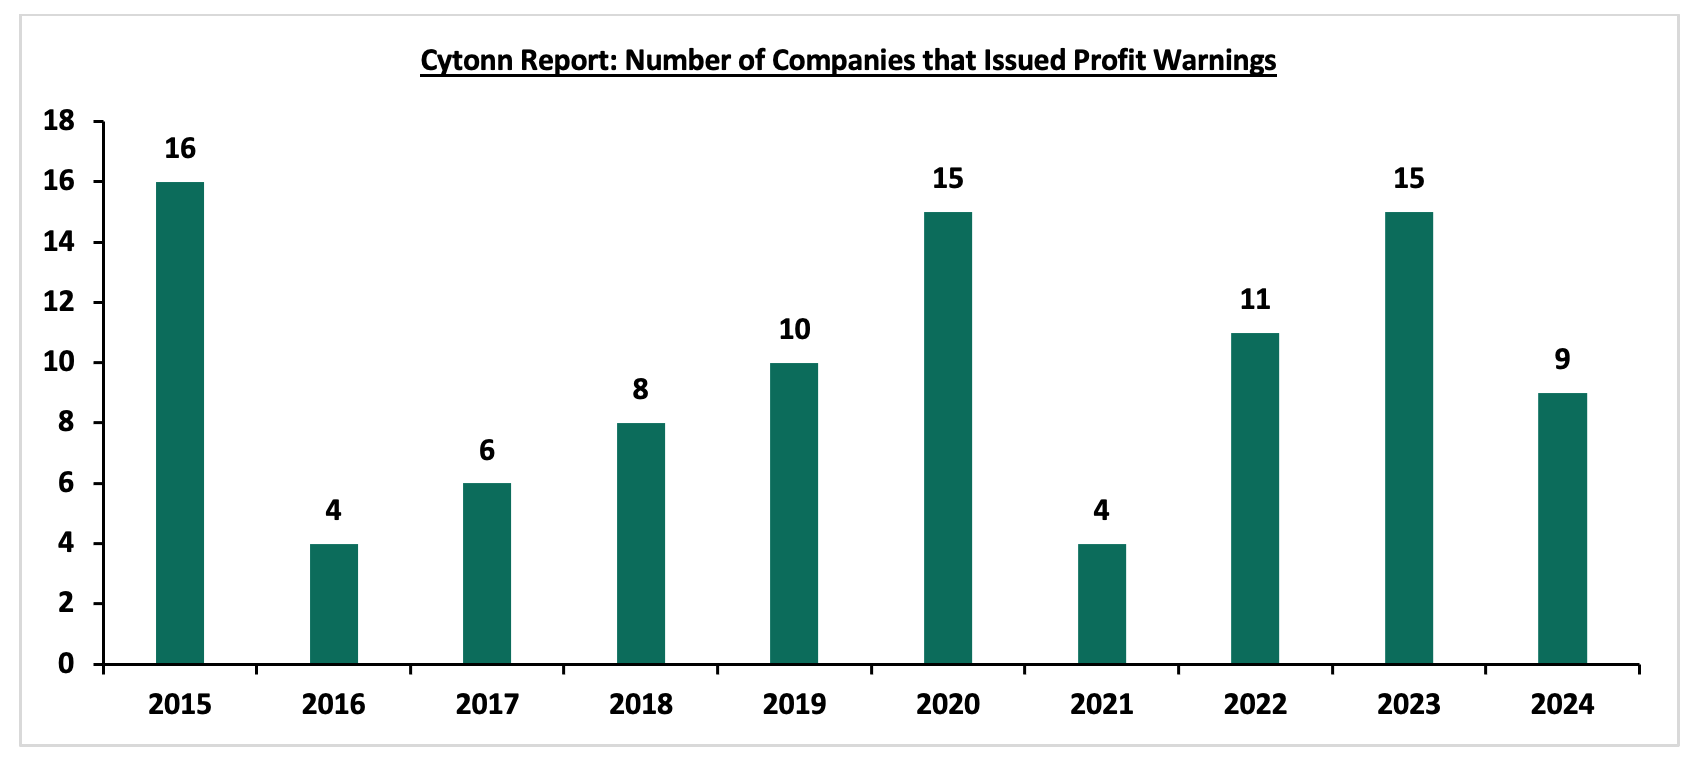
Source: Cytonn Research, NSE
- Listings and Suspensions
In May 2024,the Nairobi Securities Exchange admitted the Linzi Sukuk on the NSE Unquoted Securities Platform (USP) making the product the first Shari’ah compliant product to be admitted on the platform. The NSE also delisted Acorn Green Bond from the Nairobi Securities Exchange ,this follows the successful early redemption of the outstanding Kshs 2.7 billion under Acorn Project (Two) Limited Liability Partnership’s Medium-Term Note Programme. Additionally, ILAM FAHARI-I REIT received the regulatory approval to delist from the Main Investment Market Segment (MIMS) of the Nairobi Securities Exchange (NSE) and is now listed at the Unquoted Securities Platform (USP) of the Nairobi Securities Exchange (NSE) following a comprehensive restructuring of the REIT. Four companies remained suspended at the Nairobi Securities Exchange, namely, Deacons (East Africa) PLC, ARM Cement PLC, Mumias Sugar Co. Ltd. and Kenya Airways.The chart below shows the number of listed companies in the Nairobi Securities Exchange for the period 2010-2024:
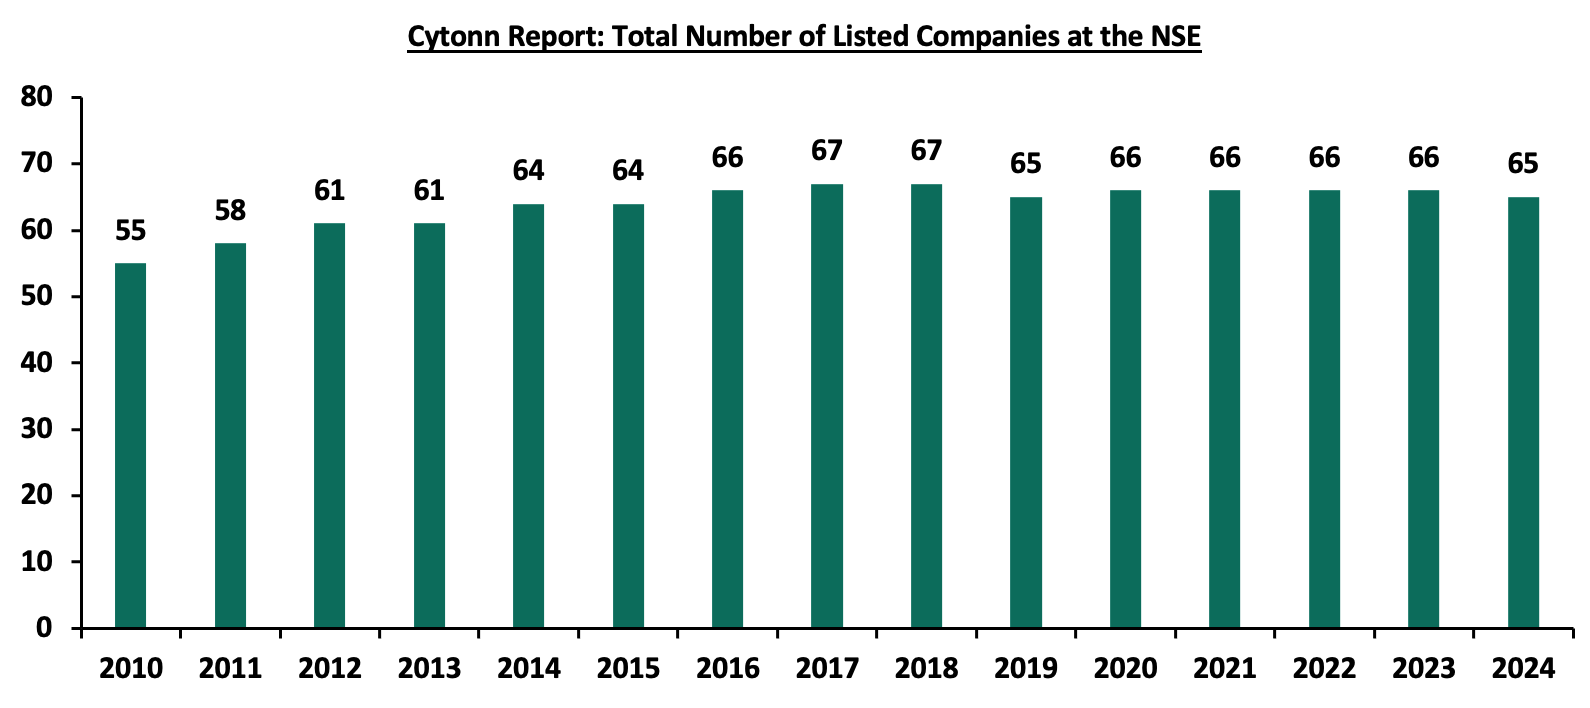
Source: CMA Quarterly Statistical Bulletins
- Liquidations
- During the year, just like in 2023, there were no liquidations, announced by the Central Bank. Data from the office of the official receiver, however, shows that 111 insolvencies were filed between January and October this year by debtors and courts. In the insurance sector, the Insurance Regulatory Authority (IRA) placed Xplico Insurance, Invesco Assurance and Resolution Insurance under statutory management and provisional liquidation. The issues stem from prolonged financial difficulties, boardroom conflicts, and eroding market share, particularly in loss-making segments like Public Service Vehicle (PSV) insurance. The collapse of these insurers affects customer trust, disrupts the industry’s stability, and forces policyholders to seek alternative coverage. The industry must address governance, risk management, and liquidity issues to restore stability and consumer confidence.
- Legislation and other Developments
During the year, there were legislative changes and other developments that affected the equities market and investor sentiments, namely;
- Trading rules for fixed income securities- In January 2024, the Nairobi Securities Exchange announced amendments to its trading Rules to provide a comprehensive framework for trading fixed income securities on the Nairobi Securities Exchange. These rules are designed to enhance market transparency, efficiency, and integrity by outlining clear procedures for trading, order matching, and settlement. They establish guidelines for market participants, access to the Automated Trading System (ATRS), and the use of dedicated trading boards for unrestricted and restricted securities. Additionally, the rules emphasize strict compliance, supervision, and enforcement mechanisms to maintain a well-regulated and professional trading environment. The key takeaways from this announcement included that:
- Trading Hours-Fixed income securities trading takes place on all official trading days from 9:00 a.m. to 3:00 p.m. The trading hours may be adjusted by the Chief Executive Officer of the NSE in consultation with the Capital Markets Authority (CMA).
- Access to Automated Trading System (ATRS)-Market participants can access the trading system through Remote Broker Server, allowing brokers to operate outside the NSE premises and designated terminals located on the Trading Floor at the NSE headquarters.
- Conduct and Dress Code-All personnel operating on the Trading Floor are required to adhere to a formal dress code to maintain professionalism. Distinct jacket colors are used for identification of roles:
- Green jackets for NSE Trading Floor staff.
- Red jackets for Stockbroker ATRS Operators.
- Light blue jackets for Dealer ATRS Operators.
- Fixed Income Securities Quotations Board-This board is specifically designed to display indicative two-way quotes (bid and ask prices) for selected fixed income instruments. Quotes provided must adhere to a strict maximum spread of 100 basis points between bid and ask prices, ensuring fair and competitive pricing. The prices are benchmarked against the NSE Yield Curve established at the end of the previous trading session.
- Fixed Income Securities Board-The trading platform includes two distinct boards; Unrestricted Board: Open to all classes of investors, allowing for broad participation in the market and Restricted Board: Specifically reserved for sophisticated investors, such as institutional clients or high-net-worth individuals, to trade in specialized instruments. All transactions are settled on a T+3 basis (three business days after the trade date)
- Order Input and Trading-Orders can be entered for onscreen trading (visible to all participants) and Over-the-Counter (OTC) trading trades must be reported by licensed trading entities to ensure compliance with settlement obligations.
- Order Matching and Trading Sessions-Continuous trading is facilitated through the ATRS, which uses advanced algorithms to match orders based on price priority (better prices matched first) and time priority (earliest entered orders matched first).
- Trading Halts and Cancellations-Trading may be halted under specific circumstances, such as significant market disruptions, regulatory announcements, or unforeseen events affecting specific securities.
- Supervision and Compliance-The Exchange actively monitors trading activities to ensure adherence to rules and regulations. Robust enforcement mechanisms are in place to address violations, ranging from warnings to penalties or suspensions, depending on the severity of the breach.
- Share purchase and consolidation
During the year, consolidation activity remained one of the key highlights witnessed in 2023, as players in the sector were either acquired or merged, leading to the formation of relatively larger, well capitalized, and possibly more stable entities. The following were some of the major M&A’s activities witnessed during the year.
- On March 20, 2024 Access Bank Plc announced that it had entered into a share purchase agreement with KCB Group Plc that would allow Access Bank Plc to acquire 100% shareholding in National Bank of Kenya Limited (NBK) from KCB. Access Bank Plc is a wholly owned subsidiary of Access Holdings Plc listed on the Nigerian Exchange as Access Corporation. Notably, KCB Bank had acquired the National Bank of Kenya back in 2019 in a rescue deal that was supervised by the Central Bank of Kenya. The announcement follows the release of the FY’2023 results for the KCB group, which revealed a decline in earnings with its Core earnings per share (EPS) declining by 8.3% to Kshs 11.7, from Kshs 12.7 in FY’2022. The transaction represents an important milestone for Access Bank as it moves closer to the achievement of its five-year strategic plan through increased scale in the Kenyan market. In the signed deal, Access Bank will pay multiples of 1.3x the book value of NBK, which stood at Kshs 10.6 bn as of end December 2023. This values the deal at about Kshs 13.3 bn with the actual figure to be announced when the transaction is completed. For more information, please see our Cytonn Weekly #12/2024,
- In April 2024, Sidian Bank disclosed that the founders of the bank and other nine individual shareholders relinquished a combined stake of 728,525 shares representing 16.6% stake to Pioneer General Insurance Limited, pioneer Life Investments Limited, Wizro Enterprises Limited, Afrah Limited, and Telesec Africa Limited. The transaction amounted to Kshs 0.8 bn translating to a price to book multiple (p/bv) of 1.0x. This follows an earlier transaction executed on October 2023 when Pioneer General Insurance, Wizpro Enterprise and Afram Limited bought 38.9% stake in the lender following a shareholders’ resolution passed on 20th September 2023 approving the sale.
Below is a summary of the deals in the last 10 years that have either happened, been announced or expected to be concluded:
|
Cytonn Report: Banking Sector Deals and Acquisitions |
||||||
|
Acquirer |
Bank Acquired |
Book Value at Acquisition (Kshs bn) |
Transaction Stake |
Transaction Value (Kshs bn) |
P/Bv Multiple |
Date |
|
Pioneer General Insurance and four other companies |
Sidian Bank |
5.0 |
16.57% |
0.8 |
1.0x |
Apr-24 |
|
Access Bank PLC (Nigeria)* |
National Bank of Kenya |
10.6 |
100.00% |
13.3 |
1.3x |
Mar-24* |
|
Pioneer General Insurance and two other companies |
Sidian Bank |
5.0 |
38.91% |
2.0 |
1.0x |
Oct-23 |
|
Equity Group |
Cogebanque PLC ltd |
5.7 |
91.13% |
6.7 |
1.3x |
Dec-23 |
|
Shorecap III |
Credit Bank Plc |
3.6 |
20.00% |
0.7 |
1.0x |
Jun-23 |
|
Premier Bank Limited |
First Community Bank |
2.8 |
62.50% |
Undisclosed |
N/A |
Mar-23 |
|
KCB Group PLC |
Trust Merchant Bank (TMB) |
12.4 |
85.00% |
15.7 |
1.5x |
Dec-22 |
|
Equity Group |
Spire Bank |
Unknown |
Undisclosed |
Undisclosed |
N/A |
Sep-22* |
|
Access Bank PLC (Nigeria)* |
Sidian Bank |
4.9 |
83.40% |
4.3 |
1.1x |
June-22* |
|
KCB Group |
Banque Populaire du Rwanda |
5.3 |
100.00% |
5.6 |
1.1x |
Aug-21 |
|
I&M Holdings PLC |
Orient Bank Limited Uganda |
3.3 |
90.00% |
3.6 |
1.1x |
Apr-21 |
|
KCB Group** |
ABC Tanzania |
Unknown |
100.00% |
0.8 |
0.4x |
Nov-20* |
|
Co-operative Bank |
Jamii Bora Bank |
3.4 |
90.00% |
1 |
0.3x |
Aug-20 |
|
Commercial International Bank |
Mayfair Bank Limited |
1.0 |
51.00% |
Undisclosed |
N/A |
May-20* |
|
Access Bank PLC (Nigeria) |
Transnational Bank PLC. |
1.9 |
100.00% |
1.4 |
0.7x |
Feb-20* |
|
Equity Group ** |
Banque Commerciale Du Congo |
8.9 |
66.50% |
10.3 |
1.2x |
Nov-19* |
|
KCB Group |
National Bank of Kenya |
7.0 |
100.00% |
6.6 |
0.9x |
Sep-19 |
|
CBA Group |
NIC Group |
33.5 |
53%.47% |
23 |
0.7x |
Sep-19 |
|
Oiko Credit** |
Credit Bank |
3.0 |
22.80% |
1 |
1.5x |
Aug-19 |
|
CBA Group** |
Jamii Bora Bank |
3.4 |
100.00% |
1.4 |
0.4x |
Jan-19 |
|
AfricInvest Azure |
Prime Bank |
21.2 |
24.20% |
5.1 |
1.0x |
Jan-18 |
|
KCB Group |
Imperial Bank |
Unknown |
Undisclosed |
Undisclosed |
N/A |
Dec-18 |
|
SBM Bank Kenya |
Chase Bank Ltd |
Unknown |
75.00% |
Undisclosed |
N/A |
Aug-18 |
|
DTBK |
Habib Bank Kenya |
2.4 |
100.00% |
1.8 |
0.8x |
Mar-17 |
|
SBM Holdings |
Fidelity Commercial Bank |
1.8 |
100.00% |
2.8 |
1.6x |
Nov-16 |
|
M Bank |
Oriental Commercial Bank |
1.8 |
51.00% |
1.3 |
1.4x |
Jun-16 |
|
I&M Holdings |
Giro Commercial Bank |
3.0 |
100.00% |
5 |
1.7x |
Jun-16 |
|
Mwalimu SACCO |
Equatorial Commercial Bank |
1.2 |
75.00% |
2.6 |
2.3x |
Mar-15 |
|
Centum |
K-Rep Bank |
2.1 |
66.00% |
2.5 |
1.8x |
Jul-14 |
|
GT Bank |
Fina Bank Group |
3.9 |
70.00% |
8.6 |
3.2x |
Nov-13 |
|
Average |
|
|
73.3% |
|
1.3x |
|
|
Average: 2013 to 2018 |
|
|
73.5% |
|
1.7x |
|
|
Average: 2019 to 2024 |
|
|
73.2% |
|
1.0x |
|
|
* Announcement Date ** Deals that were dropped |
||||||
- HF Group Announces Rights Issue Results
In 2024, HF Group released the results of its earlier approved rights issue, announcing that the rights were oversubscribed, with the oversubscription rate coming in at 138.3% having received offers worth Ksh 6.4 bn against the offered Ksh 4.6 bn. Notably, the Group accepted 474,201,310 shares under the entitlement option against the offered 769,228,336 million, translating to an acceptance rate of 61.7%.
The rights issue offered a total of 1,499,995,255 new shares at an offer price of Ksh 4.0 per share, including 769,228,336 entitlement shares, 384,614,168 additional shares, and 346,152,751 Green Shoe Option shares. The entitlement ratio was two shares for every one ordinary share held, with a minimum success rate of 40.0%. If fully subscribed, the rights issue was expected to raise gross proceeds of Ksh 4.6 bn, increasing to Ksh 6.0 bn with a 100.0% uptake of the Green Shoe Option.
The results revealed that a total of 474,201,310 shares were accepted under entitlement, representing a take-up rate of 61.7%, with a total value of Ksh 1.9 bn. Additionally, 1,121,794,656 shares were applied for under additional shares, valued at KES 4.5 billion. This represents a subscription rate of 291.6% for the 384,614,168 additional shares initially offered. To cater to the oversubscription, the Green Shoe Option, which allows for an additional 346,152,751 shares, was exercised. The additional shares were allocated from a combined pool of 295,027,026 untaken shares, 384,614,168 additional shares, and 346,152,751 Green Shoe Option shares. Combined, the grand total number of new shares applied for under the rights issue stood at 1,595,995,966, valued at Ksh 6.4 bn. The table below summarizes the rights issue results statistics;
|
Cytonn Report: HF Group Rights Issue Results Summary |
|
|
Data |
Statistic |
|
Total number of new shares accepted under entitlement |
474,201,310 |
|
Total value of new shares accepted under entitlement |
Kshs 1,896,805,240 |
|
Take up percentage under entitlement |
61.7% |
|
Total number of additional new shares applied for under additional shares |
1,121,794,646 |
|
Total value of additional new shares applied for under additional shares |
Kshs 4,487,178,624 |
|
Grand total number of new shares applied for under the rights issue (entitlement shares + additional shares) |
1,595,995,966 |
|
Grand total value of new shares applied for under the rights issue (Entitlement shares + additional shares) |
Ksh 6,383,983,864 |
|
Overall subscription performance rate |
138.3% |
Source: HF Group
The proceeds from the rights issue will be directed towards several key areas aligned with HF Group’s long-term strategy. Primarily, the Group aims to use this capital to reinforce its investment in HFC Limited’s expanded business segments, which cover a wide range of financial services tailored to both retail and corporate clients. Before the rights issue, HF Group's capital adequacy ratios were significantly below the statutory requirements set by the Central Bank of Kenya in Q3’2024, with both Core Capital to Total Liabilities and Core Capital to Total Risk-Weighted Assets ratios in deficit. Post-rights issue, HF Group’s capital adequacy position will improve significantly, and will be above the statutory minimums. The table below shows the capital adequacy ratios before and after the rights issue;
|
Capital Adequacy Ratios |
Before the rights issue |
After the rights issue |
Change |
|
Core Capital/Total Deposit Liabilities |
3.7% |
20.6% |
16.9% |
|
Minimum Statutory ratio |
8.0% |
8.0% |
0.0% |
|
Excess |
(4.3%) |
12.6% |
16.9% |
|
Core Capital/Total Risk Weighted Assets |
4.3% |
18.0% |
13.7% |
|
Minimum Statutory ratio |
10.5% |
10.5% |
0.0% |
|
Excess |
(6.2%) |
7.5% |
13.7% |
Compared to peer banks in Kenya, HF Group will become sufficiently capitalized after accounting for the rights issue. The tables before show HF Group’s capital adequacy ratios compared to its peers;
|
Cytonn Report: Q3’2024 Capital adequacy to Risk Weighted Assets |
|||
|
Bank |
Ratio |
Minimum statutory ratio |
Excess/(Deficit) |
|
Standard Chartered |
20.9% |
10.5% |
10.4% |
|
Cooperative Bank |
19.1% |
10.5% |
8.6% |
|
DTB-K |
18.6% |
10.5% |
8.1% |
|
HF Group* |
18.0% |
10.5% |
7.5% |
|
NCBA Group |
17.2% |
10.5% |
6.7% |
|
Equity Group |
15.9% |
10.5% |
5.4% |
|
Absa Group |
15.6% |
10.5% |
5.1% |
|
Stanbic Holdings |
14.7% |
10.5% |
4.2% |
|
I&M Group |
14.6% |
10.5% |
4.1% |
|
KCB Group |
14.5% |
10.5% |
4.0% |
|
HF Group** |
4.3% |
10.5% |
(6.2%) |
*After the rights issue
**Before the rights issue
|
Cytonn Report: Q3’2024 Capital adequacy to Risk Weighted Liabilities |
|||
|
Bank |
Ratio |
Minimum statutory ratio |
Excess/(Deficit) |
|
HF Group* |
20.6% |
8.0% |
12.6% |
|
Standard Chartered |
20.2% |
8.0% |
12.2% |
|
DTB-K |
19.7% |
8.0% |
11.7% |
|
Absa Group |
19.1% |
8.0% |
11.1% |
|
Cooperative Bank |
18.0% |
8.0% |
10.0% |
|
I&M Group |
17.4% |
8.0% |
9.4% |
|
Equity Group |
16.9% |
8.0% |
8.9% |
|
Stanbic Holdings |
16.5% |
8.0% |
8.5% |
|
NCBA Group |
15.6% |
8.0% |
7.6% |
|
KCB Group |
13.0% |
8.0% |
5.0% |
|
HF Group** |
3.7% |
8.0% |
(4.3%) |
*After the rights issue
**Before the rights issue
Going forward, it is our expectation that HF Group’s success will hinge on its ability to effectively deploy the new capital to fuel growth and deliver on its strategic goals. As it strengthens its capital base and enhances digital capabilities, HF Group is positioned to expand its customer base and diversify revenue streams, critical for competing in Kenya’s increasingly digitalized financial services sector. Shareholders will be looking for tangible outcomes from these initiatives, particularly in increased profitability and market share.
- Bamburi cement share sale
During the year, On 10th July 2024, Bamburi Cement PLC received a notice of intent from Amsons Industries (K) Limited, a subsidiary of Tanzanian conglomerate Amsons Group, to pursue the acquisition of up to 100.0% of the Company's ordinary shares at an offer price of Kshs 65.0 per share or a total of Kshs 23.5 billion. On 27th August 2024, Savannah Clinker Limited submitted a competing bid to acquire 100.0% of the shares in Bamburi Cement PLC at an offer price of Kshs 70.00. Savannah Clinker's competitive bid prompted Holcim, a Switzerland-based construction company and majority stakeholder in Bamburi PLC with a 58.6% stake, to revoke its binding agreement to sell its shares to Amsons Group. Following this development, Savannah increased its offer to a bid of Kshs 76.55 per share from Kshs 70.00. Savannah Clinker is a private company established in 2019 and primarily engages in mining, processing, and selling cement. This bid reflects Savannah's strategic dedication to increasing Bamburi's value while maintaining its listing on the Nairobi Securities Exchange (NSE).
On 4th December 2024, the Capital Markets Authority (CMA) notified the shareholders of Bamburi Cement PLC and the public that Savannah clinker limited had withdrawn its competing offer for acquisition of Bamburi Cement PLC shares. This is on the back of the arrest of the chairman and the main shareholder of the company, Mr. Benson Ndeta, coupled with the decline by the Capital Markets Authority (CMA) of a request made on 2nd December 2024, to extend the offer period by 60 days to enable the competing offer to respond to any inquiries. Following this development, the only valid offer for Bamburi Cement Plc shares was from Amsons Industries (K) Limited, as approved by CMA without modifications.
Savannah's takeover bid ensures shareholders can continue benefiting from future market opportunities, with a commitment to keeping the cement maker listed on the NSE. The table below shows a comparison of the two offers;
|
|
Item |
Savannah Offer |
Amsons Offer |
|
1 |
Price |
Kshs 76.55 per Share |
Kshs 65.00 Per share |
|
2 |
Long stop Date for the Completion |
28th February 2025 |
28th November 2025 |
|
3 |
Conditions of the Offers |
|
|
|
4 |
Special Dividend in relation to the proceeds received from the completed divestments of Bamburi's shareholding in Hima Cement Limited, Uganda (if any) |
Same as in Offer |
Paid to existing shareholders
|
|
5 |
2024 Dividend |
Same as in Offer |
Payable to the shareholders of Bamburi if the Offer does not close by 23.59 hours Nairobi time on 30 June 2025
|
Bamburi Cement Plc a Kenya-based company specializing in the production and distribution of cement and related products. It has a market cap of 17.1 billion with Holcim being the biggest shareholder with a 58.6% stake. Holcim’s two investments vehicles in Bamburi are Fincem Holdings Limited and Kencem Holdings Limited with 29.3% shareholdings each in Bamburi Cement. The table below shows top shareholders;
|
Shareholder |
No of shares |
Percentage of shareholders |
|
Fincem Holding Limited |
106,360,798.00 |
29.30% |
|
Kencem Holding Limited |
106,360,797.00 |
29.30% |
|
Standard Chartered Nominees |
56,906,640.00 |
15.68% |
|
Aksaya Investment Holdings |
14,956,990.00 |
4.12% |
|
Standard Chartered Nominees |
6,659,900.00 |
1.83% |
|
Standard Chartered Kenya Nominees |
4,080,337.00 |
1.12% |
|
Standard Chartered Nom Non-resident |
2,768,400.00 |
0.76% |
|
Standard Chartered Nom |
2,607,700.00 |
0.72% |
|
Standard Chartered Kenya Nominees |
2,187,900.00 |
0.60% |
|
ICEA Lion Life Assurance Company |
2,055,663.00 |
0.57% |
|
Others (4,599 Shareholders) |
58,014,150.00 |
15.98% |
|
Total Shares Issued |
362,959,275.00 |
100.00% |
Following this development, the only valid offer for Bamburi Cement Plc shares is from Amsons Industries (K) Limited, as approved by CMA without modifications. The price of Bamburi stock closed at Kshs 56.5 on Thursday ahead of its suspension from trading in NSE in order to facilitate reconciliation and the suspension will be for a period to be determined by CMA and NSE. The current share price represents 10.7% depreciation from the Kshs 62.3 traded the previous week and 56.9% gain on year to date.
Amsons group has been approved for Bamburi takeover by Ministry of Mining, Blue Economy and Maritime Affairs for its proposed acquisition of up to 100.0% shares of Bamburi Cement Plc. This approval follows the prior unconditional clearance from the COMESA Competition Commission. The Ministry of Mining approved the Katani Mining License (Registration Number ML/2017/0011) under the Mining Act, and the COMESA Competition Commission verified that the transaction aligns with regional competition regulations. Amsons is ready to conclude the transaction, ushering in a new era of growth for Bamburi Cement Plc. With the support of KCB Investment Bank, Amsons is dedicated to ensuring a smooth closing process, including timely payments to shareholders who accept the offer, enabling them to realize the value of their investment in Bamburi Cement Plc.
Universe of coverage:
|
Cytonn Report: Equities Universe of Coverage |
|||||||||||
|
Company |
Price as at 27/12/2024 |
Price as at 03/01/2025 |
w/w change |
m/m change |
YTD Change 2024 |
Year Open 2024 |
Target Price* |
Dividend Yield*** |
Upside/ Downside** |
P/TBv Multiple |
Recommendation |
|
Jubilee Holdings |
171.0 |
175.3 |
2.5% |
0.9% |
(6.2%) |
185.0 |
260.7 |
8.4% |
60.8% |
0.3x |
Buy |
|
Equity Group |
46.2 |
48.0 |
4.0% |
7.3% |
41.2% |
34.2 |
60.2 |
8.7% |
39.1% |
0.9x |
Buy |
|
CIC Group |
2.2 |
2.2 |
0.0% |
5.4% |
(6.1%) |
2.3 |
2.8 |
6.0% |
36.3% |
0.7x |
Buy |
|
Co-op Bank |
15.9 |
17.7 |
11.0% |
19.2% |
44.9% |
11.4 |
18.8 |
9.4% |
27.7% |
0.8x |
Buy |
|
KCB Group |
40.0 |
42.8 |
7.1% |
8.3% |
89.5% |
22.0 |
50.3 |
0.0% |
25.9% |
0.7x |
Buy |
|
Britam |
6.0 |
5.6 |
(5.4%) |
(3.0%) |
12.8% |
5.1 |
7.5 |
0.0% |
25.8% |
0.8x |
Buy |
|
NCBA |
48.0 |
50.8 |
5.8% |
11.7% |
24.1% |
38.9 |
53.2 |
9.9% |
20.9% |
0.9x |
Buy |
|
ABSA Bank |
17.4 |
19.0 |
9.2% |
20.7% |
56.3% |
11.6 |
19.1 |
8.9% |
18.7% |
1.5x |
Accumulate |
|
Stanbic Holdings |
140.0 |
144.3 |
3.0% |
5.6% |
29.5% |
106.0 |
145.3 |
11.0% |
14.8% |
1.0x |
Accumulate |
|
Standard Chartered Bank |
281.3 |
291.3 |
3.6% |
15.0% |
74.6% |
160.3 |
291.2 |
10.3% |
13.8% |
1.9x |
Accumulate |
|
Diamond Trust Bank |
68.3 |
67.0 |
(1.8%) |
29.0% |
54.2% |
44.8 |
71.1 |
7.3% |
11.5% |
0.3x |
Accumulate |
|
I&M Group |
35.9 |
36.2 |
0.8% |
20.4% |
107.7% |
17.5 |
32.3 |
7.1% |
(2.8%) |
0.7x |
Sell |
|
*Target Price as per Cytonn Analyst estimates **Upside/ (Downside) is adjusted for Dividend Yield ***Dividend Yield is calculated using FY’2023 Dividends |
|||||||||||
We are “Neutral” on the Equities market in the short term due to the current adverse operating environment and huge foreign investor outflows, and, “Bullish” in the long term due to current cheap valuations and expected global and local economic recovery.
With the market currently trading at a discount to its future growth (PEG Ratio at 0.7), we believe that investors should reposition towards value stocks with strong earnings growth and that are trading at discounts to their intrinsic value. We expect the current high foreign investors sell-offs to continue weighing down the economic outlook in the short term.
In 2024, the general Real Estate sector continued to witness considerable growth in activity in terms of property transactions and development activities. Consequently, the sector’s activity contribution to Gross Domestic Product (GDP) grew by 6.0 % to Kshs 281.6 bn in Q2’2024, from Kshs 265.8 bn recorded during the same period in 2023. In addition, the sector contributed 10.3% to the country’s GDP, 0.2% points decrease from 10.5% recorded in Q2’2023. Cumulatively, the Real Estate and construction sectors contributed 18.9% to GDP, a 2.3% points improvement from 16.6% in Q2’2023, evidencing their growing contribution to Kenya's economy. The graph below highlights the Real Estate and Construction sectors’ contribution to GDP from 2020 to Q2’2024;
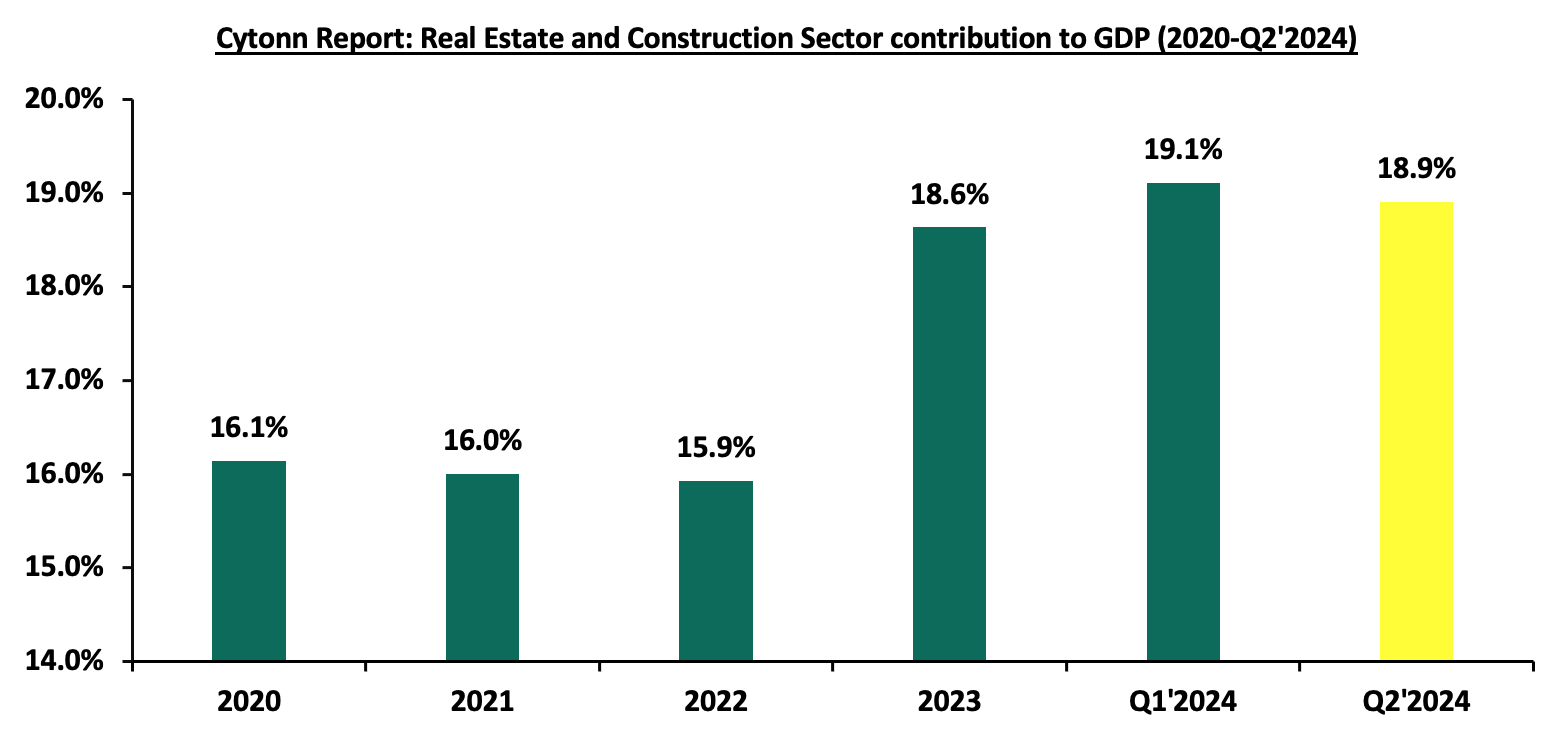
Source: Kenya National Bureau of Statistics (KNBS)
Additionally, the escalation of selling and rental prices eased, propelled by ongoing economic recovery from inflationary pressures and appreciation of the shilling against the United States dollar. Some of the key factors that continued to positively shape the performance of the Real Estate sector include;
- The government's ongoing focus on the Affordable Housing Program has been a major driver of growth. By incentivizing public-private partnerships and allocating resources for large-scale housing projects, the program has stimulated both residential construction and infrastructure development Currently, the AHP pipeline boasts an estimated total of 746,795 housing units under construction by both the government and private sector,
- Continuous improvements in infrastructure, such as new roads, bridges, and utilities, have opened up previously inaccessible areas for real estate development. This has led to increased property value and demand in urban and peri-urban areas. The government has continually prioritized infrastructural development in efforts aimed at positioning the country as a regional hub through the implementation of several key projects including, Makupa Bridge, Nairobi Expressway, Nairobi Western and Eastern Bypasses among others. Notable projects delivered in 2024 include phase two of the Dongo Kundu bypass project,
- Kenya Mortgage Refinance Company (KMRC) has continued to drive the availability and affordability of home loans to Kenyans by providing single-digit fixed rate, and long-term finance to Primary Mortgage Lenders (PMLs) such as banks and SACCOs. Recently, KMRC, broadened its refinancing services to include non-shareholders, such as SACCOs and microfinance institutions. This is a strategic move to improve access to affordable mortgages, particularly for low and middle-income earners, a key target of Kenya's affordable housing agenda,
- The retail landscape has seen a surge in growth, with both domestic and international retailers like Naivas, QuickMart, China Square, and Carrefour aggressively expanding their market presence. These retailers are capitalizing on the opportunities created by the exit of distressed chains like Choppies, Nakumatt, Tuskys, and Uchumi. Furthermore, the influx of global brands such as Adidas, Puma, Aldo, and Michael Kors is poised to further fuel the sector's growth and development,
- Kenya continues to enjoy recognition as a regional business hub. As a result, foreign entities have continued to open business operations in Kenya, boosting the demand for both commercial and residential Real Estate. Increased business activity has driven up demand for office space, apartments, and housing near business hubs, leading to the development of new projects, increased property values, and job creation in the construction sector,
- With relatively high urbanization and population growth rates of 3.7% p.a and 2.0% p.a, respectively, against the global average of 1.7% p.a and 0.9% p.a, respectively, as at 2023, there is a sustained demand for more housing units in the country,
- Increase in investor confidence has greatly influenced hospitality sector and this is evident through mergers, acquisitions and expansions of hotels. Furthermore, the number of international arrivals into the country registered a 13.0% year-to-year (y/y) increase to 149,922 persons as of June 2024 from 132,297 arrivals recorded in June 2023. Notably, the Hotel Chain Development Pipelines in Africa 2024 Report ranked Nairobi at 7th position by planned number of hotels and rooms with 31 hotels and 4,268 rooms in the pipeline, and,
- There has been an increased popularity of purpose-built properties to host Student housing, medical centers, Diplomatic residentials, data centers which offer potential for growth to the Real Estate sector through alternative markets. Due to these assets classes, the industry remains resilient despite the rapidly changing technological and economic environments.
Despite the above cushioning factors, there were various challenges that impeded the optimum performance of the Real Estate sector such as;
- Rising Construction costs increased by 17.6% in H1’2024 to an average of Kshs 83,731 per SQM from an average of Kshs 71,200 per SQM recorded in 2023. The rise is primarily due to the hike in prices of key construction materials such as cement, steel, paint, aluminum, and PVC on the back of rising inflation. These higher costs are expected to impede development activities in the sector,
- Existing oversupply of physical space in select sectors. With approximately 5.8 mn SQFT in the NMA commercial office market, approximately 3.0 mn SQFT in the Nairobi Metropolitan Area (NMA) retail market, with the rest of the Kenyan retail market having an oversupply of approximately 1.7 mn SQFT. This has led to prolonged vacancy rates in the respective Real Estate sectoral themes,
- The REITs market in Kenya continues to be subdued owing to various challenges such as the large capital requirements of Kshs 100.0 mn for trustees compared to Kshs. 10 mn for pension funds Trustees which limits the role to banks, prolonged approval process for REITs, only a few legal entities capable of incorporating REITs, high minimum subscription amounts or offer parcels set at Kshs 0.1 mn for D-REITs and 5.0 mn for restricted I-REITs and lack of adequate knowledge of the financial asset class by investors,
- Constrained financing to developers as lenders continues to tighten their lending requirements and demand more collateral from developers as a result of the high credit risk in the real estate sector. This is evidenced by an increase in Gross non-performing loans in the building and construction sector which increased by 18.0% on a y/y to Kshs 43.8 bn in Q1’2024 from Kshs 35.9 bn in Q1’2023. The table below shows the annual Real Estate rental yields for existing properties from FY’2017 to FY’2024;
|
Cytonn Report: Annual Real Estate Rental Yields Summary Table, for Existing Properties |
||||||||||
|
|
FY’2017 |
FY’2018 |
FY’2018 |
FY’2020 |
FY’2021 |
FY’2022 |
FY’2023 |
FY’2024 |
Y/Y Change (% Points) |
|
|
Average Rental Yield |
7.6% |
7.4% |
7.0% |
6.1% |
6.5% |
6.8% |
6.1% |
7.5% |
1.4% |
|
Source: Cytonn Research
Sectoral Market Performance
- Residential Sector
During FY’2024, the NMA residential sector recorded a slight downtrend in performance, with the average total returns to investors coming in at 5.8%, a 0.3%-point decline from 6.1% recorded in FY’2023. The performance was attributed to a decrease in the residential average y/y price appreciation which came in at 0.4% in FY’2024, 0.2%-points lower than the 0.6% appreciation recorded in FY’2023, driven by slowed property transactions during the year. On the other hand, the average rental yield came in at 5.4% in FY’2024, recording a 0.1%-points decline from the 5.5% rental yield recorded in FY’2023. This was driven by a decline in the average rent per SQM by 5.3 % to Kshs 567, from Kshs 599 recorded in FY’2023. The table below shows the NMA residential sector’s performance during FY’2023 and FY’2024;
|
All values are in Kshs unless stated otherwise |
|||||||||||
|
Cytonn Report: Residential Apartments Summary FY'2024 |
|||||||||||
|
Area |
Average of Price per SQM FY'2024 |
Average of Rent per SQM FY'2024 |
Average of Rental Yield FY'2024 |
Average of Price Appreciation FY'2024 |
Total Returns FY'2024 |
Average of Rental Yield FY'2023 |
Average of Price Appreciation FY'2023 |
Total Returns FY'2023 |
y/y ∆ in Rental Yield |
y/y ∆ in Price Appreciation |
y/y ∆ in Total Returns |
|
Detached Units |
|||||||||||
|
High End |
198,900 |
863 |
4.8% |
0.1% |
4.9% |
5.4% |
0.4% |
5.8% |
(0.6%) |
(0.3%) |
(0.9%) |
|
Lower Middle |
80,839 |
362 |
4.9% |
0.6% |
5.5% |
5.3% |
0.8% |
6.1% |
(0.4%) |
(0.2%) |
(0.6%) |
|
Upper Middle |
145,906 |
632 |
5.0% |
0.3% |
5.3% |
5.4% |
0.3% |
5.7% |
(0.4%) |
(0.0%) |
(0.4%) |
|
Detached Grand Average |
141,882 |
619 |
4.9% |
0.4% |
5.2% |
5.4% |
0.5% |
5.9% |
(0.5%) |
(0.1%) |
(0.6%) |
|
Apartment |
|||||||||||
|
Lower Mid-End Suburbs |
91,530 |
473 |
5.7% |
0.0% |
5.7% |
5.8% |
0.8% |
6.6% |
(0.1%) |
(0.8%) |
(0.9%) |
|
Upper Mid-End |
118,861 |
652 |
6.0% |
1.2% |
7.2% |
5.7% |
0.1% |
5.8% |
0.3% |
1.1% |
1.4% |
|
Lower Mid-End Satellite Towns |
73,997 |
421 |
6.3% |
(0.1%) |
6.2% |
5.6% |
0.9% |
6.5% |
0.7% |
(1.0%) |
(0.3%) |
|
Apartment Grand Average |
94,796 |
515 |
6.0% |
0.4% |
6.4% |
5.7% |
0.6% |
6.3% |
0.3% |
(0.2%) |
0.1% |
|
Residential Market Average |
118,339 |
567 |
5.4% |
0.4% |
5.8% |
5.5% |
0.6% |
6.1% |
(0.1%) |
(0.2%) |
(0.3%) |
Source: Cytonn Research
- Detached Units Performance
The table below shows the NMA residential sector detached units’ performance during FY’2024;
|
All values are in Kshs unless stated otherwise |
||||||||
|
Cytonn Report: Detached Units Summary FY'2024 |
||||||||
|
Area |
Average of Price per SQM FY'2024 |
Average of Rent per SQM FY'2024 |
Average of Occupancy FY'2024 |
Average of Uptake FY'2024 |
Average of Annual Uptake FY'2024 |
Average of Rental Yield FY'2024 |
Average of Price Appreciation FY'2024 |
Total Returns |
|
High End |
||||||||
|
Lower Kabete |
153,816 |
596 |
92.9% |
91.4% |
10.4% |
4.9% |
1.1% |
6.0% |
|
Rosslyn |
195,018 |
903 |
92.9% |
98.2% |
11.2% |
5.2% |
0.0% |
5.2% |
|
Runda |
229,440 |
1,004 |
95.9% |
97.3% |
8.9% |
5.2% |
(0.4%) |
4.8% |
|
Karen |
199,246 |
952 |
91.6% |
93.7% |
10.6% |
4.5% |
0.0% |
4.5% |
|
Kitisuru |
216,980 |
861 |
90.7% |
90.7% |
9.7% |
4.2% |
0.0% |
4.2% |
|
Average |
198,900 |
863 |
92.8% |
94.2% |
10.2% |
4.8% |
0.1% |
4.9% |
|
Upper Middle |
||||||||
|
South B/C |
116,538 |
540 |
89.6% |
86.3% |
10.6% |
6.4% |
(0.1%) |
6.3% |
|
Loresho |
152,924 |
789 |
90.6% |
90.6% |
10.6% |
5.6% |
0.1% |
5.7% |
|
Redhill & Sigona |
98,375 |
480 |
92.0% |
97.7% |
10.9% |
5.3% |
0.4% |
5.7% |
|
Runda Mumwe |
164,013 |
702 |
91.1% |
96.2% |
14.8% |
4.7% |
0.7% |
5.4% |
|
Ridgeways |
176,697 |
758 |
87.5% |
88.3% |
9.7% |
5.0% |
0.0% |
5.0% |
|
Lavington |
190,383 |
703 |
91.2% |
93.1% |
9.8% |
3.8% |
0.8% |
4.6% |
|
Langata |
122,413 |
451 |
91.1% |
87.1% |
7.6% |
4.2% |
0.0% |
4.2% |
|
Average |
145,906 |
632 |
90.4% |
91.3% |
10.6% |
5.0% |
0.3% |
5.3% |
|
Lower Middle |
||||||||
|
Kitengela |
64,965 |
301 |
91.1% |
90.4% |
10.7% |
5.0% |
1.7% |
6.7% |
|
Ngong |
69,790 |
361 |
94.4% |
93.5% |
7.3% |
5.2% |
1.2% |
6.4% |
|
Juja |
96,761 |
382 |
89.0% |
92.3% |
8.1% |
4.3% |
1.9% |
6.2% |
|
Thika |
63,036 |
326 |
83.2% |
87.8% |
11.6% |
5.5% |
0.4% |
5.9% |
|
Rongai |
89,989 |
271 |
96.9% |
94.4% |
11.4% |
5.2% |
0.5% |
5.6% |
|
Syokimau/Mlolongo |
77,377 |
405 |
91.6% |
91.9% |
11.2% |
4.9% |
0.0% |
5.0% |
|
Athi River |
88,423 |
444 |
88.6% |
93.8% |
9.8% |
4.9% |
(0.6%) |
4.3% |
|
Donholm & Komarock |
96,369 |
402 |
87.5% |
88.1% |
9.9% |
4.0% |
0.0% |
4.0% |
|
Average |
80,839 |
362 |
90.3% |
91.5% |
10.0% |
4.9% |
0.6% |
5.5% |
|
Detached Grand Average |
141,882 |
619 |
91.2% |
92.4% |
10.2% |
4.9% |
0.4% |
5.2% |
source: Cytonn Research
The key take-outs from the table include;
- Average Total Returns – The average total returns to detached units’ investors came in at 5.2%, 0.6% lower than the 5.8% recorded in FY’2023. The performance was driven by a 0.4%-points decrease in the average rental yield to 4.9% in FY’2024, from 5.3% recorded in FY’2023. The decrease in performance was attributable to a 7.7% decrease in the average rents per SQM to Kshs 619 in FY’2024, from Kshs 671 recorded in FY’2023,
- Segment Performance – The best-performing segment was the Lower-middle segment offering an average total return of 5.5%, attributable to a relatively high average price appreciation of 0.6%, 0.2%-points higher than the detached market average appreciation of 0.4%. The impressive performance of the segment was driven by returns from well-performing nodes such as Kitengela, Ngong and Juja, which have continued to offer relatively high returns to investors, and,
- Nodal Performance – Overall, Kitengela was the best-performing node, offering the highest returns at 6.7%, 1.5% points higher than the detached market average of 5.2%, driven by a relatively high y/y price appreciation of 1.7%. The node has seen increased detached unit property investments owing to an inflow of residents brought about by the enhanced accessibility to the Nairobi CBD through various roads such as Mombasa road and the Nairobi Express way. Also, the area enjoys proximity to various amenities such as the SGR and JKIA. Ngong followed with an average total return of 6.4%, 1.2% points higher than the detached market average of 5.2%.
- Apartments Performance
The table below shows the NMA residential sector apartments’ performance during FY’2024;
|
All values are in Kshs unless stated otherwise |
|
|||||||
|
Cytonn Report: Residential Apartments Summary FY'2024 |
||||||||
|
Area |
Average of Price per SQM FY'2024 |
Average of Rent per SQM FY'2024 |
Average of Occupancy FY'2024 |
Average of Uptake FY'2024 |
Average of Annual Uptake FY'2024 |
Average of Rental Yield FY'2024 |
Average of Price Appreciation FY'2024 |
Total Returns |
|
Upper Mid-End |
||||||||
|
Westlands |
135,806 |
736 |
90.1% |
92.0% |
14.5% |
6.3% |
4.4% |
10.6% |
|
Parklands |
121,694 |
684 |
92.7% |
91.9% |
12.4% |
6.2% |
1.5% |
7.7% |
|
Kileleshwa |
126,272 |
730 |
96.1% |
92.9% |
10.8% |
6.6% |
0.0% |
6.6% |
|
Kilimani |
100,577 |
622 |
92.8% |
91.2% |
12.8% |
6.3% |
0.3% |
6.6% |
|
Upperhill |
104,309 |
651 |
88.3% |
88.0% |
10.1% |
5.8% |
0.5% |
6.2% |
|
Loresho |
124,507 |
490 |
95.8% |
82.3% |
7.2% |
4.5% |
0.3% |
4.8% |
|
Average |
118,861 |
652 |
92.6% |
89.7% |
11.3% |
5.9% |
1.2% |
7.1% |
|
Lower Mid-End Suburbs |
||||||||
|
Kahawa West |
73,316 |
284 |
92.1% |
94.0% |
7.2% |
3.6% |
8.3% |
12.0% |
|
Dagoretti |
91,476 |
695 |
88.8% |
85.2% |
11.5% |
9.6% |
1.9% |
11.5% |
|
Waiyaki Way |
70,840 |
362 |
91.9% |
87.3% |
12.3% |
5.7% |
0.9% |
6.6% |
|
Race Course/Lenana |
79,883 |
519 |
85.5% |
86.3% |
10.8% |
5.7% |
0.8% |
6.5% |
|
South B |
108,971 |
485 |
93.0% |
98.0% |
12.1% |
4.8% |
0.0% |
4.8% |
|
South C |
118,297 |
458 |
84.9% |
96.2% |
14.0% |
4.0% |
0.0% |
4.0% |
|
Langata |
100,870 |
447 |
93.3% |
92.5% |
10.0% |
4.4% |
(0.6%) |
3.8% |
|
Imara Daima |
70,376 |
344 |
95.9% |
89.8% |
8.3% |
5.8% |
(2.7%) |
3.1% |
|
Average |
89,254 |
449 |
90.7% |
91.2% |
10.8% |
5.5% |
1.1% |
6.5% |
|
Lower Mid-End Satellite Towns |
||||||||
|
Ngong |
59,068 |
341 |
93.7% |
95.1% |
11.0% |
6.2% |
3.1% |
9.3% |
|
Ruaka |
104,208 |
534 |
90.9% |
89.7% |
12.5% |
5.1% |
3.2% |
8.3% |
|
Syokimau |
74,656 |
367 |
87.8% |
89.3% |
10.9% |
5.4% |
2.5% |
7.9% |
|
Ruiru |
88,872 |
502 |
87.1% |
86.4% |
12.6% |
5.9% |
0.0% |
5.9% |
|
Rongai |
54,135 |
308 |
89.7% |
87.4% |
11.9% |
5.5% |
(0.4%) |
5.1% |
|
Kikuyu |
81,374 |
447 |
95.8% |
96.0% |
15.0% |
6.5% |
(1.9%) |
4.5% |
|
Athi River |
55,664 |
449 |
97.1% |
98.9% |
11.7% |
9.4% |
(7.1%) |
2.3% |
|
Average |
76,485 |
435 |
91.4% |
91.3% |
12.4% |
6.3% |
(0.6%) |
5.7% |
|
Apartment Grand Average |
94,866 |
512 |
91.6% |
90.7% |
11.5% |
5.9% |
0.5% |
6.4% |
Source: Cytonn Research
The key take-outs from the table include;
- Average Total Returns – The average total returns to apartments’ investors came in at 6.4%, recording a 0.2%-points increase from the 6.2% recorded during FY’2023. The slightly improved performance was driven by a 0.2%-points increase in the average rental yield to 5.9% in FY’2024, from 5.7% recorded in FY’2023. This was driven by a slightly increased apartment property transactions during the period, attributable to 4.0% points increase in the average occupancy to 91.6% in FY’2024 from 87.6% in FY’2023,
- Segment Performance – The best-performing segment was the upper mid-end suburbs towns with average total returns of 7.1%, attributed to a relatively high average y/y price appreciation of 1.2% and rental yield of 6.0%. The impressive performance of the segment was driven by returns from well-performing nodes such as Westlands, parklands, Kileleshwa and Kilimani that have continued to offer competitive returns to investors in comparison to other segments, and
- Nodal Performance – Overall, the best-performing node was Kahawa West, offering investors average total returns of 12.0%, 5.6%-points higher than the apartment market average total return of 6.4%. Kahawa West is attracting apartment investments owing to infrastructural development with the roads such as Thika Road,proximity to CBD favouring residents in the area, a high number of middle-class families in the area, proximity to retail centers such as Garden City, Juja Mall, and Thika Road Mall, and proximity to higher learning institutions such as Kenyatta University
For notable highlights during FY’2024, please see our, Cytonn Q1’2024 Markets-Review, Cytonn H1’2024 Markets Review, and, Cytonn Q3’ 2024 Markets Review reports. During Q4’2024;
- The Kenyan government has introduced a Kshs 10.0 bn low-cost mortgage scheme aimed at facilitating rural home construction. This initiative, funded by the Housing Levy, offers single-digit interest loans repayable over ten years, with individual applicants eligible for up to Kshs 5.0 mn and multiple-family dwellings up to Kshs 10.0 mn. For more information, please see our Cytonn weekly #51/2024 ,
- Shelter Afrique Development Bank (ShafDB) and the African Union (AU) have signed a Memorandum of Understanding (MOU) to address Africa's significant housing deficit, estimated at 53.0 mn units with a financing gap of USD 1.4 tn. For more information, please see our Cytonn weekly #51/2024,
- Purple Dot International Limited, a residential and commercial property developer broke ground on a high-end residential development in Lang’ata, dubbed Marigold II. The development is situated on a 7-acre plot. Marigold II will consist of 89 townhouses, offering both duplex and triplex units designed to blend modern aesthetics with a sense of community and security. Each of the units will have 4-bedrooms and triplex homes will cost Kshs 42.8 mn while duplex units will cost Kshs 34.8 mn. The development is expected to be completed in June 2025. For more information, please see our Cytonn weekly #45/2024,
- Centum Real Estate announced a strategic partnership with Gulf African Bank to offer Shariah-compliant mortgage financing to its customers. This collaboration aims to expand home financing options and drive the uptake of Centum's property portfolio. Under the agreement, customers will access up to 90.0% mortgage financing with a repayment period of up to 20 years and an expedited 48-hour approval process. For more information, please see our Cytonn weekly #46/2024,
- The Controller of Budget disclosed that only 30.8% of the Kshs 54.1 bn collected through the housing levy in its first year of enforcement was utilized for affordable housing projects. This amounts to Kshs 16.7 bn, leaving a significant portion of funds idle amidst delays in project implementation. For more information, please see our Cytonn weekly #46/2024, and,
- Shelter Afrique Development Bank (ShafDB) and the regional stock exchange serving the West African Economic and Monetary Union (WAEMU) region, Bourse Régionale des Valeurs Mobilières (BRVM), announced the signing of a partnership aimed at addressing Africa’s housing deficit, by establishing a framework to mobilize financial resources through innovative instruments such as green, sustainability-linked, and social bonds, as well as Real Estate Investment Trusts (REITs). For more information, please see our Cytonn monthly Report-October 2024
We have a NEUTRAL outlook for the NMA residential sector, we expect continued vibrant performance in the residential sector within the country sustained by; i)ongoing residential developments under the Affordable Housing Agenda, aiming to reduce the housing deficit in the country currently estimated at 80.0%, ii) increased investment from local and international investors in the housing sector, iii) favorable demographics in the country, shown by high population and urbanization rates of 3.7% p.a and 2.0% p.a, respectively, leading to higher demand for housing units. However, challenges such as rising construction costs, strain on infrastructure development, and limited access to financing will continue to restrict the optimal performance of the residential sector.
- Commercial Office Sector
The table below highlights the performance of the Nairobi Metropolitan Area (NMA) Commercial Office sector over time;
|
Cytonn Report: Nairobi Metropolitan Area (NMA) Commercial Office Returns Over Time |
||||||||||
|
Year |
Q1'2023 |
H1'2023 |
Q3'2023 |
FY'2023 |
Q1'2024 |
H1'2024 |
Q3'2024 |
FY'2024 |
∆ FY'2023/FY'2024 |
|
|
Occupancy % |
79.8% |
80.8% |
79.9% |
80.3% |
80.1% |
80.1% |
79.6% |
80.7% |
0.4% |
|
|
Asking Rents (Kshs/SQFT) |
97 |
98 |
100 |
103 |
103 |
103 |
104 |
105 |
1.7% |
|
|
Average Prices (Kshs/SQFT) |
12,238 |
12,238 |
12,265 |
12,673 |
12,665 |
12,677 |
12,677 |
12,614 |
(0.5%) |
|
|
Average Rental Yields (%) |
7.6% |
7.9% |
7.7% |
7.7% |
7.6% |
7.7% |
7.7% |
7.8% |
0.1% |
|
Source: Cytonn Research
The key take-outs from the table include
- Average Asking Rents – In FY’2024, average asking rents per SQFT in the NMA increased by 1.7 % to Kshs 105 from Kshs 103 in FY’2024 while on, quarter-on-quarter basis (q/q) this performance represented a 0.9% Improvement. This performance can be attributable to addition of new Grade A offices to the pipeline; during this period between Q3’2023 and FY’2024, including Eneo, Karen Green, The Cube, and the Piano, thereby driving up the asking rents for commercial office spaces. Additionally, we expect more commercial office spaces in the market once the following projects are completed; Highway Heights, The Atrium, Purple Tower, and Mandrake in Westlands.
- Average Occupancy Rate – In FY’2024, commercial office occupancy a slight improvement in performance by 0.4% points to 80.7% from 80.3% recorded in FY’2023 while on q/q basis this performance represented a 1.1%-point increase.
- Average Rental Yield – The average rental yields showed resilience with 0.1%-points increase, coming at 7.8% in FY’2024 from 7.7% in FY’2023. This is attributable to an increase in asking rents by 1.7% to Ksh 105 from Ksh 103 during the period under review.
For submarket performance, Gigiri and Westlands emerged as the top performers, achieving an average rental yield of 8.8% and 8.5% respectively in FY’2024, surpassing the market average of 7.8%. Kilimani and Karen also performed strongly, with rental yields of 8.3% and 8.2%, respectively. This performance can be attributed to several factors: i) good connectivity to these areas supported by roads such as Nairobi expressway, Limuru road and the expanded Waiyaki Way ii) a high concentration of Grade A offices in these areas, iii) increasing demand for high-quality offices driven by embassies, international organizations, and multinational companies, and iv) availability of after-work amenities like hotels and quality social venues. In contrast, Mombasa Road was the least performing node with an average rental yield of 6.5% in FY’2024, 1.3% points lower than the market average of 7.8%. This lower performance can be attributed to: i) its reputation as an industrial center, which diminishes its appeal to office businesses aiming to attract clients, ii) the general perception that the area is less ideal for businesses, iii) intense competition from other neighborhoods such as the CBD and Upper hill, and iv) Relatively lower quality office amenities compared to other areas in competition such upper hill and Kilimani. The table below displays the performance of sub-markets in the Nairobi Metropolitan Area (NMA).
|
Cytonn Report: NMA Commercial Office Submarket Performance FY'2024 |
||||||||||||
|
Area |
Price/SQFT FY'2024 |
Rent/SQFT FY'2024 |
Occupancy FY'2024 |
Rental Yields FY'2024 |
Price/SQFT FY'2023 |
Rent/SQFT FY'2023 |
Occupancy FY'2023 |
Rental Yields FY'2023 |
∆ in Rent |
∆ in Occupancy (% points) |
∆ in Rental Yields (% points) |
|
|
Gigiri |
14,850 |
131 |
82.6% |
8.8% |
15,000 |
128 |
79.8% |
8.5% |
2.3% |
2.8% |
0.2% |
|
|
Westlands |
12,448 |
119 |
80.4% |
8.5% |
12,504 |
120 |
75.1% |
8.4% |
(0.7%) |
5.3% |
0.1% |
|
|
Kilimani |
12,873 |
101 |
82.9% |
8.3% |
13,051 |
102 |
83.6% |
7.9% |
(1.2%) |
(0.7%) |
0.4% |
|
|
Karen |
14,077 |
115 |
80.9% |
8.2% |
14,246 |
115 |
80.1% |
8.3% |
0.0% |
0.8% |
(0.1%) |
|
|
Nairobi CBD |
12,206 |
92 |
86.6% |
7.9% |
12,000 |
90 |
85.0% |
7.6% |
2.4% |
1.6% |
0.3% |
|
|
Parklands |
11,922 |
94 |
83.0% |
7.8% |
11,875 |
92 |
85.8% |
8.0% |
2.2% |
(2.8%) |
(0.2%) |
|
|
Upperhill |
12,857 |
104 |
76.1% |
7.6% |
12,741 |
100 |
75.2% |
7.1% |
3.6% |
0.9% |
0.5% |
|
|
Thika Road |
12,643 |
90 |
79.3% |
6.7% |
|
79 |
79.4% |
6.0% |
14.1% |
(0.1%) |
0.6% |
|
|
Mombasa Road |
11,325 |
80 |
72.2% |
6.5% |
11,325 |
72 |
74.5% |
5.2% |
10.7% |
(2.3%) |
1.3% |
|
|
Average |
12,614 |
105 |
80.7% |
7.8% |
12,265 |
100 |
79.9% |
7.7% |
3.7% |
0.8% |
0.1% |
|
Source: Cytonn Research
Notable highlights in 2024 include;
- The Kenya Ports Authority (KPA) announced plans to construct a multistoried office tower away from Mombasa Port in a bid to ease congestion, improve security, and rent out offices and conference rooms to earn additional revenue. The complex will comprise approximately 40,000 SQM of office space for KPA staff, four times the space they are using now. For more details, please see our Cytonn weekly #39/2024.
We maintain a NEUTRAL outlook on the Nairobi Metropolitan Area (NMA) commercial office sector, impacted by several key dynamics: i) the increasing presence of multinational companies in Kenya is likely to drive up occupancy levels, ii) co-working spaces are gaining in popularity in the region iii) the gradual return to “working from office” after the Covid-19 pandemic, iv) more start-ups are expected to drive demand for commercial spaces, and v) a considerable take-up of prevailing commercial office spaces after developers adopted a 'wait-and-see' approach to avoid vacancies in newly built spaces, However, the sector continues to face challenges due to a significant oversupply of office space, currently standing at 5.8 mn SQFT. Despite these challenges, there are attractive investment opportunities in areas such as Westlands, Gigiri, and Kilimani, which offer returns that exceed the market average.
- Retail Sector
The table below shows the performance of the retail sector performance in Nairobi Metropolitan Area from 2023 to 2024;
|
Cytonn Report: Summary of Retail Sector Performance in Nairobi Metropolitan Area 2023 to 2024 |
|||||||||
|
Item
|
Q1’2023 |
H1’2023 |
Q3'2023 |
FY'2023 |
Q1'2024 |
H1'2024 |
Q3'2024 |
FY'2024 |
Y/Y 2024 ∆ |
|
Average Asking Rents Kshs/SQFT) |
176 |
177 |
182 |
182 |
180 |
185 |
185 |
184 |
1.2% |
|
Average Occupancy (%) |
78.0% |
79.2% |
78.7% |
78.7% |
79.3% |
79.5% |
81.4% |
82.2% |
3.6% |
|
Average Rental Yields |
8.0% |
8.15% |
8.2% |
8.3% |
8.1% |
7.94% |
8.2% |
8.4% |
0.1% |
Source: Cytonn Research
The key take-outs from the table include;
- Average Occupancy Rate - The average occupancy rates increased by 3.6% points to 82.2% in FY’2024, from 78.7% recorded in FY’2023. This increase was primarily propelled by several factors including; i) aggressive growth strategies implemented by both domestic and international retailers such as Naivas, QuickMart and Carrefour,and, ii) continuous demand for consumer goods and services supported by positive demographics, encouraging further expansions from current retailers,
- Asking Rents - The average rental rates per SQFT surged by 1.2% to Kshs 184 in FY’2024 from the Kshs 182 recorded in FY’2023. This spike was fueled by the addition of top-tier retail spaces such as the Global Trade Centre (GTC) mall and Mwanzi market fetching higher rents. Premium retail spaces in strategic areas within the Nairobi Metropolitan Area (NMA), such as Karen, Kilimani, Westlands, and along Kiambu and Limuru roads, continue to command higher rents due to their superior offerings. These prime locations have attracted a growing number of foreign businesses seeking proximity to multinational organizations and embassies to cater to an international clientele. Global brands like Adidas, Puma, Michael Kors, and Aldo have entered the Kenyan market, competing for these coveted spaces. This combination of foreign interest has significantly contributed to the rise in rental rates in these regions, and,
- Average Rental Yield- The average rental yield for the NMA retail sector improved by 0.1% points to 8.4% in FY’2024, from 8.3% in FY’2023, as a result of improved asking rents and occupancy rates.
In terms of sub-market performance, Karen, Kilimani and Westlands have retained their status as the leading nodes, boasting impressive average rental yields of 10.0%, 9.8%, and 9.1% respectively, surpassing the overall market average of 8.4%. This performance was primarily propelled by the presence of top-tier retail spaces commanding higher rents, complemented by the provision of quality infrastructure services in these areas. Conversely, retail spaces in Thika road reported the lowest average rental yield at 6.3%, attributed to several factors: i) the rental rates stood at Kshs 160 per SQFT, notably lower than the market average of Kshs 184 per SQFT, due to oversupply of retail space from numerous malls along Thika Road thereby creating an excess in supply, reducing demand and rental rates, ii) there is oversaturation of retail businesses which increases competition among malls and retail spaces forcing landlords to lower rents to attract customers, iii) increased e-commerce reducing demand for physical retail spaces along iv) certain retail spaces suffer from insufficient foot traffic, particularly outside peak hours or in less popular malls.
Moreover, rents recorded in satellite towns are lower than market averages at Kshs 140, compared to the market average of Kshs 184. This deliberate adjustment is a strategic manoeuvre to attract a more extensive clientele base by providing more affordable options, especially considering the amplified demand for consumer goods, diverse services, and entertainment facilities in these burgeoning locales. The table below shows the submarket performance of nodes in the Nairobi Metropolitan Area (NMA) 2024;
|
(All values in Kshs unless stated otherwise) |
||||||||||
|
Nairobi Metropolitan Area Retail Market Performance FY’2024 |
||||||||||
|
Area |
Prices Kshs /SQFT FY’2024 |
Rent Kshs /SQFT FY’2024 |
Occupancy% FY’2024 |
Rental Yield FY’2024 |
Rent Kshs /SQFT FY’2023 |
Occupancy% FY’2023 |
Rental Yield FY’2023 |
∆ in Rental Rates |
∆ in Occupancy (% points) |
∆ in Rental Yield (% points) |
|
Karen |
23,600 |
218 |
90.9% |
10.0% |
218 |
86.0% |
10.0% |
0.0% |
4.9% |
(0.0%) |
|
Kilimani |
20,000 |
198 |
82.2% |
9.8% |
193 |
82.2% |
9.9% |
2.6% |
0.0% |
(0.1%) |
|
Westlands |
25,000 |
239 |
79.4% |
9.1% |
232 |
80.3% |
9.0% |
3.0% |
(0.9%) |
0.1% |
|
Ngong Road |
23,013 |
191 |
86.2% |
8.7% |
174 |
81.9% |
7.8% |
9.5% |
4.3% |
0.9% |
|
Kiambu road & Limuru Road |
20,000 |
187 |
76.3% |
8.7% |
205 |
74.3% |
8.7% |
(8.9%) |
2.0% |
(0.0%) |
|
Mombasa road |
19,571 |
165 |
85.0% |
8.6% |
169 |
78.6% |
8.0% |
(2.5%) |
6.4% |
0.5% |
|
Eastlands |
20,500 |
161 |
78.1% |
7.3% |
146 |
75.8% |
6.2% |
10.3% |
2.2% |
1.1% |
|
Satellite towns |
19,600 |
140 |
82.8% |
7.2% |
139 |
80.4% |
6.9% |
0.7% |
2.4% |
0.3% |
|
Thika Road |
20,473 |
160 |
79.3% |
6.3% |
162 |
80.8% |
7.5% |
(1.0%) |
(1.5%) |
(1.2%) |
|
Average |
21,306 |
184 |
82.2% |
8.4% |
182 |
80.0% |
8.2% |
1.5% |
2.2% |
0.2% |
Source: Cytonn Research
For notable highlights during the year please see our Cytonn Q1’2024 Markets-Review, Cytonn H1’2024 Markets Review, and, Cytonn Q3’ 2024 Markets Review reports.
We maintain a NEUTRAL outlook on the retail sector’s performance for 2024, influenced by several factors; i) continued expansion by local and international retailers, driven by evolving consumer preferences and market trends, ii) infrastructure improvements, including ongoing road and railway projects, are set to increase accessibility to key retail zones, unlocking further investment opportunities, and iii) favorable demographic trends, such as a growing urban population, will sustain demand for retail goods and services. However, growth could face challenges from: i) oversupply issues, with around 3.0 n SQFT of retail space available in Nairobi and an additional 1.7 mn SQFT countrywide, leading to low occupancy rates and rental yields, ii) e-commerce adoption, increasingly shifting retail demand online, pushing brick-and-mortar outlets to adapt, and iii) limited financing options for retail developments, along with high costs, are likely to hinder investment, especially for small and medium-sized enterprises (SMEs) that need to adopt technology to stay competitive
- Hospitality Sector
In 2024, Kenya's hospitality sector continued to display resilience post COVID-19 pandemic. Its performance was largely supported by Nairobi's emergence as a regional business hub, attracting multinational companies to set up offices and hosting major international conferences. Additionally, Kenya’s status as a leading tourist destination has further driven recovery and growth, with increased business travel and tourism playing a significant role in strengthening the sector's contribution to the economy.
In terms of international arrivals, Kenya National Bureau of Statistics’ Leading Economic Indicators – September 2024 report highlighted that arrivals through Jomo Kenyatta International Airport (JKIA) and Moi International Airport (MIA) registered an increase of 8.5% to 489,831 visitors in Q3’ 2024 from 451,441 visitors recorded in Q3’ 2023. The graph below shows the number of international arrivals in Kenya between Q1’2021 and Q3’ 2024;
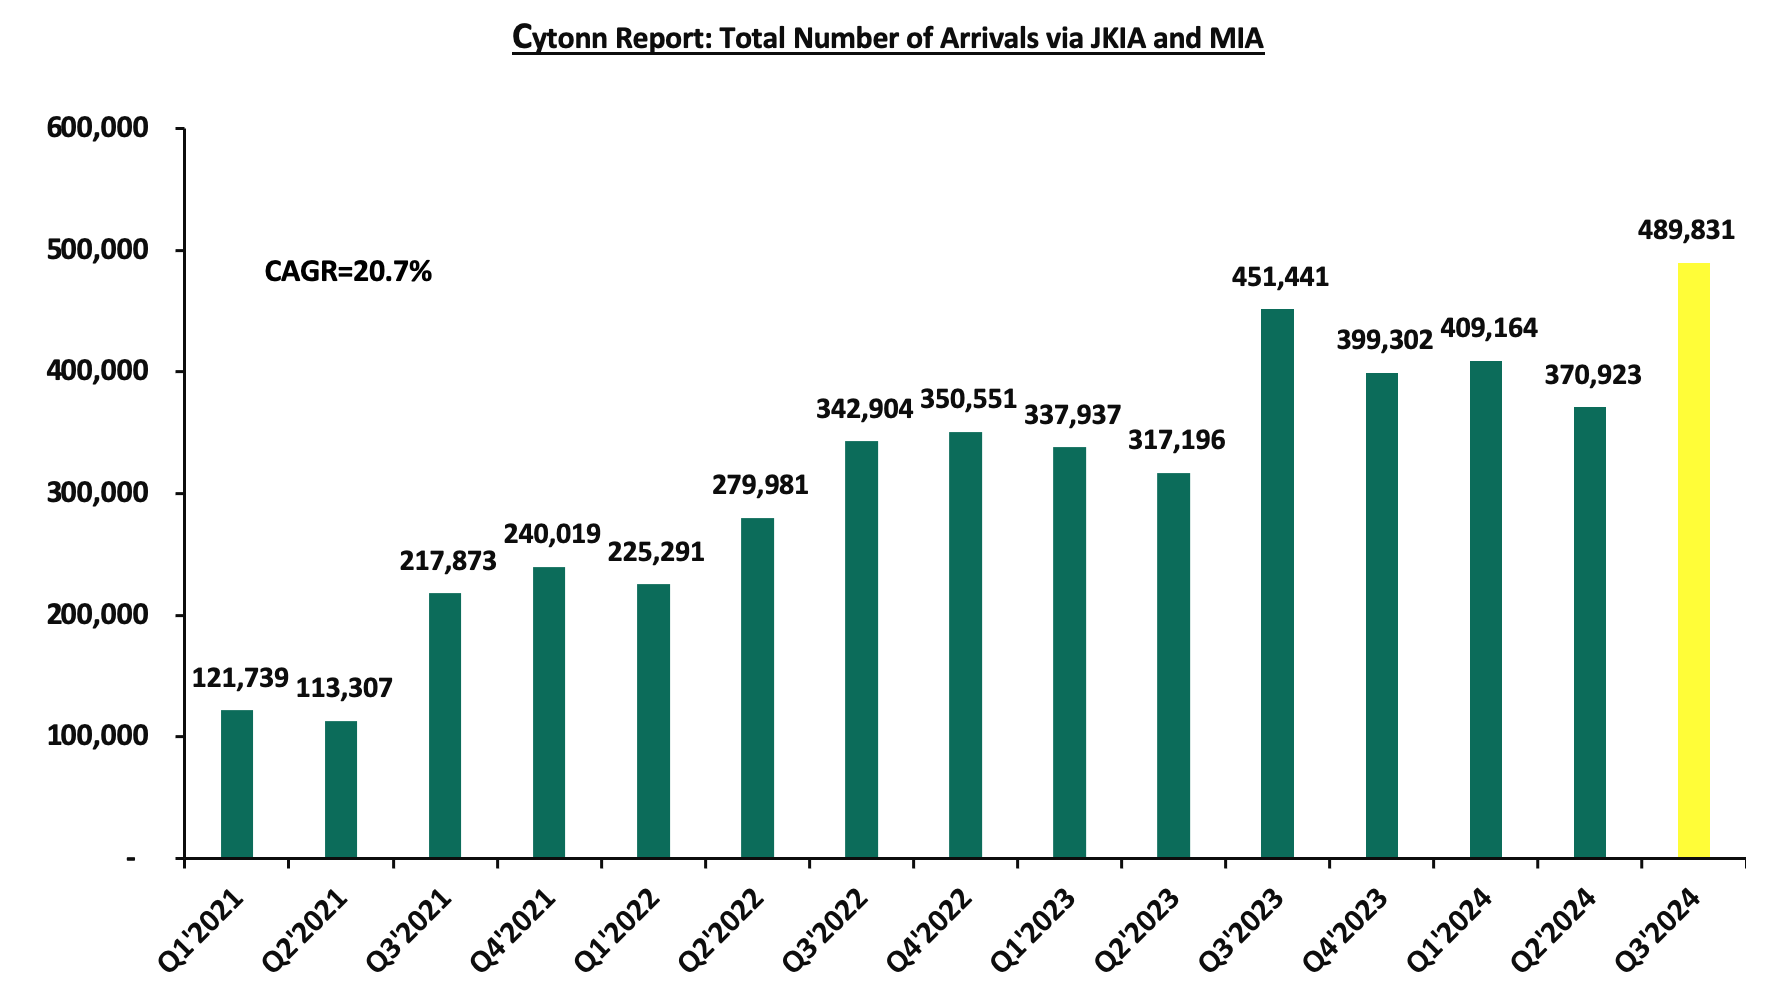
Source: Kenya National Bureau of Statistics (KNBS)
The improved performance was a result of i) the country effecting a Visa free policy at the start of the year for all visitors in a bid to boost numbers, ii) Kenya Tourism Board (KTB) launching the ‘Ziara campaign’ seeking Kenyans in the Diaspora to help market their motherland through their networks in the host countries in exchange for incentives, iii) increased international marketing of Kenya’s tourism market by the Ministry of Tourism in collaboration with the Kenya Tourism Board, through platforms such as the Magical Kenya Loyalty Rewards Program, iv) route marketing collaboration with low-cost carriers such as Air Asia X targeting visitors where the flights operates such as Southeast Asia, Northern Asia and Australia, v) continuous efforts to promote local and regional tourism, vi) development of niche products such as cruise tourism, adventure tourism, culture and sports tourism and, vii) an increase in corporate and business Meetings, Events, and Conferences from both the public and private sectors. For the months of August and September 2024, the number of international visitors arriving through Jomo Kenyatta International Airport (JKIA) and Moi International Airports (MIA) came in at a cumulative 320,109 persons, representing a 9.1% increase, compared to the 293,341 visitors recorded during a similar period in 2023.
Additionally, during the year, we released the Nairobi Metropolitan Area Serviced Apartments Report 2024 which highlighted that the overall performance of serviced apartments improved on y/y, with the occupancy rates coming in at 72.2% in 2024, a 5.8%-points increase from the 66.4% recorded in 2023. The average monthly charges for 2024 increased by 4% to Kshs 3155 per SQM from 3,044 recorded in 2023. Consequently, the average rental yield increased to 7.3% in 2024, a 0.5%- points increase from the 6.8% recorded in 2023. The improvement in performance was primarily on the back of; i) Increase in the number of visitors arriving in the country compared to a similar period in 2023, ii) The country effecting a Visa free policy at the start of the year for all visitors in a bid to boost number of arrivals in the country, iii) continued recovery of the Kenyan hospitality sector, iv) the intensive marketing of Kenya’s tourism market through platforms such as the Magical Kenya platform and various, v) Kenya continued efforts to host various events such as the World Rally Championship (WRC) held in March-2024, vi) Guests preference to stay within the city for extended periods.
Key highlight during Q1’ 2024:
- JW Marriott an International luxury hotel brand opened JW Marriott Nairobi, marking its second property in Kenya after JW Marriott Masai Mara Lodge opened in February 2023. The hotel which is located in GTC building Westlands, stands as the tallest hotel in the country with 35 stories. For more details, please see our Cytonn Q1’2024 Markets-Review report.
For more notable highlights during the year please see our Cytonn H1’2024 Markets Review, and, Cytonn Q3’ 2024 Markets Review reports.
We maintain a positive outlook for the hospitality sector, supported by several key drivers: i) aggressive marketing campaigns promoting Kenya’s tourism, expected to boost tourist arrivals and improve occupancy rates at hospitality venues, ii) international recognition of Kenya’s tourism industry, enhancing its status as a leading tourist destination and drawing more global visitors, iii) strategic partnerships within the tourism sector, fostering innovation and collaboration to capitalize on new opportunities, iv) events and initiatives aimed at increasing tourism activity and improving guest experiences. However, while the sector demonstrated resilience in its overall performance in 2024, the outlook remains cautiously optimistic. Kenya continues to face significant competition from neighboring markets, such as Rwanda, which employs aggressive promotional strategies, alongside Zanzibar, Tanzania, and South Africa. These regions actively position themselves as attractive alternatives, challenging Kenya's market share in the region.
- Mixed-Use Developments (MUDs)
In November 2024, we released the Nairobi Metropolitan Area (NMA) Mixed Used Developments (MUDs) Report 2024, which highlighted that MUDs recorded an average rental yield of 8.6% in 2024,1.5% points higher than the respective single-use themes which recorded an average rental yield of 7.1% in a similar period in 2023. The relatively better performance was mainly attributable to changing client preferences and MUDs' attractiveness driven by the diversity in amenities and social offerings they provide to clients. The table below shows the performance of Mixed-Use development themes by node in 2024;
|
Cytonn Report: Nairobi Metropolitan Area Mixed Use Developments Performance by Nodes 2024 |
|||||||||||
|
Location |
Commercial Retail |
Commercial Office |
Residential |
Average MUD Yield |
|||||||
|
Rent (Kshs/SQFT) |
Occupancy |
Rental Yield |
Rent (Kshs/SQFT) |
Occupancy |
Rental Yield |
Price (Kshs/SQM) |
Rent (Kshs/SQM) |
Annual Uptake |
Rental Yield |
||
|
Karen |
270 |
93.5% |
11.7% |
127 |
85.0% |
9.5% |
|
|
|
|
10.6% |
|
Limuru Road |
325 |
75.0% |
12.4% |
112 |
78.0% |
7.8% |
200,000 |
1,724 |
31.7% |
9.9% |
10.0% |
|
Westlands |
204 |
71.8% |
9.6% |
125 |
78.0% |
9.3% |
303,071 |
3,731 |
12.5% |
9.2% |
9.4% |
|
Kilimani |
180 |
85.6% |
9.7% |
118 |
83.0% |
8.8% |
|
|
|
|
9.3% |
|
Upperhill |
170 |
75.0% |
9.4% |
105 |
85.0% |
8.5% |
|
|
|
|
9.0% |
|
Eastlands |
225 |
85.0% |
9.9% |
85 |
73.0% |
6.2% |
|
|
|
|
8.1% |
|
Thika Road |
197 |
76.7% |
9.1% |
115 |
77.0% |
8.3% |
123,770 |
886 |
14.0% |
6.4% |
7.9% |
|
Mombasa Road |
205 |
75.0% |
8.8% |
140 |
73.0% |
7.4% |
196,203 |
760 |
11.7% |
4.3% |
6.8% |
|
Average |
222 |
79.70% |
10.1% |
116 |
79.0% |
8.2% |
205,761 |
1,775 |
16.80% |
7.50% |
8.6% |
|
*Selling prices used in the computation of rental yields for commercial office and retail themes entailed a combination of both real figures and market estimates of comparable properties in the locations of the Mixed-Use Developments (MUDs) sampled |
|||||||||||
Source: Cytonn Research
Overall performance: In terms of performance per node, Karen, Limuru Road, and Westlands were the best performing of all sampled nodes with an average yield of 10.6%, 10.0%, and 9.4% respectively,2.0%, 1.4%, and 0.8% higher than the market average of 8.6% in 2024. The strong performance was mainly attributed to: i) A large base of residents with substantial consumer spending power, ii) robust infrastructure supporting investment opportunities, and iii) the availability of prime retail and office spaces commanding higher rents and yields. On the other hand, Mombasa Road recorded the lowest performance with an average rental yield of 6.8%, 1.8% lower than the market average of 8.6%. This performance can be attributed to; i) heavy traffic on Mombasa Road potentially deterring businesses and residents, reducing demand and rental yields, ii) low rental rates attracted by developments, and iii) the area's perception as an industrial hub reducing appeal for high-rent tenants.
For notable highlights during the year please see our Cytonn Q1’2024 Markets-Review, Cytonn H1’2024 Markets Review, and, Cytonn Q3’ 2024 Markets Review reports.
Our overall outlook for Mixed Use Developments is NEUTRAL supported by the remarkable returns compared to single-use themes, changing client preferences, and MUDs attractiveness driven by the diversity in amenities and social offerings they provide to clients. However, the existing oversupply of the NMA office market at 5.8 mn SQFT, and 3.0 mn SQFT in the NMA retail market, is expected to weigh down the performance. Karen, Limuru Road, and Westlands nodes provide the best investment opportunities, with the areas providing the highest average MUD yields of 10.6%, 10.0%, and 9.4% respectively, compared to the market average of 8.6%.
- Land Sector
During the period under review, the land sector in Nairobi Metropolitan Area (NMA) recorded a price appreciation of 2.7% to Kshs 130.9 mn from 128.9 mn. This performance was supported by;
- The growing demand for land in the Nairobi Metropolitan Area (NMA) is driven by a rising population, as individuals from various regions of the country migrate annually in search of employment, education, and other opportunities,
- The fixed supply of land has intensified demand, particularly for residential and commercial purposes, leading to an increase in land prices,
- There is an expanding middle class in the NMA with disposable income, willing to invest in land as a savings and investment option,
- The government's ongoing infrastructural development projects, such as roads, sewers, railways, and water connections, are opening up more satellite towns, subsequently driving land prices upward,
- The widely held belief among the middle class that land represents a secure form of wealth has prompted many families to save specifically for land acquisition, and,
- The government’s Affordable Housing Program, under the Bottom-Up Economic Transformation Agenda (BETA), has initiated construction projects across various parts of Nairobi and the country, further increasing land values due to heightened construction activity.
Overall Performance:
Un-serviced land in Satellite Towns registered the highest capital appreciation during the period under review, with an annual capital appreciation of 4.5%, where the average selling price rose to Kshs 16.1 mn from Kshs 15.4 mn recorded in FY’2023. The performance in this segment can be attributed to several factors: i) relatively lower prices, with the average selling prices at Kshs 16.1 mn compared to the market average of Kshs 130.9 mn in the Nairobi Metropolitan Area (NMA), ii) a growing middle class willing to invest in Satellite Towns as they settle their families, iii) the anticipation of price increases once various services are introduced in these areas, and iv) the desire to settle in areas free from the city's hustle .On the other hand, land in Nairobi Suburbs under the Commercial Areas recorded the least movement with an annual capital appreciation of 1.0%, below the market average of 2.7%. This was mainly due to the high selling prices, which averaged Kshs 396.4 mn, relatively higher than the market average of Kshs 131.1 mn. The table below shows the overall performance of the sector across all land sub-sectors during FY’2024;
|
Cytonn Report: Summary of the Performance Across All regions FY’2024 |
|||
|
|
FY'2023 |
FY'2024 |
Annualized Capital Appreciation |
|
Un-serviced land-satellite Towns |
15.4 mn |
16.1 mn |
4.5% |
|
Nairobi Suburbs- High Rise Residential Areas |
82.3 mn |
85.3 mn |
3.5% |
|
Serviced land-Satellite Towns |
18.7 mn |
19.3 mn |
3.2% |
|
Nairobi Suburbs (Low Rise & High Residential Areas) |
135.7 mn |
137.3 mn |
1.2% |
|
Nairobi Suburbs- Commercial Areas |
392.6 mn |
396.4 mn |
1.0% |
|
Average |
128.9 mn |
130.9 mn |
2.7% |
Source: Cytonn Research
Sub-markets Performance – For the unserviced satellite towns, Juja, Limuru, and Utawala emerged as the best-performing nodes with annualized capital appreciation of 6.3%, 5.7% and 4.8%, respectively. This performance can be attributed to: i) good transport network connecting these areas to Nairobi ii) a rising middle class looking to settle in these areas, iv) good proximity to retail centers such as malls, and v) relatively affordable prices compared to the market average. Additionally, land in unserviced towns presents a good opportunity for speculative investors, who invest in anticipation of price appreciation. On the other hand, Commercial Areas in Nairobi’s Suburbs registered the least average price movement, with Kilimani recording a appreciation of 0.4%. The segment had the highest price per acre, with the average selling price coming in at Kshs 396.4 mn, significantly higher than the market average of Kshs 130.9 mn. Notably, some areas in this segment, such as Kilimani, are witnessing an influx of high-rise apartments, which has made them less attractive. The table below shows NMA’s land performance by submarkets in FY’2024;
|
Price in Kshs per Acre |
|||
|
Cytonn Report: Nairobi Metropolitan Area Land Performance by Submarkets – FY’2024 |
|||
|
Location |
Price FY'2023 |
Price FY'2024 |
Capital Appreciation |
|
Satellite Towns - Unserviced Land |
|||
|
Juja |
15.0 mn |
15.9 mn |
6.3% |
|
Limuru |
23.5 mn |
24.8 mn |
5.7% |
|
Utawala |
16.7 mn |
17.5 mn |
4.8% |
|
Rongai |
16.4 mn |
17.1 mn |
4.2% |
|
Athi River |
5.2 mn |
5.3 mn |
1.3% |
|
Average |
15.4 mn |
16.1 mn |
4.5% |
|
Satellite Towns - Serviced Land |
|||
|
Rongai |
17.1 mn |
18.3 mn |
7.1% |
|
Athi River |
15.5 mn |
16.0 mn |
3.3% |
|
Ruai |
12.4 mn |
12.8 mn |
3.2% |
|
Ruiru & Juja |
28.1 mn |
20.8 mn |
1.3% |
|
Syokimau |
20.5 mn |
28.7 mn |
2.2% |
|
Average |
18.7 mn |
19.3 mn |
3.2% |
|
Nairobi Middle End Suburbs – High Rise Residential Areas |
|||
|
Kasarani |
82.2 mn |
86.7 mn |
5.2% |
|
Embakasi |
79.2 mn |
83.1 mn |
4.6% |
|
Dagoretti |
85.6 mn |
86.2 mn |
0.7% |
|
Average |
82.3 mn |
85.3 mn |
3.5% |
|
Nairobi High End Suburbs (Low- and High-Rise Areas) |
|||
|
Kileleshwa |
296.2 mn |
308.7 mn |
4.2% |
|
Ridgeways |
87.0 mn |
90.1 mn |
3.6% |
|
Runda |
87.9 mn |
89.3 mn |
1.7% |
|
Kitisuru |
95.0 mn |
96.4 mn |
1.4% |
|
Spring Valley |
176.5 mn |
175.7 mn |
(0.5%) |
|
Karen |
65.7 mn |
63.9 mn |
(2.8%) |
|
Average |
135.7 mn |
137.3 mn |
1.2% |
|
Nairobi Suburbs - Commercial Zones |
|||
|
Westlands |
413.2 mn |
419.7 mn |
1.6% |
|
Riverside |
323.0 mn |
327.4 mn |
1.4% |
|
Upperhill |
458.1 mn |
461.3 mn |
0.7% |
|
Kilimani |
375.9 mn |
377.3 mn |
0.4% |
|
Average |
392.6 mn |
396.4 mn |
1.0% |
Source: Cytonn Research
We maintain a POSITIVE outlook for the land sector in the Nairobi Metropolitan Area (NMA), considering it a dependable investment opportunity that has shown improving performance year on year. Going forward, we expect the sector's performance to be driven by several factors: i) government efforts to streamline land transactions through innovative solutions such as Ardhi Sasa, ii) continued activities by players on both the demand and supply sides, iii) growing demand for land driven by positive demographics, iv) the launch of infrastructure development projects opening up satellite towns for investment opportunities, and v) the continued rollout of the Affordable Housing Program (AHP) by the government, driving further demand for land.
- Infrastructure Sector
The Kenyan governments continues to demonstrate commitment to improve infrastructure around the country by launching and progressing several key projects across the nation, with a special focus on road networks during the year. These road projects continue to enhance connectivity that supports trading activities, draws investments in various sectors and promotes economic growth.
Key highlights during FY’2024;
- President William Ruto launched upgrading of link roads in Suna East Constituency in Migori county during his Nyanza area tour. Upon completion, the roads are expected to further Migori’s business vibrancy, improve livelihoods, and unlock the region’s economic potential. Further, the president launched the construction of Rusinga Ring Road in Homa Bay County. The road will ease the transportation pressures in the area, promote business in the area, and contribute to economic growth by providing improved accessibility and basic services which will attract investments and create jobs for the locals. Please see our Cytonn Monthly August
- The president, oversaw ground breaking for the tarmacking of 65.0-Kilometre-long link roads in Sombogo, Kitutu Chache, and tarmacking of Metembe-Ngenyi/Bobaracho-Ititi/Rioma-Nyaore/Marani-Nyakoe Roads in Marani, Kisii County. For more information, please see our Cytonn weekly #33/2024.
- President William Ruto launched the tarmacking of the 25-kilometre Rukuriri-Kathageri-Kanyaumbora road in Embu County. Upon completion, the road is expected to further Embu’s agricultural vibrancy, improve livelihoods, and unlock the region’s economic potential. For more information, please see our Cytonn weekly #32/2024,
- The Dongo Kundu Bypass was officially opened to the public following its handover by the contractor to the government. This Kshs 40 bn project, undertaken by the China Civil Engineering Construction Corporation (CCECC), began in 2018 and features a 17.5-kilometer road with three bridges. For more information, please see our Cytonn weekly #32/2024, and,
For more notable highlights during the year please see our Cytonn Q1’2024 Markets Review, Cytonn H1’2024 Markets Review and Cytonn Q3’2024 Markets Review reports.
We anticipate the government continued efforts to improve infrastructure in the country more so in road and transport sector in line with its BETA agenda and economic stimulation goal. However, this may be slowed down by the reduction in allocation to state department of roads by 4.4% in the supplementary budget FY’2024/25,to ksh 184.8 bn from the ksh193.4 bn set in the FY’2024/25 budget. Consequently, we anticipate that going forward, there will be a decline in the number of infrastructure projects completed, while the number of stalled infrastructure projects across the country is expected to continue rising due financial constraints. Although the government acknowledges the importance of Public-Private Partnerships (PPPs) in tackling financing challenges, we believe that prioritizing PPPs is fundamental in addressing funding shortfalls. By leveraging the resources and expertise of the private sector, PPPs can support sustainable infrastructure development and stimulate economic growth.
- Industrial Sector
During the year, Kenya’s industrial sector continued to demonstrate slight improvement in performance through government support, including the establishment of Special Economic Zones (SEZs) and Export Processing Zones (EPZs) to attract investments. The Nairobi Metropolitan Area has been on the front line and a major contributor to the Industrial Real Estate Sector accounting for approximately 90.0% of the country’s industrial space known for its high concentration of industrial projects in areas like Nairobi, Kiambu, Machakos and Kajiado; with Nairobi County holding the largest share at 66.0%, largely due to its status as the capital city. Kiambu follows, housing key industrial investments such as Tatu City, Nairobi Gate Industrial Park (NGIP), Tilisi, and Northlands City. For more notable highlights during the year please see our Cytonn Q1’ 2024 Market Review, Cytonn H1’2024 Market Review, and Cytonn Q3’2024 Market Review reports.
- Taita-Taveta County is set to achieve an economic milestone with the approval of a Kshs 11.0 bn steel plant by Devki Steel Mills Limited which is expected to be complete within eight months. The plant is set to be constructed in Manga area, Voi. Narendra Raval of Devki Steel Mills was officially handed a 500-acre parcel of land to commence the construction of the plant. For more information, please see our Cytonn monthly August 2024.
- President William Ruto launched the 2,000-acre Vipingo Free Trade Zone (VFTZ) in Kilifi County, a transformative project expected to create over 50,000 jobs over the next decade. Developed in partnership with Arise Integrated Industrial Platforms, the VFTZ will accommodate over 200 industries spanning across agriculture processing, logistics manufacturing and pharmaceuticals, among other sectors. The project is set to begin in 2025, with already a 600-acre designed masterplan to attract investors and promote industrialization. For more information, please see our Cytonn Weekly #49/2024
- Centum Investment Company Plc was granted a permit to operate a Special Economic Zone (SEZ) in Vipingo, Kilifi County. This designation covers 637.3 Ha of land and positions Kilifi as a leading hub for SEZs, with 10 out of the 39 approved nationwide located in the coastal region. Centum aims to attract industries and subsequently drive economic growth through exports and job creation. The dual initiatives of the VFTZ and Centum’s SEZ highlight the region’s growing importance in the country’s industrial sector. For more information, please see our Cytonn Weekly #49/2024
We expect that the Kenyan industrial Real Estate sector to continue on an upward trajectory mainly driven by: i)Kenya’s continued recognition as a regional hub, hence attracting both local and international investors, ii) support from the government, as evidenced by the establishment of Special Economic Zones (SEZ) and Export Processing Zones (EPZ), iii) increasing demand for quality warehousing spaces due to continued growth in the E-commerce business in the country iv) the growing establishment of data centers in the country, v) increasing demand for cold storage facilities around Nairobi Metropolitan Area (NMA).
- Statutory Reviews
In 2024, the Kenyan government continued to draft and implement various amendments to relevant existing laws and regulations in the Real Estate sector. Additionally, new legislative measures were introduced with the goal of elevating transactional standards within the sector, fostering increased efficiency, ensuring tax compliance, augmenting overall transparency in the industry, and boosting the Affordable Housing Program (AHP).
Key highlight in Q4’2024;
During the week, Nairobi's City Hall announced revised land rates effective January 1, 2025, aiming to align charges with current property values and enhance revenue collection transparency. Under the new structure, annual rates will be determined by land size and value. Plots under 0.1 ha will incur a fee of Kshs 2,560, those between 0.1 and 0.2 ha Kshs 3,200, plots ranging from 0.2 to 0.4 ha Kshs 4,000, and those exceeding 0.4 ha Kshs 4,800. Additionally, residential, commercial, and agricultural properties will be taxed at 0.1% of their land value annually.
To address potential discrepancies, if the new rates are lower than those in 2022, property owners will continue paying the 2022 rates. Conversely, if the new rates exceed double the 2022 amounts, landlords will be charged double the previous rates, as per the 2019 draft valuation roll. Property owners with objections or missing properties from the valuation roll are advised to continue paying the old rates until their cases are resolved by the Valuation Court.
This initiative is part of a broader strategy to boost Nairobi's own-source revenue, with land rates contributing about 25.0% to the county's annual income. Earlier in 2024, Governor Johnson Sakaja announced a 100.0% waiver on interest and penalties for land rates arrears, encouraging property owners to settle outstanding dues.
The county government has also issued ultimatums to owners of undeveloped plots, demanding settlement of dues and commencement of development to prevent land underutilization and revenue loss. These measures reflect City Hall's commitment to ensuring fair taxation and efficient land use, contributing to Nairobi's sustainable urban development.
Key highlights in FY’ 2024;
- The Affordable Housing Bill 2023 was assented to law by President William Ruto on March 19, 2024. Following the assent, the Bill shall become known as the Affordable Housing Act 2024. This enactment follows a rigorous legislative process, spurred by a High Court ruling that declared the previous housing levy unconstitutional, citing administrative and discriminatory flaws. For more information, please see our Cytonn Weekly #12/2024, and,
- The government proposed amendments to cap interest on land rates default. Under the proposed changes to the National Rating Bill of 2022, the interest charged on defaulted rates across the 47 counties will not exceed the prevailing Central Bank of Kenya (CBK) lending rate, that was set at 12.0% during Q1’2024. This is a shift from the current framework, where counties independently determine the interest rates. For more information, please see our Cytonn weekly #46/2024
For more notable highlights during the year please see our Cytonn Q1’2024 Markets Review, Cytonn H1’2024 Markets Review and Cytonn Q3’2024 Markets Review reports.
We expect that the government and the authorities will continue to formulate bills and policies to favour and support Real Estate activities in line with its agenda to provide affordable and quality housing. The policies will be expected in Real Estate Investment Trusts, built environments and hospitality sectors.
- Real Estate Investments Trusts (REITs)
- Centum plans to launch Kenya’s first dollar based I-REIT
Centum Investment Company is set to introduce Kenya's first dollar-denominated Income Real Estate Investment Trust (I-REIT) at its Two Rivers development in Nairobi. This strategic move aims to attract international investors seeking exposure to Kenya's real estate market while mitigating currency risk. The proposed I-REIT will focus on income-generating properties within the Two Rivers precinct, including office spaces, retail outlets, and residential units. By denominating the fund in U.S. dollars, Centum seeks to provide a hedge against the volatility of the Kenyan shilling, offering more stable returns for foreign investors.
This initiative aligns with Centum's broader strategy to diversify its investment portfolio and enhance liquidity. The company has a robust asset base exceeding Kshs 40.0 bn and has been instrumental in significant real estate developments across East Africa. The introduction of a dollar-based I-REIT is expected to set a precedent in Kenya's real estate sector, potentially attracting more foreign direct investment and encouraging other developers to consider similar financial instruments. It also reflects a growing trend among African real estate firms to seek innovative funding solutions that appeal to a global investor base.
Centum's decision comes at a time when the Kenyan real estate market is showing signs of recovery, with increased demand for high-quality commercial and residential properties. The company's developments span over 11,000 acres, creating attractive spaces for homes and businesses in Nairobi and beyond.
By offering a dollar-denominated investment vehicle, Centum aims to provide investors with an opportunity to participate in Kenya's real estate growth while minimizing currency-related uncertainties. This move is anticipated to enhance investor confidence and contribute to the overall development of the country's real estate market.
We expect the dollar based I- REIT to i) increase foreign investments by boosting investors’ confidence against local currency uncertainties, ,ii) dollar-denominated REITs provide an alternative for investors seeking more liquid and globally recognized investment options, iii) the dollar based move is likely to set a precedent for other players in the market, encouraging the development of more innovative and investor-centric financial products, and, iv) the fund could force policy regulatory framework improvement to ensure transparency and investments protection.
- REITs performance
In 2024, Kenya's Real Estate Investment Trusts (REITs) exhibited moderate performance, with notable growth in key financial metrics. The combined Net Operating Income (NOI) of Kenyan REITs increased by 21.4% to Kshs 786.3 mn in the first half of 2024, up from Kshs 647.9 mn in the same period in 2023. This growth was largely driven by a 142.1% rise in the NOI of Acorn I-REIT, which increased to Kshs 309.9 mn from Kshs 128.0 mn in H1’2023. Additionally, Laptrust Imara I-REIT reported a notable NOI growth of 63.0%, reaching Kshs 162.4 mn from Kshs 99.6 mn in the same period in 2023.
Despite these gains, challenges persisted, including limited market liquidity and investor participation. The ILAM Fahari I-REIT, for instance, experienced a lack of significant demand for its shares. Overall, while the sector showed signs of growth, particularly in operational income, it continued to face hurdles in market liquidity and investor confidence, indicating the need for strategic interventions to enhance market participation and performance.
On the Unquoted Securities Platform, Acorn D-REIT and I-REIT traded at Kshs 25.4 and Kshs 22.2 per unit, respectively, as per the last updated data on 31st October 2024. The performance represented a 27.0% and 11.0% gain for the D-REIT and I-REIT, respectively, from the Kshs s 20.0 inception price. The volumes traded for the D-REIT and I-REIT came in at Kshs s 12.3 mn and Kshs 31.6 mn shares, respectively, with a turnover of Kshs 311.5 mn and Kshs 702.7 mn, respectively, since inception in February 2021. Additionally, ILAM Fahari I-REIT traded at Kshs 11.0 per share as of 31st October 2024, representing a 45.0% loss from the Kshs 20.0 inception price. The volume traded to date came in at 138,600 shares for the I-REIT, with a turnover of Kshs 1.5 mn since inception in November 2015.
REITs offer various benefits, such as tax exemptions, diversified portfolios, and stable long-term profits. However, the ongoing decline in the performance of Kenyan REITs and the restructuring of their business portfolios are hindering significant previous investments. Additional general challenges include:
- Insufficient understanding of the investment instrument among investors leading to a slower uptake of REIT products,
- Lengthy approval processes for REIT creation,
- High minimum capital requirements of Kshs 100.0 mn for REIT trustees compared to Kshs 10.0 mn for pension funds Trustees, essentially limiting the licensed REIT Trustee to banks only
- The rigidity of choice between either a D-REIT or and I-REIT forces managers to form two REITs, rather than having one Hybrid REIT that can allocate between development and income earning properties
- Limiting the type of legal entity that can form a REIT to only a trust company, as opposed to allowing other entities such as partnerships, and companies,
- We need to give time before REITS are required to list – they would be allowed to stay private for a few years before the requirement to list given that not all companies maybe comfortable with listing on day one, and,
- Minimum subscription amounts or offer parcels set at Kshs 0.1 mn for D-REITs and Kshs 5.0 mn for restricted I-REITs. The significant capital requirements still make REITs relatively inaccessible to smaller retail investors compared to other investment vehicles like unit trusts or government bonds, all of which continue to limit the performance of Kenyan REITs.
For notable highlights during the year please see our Cytonn Q1’2024 Markets-Review, Cytonn H1’2024 Markets Review, and, Cytonn Q3’ 2024 Markets Review reports. Notable highlights during Q4'2023 include;
- Future Construkt Investment Managers Ltd, a subsidiary of Construkt Africa LLC was granted a REIT Manager license by the Capital Markets Authority-Kenya. It is expected that this significant milestone will position the company to attract institutional capital, aligning with its strategic goal of developing large-scale, green affordable housing projects and subsequently managing its institutional-grade commercial property portfolios. In line with its vision, Construkt Africa had recently launched Teja Spaces, a premier co-working office at Delta Riverside Office Park, offering flexible workspaces and premium amenities marking the first of many planned projects as the company continues its regional expansion. For more information, please see our Cytonn Monthly – November 2024, and,
- Student accommodation developer Acorn Holdings announced that it has fully redeemed its Kshs 5.7 bn green bond before its scheduled maturity on November 8, 2024. The firm announced that it had paid the balance of Kshs 2.7 bn from the paper, alongside the accrued interest, on its five-year medium-term note issued in November 2019. For more information, please see our Cytonn Weekly #43/2024.
Moving forward, we also expect the trend of strategic acquisitions to persist, with REITs actively seeking opportunities to broaden and diversify their portfolios, cater to evolving market demands and also set standards in promoting environmental sustainability such as execution of green bonds by Acorn holding. For more information on the REITs sector in Kenya, please see our Kenya’s REITs H1’2024 report.
Real Estate Performance Summary and Outlook
Below is a summary of the sectorial performance in FY’2024 and investment opportunities:
|
Theme |
Cytonn Report: Thematic Performance and Outlook 2025 |
Outlook |
|
Residential |
· NMA residential sector recorded a slight downtrend in performance, with the average total returns to investors coming in at 5.8%, a 0.3%-point decline from 6.1% recorded in FY’2023. The performance was attributed to a decrease in the residential average y/y price appreciation which came in at 0.4% in FY’2024, 0.2%-points lower than the 0.6% appreciation recorded in FY’2023, driven by slowed property transactions during the year. |
Neutral |
|
· The average total returns to detached units’ investors came in at 5.2%, 0.6% lower than the 5.8% recorded in FY’2023. For apartments, the average total returns to apartments’ investors came in at 6.4%, recording a 0.2%-points increase from the 6.2% recorded during FY’2023 · Our outlook for the NMA residential sector remains NEUTRAL, as we foresee increased activity from in the industry supported by: ; i)ongoing residential developments under the Affordable Housing Agenda, aiming to reduce the housing deficit in the country currently estimated at 80.0%, ii) increased investment from local and international investors in the housing sector, iii) favorable demographics in the country, shown by high population and urbanization rates of 3.7% p.a and 2.0% p.a, respectively, leading to higher demand for housing units. However, challenges such as rising construction costs, strain on infrastructure development, and limited access to financing will continue to restrict the optimal performance of the residential sector. |
||
|
Commercial Office |
· In FY’2024, average asking rents per SQFT in the NMA increased by 1.7 % to Kshs 105 from Kshs 103 in FY’2024. · In FY’2024, commercial office occupancy a slight improvement in performance by 0.4% points to 80.7% from 80.3% recorded in FY’2023. The average rental yields showed resilience with 0.1%-points increase, coming at 7.8% in FY’2024 from 7.7% in FY’2023. This is attributable to an increase in rental prices by 1.7% to Ksh 105 from Ksh 103 during the period under review. |
Neutral |
|
· We maintain a NEUTRAL outlook on the Nairobi Metropolitan Area (NMA) commercial office sector, impacted by several key dynamics: i) the increasing presence of multinational companies in Kenya is likely to drive up occupancy levels, ii) co-working spaces are gaining in popularity in the region. However, the sector continues to face challenges due to a significant oversupply of office space, currently standing at 5.8 mn SQFT. Despite these challenges, there are attractive investment opportunities in areas such as Westlands, Gigiri, and Kilimani, which offer returns that exceed the market average |
||
|
Retail |
· The average rental yield for the NMA retail sector improved by 0.1% points to 8.4% in FY’2024, from 8.3% in FY’2023, as a result of improved asking rents and occupancy rates and increased retail activities within the region |
Neutral |
|
· We maintain a NEUTRAL outlook on the retail sector’s performance for 2024, influenced by several factors; i) continued expansion by local and international retailers, driven by evolving consumer preferences and market trends, ii) infrastructure improvements, including ongoing road and railway projects, are set to increase accessibility to key retail zones, unlocking further investment opportunities, and iii) favorable demographic trends, such as a growing urban population, will sustain demand for retail goods and services. However, growth could face challenges from: i) oversupply issues, with around 3.0 n SQFT of retail space available in Nairobi and an additional 1.7 mn SQFT countrywide, leading to low occupancy rates and rental yields, ii) e-commerce adoption, increasingly shifting retail demand online, pushing brick-and-mortar outlets to adapt, and iii) limited financing options for retail developments, along with high costs, are likely to hinder investment, especially for small and medium-sized enterprises (SMEs) that need to adopt technology to stay competitive · In terms of the sub markets performance, investment opportunity lies in Kilimani, Karen, and Westlands, which offer higher returns compared to the market average. |
||
|
Hospitality |
· In terms of international arrivals, Kenya National Bureau of Statistics’ Leading Economic Indicators – September 2024 report highlighted that arrivals through Jomo Kenyatta International Airport (JKIA) and Moi International Airport (MIA) registered an increase of 8.5% to 489,831 visitors in Q3’ 2024 from 451,441 visitors recorded in Q3’ 2023. · According to our Nairobi Metropolitan Area Serviced Apartments Report 2024 the overall performance of serviced apartments improved on y/y, with the occupancy rates coming in at 72.2% in 2024, a 5.8%-points increase from the 66.4% recorded in 2023. The average monthly charges for 2024 increased by 4% to Kshs 3155 per SQM from 3,044 recorded in 2023. Consequently, the average rental yield increased to 7.3% in 2024, a 0.5%- points increase from the 6.8% recorded in 2023. · We maintain a positive outlook for the hospitality sector in the coming quarter, supported by several key drivers: i) Aggressive marketing campaigns promoting Kenya’s tourism, expected to boost tourist arrivals and improve occupancy rates at hospitality venues, ii) International recognition of Kenya’s tourism industry, enhancing its status as a leading tourist destination and drawing more global visitors, iii) Strategic partnerships within the tourism sector, fostering innovation and collaboration to capitalize on new opportunities, iv) Events and initiatives aimed at increasing tourism activity and improving guest experiences. However, while the sector demonstrated resilience in its overall performance in 2024, the outlook remains cautiously optimistic. Kenya continues to face significant competition from neighbouring markets, such as Rwanda, which employs aggressive promotional strategies, alongside Zanzibar, Tanzania, and South Africa. These regions actively position themselves as attractive alternatives, challenging Kenya's market share in the region.
|
Positive |
|
Land |
· The land sector in Nairobi Metropolitan Area (NMA) recorded a price appreciation of 2.7% to Kshs 130.9 mn from 128.9 mn. · We maintain a POSITIVE outlook for the land sector in the Nairobi Metropolitan Area (NMA), considering it a dependable investment opportunity that has shown improving performance year on year. Going forward, we expect the sector's performance to be driven by several factors: i) government efforts to streamline land transactions through innovative solutions such as Ardhi Sasa, ii) continued activities by players on both the demand and supply sides, iii) growing demand for land driven by positive demographics, iv) the launch of infrastructure development projects opening up satellite towns for investment opportunities, and v) the continued rollout of the Affordable Housing Program (AHP) by the government, driving further demand for land. |
Positive |
|
Mixed Use Development |
· MUDs recorded an average rental yield of 8.6% in 2024,1.5% points higher than the respective single-use themes which recorded an average rental yield of 7.1% in a similar period in 2023. The relatively better performance was mainly attributable to changing client preferences and MUDs' attractiveness driven by the diversity in amenities and social offerings they provide to clients. |
Neutral |
|
· Our overall outlook for Mixed Use Developments is NEUTRAL supported by the remarkable returns compared to single-use themes, changing client preferences, and MUDs attractiveness driven by the diversity in amenities and social offerings they provide to clients. However, the existing oversupply of the NMA office market at 5.8 mn SQFT, and 3.0 mn SQFT in the NMA retail market, is expected to weigh down the performance. Karen, Limuru Road, and Westlands nodes provide the best investment opportunities, with the areas providing the highest average MUD yields of 10.6%, 10.0%, and 9.4% respectively, compared to the market average of 8.6%.
|
Disclaimer: The views expressed in this publication are those of the writers where particulars are not warranted. This publication, which is in compliance with Section 2 of the Capital Markets Authority Act Cap 485A, is meant for general information only and is not a warranty, representation, advice or solicitation of any nature. Readers are advised in all circumstances to seek the advice of a registered investment advisor.

- Talk to us
- Kenya
- P.O Box 20695 - 00200, Nairobi, Kenya
- Cell +254709101200
- Tel +254709101200
- WhatsApp +254741676635
- United States
- +254709101200
- DOWNLOAD OUR APP
-


- Kenya
- 8th Floor, Pinetree Plaza, Kaburu Drive, Ngong Road, Nairobi, Kenya
- USA
- Suite 1150, 1775 Eye Street NW, USA, Washington DC 20006, USA
- Investments
- High Yield
- Private Equity
- Real Estate
- Real Estate
- RiverRun Estates
- Cytonn Towers
- The Ridge
- Taraji Heights
- The Alma